
Garden Way Yoga Center
Executive Summary
Hatha Yoga is an ancient discipline that explores, develops, and integrates the body, mind, and spirit. Yoga systematically stretches and strengthens muscles throughout the body, increases circulation to internal organs and glands, quiets the nervous system, and improves concentration. This ancient system of self-care brings vitality, health, deep relaxation, and peace of mind.
The style of Hatha Yoga taught is the Anusara method. Anusara Yoga is a new style of yoga that is heart-oriented, spiritually inspiring, yet grounded in a deep knowledge of optimal body alignment in the poses. Instructors encourage students to listen to their body, respect its wisdom, and to progress at their own pace.
Deep relaxation is taught in each class after completion of the postures. The intention of the instructors at Garden Way Yoga Center (GWYC) is to assist students in the development of physical, mental, and spiritual well-being: a truly priceless health advantage.
The Garden Way Yoga Center offers 8 eight-week sessions of classes per year. Courses offered include Anusara-style Hatha Yoga plus workshops in related topics. The Yoga Center features well-trained, professional instructors, progressive teaching methods, a non-competitive and encouraging atmosphere, and a beautiful light-filled facility.
The Garden Way Yoga Center also has a boutique that will sell workshop clothing and yoga training aides.
Jill Gordon, Ph.D., founder of The Garden Way Yoga Center, is one of Anusara Yoga’s leading teachers. She conducts workshops and teacher trainings nationally and internationally, and has previously established yoga training centers in Santa Barbara, CA; Denver, CO; and Charlottesville, VA. She co-founded and co-developed the Four Winds Yoga Center in Portland, OR, which offered instruction to nearly 1,000 students per week. She has been a yoga practitioner since 1985 and a meditator since 1989. Jill is a certified Anusara instructor and one of the few Designated Teacher Trainers in the Anusara style of Hatha Yoga. She is registered with the national Yoga Alliance at the highest 500-hour level.
1.1 Objectives
The objectives of Garden Way Yoga Center are the following:
- Acquire 300 customers by the end of the first year of operation.
- Achieve sales in excess of $60,000 from the boutique.
- Increase customer base by 25% by the end of the second year of operation.
- Increase sales by 15% by the end of the second year of operation.
1.2 Mission
The mission of Garden Way Yoga Center is to give the student, whether a beginner or advanced a place to practice Anusara. It is our intention to keep the teaching of Anusara as close to the way we have been taught as possible. It is incumbent for the teacher to always act responsibly and with the student’s interest in mind. No matter what we learn or from whom we learn the real and only teacher is within.
Company Summary
The Garden Way Yoga Center offers Anusara-style Hatha Yoga plus workshops in related yoga topics. The Yoga Center features well-trained, professional instructors, progressive teaching methods, a non-competitive and encouraging atmosphere, and a beautiful light-filled facility.
GWYC will be located in the commercial downtown section of Monroe, in the renovated Millman Center. GWYC’s goal is to build a large base of yoga students from the thousands of office workers that are employed downtown.
Besides the training, the Garden Way Yoga Center also has a boutique that will sell workshop clothing and yoga training aides.
GWYC will operate as a sole proprietorship.
2.1 Company Ownership
The Garden Way Yoga Center is owned by Jill Gordon.
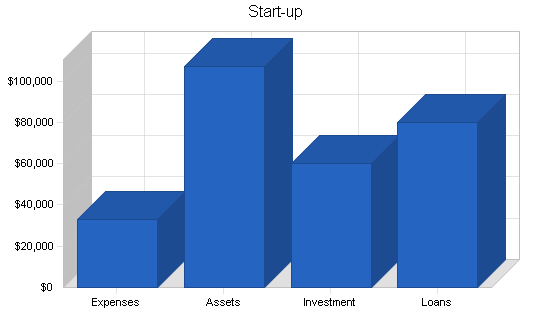
2.2 Start-up Summary
The start-up expenses for the The Garden Way Yoga Center are focused primarily on workshop setup and equipment, and inventory for the boutique and bookstore. Jill will invest $60,000. In addition, GWYC will secure a $80,000 long-term loan.
| Start-up | |
| Requirements | |
| Start-up Expenses | |
| Legal | $1,000 |
| Stationery etc. | $100 |
| Brochures | $8,000 |
| Insurance | $1,000 |
| Rent | $3,000 |
| Expensed Equipment | $20,000 |
| Total Start-up Expenses | $33,100 |
| Start-up Assets | |
| Cash Required | $66,900 |
| Start-up Inventory | $10,000 |
| Other Current Assets | $0 |
| Long-term Assets | $30,000 |
| Total Assets | $106,900 |
| Total Requirements | $140,000 |
| Start-up Funding | |
| Start-up Expenses to Fund | $33,100 |
| Start-up Assets to Fund | $106,900 |
| Total Funding Required | $140,000 |
| Assets | |
| Non-cash Assets from Start-up | $40,000 |
| Cash Requirements from Start-up | $66,900 |
| Additional Cash Raised | $0 |
| Cash Balance on Starting Date | $66,900 |
| Total Assets | $106,900 |
| Liabilities and Capital | |
| Liabilities | |
| Current Borrowing | $0 |
| Long-term Liabilities | $80,000 |
| Accounts Payable (Outstanding Bills) | $0 |
| Other Current Liabilities (interest-free) | $0 |
| Total Liabilities | $80,000 |
| Capital | |
| Planned Investment | |
| Jill Gordon | $60,000 |
| Other | $0 |
| Additional Investment Requirement | $0 |
| Total Planned Investment | $60,000 |
| Loss at Start-up (Start-up Expenses) | ($33,100) |
| Total Capital | $26,900 |
| Total Capital and Liabilities | $106,900 |
| Total Funding | $140,000 |
2.3 Company Locations and Facilities
The Garden Way Yoga Center is located in downtown Monroe, in the renovated Millman Center. The facility is quickly accessible to the over 50,000 urban professionals that GWYC considers potential members.
With five large workshop rooms, men and women’s dressing rooms, and a boutique, GWYC offers plenty of floor space for multiple classes being conducted simultaneously. In addition, parking is not a problem. GWYC is within easy walking distance from any building in the downtown area. If a customer does decide to drive, the Millman Center has parking space for up to 2,000 vehicles.
Products and Services
The Garden Way Yoga Center’s services and products are as follows:
Services
- Yoga 1/Beginner is an introductory class for students who are new to Yoga. This class focuses on poses to stretch and strengthen the legs, back, and shoulders. Emphasis is given to the basic alignment of the standing poses.
- Fundamentals of Vinyasa Yoga will prepare students for a vigorous flow style of yoga (Vinyasa) that synchronizes breath with movement. It will offer a balance of strength, flexibility, and endurance to challenge the fitness enthusiast. The course will begin with instruction on the alignment of the poses and move toward linking all the poses together in a continuous flow by the end of the session.
- Gentle Yoga is designed for those who prefer a class less vigorous than Yoga 1. It includes gentle stretches and breathing as well as simple movements designed to systematically increase the range of motion of every major joint and increase energy. This class is ideal for students with chronic symptoms such as muscle/joint pain, stiffness, weakness, or fatigue.
- Yoga 1-2/Continuing Beginner is a continuation class for Yoga 1. The emphasis of this course is on refining and building endurance in Yoga 1 and Yoga 2 standing poses. It does not include the shoulder stand. The basic Anusara Yoga principles of alignment are presented. This class is suitable for students who have practiced other styles of yoga, but it is not suitable for those who have never studied yoga before.
- Yoga 2/Intermediate focuses on refining the standing poses and learning basic sitting postures, simple back bending poses, and the shoulder stand using the Anusara Yoga principles of alignment. It is recommended that students complete both Yoga 1 and Yoga 1-2 before taking Yoga 2.
- Yoga 3/Advanced continues with refinements to poses studied in Yoga 2 and introduces full arm balance (handstand), headstand, and forearm balance. Additional back bend poses are also included. Regular yoga practice outside of class is strongly encouraged. Permission of the instructor is required.
Products
- Workshop Clothing: Shirts, shorts, athletic bras and pants.
- Workshop Equipment: Balancing balls, belts, weights, and mats.
- Yoga training aides: Video tapes, instructional manuals, inspirational books.
Market Analysis Summary
Downtown Monroe has emerged from the recent recession to regain it position as the heart of the city. The growth has been fueled by the increased employment in the city’s high tech companies. Currently, 50,000 professional work in downtown Monroe. We believe that a yoga center can be very attractive to our customers if we create a program that fits the time constraints of their jobs. Our location is within easy walking distance from most office buildings downtown. We plan to offer our members a program that will allow them to use their lunch hours to attend workshops.

Jill Gordon will be a positive draw for those who have some experience with yoga instruction. The key to the success of GWYC will be attracting new people to yoga instruction.
4.1 Market Segmentation
The Garden Way Yoga Center will focus on two customer groups:
Middle Income Urban Professionals: This group is the core segment of potential students of GWYC. Their demographic characteristics are the following:
- Ages: 26-40.
- Sex: 30% male, 70% female.
- Family Income: $30,000-$50,000.
- Health/Lifestyle Issues: Active individuals that are focused on healthy food and dieting. Over 70% of this group are members of gyms. Approximately, 40% of potential customers have taken yoga classes before.
- Social Pattern: Will more likely attend as part of group.
- Center’s selling point: Close to work. The session lowers stress. Can be attended with workmates as group activity.
Upper Income: The upper income customer is a secondary target group. Their demographic characteristics are the following:
- Ages: 40-60.
- Sex: 30% male, 70% female.
- Family Income: $60,000+.
- Health/Lifestyle Issues: Active individuals that are focused on healthy food and dieting. Over 90% of this group are members of gyms.
- Social Pattern: Will more likely attend alone.
- Center’s selling point: Close to work. The session lowers stress.

| Market Analysis | |||||||
| Year 1 | Year 2 | Year 3 | Year 4 | Year 5 | |||
| Potential Customers | Growth | CAGR | |||||
| Middle-Income | 15% | 15,000 | 17,250 | 19,838 | 22,814 | 26,236 | 15.00% |
| High-Income | 9% | 1,500 | 1,635 | 1,782 | 1,942 | 2,117 | 9.00% |
| Total | 14.49% | 16,500 | 18,885 | 21,620 | 24,756 | 28,353 | 14.49% |
4.2 Target Market Segment Strategy
Everything GWYC does must be tailored to work within the time constraints of the target customer. Yoga classes can be no longer than 45 minutes and must be scheduled to fit the break and rolling lunch schedules that exist in the downtown businesses. The focus of the instruction will also have to be tailored to a clientele that will be seeking maximum relief from the pressure of work and then returning to the workplace. If GWYC can create a noticeable difference in the customers’ sense of well-being, then the customer will come to depend on instruction as a escape during the day. These kinds of experiences will create a tremendous word of mouth and bring in more first time students.
4.3 Service Business Analysis
Typically, yoga centers are located away from the city’s commercial/business center. GWYCs are less focus on serving a large number of beginners and is more focused on obtaining long term students. Students are attracted to a specific type of yoga and the reputation and skills of GWYC’s leader.
4.3.1 Competition and Buying Patterns
“Stars do it. Sports do it. Judges in the highest courts do it. Let’s do it: that yoga thing. A path to enlightenment that winds back 5,000 years in its native India, yoga has suddenly become so hot, so cool, so very this minute. It’s the exercise cum meditation for the new millennium, one that doesn’t so much pump you up as bliss you out. Yoga now straddles the continent – from Hollywood, where $20 million-a-picture actors queue for a session with their guru du jour, to Washington, where, in the gym of the Supreme Court, Justice Sandra Day O’Connor and 15 others faithfully take their class each Tuesday morning. “
– The Power Of Yoga, Time.com April 15, 2001
Yoga is a growing trend. It was popular in the seventies and has come back full force into vogue in the 21st century. Movie stars such as Madonna, Meg Ryan, Julia Roberts and Sting are advocates of the discipline.
The key to competition within the yoga business is the quality of the instructor. There are a number of instructors around Monroe who are well respected, and Garden Way Yoga will strive to attract these teachers to its facility. The location, quality and ambiance of the facility is the real competitive advantage for Garden Way. Because it has the best most attractive facility in town teachers will want to teach here and clients will want to “get away” here. Garden Way Yoga Center will focus of presenting GWYC as the perfect place to learn yoga skills that will improve the student physically and reduce the daily stress of the work world.
Other “schools” in the area will be able to match the quality of instruction, but are often held in church halls, community centers, fitness centers, etc. and do not have the relaxing ambiance that is so important to the discipline.
Strategy and Implementation Summary
The Garden Way Yoga Center will market through the numerous downtown fitness clubs, beauty salons, tanning salons and boutiques. The Garden Way Yoga Center will offer the free open workshop for beginners. In addition, GWYC will initiate a program that will give 25% session discount to members who successfully recruit new members to GWYC.
5.1 Competitive Edge
The competitive advantage of Garden Way Yoga Center is location and the quality and ambiance of the facility. Based in the heart of Monroe, we offer our members excellent instruction that fits into their busy day, providing them a sanctuary from daily pressure. Our facility is a perfect compliment to our brand image.
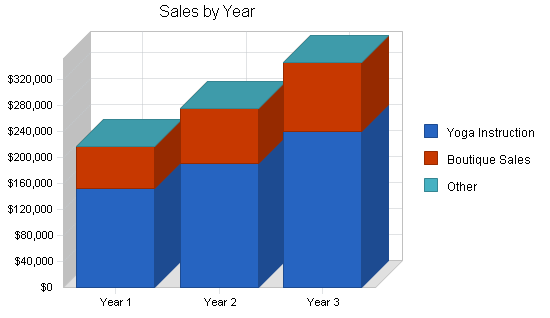
5.2 Sales Forecast
The sales forecast outlines sales of instruction time as well as sales of products through the boutique located in the facility. Instructions is sold in the following three ways:
- Private lessons;
- Eight week courses;
- Drop-in sessions.
The boutique will sell clothing, books, posters, books, DVDs and videos, mats, and other props for yoga. In addition it will sell healthy pre-bottled drinks and healthy energy food. In the beginning all food will be pre-packaged, since Jill does not have the facility or expertise to run a cafe facility. If the facility becomes more of a destination, she will research adding a cafe.
The Garden Way Yoga Center anticipates that sales will be slow for the first and second month of operation. After that point, sales will increase as membership grows.
The following is the sales forecast for three years.

| Sales Forecast | |||
| Year 1 | Year 2 | Year 3 | |
| Sales | |||
| Yoga Instruction | $152,000 | $190,000 | $240,000 |
| Boutique Sales | $64,000 | $85,000 | $106,000 |
| Other | $0 | $0 | $0 |
| Total Sales | $216,000 | $275,000 | $346,000 |
| Direct Cost of Sales | Year 1 | Year 2 | Year 3 |
| Yoga Instruction | $0 | $0 | $0 |
| Boutique Sales | $20,150 | $26,000 | $32,000 |
| Other | $0 | $0 | $0 |
| Subtotal Direct Cost of Sales | $20,150 | $26,000 | $32,000 |
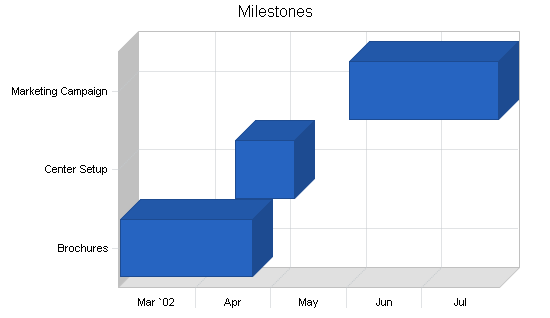
5.3 Milestones
The accompanying table lists important program milestones, with dates and managers in charge, and budgets for each. The milestone schedule indicates our emphasis on planning for implementation.
What the table doesn’t show is the commitment behind it. Our business plan includes complete provisions for plan-vs.-actual analysis, and we will be holding follow-up meetings every month to discuss the variance and course corrections.
| Milestones | |||||
| Milestone | Start Date | End Date | Budget | Manager | Department |
| Brochures | 3/1/2002 | 4/23/2002 | $8,000 | Jill Gordon | Marketing |
| Center Setup | 4/16/2002 | 5/10/2002 | $20,000 | Jill Gordon | Department |
| Marketing Campaign | 6/1/2002 | 7/31/2002 | $5,000 | Jill Gordon | Department |
| Totals | $33,000 | ||||
5.4 Marketing Strategy
The key to the marketing strategy is to get the downtown lunch traffic off the streets and into GWYC. GWYC will offer free instruction and will have refreshment available for visitors. The instruction segments will be 45 minutes and focus on exercises that will produce the maximum release of tension.
Personnel Plan
Jill Gordon, Ph.D., founder of The Garden Way Yoga Center, is one of Anusara Yoga’s leading teachers. She conducts workshops and teacher trainings nationally and internationally.
In addition she has excellent business experience having previously established yoga training centers in Santa Barbara, CA; Denver, CO; and Charlottesville, VA. She co-founded and co-developed the Four Winds Yoga Center in Portland, OR, which offers instruction to nearly 1,000 students per week. She has been a yoga practitioner since 1985 and a meditator since 1989.
Jill is a certified Anusara instructor and one of the few Designated Teacher Trainers in the Anusara style of Hatha Yoga. She is registered with the national Yoga Alliance at the highest 500-hour level.
Jill was the business manager Four Winds Yoga Center. GWYC started with four employee and 20 students. Within three years, GWYC had a staff of 25 and over 1,000 students. She was an effective manager of the growth of Four Winds Yoga Center.
The Garden Way Yoga Center’s personnel will be the following:
- Jill Gordon, director;
- Teachers (5 half-time);
- Boutique Staff (1).
| Personnel Plan | |||
| Year 1 | Year 2 | Year 3 | |
| Jill Gordon | $36,000 | $36,000 | $39,000 |
| Teachers (5) | $54,000 | $65,000 | $75,000 |
| Boutique Staff | $19,200 | $22,000 | $25,000 |
| Total People | 7 | 7 | 7 |
| Total Payroll | $109,200 | $123,000 | $139,000 |
Financial Plan
The following is the financial plan for Garden Way Yoga Center.
7.1 Break-even Analysis
The monthly break-even point is $14,492.

| Break-even Analysis | |
| Monthly Revenue Break-even | $14,492 |
| Assumptions: | |
| Average Percent Variable Cost | 9% |
| Estimated Monthly Fixed Cost | $13,140 |
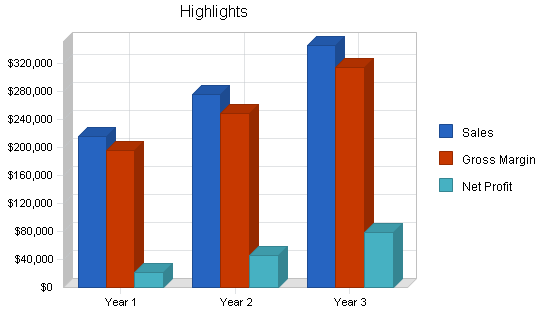
7.2 Projected Profit and Loss
The following table and charts highlight the projected profit and loss for three years.


| Pro Forma Profit and Loss | |||
| Year 1 | Year 2 | Year 3 | |
| Sales | $216,000 | $275,000 | $346,000 |
| Direct Cost of Sales | $20,150 | $26,000 | $32,000 |
| Other Production Expenses | $0 | $0 | $0 |
| Total Cost of Sales | $20,150 | $26,000 | $32,000 |
| Gross Margin | $195,850 | $249,000 | $314,000 |
| Gross Margin % | 90.67% | 90.55% | 90.75% |
| Expenses | |||
| Payroll | $109,200 | $123,000 | $139,000 |
| Sales and Marketing and Other Expenses | $24,000 | $26,000 | $28,000 |
| Depreciation | $2,400 | $2,400 | $2,400 |
| Utilities | $3,300 | $3,300 | $3,300 |
| Insurance | $2,400 | $2,400 | $2,400 |
| Payroll Taxes | $16,380 | $18,450 | $20,850 |
| Other | $0 | $0 | $0 |
| Total Operating Expenses | $157,680 | $175,550 | $195,950 |
| Profit Before Interest and Taxes | $38,170 | $73,450 | $118,050 |
| EBITDA | $40,570 | $75,850 | $120,450 |
| Interest Expense | $7,721 | $7,226 | $6,710 |
| Taxes Incurred | $9,135 | $19,867 | $33,402 |
| Net Profit | $21,315 | $46,357 | $77,938 |
| Net Profit/Sales | 9.87% | 16.86% | 22.53% |
7.3 Projected Cash Flow
The following table and chart highlights the projected cash flow for three years.

| Pro Forma Cash Flow | |||
| Year 1 | Year 2 | Year 3 | |
| Cash Received | |||
| Cash from Operations | |||
| Cash Sales | $216,000 | $275,000 | $346,000 |
| Subtotal Cash from Operations | $216,000 | $275,000 | $346,000 |
| Additional Cash Received | |||
| Sales Tax, VAT, HST/GST Received | $0 | $0 | $0 |
| New Current Borrowing | $0 | $0 | $0 |
| New Other Liabilities (interest-free) | $0 | $0 | $0 |
| New Long-term Liabilities | $0 | $0 | $0 |
| Sales of Other Current Assets | $0 | $0 | $0 |
| Sales of Long-term Assets | $0 | $0 | $0 |
| New Investment Received | $0 | $0 | $0 |
| Subtotal Cash Received | $216,000 | $275,000 | $346,000 |
| Expenditures | Year 1 | Year 2 | Year 3 |
| Expenditures from Operations | |||
| Cash Spending | $109,200 | $123,000 | $139,000 |
| Bill Payments | $65,490 | $105,836 | $125,554 |
| Subtotal Spent on Operations | $174,690 | $228,836 | $264,554 |
| Additional Cash Spent | |||
| Sales Tax, VAT, HST/GST Paid Out | $0 | $0 | $0 |
| Principal Repayment of Current Borrowing | $0 | $0 | $0 |
| Other Liabilities Principal Repayment | $0 | $0 | $0 |
| Long-term Liabilities Principal Repayment | $5,160 | $5,160 | $5,160 |
| Purchase Other Current Assets | $0 | $0 | $0 |
| Purchase Long-term Assets | $0 | $0 | $0 |
| Dividends | $0 | $0 | $0 |
| Subtotal Cash Spent | $179,850 | $233,996 | $269,714 |
| Net Cash Flow | $36,150 | $41,004 | $76,286 |
| Cash Balance | $103,050 | $144,054 | $220,340 |
7.4 Projected Balance Sheet
The following table highlights the projected balance sheet for three years.
| Pro Forma Balance Sheet | |||
| Year 1 | Year 2 | Year 3 | |
| Assets | |||
| Current Assets | |||
| Cash | $103,050 | $144,054 | $220,340 |
| Inventory | $2,750 | $3,548 | $4,367 |
| Other Current Assets | $0 | $0 | $0 |
| Total Current Assets | $105,800 | $147,603 | $224,707 |
| Long-term Assets | |||
| Long-term Assets | $30,000 | $30,000 | $30,000 |
| Accumulated Depreciation | $2,400 | $4,800 | $7,200 |
| Total Long-term Assets | $27,600 | $25,200 | $22,800 |
| Total Assets | $133,400 | $172,803 | $247,507 |
| Liabilities and Capital | Year 1 | Year 2 | Year 3 |
| Current Liabilities | |||
| Accounts Payable | $10,345 | $8,551 | $10,478 |
| Current Borrowing | $0 | $0 | $0 |
| Other Current Liabilities | $0 | $0 | $0 |
| Subtotal Current Liabilities | $10,345 | $8,551 | $10,478 |
| Long-term Liabilities | $74,840 | $69,680 | $64,520 |
| Total Liabilities | $85,185 | $78,231 | $74,998 |
| Paid-in Capital | $60,000 | $60,000 | $60,000 |
| Retained Earnings | ($33,100) | ($11,785) | $34,571 |
| Earnings | $21,315 | $46,357 | $77,938 |
| Total Capital | $48,215 | $94,571 | $172,509 |
| Total Liabilities and Capital | $133,400 | $172,803 | $247,507 |
| Net Worth | $48,215 | $94,571 | $172,509 |
7.5 Business Ratios
Business ratios for the years of this plan are shown below. Industry profile ratios based on the Standard Industrial Classification (SIC) code 7997, Membership Sport and Recreation Club, are shown for comparison.
| Ratio Analysis | ||||
| Year 1 | Year 2 | Year 3 | Industry Profile | |
| Sales Growth | 0.00% | 27.31% | 25.82% | 15.20% |
| Percent of Total Assets | ||||
| Inventory | 2.06% | 2.05% | 1.76% | 4.00% |
| Other Current Assets | 0.00% | 0.00% | 0.00% | 31.80% |
| Total Current Assets | 79.31% | 85.42% | 90.79% | 40.90% |
| Long-term Assets | 20.69% | 14.58% | 9.21% | 59.10% |
| Total Assets | 100.00% | 100.00% | 100.00% | 100.00% |
| Current Liabilities | 7.76% | 4.95% | 4.23% | 31.60% |
| Long-term Liabilities | 56.10% | 40.32% | 26.07% | 28.00% |
| Total Liabilities | 63.86% | 45.27% | 30.30% | 59.60% |
| Net Worth | 36.14% | 54.73% | 69.70% | 40.40% |
| Percent of Sales | ||||
| Sales | 100.00% | 100.00% | 100.00% | 100.00% |
| Gross Margin | 90.67% | 90.55% | 90.75% | 0.00% |
| Selling, General & Administrative Expenses | 80.80% | 73.69% | 68.23% | 72.30% |
| Advertising Expenses | 2.78% | 2.91% | 2.89% | 2.70% |
| Profit Before Interest and Taxes | 17.67% | 26.71% | 34.12% | 2.60% |
| Main Ratios | ||||
| Current | 10.23 | 17.26 | 21.45 | 1.23 |
| Quick | 9.96 | 16.85 | 21.03 | 0.83 |
| Total Debt to Total Assets | 63.86% | 45.27% | 30.30% | 59.60% |
| Pre-tax Return on Net Worth | 63.15% | 70.03% | 64.54% | 2.80% |
| Pre-tax Return on Assets | 22.83% | 38.32% | 44.98% | 6.90% |
| Additional Ratios | Year 1 | Year 2 | Year 3 | |
| Net Profit Margin | 9.87% | 16.86% | 22.53% | n.a |
| Return on Equity | 44.21% | 49.02% | 45.18% | n.a |
| Activity Ratios | ||||
| Inventory Turnover | 3.95 | 8.26 | 8.09 | n.a |
| Accounts Payable Turnover | 7.33 | 12.17 | 12.17 | n.a |
| Payment Days | 27 | 33 | 27 | n.a |
| Total Asset Turnover | 1.62 | 1.59 | 1.40 | n.a |
| Debt Ratios | ||||
| Debt to Net Worth | 1.77 | 0.83 | 0.43 | n.a |
| Current Liab. to Liab. | 0.12 | 0.11 | 0.14 | n.a |
| Liquidity Ratios | ||||
| Net Working Capital | $95,455 | $139,051 | $214,229 | n.a |
| Interest Coverage | 4.94 | 10.16 | 17.59 | n.a |
| Additional Ratios | ||||
| Assets to Sales | 0.62 | 0.63 | 0.72 | n.a |
| Current Debt/Total Assets | 8% | 5% | 4% | n.a |
| Acid Test | 9.96 | 16.85 | 21.03 | n.a |
| Sales/Net Worth | 4.48 | 2.91 | 2.01 | n.a |
| Dividend Payout | 0.00 | 0.00 | 0.00 | n.a |
Appendix
| Sales Forecast | |||||||||||||
| Month 1 | Month 2 | Month 3 | Month 4 | Month 5 | Month 6 | Month 7 | Month 8 | Month 9 | Month 10 | Month 11 | Month 12 | ||
| Sales | |||||||||||||
| Yoga Instruction | 0% | $0 | $0 | $7,000 | $9,000 | $14,000 | $16,000 | $18,000 | $20,000 | $15,000 | $15,000 | $18,000 | $20,000 |
| Boutique Sales | 0% | $0 | $0 | $3,000 | $4,000 | $5,000 | $6,000 | $8,000 | $8,000 | $6,000 | $7,000 | $8,000 | $9,000 |
| Other | 0% | $0 | $0 | $0 | $0 | $0 | $0 | $0 | $0 | $0 | $0 | $0 | $0 |
| Total Sales | $0 | $0 | $10,000 | $13,000 | $19,000 | $22,000 | $26,000 | $28,000 | $21,000 | $22,000 | $26,000 | $29,000 | |
| Direct Cost of Sales | Month 1 | Month 2 | Month 3 | Month 4 | Month 5 | Month 6 | Month 7 | Month 8 | Month 9 | Month 10 | Month 11 | Month 12 | |
| Yoga Instruction | $0 | $0 | $0 | $0 | $0 | $0 | $0 | $0 | $0 | $0 | $0 | $0 | |
| Boutique Sales | $0 | $0 | $1,000 | $1,500 | $1,750 | $2,000 | $2,400 | $2,400 | $2,000 | $2,200 | $2,400 | $2,500 | |
| Other | $0 | $0 | $0 | $0 | $0 | $0 | $0 | $0 | $0 | $0 | $0 | $0 | |
| Subtotal Direct Cost of Sales | $0 | $0 | $1,000 | $1,500 | $1,750 | $2,000 | $2,400 | $2,400 | $2,000 | $2,200 | $2,400 | $2,500 | |
| Personnel Plan | |||||||||||||
| Month 1 | Month 2 | Month 3 | Month 4 | Month 5 | Month 6 | Month 7 | Month 8 | Month 9 | Month 10 | Month 11 | Month 12 | ||
| Jill Gordon | 0% | $3,000 | $3,000 | $3,000 | $3,000 | $3,000 | $3,000 | $3,000 | $3,000 | $3,000 | $3,000 | $3,000 | $3,000 |
| Teachers (5) | 0% | $4,500 | $4,500 | $4,500 | $4,500 | $4,500 | $4,500 | $4,500 | $4,500 | $4,500 | $4,500 | $4,500 | $4,500 |
| Boutique Staff | 0% | $1,600 | $1,600 | $1,600 | $1,600 | $1,600 | $1,600 | $1,600 | $1,600 | $1,600 | $1,600 | $1,600 | $1,600 |
| Total People | 7 | 7 | 7 | 7 | 7 | 7 | 7 | 7 | 7 | 7 | 7 | 7 | |
| Total Payroll | $9,100 | $9,100 | $9,100 | $9,100 | $9,100 | $9,100 | $9,100 | $9,100 | $9,100 | $9,100 | $9,100 | $9,100 | |
| General Assumptions | |||||||||||||
| Month 1 | Month 2 | Month 3 | Month 4 | Month 5 | Month 6 | Month 7 | Month 8 | Month 9 | Month 10 | Month 11 | Month 12 | ||
| Plan Month | 1 | 2 | 3 | 4 | 5 | 6 | 7 | 8 | 9 | 10 | 11 | 12 | |
| Current Interest Rate | 10.00% | 10.00% | 10.00% | 10.00% | 10.00% | 10.00% | 10.00% | 10.00% | 10.00% | 10.00% | 10.00% | 10.00% | |
| Long-term Interest Rate | 10.00% | 10.00% | 10.00% | 10.00% | 10.00% | 10.00% | 10.00% | 10.00% | 10.00% | 10.00% | 10.00% | 10.00% | |
| Tax Rate | 30.00% | 30.00% | 30.00% | 30.00% | 30.00% | 30.00% | 30.00% | 30.00% | 30.00% | 30.00% | 30.00% | 30.00% | |
| Other | 0 | 0 | 0 | 0 | 0 | 0 | 0 | 0 | 0 | 0 | 0 | 0 | |
| Pro Forma Profit and Loss | |||||||||||||
| Month 1 | Month 2 | Month 3 | Month 4 | Month 5 | Month 6 | Month 7 | Month 8 | Month 9 | Month 10 | Month 11 | Month 12 | ||
| Sales | $0 | $0 | $10,000 | $13,000 | $19,000 | $22,000 | $26,000 | $28,000 | $21,000 | $22,000 | $26,000 | $29,000 | |
| Direct Cost of Sales | $0 | $0 | $1,000 | $1,500 | $1,750 | $2,000 | $2,400 | $2,400 | $2,000 | $2,200 | $2,400 | $2,500 | |
| Other Production Expenses | $0 | $0 | $0 | $0 | $0 | $0 | $0 | $0 | $0 | $0 | $0 | $0 | |
| Total Cost of Sales | $0 | $0 | $1,000 | $1,500 | $1,750 | $2,000 | $2,400 | $2,400 | $2,000 | $2,200 | $2,400 | $2,500 | |
| Gross Margin | $0 | $0 | $9,000 | $11,500 | $17,250 | $20,000 | $23,600 | $25,600 | $19,000 | $19,800 | $23,600 | $26,500 | |
| Gross Margin % | 0.00% | 0.00% | 90.00% | 88.46% | 90.79% | 90.91% | 90.77% | 91.43% | 90.48% | 90.00% | 90.77% | 91.38% | |
| Expenses | |||||||||||||
| Payroll | $9,100 | $9,100 | $9,100 | $9,100 | $9,100 | $9,100 | $9,100 | $9,100 | $9,100 | $9,100 | $9,100 | $9,100 | |
| Sales and Marketing and Other Expenses | $2,000 | $2,000 | $2,000 | $2,000 | $2,000 | $2,000 | $2,000 | $2,000 | $2,000 | $2,000 | $2,000 | $2,000 | |
| Depreciation | $200 | $200 | $200 | $200 | $200 | $200 | $200 | $200 | $200 | $200 | $200 | $200 | |
| Utilities | $300 | $300 | $300 | $300 | $300 | $300 | $300 | $300 | $300 | $300 | $300 | $0 | |
| Insurance | $200 | $200 | $200 | $200 | $200 | $200 | $200 | $200 | $200 | $200 | $200 | $200 | |
| Payroll Taxes | 15% | $1,365 | $1,365 | $1,365 | $1,365 | $1,365 | $1,365 | $1,365 | $1,365 | $1,365 | $1,365 | $1,365 | $1,365 |
| Other | $0 | $0 | $0 | $0 | $0 | $0 | $0 | $0 | $0 | $0 | $0 | $0 | |
| Total Operating Expenses | $13,165 | $13,165 | $13,165 | $13,165 | $13,165 | $13,165 | $13,165 | $13,165 | $13,165 | $13,165 | $13,165 | $12,865 | |
| Profit Before Interest and Taxes | ($13,165) | ($13,165) | ($4,165) | ($1,665) | $4,085 | $6,835 | $10,435 | $12,435 | $5,835 | $6,635 | $10,435 | $13,635 | |
| EBITDA | ($12,965) | ($12,965) | ($3,965) | ($1,465) | $4,285 | $7,035 | $10,635 | $12,635 | $6,035 | $6,835 | $10,635 | $13,835 | |
| Interest Expense | $663 | $660 | $656 | $652 | $649 | $645 | $642 | $638 | $634 | $631 | $627 | $624 | |
| Taxes Incurred | ($4,148) | ($4,147) | ($1,446) | ($695) | $1,031 | $1,857 | $2,938 | $3,539 | $1,560 | $1,801 | $2,942 | $3,903 | |
| Net Profit | ($9,680) | ($9,677) | ($3,375) | ($1,622) | $2,405 | $4,333 | $6,855 | $8,258 | $3,640 | $4,203 | $6,865 | $9,108 | |
| Net Profit/Sales | 0.00% | 0.00% | -33.75% | -12.48% | 12.66% | 19.69% | 26.37% | 29.49% | 17.34% | 19.10% | 26.41% | 31.41% | |
| Pro Forma Cash Flow | |||||||||||||
| Month 1 | Month 2 | Month 3 | Month 4 | Month 5 | Month 6 | Month 7 | Month 8 | Month 9 | Month 10 | Month 11 | Month 12 | ||
| Cash Received | |||||||||||||
| Cash from Operations | |||||||||||||
| Cash Sales | $0 | $0 | $10,000 | $13,000 | $19,000 | $22,000 | $26,000 | $28,000 | $21,000 | $22,000 | $26,000 | $29,000 | |
| Subtotal Cash from Operations | $0 | $0 | $10,000 | $13,000 | $19,000 | $22,000 | $26,000 | $28,000 | $21,000 | $22,000 | $26,000 | $29,000 | |
| Additional Cash Received | |||||||||||||
| Sales Tax, VAT, HST/GST Received | 0.00% | $0 | $0 | $0 | $0 | $0 | $0 | $0 | $0 | $0 | $0 | $0 | $0 |
| New Current Borrowing | $0 | $0 | $0 | $0 | $0 | $0 | $0 | $0 | $0 | $0 | $0 | $0 | |
| New Other Liabilities (interest-free) | $0 | $0 | $0 | $0 | $0 | $0 | $0 | $0 | $0 | $0 | $0 | $0 | |
| New Long-term Liabilities | $0 | $0 | $0 | $0 | $0 | $0 | $0 | $0 | $0 | $0 | $0 | $0 | |
| Sales of Other Current Assets | $0 | $0 | $0 | $0 | $0 | $0 | $0 | $0 | $0 | $0 | $0 | $0 | |
| Sales of Long-term Assets | $0 | $0 | $0 | $0 | $0 | $0 | $0 | $0 | $0 | $0 | $0 | $0 | |
| New Investment Received | $0 | $0 | $0 | $0 | $0 | $0 | $0 | $0 | $0 | $0 | $0 | $0 | |
| Subtotal Cash Received | $0 | $0 | $10,000 | $13,000 | $19,000 | $22,000 | $26,000 | $28,000 | $21,000 | $22,000 | $26,000 | $29,000 | |
| Expenditures | Month 1 | Month 2 | Month 3 | Month 4 | Month 5 | Month 6 | Month 7 | Month 8 | Month 9 | Month 10 | Month 11 | Month 12 | |
| Expenditures from Operations | |||||||||||||
| Cash Spending | $9,100 | $9,100 | $9,100 | $9,100 | $9,100 | $9,100 | $9,100 | $9,100 | $9,100 | $9,100 | $9,100 | $9,100 | |
| Bill Payments | $13 | $380 | $467 | $3,100 | $3,880 | $5,572 | $6,446 | $8,792 | $10,348 | $7,656 | $8,762 | $10,076 | |
| Subtotal Spent on Operations | $9,113 | $9,480 | $9,567 | $12,200 | $12,980 | $14,672 | $15,546 | $17,892 | $19,448 | $16,756 | $17,862 | $19,176 | |
| Additional Cash Spent | |||||||||||||
| Sales Tax, VAT, HST/GST Paid Out | $0 | $0 | $0 | $0 | $0 | $0 | $0 | $0 | $0 | $0 | $0 | $0 | |
| Principal Repayment of Current Borrowing | $0 | $0 | $0 | $0 | $0 | $0 | $0 | $0 | $0 | $0 | $0 | $0 | |
| Other Liabilities Principal Repayment | $0 | $0 | $0 | $0 | $0 | $0 | $0 | $0 | $0 | $0 | $0 | $0 | |
| Long-term Liabilities Principal Repayment | $430 | $430 | $430 | $430 | $430 | $430 | $430 | $430 | $430 | $430 | $430 | $430 | |
| Purchase Other Current Assets | $0 | $0 | $0 | $0 | $0 | $0 | $0 | $0 | $0 | $0 | $0 | $0 | |
| Purchase Long-term Assets | $0 | $0 | $0 | $0 | $0 | $0 | $0 | $0 | $0 | $0 | $0 | $0 | |
| Dividends | $0 | $0 | $0 | $0 | $0 | $0 | $0 | $0 | $0 | $0 | $0 | $0 | |
| Subtotal Cash Spent | $9,543 | $9,910 | $9,997 | $12,630 | $13,410 | $15,102 | $15,976 | $18,322 | $19,878 | $17,186 | $18,292 | $19,606 | |
| Net Cash Flow | ($9,543) | ($9,910) | $3 | $370 | $5,590 | $6,898 | $10,024 | $9,678 | $1,122 | $4,814 | $7,708 | $9,394 | |
| Cash Balance | $57,357 | $47,448 | $47,451 | $47,821 | $53,412 | $60,310 | $70,334 | $80,012 | $81,134 | $85,948 | $93,656 | $103,050 | |
| Pro Forma Balance Sheet | |||||||||||||
| Month 1 | Month 2 | Month 3 | Month 4 | Month 5 | Month 6 | Month 7 | Month 8 | Month 9 | Month 10 | Month 11 | Month 12 | ||
| Assets | Starting Balances | ||||||||||||
| Current Assets | |||||||||||||
| Cash | $66,900 | $57,357 | $47,448 | $47,451 | $47,821 | $53,412 | $60,310 | $70,334 | $80,012 | $81,134 | $85,948 | $93,656 | $103,050 |
| Inventory | $10,000 | $10,000 | $10,000 | $9,000 | $7,500 | $5,750 | $3,750 | $2,640 | $2,640 | $2,200 | $2,420 | $2,640 | $2,750 |
| Other Current Assets | $0 | $0 | $0 | $0 | $0 | $0 | $0 | $0 | $0 | $0 | $0 | $0 | $0 |
| Total Current Assets | $76,900 | $67,357 | $57,448 | $56,451 | $55,321 | $59,162 | $64,060 | $72,974 | $82,652 | $83,334 | $88,368 | $96,296 | $105,800 |
| Long-term Assets | |||||||||||||
| Long-term Assets | $30,000 | $30,000 | $30,000 | $30,000 | $30,000 | $30,000 | $30,000 | $30,000 | $30,000 | $30,000 | $30,000 | $30,000 | $30,000 |
| Accumulated Depreciation | $0 | $200 | $400 | $600 | $800 | $1,000 | $1,200 | $1,400 | $1,600 | $1,800 | $2,000 | $2,200 | $2,400 |
| Total Long-term Assets | $30,000 | $29,800 | $29,600 | $29,400 | $29,200 | $29,000 | $28,800 | $28,600 | $28,400 | $28,200 | $28,000 | $27,800 | $27,600 |
| Total Assets | $106,900 | $97,157 | $87,048 | $85,851 | $84,521 | $88,162 | $92,860 | $101,574 | $111,052 | $111,534 | $116,368 | $124,096 | $133,400 |
| Liabilities and Capital | Month 1 | Month 2 | Month 3 | Month 4 | Month 5 | Month 6 | Month 7 | Month 8 | Month 9 | Month 10 | Month 11 | Month 12 | |
| Current Liabilities | |||||||||||||
| Accounts Payable | $0 | $367 | $365 | $2,972 | $3,695 | $5,360 | $6,155 | $8,443 | $10,094 | $7,366 | $8,427 | $9,719 | $10,345 |
| Current Borrowing | $0 | $0 | $0 | $0 | $0 | $0 | $0 | $0 | $0 | $0 | $0 | $0 | $0 |
| Other Current Liabilities | $0 | $0 | $0 | $0 | $0 | $0 | $0 | $0 | $0 | $0 | $0 | $0 | $0 |
| Subtotal Current Liabilities | $0 | $367 | $365 | $2,972 | $3,695 | $5,360 | $6,155 | $8,443 | $10,094 | $7,366 | $8,427 | $9,719 | $10,345 |
| Long-term Liabilities | $80,000 | $79,570 | $79,140 | $78,710 | $78,280 | $77,850 | $77,420 | $76,990 | $76,560 | $76,130 | $75,700 | $75,270 | $74,840 |
| Total Liabilities | $80,000 | $79,937 | $79,505 | $81,682 | $81,975 | $83,210 | $83,575 | $85,433 | $86,654 | $83,496 | $84,127 | $84,989 | $85,185 |
| Paid-in Capital | $60,000 | $60,000 | $60,000 | $60,000 | $60,000 | $60,000 | $60,000 | $60,000 | $60,000 | $60,000 | $60,000 | $60,000 | $60,000 |
| Retained Earnings | ($33,100) | ($33,100) | ($33,100) | ($33,100) | ($33,100) | ($33,100) | ($33,100) | ($33,100) | ($33,100) | ($33,100) | ($33,100) | ($33,100) | ($33,100) |
| Earnings | $0 | ($9,680) | ($19,357) | ($22,731) | ($24,354) | ($21,948) | ($17,615) | ($10,760) | ($2,502) | $1,138 | $5,341 | $12,207 | $21,315 |
| Total Capital | $26,900 | $17,220 | $7,543 | $4,169 | $2,546 | $4,952 | $9,285 | $16,140 | $24,398 | $28,038 | $32,241 | $39,107 | $48,215 |
| Total Liabilities and Capital | $106,900 | $97,157 | $87,048 | $85,851 | $84,521 | $88,162 | $92,860 | $101,574 | $111,052 | $111,534 | $116,368 | $124,096 | $133,400 |
| Net Worth | $26,900 | $17,220 | $7,543 | $4,169 | $2,546 | $4,952 | $9,285 | $16,140 | $24,398 | $28,038 | $32,241 | $39,107 | $48,215 |


