
IWA Championship Wrestling
Executive Summary
Professional wrestling has never been hotter than it is right now. During the last year, 7 of the Top 10 cable television shows each and every week have been professional wrestling. Last month, Tonight Show host Jay Leno asked NBA Superstar Shaquille O’Neal what his favorite thing to watch on TV was. Shaq quickly replied “professional wrestling.”
The NBC Television Network announced the results of a national survey last February in which it listed the “top viewer sports” in America as:
- National Football League
- Professional Wrestling
- Major League Baseball
- National Basketball Association.
Professional wrestling is true family entertainment with demographics ranging from ages 3 to 93, 40% female, and very heavy in the 21 to 49-year old male market as well. In addition, 35 million people watch professional wrestling on TV every week. Millions more flock to sold out arenas to see it in person.
The top two pro wrestling organizations in the industry are the World Wrestling Federation (WWF) guided by its president Vince McMahan, Jr. and the Ted Turner-owned World Championship Wrestling (WCW).
TV Guide has predicted that the WWF will make $550 million this year while WCW will make $350 million. Vince McMahan took the WWF public during the first quarter of this year and raised an additional $250 million in the process. McMahan is making so much money that he recently announced that he was forming his own professional football league (The Extreme Football League) in attempts to compete with the National Football League.
At this point in time, there is a large gap between the top two pro wrestling organizations and all others. The closest to being third is a small group out of New York/Philadelphia calling itself Extreme Championship Wrestling (ECW). ECW fails to have mass appeal and profit potential because of its extremely violent and “hardcore” nature. ECW’s ratings for their weekly Friday television program on The Nashville Network (TNN) have hovered below the 1.0 mark, while TNN has promised their advertisers a 2.5 rating. IWA Championship Wrestling (IWA) has established as it’s goal and mission to create a family oriented television product and live events to maximize its appeal to television viewers, sponsors, advertisers and those attending “live” events and buying pay-per-view.
It is the goal of the IWA to become the #3 pro wrestling organization in the industry within three years, while, at the same time, making a minimum of 10% of the current monies being made by the #2 organization (WCW) or, approximately $35 million per year, with projected costs of approximately one quarter that amount, thus creating a viable, profitable scenario for all of those involved.
1.1 Objectives
IWA Championship Wrestling has set the following objectives to be achieved during over first three years of expansion and growth:
- Become the third most popular professional wrestling organization in the industry.
- Secure a national cable television contract for a weekly one-hour program.
- Begin production of the weekly, one-hour pro wrestling program.
- Recruit top available established talent and develop new talent, writers, and managers.
- Syndicate and distribute television programming worldwide.
- Promote live event tours in areas where television programming is seen.
1.2 Mission
IWA Championship Wrestling will establish a family-oriented television program for domestic and international distribution and sale. It will support the television program with live event tours. Additional revenues will be generated from:
- Quarterly pay-per-view events.
- Sponsorships and advertising revenues.
- Merchandising of souvenir, concession items, and a series of videos for sale via live events, mail order, and the official IWA website.
- Creation of an IWA Professional Wrestling School .
- Personal appearances fees on engagements booked for IWA talent.
Within 3 years, the IWA will become recognized and established as the #3 professional wrestling organization and a major player within the industry. Our programming will consistently receive TV ratings in the 2.0 to 2.5 range, and we will have used major established stars to entice viewers and fans to tune in while, at the same time, developed outstanding new talent from within.
Within five years, the IWA will be in a position to make a serious run at the second most popular position in the industry currently held by WCW and generate approximately $35 million per year in revenue.
The IWA will base its appeal on filling the major void currently existing in professional wrestling by providing “family oriented” and “family friendly” professional sports entertainment programming and live events. By appealing to the masses, rather than a limited group of hardcore fans, the IWA will seek to maximize its appeal, exposure, and profits by being truly committed to “family” values.
Currently, no such pro wrestling programming exists. Fans have only the WWF and WCW programming available and they are carbon copies of each other in format and design. There is a high emphasis on extreme violence, vulgarity, disrespect of authority and women, nudity, and use of alcoholic beverages in the ring and locker room areas … all seen as part of their weekly television programming.
The only alternative to WWF and WCW programming currently is Extreme Championship Wrestling (ECW) which appears on the Nashville Network (TNN) and appeals to the hardcore, extreme fan only.
IWA fans will be encouraged to have their children follow our programming, and we will create role models that are strong, positive, and family oriented in every way. The IWA will bring “rasslin'” back to professional wrestling, and put the emphasis on talent, skill, and ability as opposed to warped, demented story lines currently in vogue with the other organizations.
It makes strong business sense to appeal to the majority or masses of wrestling fans who range in age from 3 to 93, are 40% female, and very strong in the 21 to 49-year old male segment of the population. Pro wrestling need not be just for kids … or just for the hardcore extreme. By tapping into the “main stream,” the IWA will have a unique and very strong position within the industry that will yield maximum profit potential.
Company Summary
This business plan has been developed to present IWA to prospective investors and to assist in raising $500,000 of equity capital needed to fund the 3 year time period it is estimated it will take for the IWA to secure a position in the top three most popular shows within the industry. We will do this by producing a weekly, family oriented television program and a series of family-oriented live events to fill the void currently existing among pro wrestling fans worldwide.
2.1 Company Ownership
IWA is a company with 3 principals involved in its development. The principal contact is Rob Russen, Sarasota, FL.
IWA founder and CEO Rob Russen, entered professional wrestling as a local promoter in the Philadelphia area in 1976. In 1979 he formed his own group called the North American Wrestling Federation (NAWF) and achieved much local success.
In 1985 Russen formed the National Wrestling Federation (NWF), which was selected as “independent wrestling promotion of the year” by Wrestling Fury and Wrestling Eye magazines. Wrestling Fury wrote of Mr. Russen “he is a wrestling and business genius … top name talent appears on every NWF card … the matches are exciting and the fans always walk away with the satisfied feeling that they received more than their money’s worth.”
When legendary promoter/wrestler Verne Gagne needed someone to jump-start his American Wrestling Association (AWA); Rob Russen was the man he brought in to become vice-president and director of marketing.

2.2 Start-up Summary
Assumptions made herein are based on the projected costs and revenues to produce a monthly tape-delayed television production, which will yield the weekly television programming for domestic and international distribution. Revenue assumptions are based on sponsorship participation, television advertising, gate attendance and/or site fees for live events, merchandise sold at live events, merchandise sold on the IWA website, plus food and beverage sales at events.
Cost assumptions include the purchase of television time, event production costs (including talent, travel, and equipment rental), television production costs (including live shoot, post production, editing, and dubbing), lighting rental, building rental, and local cable TV and print media advertising.

| Start-up Funding | |
| Start-up Expenses to Fund | $82,450 |
| Start-up Assets to Fund | $450,000 |
| Total Funding Required | $532,450 |
| Assets | |
| Non-cash Assets from Start-up | $0 |
| Cash Requirements from Start-up | $450,000 |
| Additional Cash Raised | $0 |
| Cash Balance on Starting Date | $450,000 |
| Total Assets | $450,000 |
| Liabilities and Capital | |
| Liabilities | |
| Current Borrowing | $72,000 |
| Long-term Liabilities | $302,945 |
| Accounts Payable (Outstanding Bills) | $0 |
| Other Current Liabilities (interest-free) | $0 |
| Total Liabilities | $374,945 |
| Capital | |
| Planned Investment | |
| Investor 1 | $52,000 |
| Investor 2 | $50,000 |
| Investor 3 | $25,505 |
| Investor 4 | $30,000 |
| Other | $0 |
| Additional Investment Requirement | $0 |
| Total Planned Investment | $157,505 |
| Loss at Start-up (Start-up Expenses) | ($82,450) |
| Total Capital | $75,055 |
| Total Capital and Liabilities | $450,000 |
| Total Funding | $532,450 |
| Start-up | |
| Requirements | |
| Start-up Expenses | |
| Legal | $5,000 |
| Stationery etc. | $1,500 |
| Staffing | $6,500 |
| Insurance | $500 |
| Rent | $6,000 |
| Editing Suite | $12,950 |
| Expensed equipment | $50,000 |
| Other | $0 |
| Total Start-up Expenses | $82,450 |
| Start-up Assets | |
| Cash Required | $450,000 |
| Start-up Inventory | $0 |
| Other Current Assets | $0 |
| Long-term Assets | $0 |
| Total Assets | $450,000 |
| Total Requirements | $532,450 |
Products and Services
IWA Championship Wrestling shall produce and develop a weekly syndicated professional wrestling television programming geared to the viewing masses in a “family oriented/family friendly” format to achieve mass viewership, mass potential, and mass profitability.
While the top two wrestling organizations currently have a stronghold on the business, they are, for all intents and purposes, mirror images of each other creating the same type of product that is limited in its nature and appeal. IWA programming will always be family oriented and, thus, have great mass appeal, projecting the IWA into the #3 position within the industry within 3 years.
In addition to using established, well known pro wrestling stars including former WWF and WCE stars and outstanding ladies wrestling stars, the IWA will develop its own stars of the future as we have in the past when discovering and working with current WWF and WCE stars.
Former WWF Stars: Tatanka, Sweet Stan Lane, Hillbilly Cousin Ike, Sgt. Slaughter, The Bushwhackers, Demolition Axe, Doink the Clown, The Wild Samoans, The Rock and Roll Express, Salvatore Sincere, Jerry “The King” Lawler.
Former WCW Stars: The Midnight Express, The Masked Superstar, Ronnie Garvin, Michael “P.S.” Hayes, One Man Gang, Tracy Smothers, Ivan Koloff, Big Al Greene.
Ladies Wrestling Stars: Malia Hosaka, Candi Devine, Bambi, Peggy Lee Leather, Missy Hyatt.
Curent WWF Stars: Cactus Jack/Mankind, Meridian, Dean Malenko, X-pad.
Current WCW Stars: Diamond Dallas Page, Madusa Micelli, Shane Douglas, Billy Kidman, Bam Bam Bigelow.
3.1 Merchandising
The IWA will create a line of souvenir and concession items, which will include photos, posters, t-shirts, hats, banners, bumper stickers, action figures, and home videos.
3.2 Tours
The IWA, using a network of international agents and promoters, will tour on “sold” events basis guaranteeing a profit plus a percentage of all gate revenues both domestically and internationally. Among areas already expressing interest in promoting IWA tours are Australia, New Zealand, Russia, Great Britain, the Philippines, and Israel.
Market Analysis Summary
IWA will direct its efforts to the production of family-oriented television programming and live events, procuring sponsorships, television advertising, and merchandising deals all designed to firmly carve our niche as the #3 professional wrestling organization in the industry, both domestically and worldwide.
Geographically, the company will initially direct its efforts in two key areas: domestic syndication of its weekly television programming and live event tours both throughout the continental United States and internationally, via syndication of its weekly television programming and sold live event tours working with established agents and promoters worldwide.
IWA management believes its decisions to use established name talent in a family-oriented format will ensure maximum mass appeal, maximum ratings, and maximum profits, all designed to firmly entrench the IWA into a solid #3 position within the industry, while also carving out a financial piece of the lucrative pro wrestling revenue pie projected to be a minimum of 10% of revenues projected by the current #2 organization (WCW), or approximately $35 million within the first 3 years.
Because of our extensive experience on the highest levels of the pro wrestling industry, we have the ability to produce quality television programming at rates well below that of our competitors, attract the top available “name” stars to work with us, and attract the best, new young talent in the industry to develop future stars.
Professional wrestling is the hottest sports entertainment available on television and at live events throughout the country. TV Guide estimates that 35 million people watch professional wrestling from the WWF, WCW, and ECW on television each and every week, and millions more flock to the arenas to see the live events with ticket prices of up to $35 each.
Pro wrestling has always used television as its base of exposure and popularity. During the entire decade of the ’90s there were only a handful of professional wrestling organizations to secure nationally syndicate television contracts. The IWA did it TWICE!
With the proper financial backing to sustain the production and distribution of IWA television programming, it is a well-founded conclusion, based on our track record and experience, that the #3 position within the industry is a realistic and achievable goal for IWA.
4.1 Market Segmentation
Professional wrestling is true family entertainment. The following chart and table contain interesting facts about pro wrestling fans, based on Scarborough Research:

| Market Analysis | |||||||
| Year 1 | Year 2 | Year 3 | Year 4 | Year 5 | |||
| Potential Customers | Growth | CAGR | |||||
| White Collar Family Oriented Vewers | 20% | 6,880,000 | 8,256,000 | 9,907,200 | 11,888,640 | 14,266,368 | 20.00% |
| White Collar Non Family Oriented Viewers | 25% | 9,820,000 | 12,275,000 | 15,343,750 | 19,179,688 | 23,974,610 | 25.00% |
| Blue Collar Family Oriented Viewers | 23% | 5,460,000 | 6,715,800 | 8,260,434 | 10,160,334 | 12,497,211 | 23.00% |
| Blue Collar Non Family Oriented Viewers | 30% | 13,000,000 | 16,900,000 | 21,970,000 | 28,561,000 | 37,129,300 | 30.00% |
| Total | 25.73% | 35,160,000 | 44,146,800 | 55,481,384 | 69,789,662 | 87,867,489 | 25.73% |
4.2 Target Market Segment Strategy
As previously mentioned, the IWA plans to approach the marketplace primarily through family-oriented programming and live events riding the wave of the popularity of professional wrestling today. The key target is the nationwide and international distribution of our weekly, one-hour television program.
Parents who are concerned with the excessive violence, nudity, vulgarity, and general disrespect for women, minorities, and authority will embrace the IWA as the true alternative in the world of professional sports entertainment. They will not be concerned when their children sit down to watch our programming or buy our souvenir merchandise. In fact, mom and dad will gladly buy tickets for the entire family to attend our live events when we appear in their hometown.
The increase in the popularity of professional wrestling continues despite the fact that the top current organizations have little or no regard for family values. Thus, it is the IWA belief that they are minimizing their potential success by comparison with the IWA plan to appeal directly to family values, family-oriented programming, and live events and, thus, a greater majority of the population.
It is only logical that if we succeed in our target market strategy our product and services will be even more widely accepted and received than that of our competitors over a period of time. The exact amount of time involved is directly related to the extent of our television exposure domestically and internationally. We anticipate a maximum of 3 years to find the IWA well established with the target market and firmly entrenched as the #3 professional wrestling organization in the industry.
4.3 Service Business Analysis
As previously stated, the popularity of professional wrestling is at an all-time high with the top two organizations in the industry currently dominating the weekly cable television ratings and grossing almost $1 billion between them in annual revenues. This trend is likely to sustain itself due to the fact that 35 million people watch it every week on television, and millions more turn out to attend live events.
In fact, demand for American style professional wrestling has now spread worldwide. The IWA has already received interested inquiries for tours and television proposals from Australia, Great Britain, Scandinavia, Russia, Israel, and the entire Pacific Rim from legitimate agents and promoters wanting to represent and promote the IWA there.
Rob Russen, founder of the IWA has a clear and realistic vision of what it will take to achieve IWA goals and ambitions to become the #3 wrestling organization in the world. He has the experience, expertise, and the contacts to make it reality.
4.3.1 Competition and Buying Patterns
Competition within the upper echelon of professional wrestling is clearly established, easily identified, and very limited.
The World Wrestling Federation (WWF) – For nearly four decades this family-owned promotion has been tops in the industry. TV Guide projects the WWF will earn $550 million this year. In March, 2000, the WWF went public and raised $250 million. The WWF continues to dominate cable TV ratings, pay-per-view buy rates, and merchandise sales by constantly developing their stable of stars through their television exposure. It is a simple formula that has worked consistently over the years as the WWF has made the transition from the “Nature Boy” Buddy Rodgers era to the Bruno Sammartino era to the Bob Backlund era to the Sgt. Slaughter era to the Hulk Hogan era to the current era of The Rock, Cactus Jack, and HHH. It has been said that the WWF “made more than 15 millionaires” from their roster in 1999.
World Championship Wrestling (WCW) – Approximately 15 years ago Ted Turner bought the NWA/WCW from Jim Crocket for $3.5 million to provide inexpensive television programming for his growing cable empire. Many thought, at the time, that Crocket had made out like a bandit and that Turner had overpaid for a regional wrestling organization with an aged talent roster and limited appeal.
In the year 2000, according to TV Guide, WCW will earn approximately $350 million or exactly ONE HUNDRED times the amount that Turner paid to buy the group 15 years ago. WCW now has the biggest and most extensive talent roster in the industry including former WWF superstars Hulk Hogan, “Macho Man” Randy Savage, Bret “The Hit Man” Hart as well as home grown stars like Sting, Lex Lugar, Diamond Dallas Page, and Goldberg to name a few.
WCW has the highest paid roster of “guaranteed” contracts in the industry and thus, the highest talent costs as well. Unfortunately for WCW, after a period of about 18 months when they actually overtook the WWF in the ratings war, mismanagement, overspending on talent costs, and poor story lines has caused WCW to drop dramatically in the ratings to the point where they are a distant second to the WWF, and could be vulnerable to a strong #3 competition if and when it appears.
Extreme Championship Wrestling (ECW) – Paul E. Dangerously, head of ECW, was given his first managerial duties and TV exposure in pro wrestling by IWA founder Rob Russen in 1985. Dangerously has found his niche in pro wrestling in the form of the “hardcore” or “extreme” fan who seeks high risk maneuvers, blood, guts, fire, smashed tables, flashed breasts, and vulgarity. The very nature of ECW limits its appeal to what Jim Liberatore, GM of the Sunshine Network, calls a base following made up of “skin heads and neo-Nazi’s” … hardly an ideal target market for any reasonable sponsor or advertiser.
Strategy and Implementation Summary
The IWA strategy, to create family-oriented television programming and live events, is clearly established herein. Immediately upon availability of funds, the IWA shall negotiate an annual television contract and schedule the first of our monthly television productions.
At the same time, we shall immediately seek an advertising agency to sell both sponsorship packages and the advertising inventory we retain within the weekly television program.
It is anticipated that within 3 months of start-up, the programming will be on the air and running consistently thereafter.
5.1 Competitive Edge
The IWA will be the only company in the industry marketing our specific programming and products to the masses. We intend to provide family-oriented/family-friendly programming aimed at increasing the following of our products by appealing to the masses rather than a specific niche market.
The entire IWA marketing effort will be in the area of establishing the substantial differences between our product and that of our competitors and how our product is, in fact, family oriented and family friendly, thus distinguishing the IWA from all of our competitors.
In addition, the IWA will keep the pricing of our programming and products within the family-friendly range, and well below that of our competitors. It is estimated that tickets to IWA live events will cost 60% less than those of competitor’s events. Our pay-per-view televised events will also be family-friendly, costing 35% less than that of our competitors during the first 3 years of our growth and expansion.
5.2 Sales Strategy
The key to our sales strategy, especially during the first 3 years is to keep our ticket pricing and pay-per-view pricing family-oriented, so that families can actually afford to attend our live events and buy our pay-per-view specials. Thus, we propose to keep ticket prices in the range of $15 for ringside seats and $10 to $12 for reserved and general admission seating with substantial discounts for children under the age of 12.
By comparison, ringside seats to WWF, WCW and ECW events cost in the vicinity of $35 each. WWF, WCW, and ECW pay-per-view programming is sold at $29.95 on a regular, monthly basis. It is the intent of the IWA to sell our quarterly pay-per-view events at $19.95.
By creating a family-oriented product at family-friendly pricing we anticipate maximum sales potential.
5.2.1 Sales Forecast
In our method of calculating the figures contained herein the sales forecast includes projected annual total revenues generated as follows:

| Sales Forecast | |||
| Year 1 | Year 2 | Year 3 | |
| Sales | |||
| Sponsorship Participation | $1,000,000 | $2,600,000 | $6,370,000 |
| TV Advertising | $428,000 | $1,112,800 | $2,726,360 |
| Pay-Per-View | $3,840,000 | $9,984,000 | $24,460,800 |
| Gate Attendance/Site Sales | $180,000 | $468,000 | $1,146,600 |
| Merchandise Sold at Events | $18,000 | $46,800 | $114,660 |
| Other Merchandise | $36,000 | $93,600 | $229,320 |
| Food and Beverage Sold at Events | $36,000 | $93,600 | $229,320 |
| Total Sales | $5,538,000 | $14,398,800 | $35,277,060 |
| Direct Cost of Sales | Year 1 | Year 2 | Year 3 |
| Sponsorship Participation | $380,780 | $1,142,340 | $3,427,019 |
| TV Advertising | $90,000 | $270,000 | $810,000 |
| Pay-Per-View | $720,000 | $2,160,000 | $6,480,000 |
| Gate Attendance/Site Sales | $54,120 | $162,360 | $487,080 |
| Merchandise Sold at Events | $4,100 | $12,300 | $36,900 |
| Other Merchandise | $12,000 | $36,000 | $108,000 |
| Food and Beverage Sold at Events | $18,000 | $54,000 | $162,000 |
| Subtotal Direct Cost of Sales | $1,279,000 | $3,837,000 | $11,511,000 |
Management Summary
Unlike our competitors, the IWA does not intend, during the first 3 years of this plan, to offer guaranteed contracts to individual talent. Instead, all talent, including wrestlers, production people, referees, announcers, etc., will be booked for our monthly events as independent contractors, thus keeping our costs down and profits high.
The only full-time employees during this time frame will be an office manager, a secretary, and a production technician.
6.1 Personnel Plan
The following table contains a breakdown of IWA’s projected personnel calculations.
| Personnel Plan | |||
| Year 1 | Year 2 | Year 3 | |
| Partners | $159,996 | $319,992 | $735,982 |
| Marketing | $72,000 | $144,000 | $331,200 |
| Performers | $600,000 | $1,200,000 | $2,760,000 |
| Production | $1,200,000 | $2,400,000 | $5,520,000 |
| Admin | $100,000 | $200,000 | $460,000 |
| Total People | 75 | 150 | 400 |
| Total Payroll | $2,131,996 | $4,263,992 | $9,807,181 |
Financial Plan
Based on detailed financial projections from our Balance Sheet, if the company receives the sought after approximately $500,000 in funding, it will operate profitably..
7.1 Break-even Analysis
The following table and chart show our projected Break-even Analysis.

| Break-even Analysis | |
| Monthly Revenue Break-even | $281,711 |
| Assumptions: | |
| Average Percent Variable Cost | 23% |
| Estimated Monthly Fixed Cost | $216,650 |
7.2 Projected Profit and Loss
The table below contains the projected profit and loss information for IWA.
The IWA formula for success is based on consistent revenues generated from specific sponsorship packages and advertising revenues created by our television programming.
Within each weekly program there are 14 minutes of commercial advertising time broken down into either 60-second, 30-second, or 20-second spots. We are entitled to keep up to 10 minutes of that commercial time for re-sale.
Also, within the format of our television programming there are 5 basic “segments” plus an open and a close. It is our intent to find major sponsors to host at least 4 of these segments wherein each sponsor will contribute $250,000 annually to be the exclusive or “official” presentor of that segment of the show each week.
TV advertising revenue projections are based on the IWA selling 28 30-second spots per show, at a cost of $1,500, each adding up to $43,000 per show, or $504,000 in gross annual advertising sales. Less ad agency commissions (15%), this nets out to $428,000 in annual advertising revenue to the IWA.
Our pay-per-view income projections are based on our share (40%) of quarterly events with a 0.2% buy rate at $19.95 per household. This nets out to $3.8 million in annual pay-per-view revenues to the IWA.
Attendance revenue is modestly based on 1,500 tickets sold per month/event @ $10 each over the 12 shows per year. Site fees are based on a minimum of $20,000 per TV taping plus travel, rooms, and food. This nets out to $180,000 in annual gate attendance or site fees revenues to the IWA.
Merchandise projections at events are conservatively based on each of the 1,500 in attendance spending $1 each per show over the 12 shows per year. This nets out to $18,000 in annual live event merchandise revenues to the IWA.
Food and beverage revenues at live events ate based on each of the 1,500 in attendance spending $2 each per show over the 12 shows per year. This nets out to $ 36,000 in annual food and beverage revenues to the IWA.
All financial projects herein are conservative and within reason by industry standards.


| Pro Forma Profit and Loss | |||
| Year 1 | Year 2 | Year 3 | |
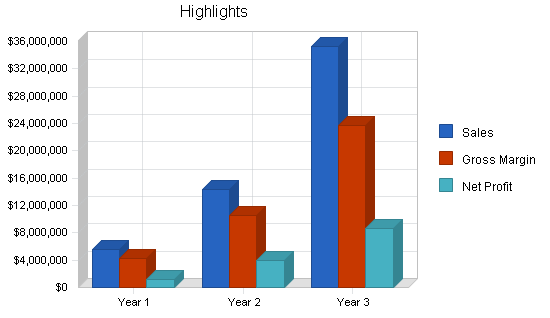
| Sales | $5,538,000 | $14,398,800 | $35,277,060 |
| Direct Cost of Sales | $1,279,000 | $3,837,000 | $11,511,000 |
| Other | $0 | $0 | $0 |
| Total Cost of Sales | $1,279,000 | $3,837,000 | $11,511,000 |
| Gross Margin | $4,259,000 | $10,561,800 | $23,766,060 |
| Gross Margin % | 76.91% | 73.35% | 67.37% |
| Expenses | |||
| Payroll | $2,131,996 | $4,263,992 | $9,807,181 |
| Sales and Marketing and Other Expenses | $98,000 | $283,000 | $840,500 |
| Depreciation | $20,000 | $20,000 | $20,000 |
| Leased Equipment | $4,800 | $9,600 | $19,200 |
| Utilities | $4,800 | $9,600 | $19,200 |
| Insurance | $6,000 | $12,000 | $24,000 |
| Rent | $14,400 | $28,800 | $57,600 |
| Payroll Taxes | $319,799 | $639,599 | $1,471,077 |
| Other | $0 | $0 | $0 |
| Total Operating Expenses | $2,599,795 | $5,266,591 | $12,258,759 |
| Profit Before Interest and Taxes | $1,659,205 | $5,295,209 | $11,507,301 |
| EBITDA | $1,679,205 | $5,315,209 | $11,527,301 |
| Interest Expense | $30,313 | $21,156 | $13,997 |
| Taxes Incurred | $415,522 | $1,318,513 | $2,921,215 |
| Net Profit | $1,213,370 | $3,955,540 | $8,572,089 |
| Net Profit/Sales | 21.91% | 27.47% | 24.30% |
7.3 Projected Cash Flow
The following table and chart show our projected cash flow.

| Pro Forma Cash Flow | |||
| Year 1 | Year 2 | Year 3 | |
| Cash Received | |||
| Cash from Operations | |||
| Cash Sales | $1,384,500 | $3,599,700 | $8,819,265 |
| Cash from Receivables | $3,464,181 | $9,696,190 | $23,859,063 |
| Subtotal Cash from Operations | $4,848,681 | $13,295,890 | $32,678,328 |
| Additional Cash Received | |||
| Sales Tax, VAT, HST/GST Received | $0 | $0 | $0 |
| New Current Borrowing | $0 | $0 | $0 |
| New Other Liabilities (interest-free) | $0 | $0 | $0 |
| New Long-term Liabilities | $0 | $0 | $0 |
| Sales of Other Current Assets | $0 | $0 | $0 |
| Sales of Long-term Assets | $0 | $0 | $0 |
| New Investment Received | $172,000 | $0 | $0 |
| Subtotal Cash Received | $5,020,681 | $13,295,890 | $32,678,328 |
| Expenditures | Year 1 | Year 2 | Year 3 |
| Expenditures from Operations | |||
| Cash Spending | $2,131,996 | $4,263,992 | $9,807,181 |
| Bill Payments | $2,113,296 | $6,044,818 | $16,661,720 |
| Subtotal Spent on Operations | $4,245,292 | $10,308,810 | $26,468,901 |
| Additional Cash Spent | |||
| Sales Tax, VAT, HST/GST Paid Out | $0 | $0 | $0 |
| Principal Repayment of Current Borrowing | $72,000 | $0 | $0 |
| Other Liabilities Principal Repayment | $0 | $0 | $0 |
| Long-term Liabilities Principal Repayment | $60,589 | $61,589 | $81,589 |
| Purchase Other Current Assets | $0 | $0 | $0 |
| Purchase Long-term Assets | $1,000,000 | $2,000,000 | $2,000,000 |
| Dividends | $0 | $0 | $0 |
| Subtotal Cash Spent | $5,377,881 | $12,370,399 | $28,550,490 |
| Net Cash Flow | ($357,199) | $925,491 | $4,127,838 |
| Cash Balance | $92,801 | $1,018,292 | $5,146,130 |
7.4 Projected Balance Sheet
The Balance Sheet below contains important cash flow information, as well as assets, liabilities, and capital expectations.
| Pro Forma Balance Sheet | |||
| Year 1 | Year 2 | Year 3 | |
| Assets | |||
| Current Assets | |||
| Cash | $92,801 | $1,018,292 | $5,146,130 |
| Accounts Receivable | $689,319 | $1,792,229 | $4,390,960 |
| Inventory | $117,242 | $351,725 | $1,055,175 |
| Other Current Assets | $0 | $0 | $0 |
| Total Current Assets | $899,361 | $3,162,246 | $10,592,265 |
| Long-term Assets | |||
| Long-term Assets | $1,000,000 | $3,000,000 | $5,000,000 |
| Accumulated Depreciation | $20,000 | $40,000 | $60,000 |
| Total Long-term Assets | $980,000 | $2,960,000 | $4,940,000 |
| Total Assets | $1,879,361 | $6,122,246 | $15,532,265 |
| Liabilities and Capital | Year 1 | Year 2 | Year 3 |
| Current Liabilities | |||
| Accounts Payable | $176,580 | $525,514 | $1,445,033 |
| Current Borrowing | $0 | $0 | $0 |
| Other Current Liabilities | $0 | $0 | $0 |
| Subtotal Current Liabilities | $176,580 | $525,514 | $1,445,033 |
| Long-term Liabilities | $242,356 | $180,767 | $99,178 |
| Total Liabilities | $418,936 | $706,281 | $1,544,211 |
| Paid-in Capital | $329,505 | $329,505 | $329,505 |
| Retained Earnings | ($82,450) | $1,130,920 | $5,086,460 |
| Earnings | $1,213,370 | $3,955,540 | $8,572,089 |
| Total Capital | $1,460,425 | $5,415,965 | $13,988,054 |
| Total Liabilities and Capital | $1,879,361 | $6,122,246 | $15,532,265 |
| Net Worth | $1,460,425 | $5,415,965 | $13,988,054 |
7.5 Business Ratios
The following table contains information from the entertainment industry, as determined by the Standard Industry Classification (SIC) Index code 7999, Amusement and Recreation, Not Elsewhere Classified.
| Ratio Analysis | ||||
| Year 1 | Year 2 | Year 3 | Industry Profile | |
| Sales Growth | 0.00% | 160.00% | 145.00% | 15.20% |
| Percent of Total Assets | ||||
| Accounts Receivable | 36.68% | 29.27% | 28.27% | 5.00% |
| Inventory | 6.24% | 5.75% | 6.79% | 3.50% |
| Other Current Assets | 0.00% | 0.00% | 0.00% | 34.40% |
| Total Current Assets | 47.85% | 51.65% | 68.20% | 42.90% |
| Long-term Assets | 52.15% | 48.35% | 31.80% | 57.10% |
| Total Assets | 100.00% | 100.00% | 100.00% | 100.00% |
| Current Liabilities | 9.40% | 8.58% | 9.30% | 36.40% |
| Long-term Liabilities | 12.90% | 2.95% | 0.64% | 23.30% |
| Total Liabilities | 22.29% | 11.54% | 9.94% | 59.70% |
| Net Worth | 77.71% | 88.46% | 90.06% | 40.30% |
| Percent of Sales | ||||
| Sales | 100.00% | 100.00% | 100.00% | 100.00% |
| Gross Margin | 76.91% | 73.35% | 67.37% | 0.00% |
| Selling, General & Administrative Expenses | 54.85% | 45.88% | 42.93% | 76.60% |
| Advertising Expenses | 0.22% | 0.29% | 0.42% | 2.60% |
| Profit Before Interest and Taxes | 29.96% | 36.78% | 32.62% | 2.00% |
| Main Ratios | ||||
| Current | 5.09 | 6.02 | 7.33 | 1.17 |
| Quick | 4.43 | 5.35 | 6.60 | 0.75 |
| Total Debt to Total Assets | 22.29% | 11.54% | 9.94% | 59.70% |
| Pre-tax Return on Net Worth | 111.54% | 97.38% | 82.17% | 2.40% |
| Pre-tax Return on Assets | 86.67% | 86.15% | 74.00% | 6.00% |
| Additional Ratios | Year 1 | Year 2 | Year 3 | |
| Net Profit Margin | 21.91% | 27.47% | 24.30% | n.a |
| Return on Equity | 83.08% | 73.03% | 61.28% | n.a |
| Activity Ratios | ||||
| Accounts Receivable Turnover | 6.03 | 6.03 | 6.03 | n.a |
| Collection Days | 57 | 42 | 43 | n.a |
| Inventory Turnover | 10.91 | 16.36 | 16.36 | n.a |
| Accounts Payable Turnover | 12.97 | 12.17 | 12.17 | n.a |
| Payment Days | 27 | 20 | 20 | n.a |
| Total Asset Turnover | 2.95 | 2.35 | 2.27 | n.a |
| Debt Ratios | ||||
| Debt to Net Worth | 0.29 | 0.13 | 0.11 | n.a |
| Current Liab. to Liab. | 0.42 | 0.74 | 0.94 | n.a |
| Liquidity Ratios | ||||
| Net Working Capital | $722,781 | $2,636,732 | $9,147,232 | n.a |
| Interest Coverage | 54.74 | 250.29 | 822.11 | n.a |
| Additional Ratios | ||||
| Assets to Sales | 0.34 | 0.43 | 0.44 | n.a |
| Current Debt/Total Assets | 9% | 9% | 9% | n.a |
| Acid Test | 0.53 | 1.94 | 3.56 | n.a |
| Sales/Net Worth | 3.79 | 2.66 | 2.52 | n.a |
| Dividend Payout | 0.00 | 0.00 | 0.00 | n.a |
Appendix
| Sales Forecast | |||||||||||||
| Month 1 | Month 2 | Month 3 | Month 4 | Month 5 | Month 6 | Month 7 | Month 8 | Month 9 | Month 10 | Month 11 | Month 12 | ||
| Sales | |||||||||||||
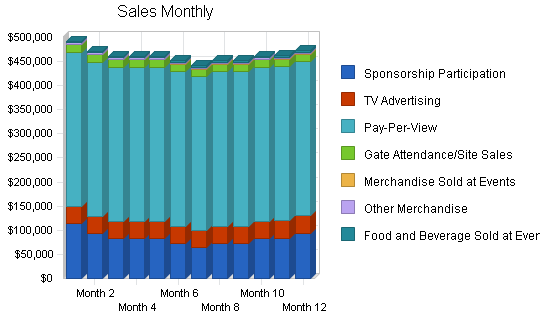
| Sponsorship Participation | 0% | $113,333 | $93,333 | $83,333 | $83,333 | $83,333 | $73,333 | $63,333 | $73,333 | $73,333 | $83,333 | $83,333 | $93,333 |
| TV Advertising | 0% | $36,417 | $35,417 | $35,417 | $35,417 | $35,417 | $35,417 | $35,417 | $35,417 | $35,417 | $35,417 | $36,417 | $36,417 |
| Pay-Per-View | 0% | $320,000 | $320,000 | $320,000 | $320,000 | $320,000 | $320,000 | $320,000 | $320,000 | $320,000 | $320,000 | $320,000 | $320,000 |
| Gate Attendance/Site Sales | 0% | $15,000 | $15,000 | $15,000 | $15,000 | $15,000 | $15,000 | $15,000 | $15,000 | $15,000 | $15,000 | $15,000 | $15,000 |
| Merchandise Sold at Events | 0% | $1,500 | $1,500 | $1,500 | $1,500 | $1,500 | $1,500 | $1,500 | $1,500 | $1,500 | $1,500 | $1,500 | $1,500 |
| Other Merchandise | 0% | $3,000 | $3,000 | $3,000 | $3,000 | $3,000 | $3,000 | $3,000 | $3,000 | $3,000 | $3,000 | $3,000 | $3,000 |
| Food and Beverage Sold at Events | 0% | $3,000 | $3,000 | $3,000 | $3,000 | $3,000 | $3,000 | $3,000 | $3,000 | $3,000 | $3,000 | $3,000 | $3,000 |
| Total Sales | $492,250 | $471,250 | $461,250 | $461,250 | $461,250 | $451,250 | $441,250 | $451,250 | $451,250 | $461,250 | $462,250 | $472,250 | |
| Direct Cost of Sales | Month 1 | Month 2 | Month 3 | Month 4 | Month 5 | Month 6 | Month 7 | Month 8 | Month 9 | Month 10 | Month 11 | Month 12 | |
| Sponsorship Participation | $31,732 | $31,732 | $31,732 | $31,732 | $31,732 | $31,732 | $31,732 | $31,732 | $31,732 | $31,732 | $31,732 | $31,732 | |
| TV Advertising | $7,500 | $7,500 | $7,500 | $7,500 | $7,500 | $7,500 | $7,500 | $7,500 | $7,500 | $7,500 | $7,500 | $7,500 | |
| Pay-Per-View | $60,000 | $60,000 | $60,000 | $60,000 | $60,000 | $60,000 | $60,000 | $60,000 | $60,000 | $60,000 | $60,000 | $60,000 | |
| Gate Attendance/Site Sales | $4,510 | $4,510 | $4,510 | $4,510 | $4,510 | $4,510 | $4,510 | $4,510 | $4,510 | $4,510 | $4,510 | $4,510 | |
| Merchandise Sold at Events | $342 | $342 | $342 | $342 | $342 | $342 | $342 | $342 | $342 | $342 | $342 | $342 | |
| Other Merchandise | $1,000 | $1,000 | $1,000 | $1,000 | $1,000 | $1,000 | $1,000 | $1,000 | $1,000 | $1,000 | $1,000 | $1,000 | |
| Food and Beverage Sold at Events | $1,500 | $1,500 | $1,500 | $1,500 | $1,500 | $1,500 | $1,500 | $1,500 | $1,500 | $1,500 | $1,500 | $1,500 | |
| Subtotal Direct Cost of Sales | $106,583 | $106,583 | $106,583 | $106,583 | $106,583 | $106,583 | $106,583 | $106,583 | $106,583 | $106,583 | $106,583 | $106,583 | |
| Personnel Plan | |||||||||||||
| Month 1 | Month 2 | Month 3 | Month 4 | Month 5 | Month 6 | Month 7 | Month 8 | Month 9 | Month 10 | Month 11 | Month 12 | ||
| Partners | 0% | $13,333 | $13,333 | $13,333 | $13,333 | $13,333 | $13,333 | $13,333 | $13,333 | $13,333 | $13,333 | $13,333 | $13,333 |
| Marketing | 0% | $6,000 | $6,000 | $6,000 | $6,000 | $6,000 | $6,000 | $6,000 | $6,000 | $6,000 | $6,000 | $6,000 | $6,000 |
| Performers | 0% | $50,000 | $50,000 | $50,000 | $50,000 | $50,000 | $50,000 | $50,000 | $50,000 | $50,000 | $50,000 | $50,000 | $50,000 |
| Production | 0% | $100,000 | $100,000 | $100,000 | $100,000 | $100,000 | $100,000 | $100,000 | $100,000 | $100,000 | $100,000 | $100,000 | $100,000 |
| Admin | 0% | $8,333 | $8,333 | $8,333 | $8,333 | $8,333 | $8,333 | $8,333 | $8,333 | $8,333 | $8,333 | $8,333 | $8,333 |
| Total People | 75 | 75 | 75 | 75 | 75 | 75 | 75 | 75 | 75 | 75 | 75 | 75 | |
| Total Payroll | $177,666 | $177,666 | $177,666 | $177,666 | $177,666 | $177,666 | $177,666 | $177,666 | $177,666 | $177,666 | $177,666 | $177,666 | |
| General Assumptions | |||||||||||||
| Month 1 | Month 2 | Month 3 | Month 4 | Month 5 | Month 6 | Month 7 | Month 8 | Month 9 | Month 10 | Month 11 | Month 12 | ||
| Plan Month | 1 | 2 | 3 | 4 | 5 | 6 | 7 | 8 | 9 | 10 | 11 | 12 | |
| Current Interest Rate | 10.00% | 10.00% | 10.00% | 10.00% | 10.00% | 10.00% | 10.00% | 10.00% | 10.00% | 10.00% | 10.00% | 10.00% | |
| Long-term Interest Rate | 10.00% | 10.00% | 10.00% | 10.00% | 10.00% | 10.00% | 10.00% | 10.00% | 10.00% | 10.00% | 10.00% | 10.00% | |
| Tax Rate | 30.00% | 25.00% | 25.00% | 25.00% | 25.00% | 25.00% | 25.00% | 25.00% | 25.00% | 25.00% | 25.00% | 25.00% | |
| Other | 0 | 0 | 0 | 0 | 0 | 0 | 0 | 0 | 0 | 0 | 0 | 0 | |
| Pro Forma Profit and Loss | |||||||||||||
| Month 1 | Month 2 | Month 3 | Month 4 | Month 5 | Month 6 | Month 7 | Month 8 | Month 9 | Month 10 | Month 11 | Month 12 | ||
| Sales | $492,250 | $471,250 | $461,250 | $461,250 | $461,250 | $451,250 | $441,250 | $451,250 | $451,250 | $461,250 | $462,250 | $472,250 | |
| Direct Cost of Sales | $106,583 | $106,583 | $106,583 | $106,583 | $106,583 | $106,583 | $106,583 | $106,583 | $106,583 | $106,583 | $106,583 | $106,583 | |
| Other | $0 | $0 | $0 | $0 | $0 | $0 | $0 | $0 | $0 | $0 | $0 | $0 | |
| Total Cost of Sales | $106,583 | $106,583 | $106,583 | $106,583 | $106,583 | $106,583 | $106,583 | $106,583 | $106,583 | $106,583 | $106,583 | $106,583 | |
| Gross Margin | $385,667 | $364,667 | $354,667 | $354,667 | $354,667 | $344,667 | $334,667 | $344,667 | $344,667 | $354,667 | $355,667 | $365,667 | |
| Gross Margin % | 78.35% | 77.38% | 76.89% | 76.89% | 76.89% | 76.38% | 75.85% | 76.38% | 76.38% | 76.89% | 76.94% | 77.43% | |
| Expenses | |||||||||||||
| Payroll | $177,666 | $177,666 | $177,666 | $177,666 | $177,666 | $177,666 | $177,666 | $177,666 | $177,666 | $177,666 | $177,666 | $177,666 | |
| Sales and Marketing and Other Expenses | $8,167 | $8,167 | $8,167 | $8,167 | $8,167 | $8,167 | $8,167 | $8,167 | $8,167 | $8,167 | $8,167 | $8,167 | |
| Depreciation | $1,667 | $1,667 | $1,667 | $1,667 | $1,667 | $1,667 | $1,667 | $1,667 | $1,667 | $1,667 | $1,667 | $1,667 | |
| Leased Equipment | $400 | $400 | $400 | $400 | $400 | $400 | $400 | $400 | $400 | $400 | $400 | $400 | |
| Utilities | $400 | $400 | $400 | $400 | $400 | $400 | $400 | $400 | $400 | $400 | $400 | $400 | |
| Insurance | $500 | $500 | $500 | $500 | $500 | $500 | $500 | $500 | $500 | $500 | $500 | $500 | |
| Rent | $1,200 | $1,200 | $1,200 | $1,200 | $1,200 | $1,200 | $1,200 | $1,200 | $1,200 | $1,200 | $1,200 | $1,200 | |
| Payroll Taxes | 15% | $26,650 | $26,650 | $26,650 | $26,650 | $26,650 | $26,650 | $26,650 | $26,650 | $26,650 | $26,650 | $26,650 | $26,650 |
| Other | $0 | $0 | $0 | $0 | $0 | $0 | $0 | $0 | $0 | $0 | $0 | $0 | |
| Total Operating Expenses | $216,650 | $216,650 | $216,650 | $216,650 | $216,650 | $216,650 | $216,650 | $216,650 | $216,650 | $216,650 | $216,650 | $216,650 | |
| Profit Before Interest and Taxes | $169,017 | $148,017 | $138,017 | $138,017 | $138,017 | $128,017 | $118,017 | $128,017 | $128,017 | $138,017 | $139,017 | $149,017 | |
| EBITDA | $170,684 | $149,684 | $139,684 | $139,684 | $139,684 | $129,684 | $119,684 | $129,684 | $129,684 | $139,684 | $140,684 | $150,684 | |
| Interest Expense | $3,032 | $2,940 | $2,848 | $2,756 | $2,664 | $2,572 | $2,480 | $2,388 | $2,296 | $2,204 | $2,112 | $2,020 | |
| Taxes Incurred | $49,795 | $36,269 | $33,792 | $33,815 | $33,838 | $31,361 | $28,884 | $31,407 | $31,430 | $33,953 | $34,226 | $36,749 | |
| Net Profit | $116,189 | $108,807 | $101,377 | $101,446 | $101,515 | $94,084 | $86,653 | $94,222 | $94,291 | $101,860 | $102,679 | $110,248 | |
| Net Profit/Sales | 23.60% | 23.09% | 21.98% | 21.99% | 22.01% | 20.85% | 19.64% | 20.88% | 20.90% | 22.08% | 22.21% | 23.35% | |
| Pro Forma Cash Flow | |||||||||||||
| Month 1 | Month 2 | Month 3 | Month 4 | Month 5 | Month 6 | Month 7 | Month 8 | Month 9 | Month 10 | Month 11 | Month 12 | ||
| Cash Received | |||||||||||||
| Cash from Operations | |||||||||||||
| Cash Sales | $123,063 | $117,813 | $115,313 | $115,313 | $115,313 | $112,813 | $110,313 | $112,813 | $112,813 | $115,313 | $115,563 | $118,063 | |
| Cash from Receivables | $0 | $12,306 | $368,663 | $353,188 | $345,938 | $345,938 | $345,688 | $338,188 | $331,188 | $338,438 | $338,688 | $345,963 | |
| Subtotal Cash from Operations | $123,063 | $130,119 | $483,975 | $468,500 | $461,250 | $458,750 | $456,000 | $451,000 | $444,000 | $453,750 | $454,250 | $464,025 | |
| Additional Cash Received | |||||||||||||
| Sales Tax, VAT, HST/GST Received | 0.00% | $0 | $0 | $0 | $0 | $0 | $0 | $0 | $0 | $0 | $0 | $0 | $0 |
| New Current Borrowing | $0 | $0 | $0 | $0 | $0 | $0 | $0 | $0 | $0 | $0 | $0 | $0 | |
| New Other Liabilities (interest-free) | $0 | $0 | $0 | $0 | $0 | $0 | $0 | $0 | $0 | $0 | $0 | $0 | |
| New Long-term Liabilities | $0 | $0 | $0 | $0 | $0 | $0 | $0 | $0 | $0 | $0 | $0 | $0 | |
| Sales of Other Current Assets | $0 | $0 | $0 | $0 | $0 | $0 | $0 | $0 | $0 | $0 | $0 | $0 | |
| Sales of Long-term Assets | $0 | $0 | $0 | $0 | $0 | $0 | $0 | $0 | $0 | $0 | $0 | $0 | |
| New Investment Received | $60,000 | $112,000 | $0 | $0 | $0 | $0 | $0 | $0 | $0 | $0 | $0 | $0 | |
| Subtotal Cash Received | $183,063 | $242,119 | $483,975 | $468,500 | $461,250 | $458,750 | $456,000 | $451,000 | $444,000 | $453,750 | $454,250 | $464,025 | |
| Expenditures | Month 1 | Month 2 | Month 3 | Month 4 | Month 5 | Month 6 | Month 7 | Month 8 | Month 9 | Month 10 | Month 11 | Month 12 | |
| Expenditures from Operations | |||||||||||||
| Cash Spending | $177,666 | $177,666 | $177,666 | $177,666 | $177,666 | $177,666 | $177,666 | $177,666 | $177,666 | $177,666 | $177,666 | $177,666 | |
| Bill Payments | $10,466 | $309,607 | $183,024 | $180,538 | $180,469 | $180,317 | $177,748 | $175,345 | $177,693 | $177,707 | $180,063 | $180,319 | |
| Subtotal Spent on Operations | $188,132 | $487,274 | $360,690 | $358,204 | $358,135 | $357,983 | $355,414 | $353,012 | $355,359 | $355,373 | $357,729 | $357,985 | |
| Additional Cash Spent | |||||||||||||
| Sales Tax, VAT, HST/GST Paid Out | $0 | $0 | $0 | $0 | $0 | $0 | $0 | $0 | $0 | $0 | $0 | $0 | |
| Principal Repayment of Current Borrowing | $6,000 | $6,000 | $6,000 | $6,000 | $6,000 | $6,000 | $6,000 | $6,000 | $6,000 | $6,000 | $6,000 | $6,000 | |
| Other Liabilities Principal Repayment | $0 | $0 | $0 | $0 | $0 | $0 | $0 | $0 | $0 | $0 | $0 | $0 | |
| Long-term Liabilities Principal Repayment | $5,049 | $5,049 | $5,049 | $5,049 | $5,049 | $5,049 | $5,049 | $5,049 | $5,049 | $5,049 | $5,049 | $5,049 | |
| Purchase Other Current Assets | $0 | $0 | $0 | $0 | $0 | $0 | $0 | $0 | $0 | $0 | $0 | $0 | |
| Purchase Long-term Assets | $83,333 | $83,333 | $83,333 | $83,333 | $83,333 | $83,333 | $83,333 | $83,333 | $83,333 | $83,333 | $83,333 | $83,333 | |
| Dividends | $0 | $0 | $0 | $0 | $0 | $0 | $0 | $0 | $0 | $0 | $0 | $0 | |
| Subtotal Cash Spent | $282,514 | $581,656 | $455,073 | $452,587 | $452,518 | $452,365 | $449,796 | $447,394 | $449,742 | $449,756 | $452,112 | $452,368 | |
| Net Cash Flow | ($99,452) | ($339,537) | $28,902 | $15,913 | $8,732 | $6,385 | $6,204 | $3,606 | ($5,742) | $3,994 | $2,138 | $11,657 | |
| Cash Balance | $350,548 | $11,011 | $39,913 | $55,826 | $64,558 | $70,943 | $77,147 | $80,753 | $75,011 | $79,005 | $81,143 | $92,801 | |
| Pro Forma Balance Sheet | |||||||||||||
| Month 1 | Month 2 | Month 3 | Month 4 | Month 5 | Month 6 | Month 7 | Month 8 | Month 9 | Month 10 | Month 11 | Month 12 | ||
| Assets | Starting Balances | ||||||||||||
| Current Assets | |||||||||||||
| Cash | $450,000 | $350,548 | $11,011 | $39,913 | $55,826 | $64,558 | $70,943 | $77,147 | $80,753 | $75,011 | $79,005 | $81,143 | $92,801 |
| Accounts Receivable | $0 | $369,188 | $710,319 | $687,594 | $680,344 | $680,344 | $672,844 | $658,094 | $658,344 | $665,594 | $673,094 | $681,094 | $689,319 |
| Inventory | $0 | $117,242 | $117,242 | $117,242 | $117,242 | $117,242 | $117,242 | $117,242 | $117,242 | $117,242 | $117,242 | $117,242 | $117,242 |
| Other Current Assets | $0 | $0 | $0 | $0 | $0 | $0 | $0 | $0 | $0 | $0 | $0 | $0 | $0 |
| Total Current Assets | $450,000 | $836,977 | $838,571 | $844,749 | $853,412 | $862,144 | $861,028 | $852,482 | $856,338 | $857,846 | $869,341 | $879,479 | $899,361 |
| Long-term Assets | |||||||||||||
| Long-term Assets | $0 | $83,333 | $166,667 | $250,000 | $333,333 | $416,667 | $500,000 | $583,333 | $666,667 | $750,000 | $833,333 | $916,667 | $1,000,000 |
| Accumulated Depreciation | $0 | $1,667 | $3,333 | $5,000 | $6,667 | $8,333 | $10,000 | $11,667 | $13,333 | $15,000 | $16,667 | $18,333 | $20,000 |
| Total Long-term Assets | $0 | $81,667 | $163,333 | $245,000 | $326,667 | $408,333 | $490,000 | $571,667 | $653,333 | $735,000 | $816,667 | $898,333 | $980,000 |
| Total Assets | $450,000 | $918,644 | $1,001,904 | $1,089,749 | $1,180,078 | $1,270,477 | $1,351,028 | $1,424,149 | $1,509,671 | $1,592,846 | $1,686,007 | $1,777,812 | $1,879,361 |
| Liabilities and Capital | Month 1 | Month 2 | Month 3 | Month 4 | Month 5 | Month 6 | Month 7 | Month 8 | Month 9 | Month 10 | Month 11 | Month 12 | |
| Current Liabilities | |||||||||||||
| Accounts Payable | $0 | $303,504 | $177,006 | $174,522 | $174,456 | $174,389 | $171,906 | $169,422 | $171,772 | $171,705 | $174,055 | $174,230 | $176,580 |
| Current Borrowing | $72,000 | $66,000 | $60,000 | $54,000 | $48,000 | $42,000 | $36,000 | $30,000 | $24,000 | $18,000 | $12,000 | $6,000 | $0 |
| Other Current Liabilities | $0 | $0 | $0 | $0 | $0 | $0 | $0 | $0 | $0 | $0 | $0 | $0 | $0 |
| Subtotal Current Liabilities | $72,000 | $369,504 | $237,006 | $228,522 | $222,456 | $216,389 | $207,906 | $199,422 | $195,772 | $189,705 | $186,055 | $180,230 | $176,580 |
| Long-term Liabilities | $302,945 | $297,896 | $292,847 | $287,798 | $282,749 | $277,700 | $272,651 | $267,602 | $262,552 | $257,503 | $252,454 | $247,405 | $242,356 |
| Total Liabilities | $374,945 | $667,400 | $529,853 | $516,320 | $505,204 | $494,089 | $480,556 | $467,024 | $458,324 | $447,209 | $438,509 | $427,635 | $418,936 |
| Paid-in Capital | $157,505 | $217,505 | $329,505 | $329,505 | $329,505 | $329,505 | $329,505 | $329,505 | $329,505 | $329,505 | $329,505 | $329,505 | $329,505 |
| Retained Earnings | ($82,450) | ($82,450) | ($82,450) | ($82,450) | ($82,450) | ($82,450) | ($82,450) | ($82,450) | ($82,450) | ($82,450) | ($82,450) | ($82,450) | ($82,450) |
| Earnings | $0 | $116,189 | $224,997 | $326,373 | $427,819 | $529,334 | $623,417 | $710,070 | $804,292 | $898,583 | $1,000,443 | $1,103,122 | $1,213,370 |
| Total Capital | $75,055 | $251,244 | $472,052 | $573,428 | $674,874 | $776,389 | $870,472 | $957,125 | $1,051,347 | $1,145,638 | $1,247,498 | $1,350,177 | $1,460,425 |
| Total Liabilities and Capital | $450,000 | $918,644 | $1,001,904 | $1,089,749 | $1,180,078 | $1,270,477 | $1,351,028 | $1,424,149 | $1,509,671 | $1,592,846 | $1,686,007 | $1,777,812 | $1,879,361 |
| Net Worth | $75,055 | $251,244 | $472,052 | $573,428 | $674,874 | $776,389 | $870,472 | $957,125 | $1,051,347 | $1,145,638 | $1,247,498 | $1,350,177 | $1,460,425 |


