
Passion Soles
Executive Summary
Passion Soles is a women-only shoe store in Eugene, OR. Eugene badly needs an upscale shoe store for women because the current stores have an inadequate selection. Currently, women that need a special pair of shoes often must travel up to Portland to find the right shoes.
Passion Soles will have an unmatched, extensive selection of different shoes. Generally, the size of Passion Soles’ selection is cost prohibitive due to all the different sizes that must be stocked per style. Passion Soles has a unique business model that allows them to have an extensive selection at the cost of only stocking one size per style. This is accomplished through a special relationship with the wholesaler so Passion Soles can receive a customer’s needed size within two days. Rush overnight shipping is available at additional cost.
Passion Soles will leverage Holly Heels’ extensive knowledge of the women’s retail shoe industry to quickly gain market share. Profitability will be reached by month ten and $284,000 will be generated in revenue in year three.
1.1 Keys to Success
The key to success is to meet the demand for an upscale women’s shoe store with a wide selection and focused customer attention.
1.2 Objectives
The objectives for the first three years of operation include:
- To create a product-based retail store whose primary goal is to exceed customer’s expectations.
- To increase the number of clients served by 20% per year by serving an unmet need with outstanding selection and customer service.
- To develop a start-up business, surviving off of its own cash flow.
1.3 Mission
Passion Soles’ mission is to provide Eugene with an upscale selection of women’s shoes and outstanding customer service. We exist to attract and maintain customers. When we adhere to this maxim, everything else will fall into place. Our services will exceed the expectations of our customers.
Company Summary
Passion Soles is an upscale women’s shoe store located in Eugene, OR., an un-serviced niche. Customers looking for these shoes must travel up to Portland. Passion Soles will be able to offer a wide selection because they will typically only have one size available per style. This one size is used as a demonstrative model. All other sizes are available within two days.
2.1 Company Ownership
Passion Soles is a sole proprietorship owned by Holly Heels.
2.2 Start-up Summary
Passion Soles will incur the following start-up costs:
- Computer system with CD-RW, printer, Microsoft Office, QuickBooks Pro, and POS software.
- POS terminal/cash register.
- Back office desk and chair.
- Front of store counter.
- Shelving racks.
- Display racks.
- Chairs, mirrors.
- Assorted halogen track lighting.
Please note that the following items which are considered assets to be used for more than a year will labeled long-term assets and will be depreciated using G.A.A.P. approved straight-line depreciation method.
| Start-up Funding | |
| Start-up Expenses to Fund | $600 |
| Start-up Assets to Fund | $29,400 |
| Total Funding Required | $30,000 |
| Assets | |
| Non-cash Assets from Start-up | $14,368 |
| Cash Requirements from Start-up | $20,032 |
| Additional Cash Raised | $0 |
| Cash Balance on Starting Date | $20,032 |
| Total Assets | $34,400 |
| Liabilities and Capital | |
| Liabilities | |
| Current Borrowing | $0 |
| Long-term Liabilities | $0 |
| Accounts Payable (Outstanding Bills) | $0 |
| Other Current Liabilities (interest-free) | $0 |
| Total Liabilities | $0 |
| Capital | |
| Planned Investment | |
| Holly | $30,000 |
| Other | $0 |
| Additional Investment Requirement | $0 |
| Total Planned Investment | $30,000 |
| Loss at Start-up (Start-up Expenses) | ($600) |
| Total Capital | $29,400 |
| Total Capital and Liabilities | $29,400 |
| Total Funding | $30,000 |
| Start-up | |
| Requirements | |
| Start-up Expenses | |
| Legal | $500 |
| Stationery etc. | $100 |
| Other | $0 |
| Total Start-up Expenses | $600 |
| Start-up Assets | |
| Cash Required | $20,032 |
| Other Current Assets | $0 |
| Long-term Assets | $9,368 |
| Total Assets | $29,400 |
| Total Requirements | $30,000 |
Products
Passion Soles will sell upscale women’s shoes. The general categories of shoes that will be sold are:
- Sandals
- Stylish work shoes
- Loafers
- Dress shoes
- Canvas athletic/stylish shoes
Passion Soles will strive to have one of the largest selection of shoes in Oregon, barring the larger stores in Portland. Passion Soles will accomplish this by having one size per style in stock as a demonstration model. Passion Soles will then order the style in the needed size and it will arrive within two days (rush one day service is available). This will be accomplished through a special relationship with the wholesaler who is able to send out the right size in the right style on demand. Often a wholesaler will be unwilling to ship out individual shoes, but Passion Soles was able to secure an exclusive arrangement with a its wholesaler to meet this need.
Market Analysis Summary
Passion Soles will be targeting two distinct groups of fashion-concious female shoppers–professional workers and housewives. While both groups are interested in dress shoes, the professionals will also be looking for fashionable shoes they are able to wear with their business attire. The housewives might be looking for fasionable but more casual shoes.
4.1 Market Segmentation
Passion Soles is targeting two different population segments within the broad category of the fashion-conscious female with disposable income.
- Professionals: these are full-time working professional women. They typically earn more than $45,000. They will purchase shoes for the workplace, as well as for leisure time.
- Housewives: The household income of this group is $60k-$120k, generally toward the higher end of this range.

| Market Analysis | |||||||
| Year 1 | Year 2 | Year 3 | Year 4 | Year 5 | |||
| Potential Customers | Growth | CAGR | |||||
| Professionals | 9% | 12,457 | 13,578 | 14,800 | 16,132 | 17,584 | 9.00% |
| Housewives | 8% | 14,544 | 15,708 | 16,965 | 18,322 | 19,788 | 8.00% |
| Other | 0% | 0 | 0 | 0 | 0 | 0 | 0.00% |
| Total | 8.47% | 27,001 | 29,286 | 31,765 | 34,454 | 37,372 | 8.47% |
4.2 Target Market Segment Strategy
These markets will be targeted through an attractive, eye-catching storefront in a popular mall. Most women within the target market shop at malls. Malls allow them to visit many different stores within the same vicinity. By just having a visible storefront in a well traveled mall, Passion Soles will receive walk-through customers.
While the leased space in a mall is expensive, one of the benefits that you pay for is the mall association which spends money on marketing the mall and the stores within the mall.
4.3 Industry Analysis
Women’s shoe retail industry is made up of several different types of companies:
- Shoe-only stores: As the name implies, these stores only sell shoes. Generally the shoe-only stores will either sell athletic shoes for men and women, or dress shoes for only one sex.
- Large department stores: these types of stores sell everything, including shoes.
- Small women’s retail stores: these types of stores cater to women by only selling women’s clothing and shoes.
4.3.1 Competition and Buying Patterns
Passion Soles has three direct competitors in Eugene:
- (name omitted). This is a women’s only clothing and shoe store. They have a nice selection of clothing but a poor selection of shoes. The shoe styles are not cutting edge. The price point for the shoes is $30-$120.
- (name omitted). This is a large, complete, department store. The store however, suffers from cluttered displays and a general sense of disorganization. Shoes here are $30-$120.
- (name omitted). This is a national franchise that only sells shoes, for both men and women. This company will sell knock-offs, shoes just like name brands, but with their name on it. While this store has a huge selection, the quality of the shoes leaves a lot to be desired. This is somewhat understandable as the shoes typically sell for $13-$50. While the shoes are often good copies of famous brands, the execution is sometimes off. Many of the shoes are made out of pleather and look like they were dipped in wax, giving them a tacky appearance.
An indirect competitor is a shoe smith that will dye shoes. The shoes are typically dyed to match a specific dress. Not all colors can be dyed, and dying in general is not the ideal situation. Dying shoes creates a new shoe color that is acceptable only 20% of the time.

The two major competitors in Portland are:
- Nordstroms: mid- to high-end department store known for their outstanding customer service. The shoe price point is $60-$300.
- Saks: this department store caters to the high class, older crowd. Shoes range from $75-$400.
The buying habits for fashion-conscious women consist of typically buying at least one pair of shoes per month. Women generally purchase a pair of shoes to go with a specific dress. Once the woman purchases the dress she will then begin the sometimes long search for the perfect pair of shoes.
Strategy and Implementation Summary
Passion Soles will leverage their competitive edge of extensive selection to drive sales. This is indeed a competitive edge because it is typically cost prohibitive for a store to have as much of a selection that Passion Soles will offer. Because of a unique business model, Passion Soles is able to leverage their financial resources and offer an unmatched selection. This is done by carrying a large selection of styles by only stocking one size per style. Once the customer has chosen the style, Passion Soles will have the customer’s shoes in one to two days.
5.1 Sales Strategy
Passion Soles’ sales strategy will be based on display and visibility. A highly visible store with attractive product displays located in the mall will get a high percentage of foot traffic. This is especially the case for a women’s shoe store. Women love to shop for shoes. Some women even use shoe shopping as a form of therapy, similar to eating chocolate. These activities can make them feel better.
The sales strategy will simply be, have the most complete selection of shoes. Assuming the prices are reasonable, having an extensive selection will drive sales because we believe our target markets of fashion-conscious females are always looking for the perfect pair of shoes to coordinate with their fashion style.
5.1.1 Sales Forecast
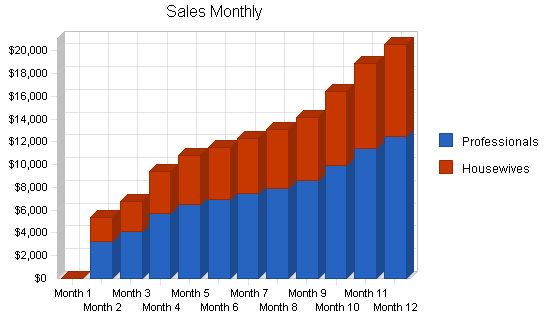
The first month will be used to set up the store front. The first employee will be hired and display inventory will be purchased. There will be no sales activity during the first month. The second month will begin to see sales activity, and it is forecasted that around month four sales will really begin to pick up. The reason for this is that word will get out about Passion Soles and more and more people will be coming in to check out the extensive selection. A third employee will be hired in December for the holiday season.
| Sales Forecast | |||
| Year 1 | Year 2 | Year 3 | |
| Sales | |||
| Professionals | $84,402 | $118,745 | $135,454 |
| Housewives | $54,861 | $89,184 | $102,095 |
| Total Sales | $139,263 | $207,929 | $237,549 |
| Direct Cost of Sales | Year 1 | Year 2 | Year 3 |
| Professionals | $33,761 | $47,498 | $54,182 |
| Housewives | $21,945 | $35,674 | $40,838 |
| Subtotal Direct Cost of Sales | $55,705 | $83,172 | $95,020 |
5.2 Milestones
Passion Soles will have several milestones early on:
- Business plan completion. This will be done as a road map for the organization. This will be an indispensable tool for the ongoing performance and improvement of the company.
- Set up the store front.
- Revenues exceeding $75,000.
- Profitability.
| Milestones | |||||
| Milestone | Start Date | End Date | Budget | Manager | Department |
| Business plan completion | 1/1/2001 | 2/1/2001 | $0 | ABC | Marketing |
| Set up the store front | 1/1/2001 | 2/1/2001 | $0 | ABC | Department |
| Revenues exceeding $75,000 | 1/1/2001 | 9/31/2001 | $0 | ABC | Department |
| Profitability | 1/1/2001 | 10/31/2001 | $0 | ABC | Department |
| Totals | $0 | ||||
5.3 Competitive Edge
Passion Soles’ competitive edge is an unmatched selection in Eugene. This selection will be achieved in two ways. The first way is a very specific effort to carry as many styles of shoes as possible. Passion Soles recognizes that Eugene currently does not have a single store that offers a wide selection of decent quality shoes for the fashion conscious female consumer. The competitive edge is the recognition of this unserved niche and the serving of this demand.
Passion Soles will be able to offer a large selection through a unique inventory model that stocks only one size per style. The advantage is that for the same amount of money that Passion Soles invests in overhead, they can offer far more styles.
This model is effective because women are willing to order a pair of shoes sight seen but not fitted. Passion Soles offers two day delivery with an additional expense rush overnight option.
Management Summary
Holly Heels, the founder and owner received her Bachelor of Arts in marketing from the University of Portland. Throughout college, and full time after graduation, Holly worked at Nordstroms. She started out as a sales person in the Nordstroms outerwear department, where Holly was named employee of the month five times. This caught the attention of her supervisors and after one year of full-time work at Nordstroms, she was offered a position as the assistant manager of the women’s shoe department.
Holly worked as the assistant manager for one and a half years before receiving a promotion to manager of the department, a huge responsibility and honor. Holly learned all of the “ins and outs” of the Nordstroms retail shoe industry in this job. After three years, Holly decided to leave and seek another job. She had always wanted to live in a smaller town and, upon visiting a friend in Eugene, began to do some market research about the women’s shoe industry in Eugene. She realized that there was an unmet demand for fashionable shoes and she began to write a business plan to serve this need. She was confident that she would be able to leverage all of her industry knowledge and create a store in Eugene serving fashion-conscious women.
6.1 Personnel Plan
Holly will be working full time at Passion Soles. She will be in charge of all administrative details, hiring, inventory management, etc. Beginning with month two, Holly will hire a full-time sales clerk to help her at the store. By December, she will hire an additional full-time employee in time for the holiday season.
| Personnel Plan | |||
| Year 1 | Year 2 | Year 3 | |
| Holly | $36,000 | $40,000 | $42,000 |
| Full-time employee | $17,600 | $19,200 | $19,200 |
| Full-time employee | $1,600 | $19,200 | $19,200 |
| Total People | 3 | 3 | 3 |
| Total Payroll | $55,200 | $78,400 | $80,400 |
Financial Plan
The following sections will outline important financial information.
7.1 Important Assumptions
The following table details important financial assumptions.
| General Assumptions | |||
| Year 1 | Year 2 | Year 3 | |
| Plan Month | 1 | 2 | 3 |
| Current Interest Rate | 10.00% | 10.00% | 10.00% |
| Long-term Interest Rate | 10.00% | 10.00% | 10.00% |
| Tax Rate | 30.00% | 30.00% | 30.00% |
| Other | 0 | 0 | 0 |
7.2 Break-even Analysis
The Break-even Analysis indicates that approximately $13,000 is needed in monthly revenue to reach the break-even point.

| Break-even Analysis | |
| Monthly Revenue Break-even | $12,369 |
| Assumptions: | |
| Average Percent Variable Cost | 40% |
| Estimated Monthly Fixed Cost | $7,421 |
7.3 Projected Profit and Loss
The following table will indicate projected profit and loss. We estimate purchase of new shoe display inventory, primarily for the seasonal changes in styles. Because these are displays, we are tracking them as expenses. It is estimated that new styles (especially around the change in seasons) will require regular purchase of shoe displays as part of the normal course of business.

| Pro Forma Profit and Loss | |||
| Year 1 | Year 2 | Year 3 | |
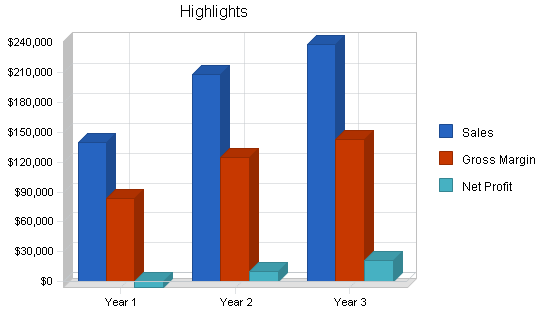
| Sales | $139,263 | $207,929 | $237,549 |
| Direct Cost of Sales | $55,705 | $83,172 | $95,020 |
| Other Production Expenses | $0 | $0 | $0 |
| Total Cost of Sales | $55,705 | $83,172 | $95,020 |
| Gross Margin | $83,558 | $124,757 | $142,529 |
| Gross Margin % | 60.00% | 60.00% | 60.00% |
| Expenses | |||
| Payroll | $55,200 | $78,400 | $80,400 |
| Sales and Marketing and Other Expenses | $1,200 | $1,200 | $1,200 |
| Depreciation | $1,056 | $1,056 | $1,056 |
| Shoe Display Inventory | $7,000 | $5,000 | $5,000 |
| Utilities | $1,200 | $1,200 | $1,200 |
| Insurance | $1,800 | $1,800 | $1,800 |
| Rent | $21,600 | $21,600 | $21,600 |
| Payroll Taxes | $0 | $0 | $0 |
| Other | $0 | $0 | $0 |
| Total Operating Expenses | $89,056 | $110,256 | $112,256 |
| Profit Before Interest and Taxes | ($5,498) | $14,501 | $30,273 |
| EBITDA | ($4,442) | $15,557 | $31,329 |
| Interest Expense | $255 | $224 | $37 |
| Taxes Incurred | $0 | $4,283 | $9,071 |
| Net Profit | ($5,753) | $9,994 | $21,165 |
| Net Profit/Sales | -4.13% | 4.81% | 8.91% |
7.4 Projected Cash Flow
The following chart and table will indicate projected cash flow. We anticipate borrowing $5,000 in June to cover shoe display inventory purchases and other expenses.

| Pro Forma Cash Flow | |||
| Year 1 | Year 2 | Year 3 | |
| Cash Received | |||
| Cash from Operations | |||
| Cash Sales | $139,263 | $207,929 | $237,549 |
| Subtotal Cash from Operations | $139,263 | $207,929 | $237,549 |
| Additional Cash Received | |||
| Sales Tax, VAT, HST/GST Received | $0 | $0 | $0 |
| New Current Borrowing | $5,000 | $0 | $0 |
| New Other Liabilities (interest-free) | $0 | $0 | $0 |
| New Long-term Liabilities | $0 | $0 | $0 |
| Sales of Other Current Assets | $0 | $0 | $0 |
| Sales of Long-term Assets | $0 | $0 | $0 |
| New Investment Received | $0 | $0 | $0 |
| Subtotal Cash Received | $144,263 | $207,929 | $237,549 |
| Expenditures | Year 1 | Year 2 | Year 3 |
| Expenditures from Operations | |||
| Cash Spending | $55,200 | $78,400 | $80,400 |
| Bill Payments | $78,704 | $118,797 | $133,576 |
| Subtotal Spent on Operations | $133,904 | $197,197 | $213,976 |
| Additional Cash Spent | |||
| Sales Tax, VAT, HST/GST Paid Out | $0 | $0 | $0 |
| Principal Repayment of Current Borrowing | $1,260 | $3,000 | $740 |
| Other Liabilities Principal Repayment | $0 | $0 | $0 |
| Long-term Liabilities Principal Repayment | $0 | $0 | $0 |
| Purchase Other Current Assets | $0 | $0 | $0 |
| Purchase Long-term Assets | $0 | $0 | $0 |
| Dividends | $0 | $0 | $0 |
| Subtotal Cash Spent | $135,164 | $200,197 | $214,716 |
| Net Cash Flow | $9,099 | $7,732 | $22,833 |
| Cash Balance | $29,131 | $36,863 | $59,697 |
7.5 Projected Balance Sheet
The following table will indicate the projected balance sheet.
| Pro Forma Balance Sheet | |||
| Year 1 | Year 2 | Year 3 | |
| Assets | |||
| Current Assets | |||
| Cash | $29,131 | $36,863 | $59,697 |
| Other Current Assets | $0 | $0 | $0 |
| Total Current Assets | $29,131 | $36,863 | $59,697 |
| Long-term Assets | |||
| Long-term Assets | $9,368 | $9,368 | $9,368 |
| Accumulated Depreciation | $1,056 | $2,112 | $3,168 |
| Total Long-term Assets | $8,312 | $7,256 | $6,200 |
| Total Assets | $37,443 | $44,119 | $65,897 |
| Liabilities and Capital | Year 1 | Year 2 | Year 3 |
| Current Liabilities | |||
| Accounts Payable | $10,056 | $9,738 | $11,090 |
| Current Borrowing | $3,740 | $740 | $0 |
| Other Current Liabilities | $0 | $0 | $0 |
| Subtotal Current Liabilities | $13,796 | $10,478 | $11,090 |
| Long-term Liabilities | $0 | $0 | $0 |
| Total Liabilities | $13,796 | $10,478 | $11,090 |
| Paid-in Capital | $30,000 | $30,000 | $30,000 |
| Retained Earnings | ($600) | ($6,353) | $3,641 |
| Earnings | ($5,753) | $9,994 | $21,165 |
| Total Capital | $23,647 | $33,641 | $54,807 |
| Total Liabilities and Capital | $37,443 | $44,119 | $65,897 |
| Net Worth | $23,647 | $33,641 | $54,807 |
7.6 Business Ratios
The following table compares our ratios to Standard Industry Code #3144 (Women’s footwear, except athletic).
| Ratio Analysis | ||||
| Year 1 | Year 2 | Year 3 | Industry Profile | |
| Sales Growth | 0.00% | 49.31% | 14.25% | 10.45% |
| Percent of Total Assets | ||||
| Other Current Assets | 0.00% | 0.00% | 0.00% | 33.22% |
| Total Current Assets | 77.80% | 83.55% | 90.59% | 85.17% |
| Long-term Assets | 22.20% | 16.45% | 9.41% | 14.83% |
| Total Assets | 100.00% | 100.00% | 100.00% | 100.00% |
| Current Liabilities | 36.85% | 23.75% | 16.83% | 26.82% |
| Long-term Liabilities | 0.00% | 0.00% | 0.00% | 25.97% |
| Total Liabilities | 36.85% | 23.75% | 16.83% | 52.79% |
| Net Worth | 63.15% | 76.25% | 83.17% | 47.21% |
| Percent of Sales | ||||
| Sales | 100.00% | 100.00% | 100.00% | 100.00% |
| Gross Margin | 60.00% | 60.00% | 60.00% | 22.01% |
| Selling, General & Administrative Expenses | 74.12% | 49.27% | 48.20% | 10.93% |
| Advertising Expenses | 0.43% | 0.23% | 0.21% | 1.05% |
| Profit Before Interest and Taxes | -3.95% | 6.97% | 12.74% | 2.49% |
| Main Ratios | ||||
| Current | 2.11 | 3.52 | 5.38 | 2.58 |
| Quick | 2.11 | 3.52 | 5.38 | 1.37 |
| Total Debt to Total Assets | 36.85% | 23.75% | 16.83% | 57.34% |
| Pre-tax Return on Net Worth | -24.33% | 42.44% | 55.17% | 6.10% |
| Pre-tax Return on Assets | -15.36% | 32.36% | 45.88% | 14.29% |
| Additional Ratios | Year 1 | Year 2 | Year 3 | |
| Net Profit Margin | -4.13% | 4.81% | 8.91% | n.a |
| Return on Equity | -24.33% | 29.71% | 38.62% | n.a |
| Activity Ratios | ||||
| Accounts Payable Turnover | 8.83 | 12.17 | 12.17 | n.a |
| Payment Days | 27 | 30 | 28 | n.a |
| Total Asset Turnover | 3.72 | 4.71 | 3.60 | n.a |
| Debt Ratios | ||||
| Debt to Net Worth | 0.58 | 0.31 | 0.20 | n.a |
| Current Liab. to Liab. | 1.00 | 1.00 | 1.00 | n.a |
| Liquidity Ratios | ||||
| Net Working Capital | $15,335 | $26,385 | $48,607 | n.a |
| Interest Coverage | -21.57 | 64.74 | 818.20 | n.a |
| Additional Ratios | ||||
| Assets to Sales | 0.27 | 0.21 | 0.28 | n.a |
| Current Debt/Total Assets | 37% | 24% | 17% | n.a |
| Acid Test | 2.11 | 3.52 | 5.38 | n.a |
| Sales/Net Worth | 5.89 | 6.18 | 4.33 | n.a |
| Dividend Payout | 0.00 | 0.00 | 0.00 | n.a |
Appendix
| Sales Forecast | |||||||||||||
| Month 1 | Month 2 | Month 3 | Month 4 | Month 5 | Month 6 | Month 7 | Month 8 | Month 9 | Month 10 | Month 11 | Month 12 | ||
| Sales | |||||||||||||
| Professionals | 0% | $0 | $3,245 | $4,114 | $5,678 | $6,545 | $6,985 | $7,454 | $7,945 | $8,569 | $9,956 | $11,454 | $12,457 |
| Housewives | 0% | $0 | $2,109 | $2,674 | $3,691 | $4,254 | $4,540 | $4,845 | $5,164 | $5,570 | $6,471 | $7,445 | $8,097 |
| Total Sales | $0 | $5,354 | $6,788 | $9,369 | $10,799 | $11,525 | $12,299 | $13,109 | $14,139 | $16,427 | $18,899 | $20,554 | |
| Direct Cost of Sales | Month 1 | Month 2 | Month 3 | Month 4 | Month 5 | Month 6 | Month 7 | Month 8 | Month 9 | Month 10 | Month 11 | Month 12 | |
| Professionals | $0 | $1,298 | $1,646 | $2,271 | $2,618 | $2,794 | $2,982 | $3,178 | $3,428 | $3,982 | $4,582 | $4,983 | |
| Housewives | $0 | $844 | $1,070 | $1,476 | $1,702 | $1,816 | $1,938 | $2,066 | $2,228 | $2,589 | $2,978 | $3,239 | |
| Subtotal Direct Cost of Sales | $0 | $2,142 | $2,715 | $3,747 | $4,320 | $4,610 | $4,920 | $5,244 | $5,656 | $6,571 | $7,560 | $8,222 | |
| Personnel Plan | |||||||||||||
| Month 1 | Month 2 | Month 3 | Month 4 | Month 5 | Month 6 | Month 7 | Month 8 | Month 9 | Month 10 | Month 11 | Month 12 | ||
| Holly | 0% | $3,000 | $3,000 | $3,000 | $3,000 | $3,000 | $3,000 | $3,000 | $3,000 | $3,000 | $3,000 | $3,000 | $3,000 |
| Full-time employee | 0% | $0 | $1,600 | $1,600 | $1,600 | $1,600 | $1,600 | $1,600 | $1,600 | $1,600 | $1,600 | $1,600 | $1,600 |
| Full-time employee | 0% | $0 | $0 | $0 | $0 | $0 | $0 | $0 | $0 | $0 | $0 | $0 | $1,600 |
| Total People | 1 | 2 | 2 | 2 | 2 | 2 | 2 | 2 | 2 | 2 | 2 | 3 | |
| Total Payroll | $3,000 | $4,600 | $4,600 | $4,600 | $4,600 | $4,600 | $4,600 | $4,600 | $4,600 | $4,600 | $4,600 | $6,200 | |
| General Assumptions | |||||||||||||
| Month 1 | Month 2 | Month 3 | Month 4 | Month 5 | Month 6 | Month 7 | Month 8 | Month 9 | Month 10 | Month 11 | Month 12 | ||
| Plan Month | 1 | 2 | 3 | 4 | 5 | 6 | 7 | 8 | 9 | 10 | 11 | 12 | |
| Current Interest Rate | 10.00% | 10.00% | 10.00% | 10.00% | 10.00% | 10.00% | 10.00% | 10.00% | 10.00% | 10.00% | 10.00% | 10.00% | |
| Long-term Interest Rate | 10.00% | 10.00% | 10.00% | 10.00% | 10.00% | 10.00% | 10.00% | 10.00% | 10.00% | 10.00% | 10.00% | 10.00% | |
| Tax Rate | 30.00% | 30.00% | 30.00% | 30.00% | 30.00% | 30.00% | 30.00% | 30.00% | 30.00% | 30.00% | 30.00% | 30.00% | |
| Other | 0 | 0 | 0 | 0 | 0 | 0 | 0 | 0 | 0 | 0 | 0 | 0 | |
| Pro Forma Profit and Loss | |||||||||||||
| Month 1 | Month 2 | Month 3 | Month 4 | Month 5 | Month 6 | Month 7 | Month 8 | Month 9 | Month 10 | Month 11 | Month 12 | ||
| Sales | $0 | $5,354 | $6,788 | $9,369 | $10,799 | $11,525 | $12,299 | $13,109 | $14,139 | $16,427 | $18,899 | $20,554 | |
| Direct Cost of Sales | $0 | $2,142 | $2,715 | $3,747 | $4,320 | $4,610 | $4,920 | $5,244 | $5,656 | $6,571 | $7,560 | $8,222 | |
| Other Production Expenses | $0 | $0 | $0 | $0 | $0 | $0 | $0 | $0 | $0 | $0 | $0 | $0 | |
| Total Cost of Sales | $0 | $2,142 | $2,715 | $3,747 | $4,320 | $4,610 | $4,920 | $5,244 | $5,656 | $6,571 | $7,560 | $8,222 | |
| Gross Margin | $0 | $3,213 | $4,073 | $5,621 | $6,480 | $6,915 | $7,379 | $7,866 | $8,483 | $9,856 | $11,339 | $12,332 | |
| Gross Margin % | 0.00% | 60.00% | 60.00% | 60.00% | 60.00% | 60.00% | 60.00% | 60.00% | 60.00% | 60.00% | 60.00% | 60.00% | |
| Expenses | |||||||||||||
| Payroll | $3,000 | $4,600 | $4,600 | $4,600 | $4,600 | $4,600 | $4,600 | $4,600 | $4,600 | $4,600 | $4,600 | $6,200 | |
| Sales and Marketing and Other Expenses | $100 | $100 | $100 | $100 | $100 | $100 | $100 | $100 | $100 | $100 | $100 | $100 | |
| Depreciation | $88 | $88 | $88 | $88 | $88 | $88 | $88 | $88 | $88 | $88 | $88 | $88 | |
| Shoe Display Inventory | $5,000 | $0 | $0 | $0 | $2,000 | $0 | $0 | $0 | $0 | $0 | $0 | $0 | |
| Utilities | $100 | $100 | $100 | $100 | $100 | $100 | $100 | $100 | $100 | $100 | $100 | $100 | |
| Insurance | $150 | $150 | $150 | $150 | $150 | $150 | $150 | $150 | $150 | $150 | $150 | $150 | |
| Rent | $1,800 | $1,800 | $1,800 | $1,800 | $1,800 | $1,800 | $1,800 | $1,800 | $1,800 | $1,800 | $1,800 | $1,800 | |
| Payroll Taxes | 15% | $0 | $0 | $0 | $0 | $0 | $0 | $0 | $0 | $0 | $0 | $0 | $0 |
| Other | $0 | $0 | $0 | $0 | $0 | $0 | $0 | $0 | $0 | $0 | $0 | $0 | |
| Total Operating Expenses | $10,238 | $6,838 | $6,838 | $6,838 | $8,838 | $6,838 | $6,838 | $6,838 | $6,838 | $6,838 | $6,838 | $8,438 | |
| Profit Before Interest and Taxes | ($10,238) | ($3,625) | ($2,765) | ($1,217) | ($2,358) | $77 | $541 | $1,028 | $1,645 | $3,018 | $4,501 | $3,894 | |
| EBITDA | ($10,150) | ($3,537) | ($2,677) | ($1,129) | ($2,270) | $165 | $629 | $1,116 | $1,733 | $3,106 | $4,589 | $3,982 | |
| Interest Expense | $0 | $0 | $0 | $0 | $0 | $42 | $40 | $38 | $36 | $35 | $33 | $31 | |
| Taxes Incurred | $0 | $0 | $0 | $0 | $0 | $0 | $0 | $0 | $0 | $0 | $0 | $0 | |
| Net Profit | ($10,238) | ($3,625) | ($2,765) | ($1,217) | ($2,358) | $35 | $502 | $989 | $1,609 | $2,984 | $4,469 | $3,863 | |
| Net Profit/Sales | 0.00% | -67.71% | -40.74% | -12.99% | -21.84% | 0.31% | 4.08% | 7.55% | 11.38% | 18.16% | 23.64% | 18.80% | |
| Pro Forma Cash Flow | |||||||||||||
| Month 1 | Month 2 | Month 3 | Month 4 | Month 5 | Month 6 | Month 7 | Month 8 | Month 9 | Month 10 | Month 11 | Month 12 | ||
| Cash Received | |||||||||||||
| Cash from Operations | |||||||||||||
| Cash Sales | $0 | $5,354 | $6,788 | $9,369 | $10,799 | $11,525 | $12,299 | $13,109 | $14,139 | $16,427 | $18,899 | $20,554 | |
| Subtotal Cash from Operations | $0 | $5,354 | $6,788 | $9,369 | $10,799 | $11,525 | $12,299 | $13,109 | $14,139 | $16,427 | $18,899 | $20,554 | |
| Additional Cash Received | |||||||||||||
| Sales Tax, VAT, HST/GST Received | 0.00% | $0 | $0 | $0 | $0 | $0 | $0 | $0 | $0 | $0 | $0 | $0 | $0 |
| New Current Borrowing | $0 | $0 | $0 | $0 | $0 | $5,000 | $0 | $0 | $0 | $0 | $0 | $0 | |
| New Other Liabilities (interest-free) | $0 | $0 | $0 | $0 | $0 | $0 | $0 | $0 | $0 | $0 | $0 | $0 | |
| New Long-term Liabilities | $0 | $0 | $0 | $0 | $0 | $0 | $0 | $0 | $0 | $0 | $0 | $0 | |
| Sales of Other Current Assets | $0 | $0 | $0 | $0 | $0 | $0 | $0 | $0 | $0 | $0 | $0 | $0 | |
| Sales of Long-term Assets | $0 | $0 | $0 | $0 | $0 | $0 | $0 | $0 | $0 | $0 | $0 | $0 | |
| New Investment Received | $0 | $0 | $0 | $0 | $0 | $0 | $0 | $0 | $0 | $0 | $0 | $0 | |
| Subtotal Cash Received | $0 | $5,354 | $6,788 | $9,369 | $10,799 | $16,525 | $12,299 | $13,109 | $14,139 | $16,427 | $18,899 | $20,554 | |
| Expenditures | Month 1 | Month 2 | Month 3 | Month 4 | Month 5 | Month 6 | Month 7 | Month 8 | Month 9 | Month 10 | Month 11 | Month 12 | |
| Expenditures from Operations | |||||||||||||
| Cash Spending | $3,000 | $4,600 | $4,600 | $4,600 | $4,600 | $4,600 | $4,600 | $4,600 | $4,600 | $4,600 | $4,600 | $6,200 | |
| Bill Payments | $238 | $7,055 | $4,311 | $4,900 | $5,983 | $8,414 | $6,812 | $7,120 | $7,446 | $7,872 | $8,789 | $9,765 | |
| Subtotal Spent on Operations | $3,238 | $11,655 | $8,911 | $9,500 | $10,583 | $13,014 | $11,412 | $11,720 | $12,046 | $12,472 | $13,389 | $15,965 | |
| Additional Cash Spent | |||||||||||||
| Sales Tax, VAT, HST/GST Paid Out | $0 | $0 | $0 | $0 | $0 | $0 | $0 | $0 | $0 | $0 | $0 | $0 | |
| Principal Repayment of Current Borrowing | $0 | $0 | $0 | $0 | $0 | $0 | $210 | $210 | $210 | $210 | $210 | $210 | |
| Other Liabilities Principal Repayment | $0 | $0 | $0 | $0 | $0 | $0 | $0 | $0 | $0 | $0 | $0 | $0 | |
| Long-term Liabilities Principal Repayment | $0 | $0 | $0 | $0 | $0 | $0 | $0 | $0 | $0 | $0 | $0 | $0 | |
| Purchase Other Current Assets | $0 | $0 | $0 | $0 | $0 | $0 | $0 | $0 | $0 | $0 | $0 | $0 | |
| Purchase Long-term Assets | $0 | $0 | $0 | $0 | $0 | $0 | $0 | $0 | $0 | $0 | $0 | $0 | |
| Dividends | $0 | $0 | $0 | $0 | $0 | $0 | $0 | $0 | $0 | $0 | $0 | $0 | |
| Subtotal Cash Spent | $3,238 | $11,655 | $8,911 | $9,500 | $10,583 | $13,014 | $11,622 | $11,930 | $12,256 | $12,682 | $13,599 | $16,175 | |
| Net Cash Flow | ($3,238) | ($6,300) | ($2,123) | ($131) | $216 | $3,511 | $677 | $1,179 | $1,883 | $3,745 | $5,301 | $4,379 | |
| Cash Balance | $16,794 | $10,493 | $8,370 | $8,240 | $8,456 | $11,967 | $12,644 | $13,823 | $15,706 | $19,451 | $24,752 | $29,131 | |
| Pro Forma Balance Sheet | |||||||||||||
| Month 1 | Month 2 | Month 3 | Month 4 | Month 5 | Month 6 | Month 7 | Month 8 | Month 9 | Month 10 | Month 11 | Month 12 | ||
| Assets | Starting Balances | ||||||||||||
| Current Assets | |||||||||||||
| Cash | $20,032 | $16,794 | $10,493 | $8,370 | $8,240 | $8,456 | $11,967 | $12,644 | $13,823 | $15,706 | $19,451 | $24,752 | $29,131 |
| Other Current Assets | $0 | $0 | $0 | $0 | $0 | $0 | $0 | $0 | $0 | $0 | $0 | $0 | $0 |
| Total Current Assets | $20,032 | $16,794 | $10,493 | $8,370 | $8,240 | $8,456 | $11,967 | $12,644 | $13,823 | $15,706 | $19,451 | $24,752 | $29,131 |
| Long-term Assets | |||||||||||||
| Long-term Assets | $9,368 | $9,368 | $9,368 | $9,368 | $9,368 | $9,368 | $9,368 | $9,368 | $9,368 | $9,368 | $9,368 | $9,368 | $9,368 |
| Accumulated Depreciation | $0 | $88 | $176 | $264 | $352 | $440 | $528 | $616 | $704 | $792 | $880 | $968 | $1,056 |
| Total Long-term Assets | $9,368 | $9,280 | $9,192 | $9,104 | $9,016 | $8,928 | $8,840 | $8,752 | $8,664 | $8,576 | $8,488 | $8,400 | $8,312 |
| Total Assets | $29,400 | $26,074 | $19,685 | $17,474 | $17,256 | $17,384 | $20,807 | $21,396 | $22,487 | $24,282 | $27,939 | $33,152 | $37,443 |
| Liabilities and Capital | Month 1 | Month 2 | Month 3 | Month 4 | Month 5 | Month 6 | Month 7 | Month 8 | Month 9 | Month 10 | Month 11 | Month 12 | |
| Current Liabilities | |||||||||||||
| Accounts Payable | $0 | $6,912 | $4,149 | $4,703 | $5,701 | $8,187 | $6,575 | $6,873 | $7,184 | $7,581 | $8,464 | $9,418 | $10,056 |
| Current Borrowing | $0 | $0 | $0 | $0 | $0 | $0 | $5,000 | $4,790 | $4,580 | $4,370 | $4,160 | $3,950 | $3,740 |
| Other Current Liabilities | $0 | $0 | $0 | $0 | $0 | $0 | $0 | $0 | $0 | $0 | $0 | $0 | $0 |
| Subtotal Current Liabilities | $0 | $6,912 | $4,149 | $4,703 | $5,701 | $8,187 | $11,575 | $11,663 | $11,764 | $11,951 | $12,624 | $13,368 | $13,796 |
| Long-term Liabilities | $0 | $0 | $0 | $0 | $0 | $0 | $0 | $0 | $0 | $0 | $0 | $0 | $0 |
| Total Liabilities | $0 | $6,912 | $4,149 | $4,703 | $5,701 | $8,187 | $11,575 | $11,663 | $11,764 | $11,951 | $12,624 | $13,368 | $13,796 |
| Paid-in Capital | $30,000 | $30,000 | $30,000 | $30,000 | $30,000 | $30,000 | $30,000 | $30,000 | $30,000 | $30,000 | $30,000 | $30,000 | $30,000 |
| Retained Earnings | ($600) | ($600) | ($600) | ($600) | ($600) | ($600) | ($600) | ($600) | ($600) | ($600) | ($600) | ($600) | ($600) |
| Earnings | $0 | ($10,238) | ($13,863) | ($16,629) | ($17,845) | ($20,204) | ($20,168) | ($19,667) | ($18,677) | ($17,069) | ($14,085) | ($9,616) | ($5,753) |
| Total Capital | $29,400 | $19,162 | $15,537 | $12,771 | $11,555 | $9,196 | $9,232 | $9,733 | $10,723 | $12,331 | $15,315 | $19,784 | $23,647 |
| Total Liabilities and Capital | $29,400 | $26,074 | $19,685 | $17,474 | $17,256 | $17,384 | $20,807 | $21,396 | $22,487 | $24,282 | $27,939 | $33,152 | $37,443 |
| Net Worth | $29,400 | $19,162 | $15,537 | $12,771 | $11,555 | $9,196 | $9,232 | $9,733 | $10,723 | $12,331 | $15,315 | $19,784 | $23,647 |


