
One, Two, Step!
Executive Summary
One, Two, Step! will carry only top of the line quality in women’s shoes and accessories. Our selection will range from the basics of comfortable flats and sandals to the trendy style of stiletto shoes and boots. We will be purchasing through sales representatives and manufacturers in a variety of sizes, colors and style to fit our customer base. The greatest percentage of merchandise will be in shoes, followed by accessories.
One, Two, Step! is organized as a sole proprietorship in the name of Chloe Goodlowe. One, Two, Step! will be located at 123 Shoe Lane in Houston, TX, temporarily, until it is vast enough to expand into a store of its own, located in West Houston.
The hours of operation will be Monday – Friday 10 a.m. – 6 p.m., Saturday 10 a.m. – 8 p.m., and closed on Sundays. Customers will be able to purchase directly from our website and VIP Showcase Events. There will be extended special hours designated during Christmas holiday shopping season.
All merchandise will be purchased according to the company’s mission and customer focus of shoes ranging from sizes 5-13 and accessories. Management will rely on customer feedback, suggestions, and sales reports to introduce or eliminate certain brands, styles and sizes.
The Concept
Recognizing that the market for quality shoes in extended sizes is quite competitive using the larger shoe retailers, One, Two, Step! will minimize the competition by targeting specific niches, generally focusing on other retail stores whose prices are too expensive, lack quality and are not “shoe size efficient”.
One, Two, Step! has three keys to success. The first is establishing a high quality, high value relationship with its vendors and customers. The second key is to ensure reliable and timely delivery of their products. The last key to success is reliable administration of the organization. This boutique business plan is intended to provide the structure to make sure this last key to success is realized.
One, Two, Step! is set up as a home-based business, with plans for expansion into a store/boutique in the near future. This will be the most cost effective arrangement, yet provide the requisite amount of service and support.
The Market
One, Two, Step! will grow at 3% and there are many potential customers now, patiently awaiting the start of business. One, Two, Step! will differ from other retail shoe stores because we will always be less expensive than the competition, but we will still maintain the high quality of our shoes.
Also, we will offer a sales promotion on a monthly basis, such as:
- buy one, get one half price
- buy one, get one free
- half off on shoes from the previous season
- “One, Two, Step!” dollars (for every $50 dollar purchase, the consumer receives an additional 20% off of their next purchase)
In the future, One, Two, Step! will design its own, custom-made shoes for women and men.
The Sales Strategy
Our marketing strategy will not exceed 5% of our annual gross sales. We will use a wide range of approaches, including our website with free shipping, postcards, business cards, and word of mouth.
Objectives
The objectives of One, Two, Step! are:
- To market trendy, elegant shoes, ranging from sizes 5-13, that will cater to the needs of the everyday woman.
- To receive a 50% profit margin within the first year.
- To provide customer service, measured through new and repeat business (our goal is that 50% of our customers will return within 6 months for an additional purchase) and multiple sales (our goal is that 30% of our non-running and 60% of our running shoe sales are accompanied by an additional purchase).
- To achieve a net profit of $5,000 by year two and $15,000 by year five.
Mission
The One, Two, Step! mission is to offer quality, name brand shoes and accessories in an assortment of sizes and styles to accommodate the chic in every woman.
Keys to Success
In order to succeed in the women’s shoe industry One, Two, Step! must:
- Carry an assortment of shoes sizes and style to fit the personalities of any woman.
- Provide customers with top-notch personalized customer service in an atmosphere of southern hospitality.
- Advertise and promote in all areas so that our customer base will learn more about One, Two, Step!
- Continuously review our inventory and sales and adjust our inventory levels accordingly.
- Most importantly, always stay on top of the latest trends in the style of women’s shoes.
Company Summary
One, Two, Step! is organized as a sole proprietorship in the name of Chloe Goodlowe.
One, Two, Step! will be located at 123 Shoe Lane in Houston, TX temporarily, until we have the volume to expand into a separate store, to be located in West Houston. The site is the owner’s house, along a busy pedestrian area in the trendy shopping section of downtown, and is zoned for commercial/residential use. A prominent street-level entrance leads into a foyer and 2 parlors which are already renovated to accommodate the business. Built-in shelving with under-shelf lighting will highlight the shoes, while antique display tables will hold special and sale items, and accessories. The house is equipped with security monitors, and the second parlor is fully wired for phone and internet access. We will use a point-of-sale system to handle in-house sales. Website sales will be processed by an online credit card processor affiliated with our website hosting company.
The hours of operation will be Monday – Friday 10 a.m. – 6 p.m., Saturday 10 a.m. – 8 p.m., and closed on Sundays. Customers will be able to purchase directly from our website and VIP Showcase Events. There will be extended special hours designated during Christmas holiday shopping season.
All merchandise will be purchased according to the company’s mission and customer focus of shoes ranging from sizes 5-13 and accessories.
Company Ownership
One, Two, Step! is organized as a sole proprietorship where I, Chloe Goodlowe, am responsible for the daily management, sales, and development of the company.
Start-up Summary
One, Two, Step! start-up costs are listed below. The company will start with two months of inventory on hand for shoes and accessories, as this is the main revenue generator. The majority of the company’s assets will reside in inventory. The opening day’s cash on hand balance will be $10,000.
Successful operation and building a loyal customer base will allow One, Two, Step! to be self-sufficient and profitable in year two.

| Start-up | |
| Requirements | |
| Start-up Expenses | |
| Legal | $500 |
| Stationery, business cards etc. | $500 |
| Credit Card Set-up | $200 |
| UPS Account | $300 |
| Supplies (special made shoe boxes, invoices, etc.) | $500 |
| Website Start-up | $3,000 |
| Total Start-up Expenses | $5,000 |
| Start-up Assets | |
| Cash Required | $10,000 |
| Start-up Inventory | $15,000 |
| Other Current Assets | $5,000 |
| Long-term Assets | $0 |
| Total Assets | $30,000 |
| Total Requirements | $35,000 |
Products
One, Two, Step! will carry only top of the line quality in women’s shoes and accessories. Our selection will range from the basics of comfortable flats and sandals to the trendy style of stiletto shoes and boots. We will be purchasing through sales representatives and manufacturers in a variety of sizes, colors and style to fit our customer base. The greatest percentage of merchandise will be in shoes, followed by accessories.

Management will rely on customer feedback, suggestions, and sales reports to introduce or eliminate certain brands, styles and sizes.
Market Analysis Summary
The primary target customers of One, Two, Step! are women with a taste for high-quality shoes, ranging from size 5-13. The types of shoes offered are casual and dress:
- Heeled Shoes
- Sandals
- Boots
- Flats
The most important thing I wanted to focus on is marketing “plus-size shoes.” I have many friends and family who are so limited and are really missing out on the fun in shoe fashion because they have a hard time shopping for shoes in sizes 10 and up. This is the main reason I will be one of the few shoe retailers who carries shoes from sizes 5-13.
I want every woman to own and enjoy a nice pair of fashionable shoes!
Market Segmentation
The numbers in the Market Analysis table represent numbers of women in each target market segment residing within 10 miles of the store location. The numbers for each category are based on the existing customer base of local shoe and accessory stores.
I also anticipate a number of web customers, but those numbers are harder to estimate. They have been left out of the market analysis table, but I expect 2% of all sales in the first year to come from the website.
Here is a breakdown for my Market Analysis table:
- The Working Woman: is generally going to spend $20-$50. They’re looking for comfort and quality for the everyday 9-5.
- The Retro Woman: will spend $35-$75. Keep in mind, this is a woman who loves classic and the word “limited edition.”
- The Woman on the Edge: loves trendy, chic and whatever is in for the season. She will purchase a pair of gold shoes–sale or not!
- The Red Carpet Woman: must have a shoe that is fresh off the runway and she has to be the first woman to ever wear a pair of Manolo Blahniks. She will pay $400 and the sky’s the limit for a pair of shoes.

| Market Analysis | |||||||
| Year 1 | Year 2 | Year 3 | Year 4 | Year 5 | |||
| Potential Customers | Growth | CAGR | |||||
| The Working Woman | 3% | 25,000 | 25,750 | 26,523 | 27,319 | 28,139 | 3.00% |
| The Retro Woman | 2% | 2,000 | 2,040 | 2,081 | 2,123 | 2,165 | 2.00% |
| The Woman on the Edge | 1% | 1,500 | 1,508 | 1,516 | 1,524 | 1,532 | 0.53% |
| The Red Carpet Woman | 1% | 200 | 201 | 202 | 203 | 20 | -43.77% |
| Total | 2.64% | 28,700 | 29,499 | 30,322 | 31,169 | 31,856 | 2.64% |
Target Market Segment Strategy
Our trendy location and upscale interior will make shopping at One, Two Step! an indulgence for every woman. However, our marketing efforts will attract different market segments with targeted ad campaigns and sales.
Working women: The majority of our shoes will be priced below the standard for their quality and this shopping district. I am planning on lower margins for the first three years in order to establish a broad customer base, and lure “working women” who come through this area to see a pair of shoes from One, Two, Step! as an affordable luxury. Our initial marketing thus includes print ads in the local paper’s weekend shopping section, as well as flyers put up around the downtown financial section nearby. This is our largest customer base, and will be important for maintaining healthy month-to-month sales. Our challenge with this group is to convince them that they can find affordable, comfortable, and stylish shoes downtown; they don’t have to go to the mall.
Retro and Trendy women: This group includes college students and young professionals, as well as professional women in more creative fields. Our marketing efforts to these segments will include flyers on the local campuses and print ads highlighting our unique product offerings, with an emphasis on “the latest” looks. We will attempt to get free coverage of our grand opening in the fashion section of the local paper, and will encourage local fashion magazines and the newspaper to use us as a “fashion expert’ resource on footwear issues. The patronage of this group will give us an air of youthful and creative energy, while maintaining sophistication.
Red Carpet women: These women know each other, go to the same events, and wouldn’t be caught dead in the same shoes. Our targeted ads in the opera and symphony booklets, as well as donations to local fundraiser auctions, will establish us among this group as an upscale and exclusive boutique. We will offer special-ordering and maintain a very low inventory of the highest-level shoes, in order to keep these customers’ purchases exclusive. Although sales in this group will be low and occasional, they will give us the air of sophistication we are seeking. To say, “I got them at One, Two, Step!” should be a claim to good taste and high class. Our challenge with this group is to maintain the air of exclusivity while offering a wide-enough range to appeal to their different tastes.
Industry Analysis
In the Women’s Shoe industry, most companies are manufacturing their own shoes and they have their own retail stores to market to the consumers. A lot of the distribution is through promotional ads, word of mouth, the internet and other promotional means. Small, high-end retailers like One, Two, Step! usually focus on two or three brands, and use targeted ads and word-of-mouth to gain new customers.
Competition and Buying Patterns
Competition for our first three market segments is usually driven by who is offering the best quality, most interesting shoes for less. The key to success is the quality of the shoe: how it was made and with what materials. In the fourth and smallest market (red carpet women), as well as among the trendy women, the shoe’s designer and uniqueness, and the store’s warmth, sophistication, and customer service are usually more important than price.
The buying factors include what is “in” for each season, and the relation of comfort to style each woman is aiming for.
A few of the main competitors are:
Store A: They have a great selection of women’s shoes and they have all of the latest styles, but their shoes are a bit over-priced. Also, they are limited in the sizes of shoes they sell. For example, I wear a 9 1/2 but I always purchase a size 10 or an 11 (11’s only if I’m purchasing stillettos). A usually does not carry 11’s, only in a few styles. Also, their shoes are extremely narrow and are not made for all types of women’s feet. However, a big plus for this store is when you are at the register, ready to pay, they provide a shoe protectant for no charge and the protectant really does work.
Store B: They have very decent prices for their shoes but not all of their shoes are of good quality. Some of their shoes are made at a second-rate and you can tell just by looking at the details of the shoe. B is also another store that is limited in their shoe sizes.
Strategy and Implementation Summary
One, Two, Step! will use a strategy of providing a service to all women consumers with regular shoes and “plus size” shoes. We will offer a product that most women consumers will require. We will create an atmosphere that is appealing to the truly fashion forward consumer.
Strategic Assumptions:
- Every female resident in Houston,TX is a potential customer.
- Promoting on the Web, by word of mouth and promotional postcards will give One, Two, Step! the opportunity to draw customers from outside Houston, TX.
- One, Two, Step! will aggressively pursue all contacts through networking.
Competitive Edge
One, Two, Step! will differ from other retail shoe stores because we will always be less expensive than the competition, but we will still maintain the high quality of our shoes.
Also, we will offer a sales promotion on a monthly basis, such as:
- buy one, get one half price
- buy one, get one free
- half off on shoes from the previous season
- “One, Two, Step ” dollars (for every $50 dollar purchase, the consumer receives an additional 20% off of their next purchase)
Marketing Strategy
Our marketing strategy will not exceed 5% of our annual gross sales. Marketing will be via:
- 1, 2 Step! website (to be launched in the first year of business)- free shipping if ordered by 2pm central.
- Advertisement postcards
- Business Cards
- Word of mouth
Sales Strategy
Our key to sales strategy at One, Two, Step! will be a great buying experience, every time. Once a customer comes in the door, they will be greeted and assisted as much or as little as they wish. Some customers are uncomfortable with lots of personal attention; others expect it. Chloe’s experience as a retailer has taught her how to read the subtle signs that tell her what a customer is seeking when they enter. All customers will be offered tea or coffee while they shop, and we will have comfortable chairs for friends to sit in while waiting.
Our sales goal is to generate repeat business and strong word-of-mouth advertising based on this great buying experience. Word of mouth in new women’s apparel and accessory stores tends to spread to family, friends, co-workers, church members and people we depend on to provide us a service (hair stylist, nail salon,doctors, etc.), in and out of state.
We also plan to have software to collect customer information such as:
- Names, addresses, email addresses and phone numbers
- What type of shoes the customers prefer
One, Two, Step! will also accept returns/exchanges of unworn shoes with receipt within 30 days of their purchase to build a trust with all of our customers.
Sales Forecast
I expect a growth rate of 3% annually on shoe sales. I am projecting my sales to be at this level due to the low wholesale prices and the demand for women’s shoes. If you notice in my forecast table for the Christmas holidays and summer time, sales will increase. College kids will be out of school from May to August. Research shows that most consumers tend to spend the most money during the holidays for Christmas gifts and they can’t miss out on all of the great holiday sales.
In January, sales will most likely decrease because the average consumer has spent a lot of money for the holidays. January is the month to play “catch-up” on paying their credit card bills and restoring their bank accounts back to normal.
Direct costs for shoe and accessory sales are set at 70% for the first three years. This is much higher than normal for the industry, because of our pricing and specials – we can undersell the competition not through volume, but through the value-added of an exclusive location, personal service, and the owner’s independent income, which does not require a paid salary.


| Sales Forecast | |||||
| Year 1 | Year 2 | Year 3 | Year 4 | Year 5 | |
| Sales | |||||
| Shoes | $106,440 | $109,633 | $112,922 | $116,309 | $119,799 |
| Accessories | $1,419 | $1,461 | $1,505 | $1,550 | $1,597 |
| Total Sales | $107,859 | $111,094 | $114,427 | $117,859 | $121,396 |
| Direct Cost of Sales | Year 1 | Year 2 | Year 3 | Year 4 | Year 5 |
| Shoes | $63,864 | $65,780 | $67,753 | $63,970 | $59,900 |
| Accessories | $852 | $877 | $903 | $899 | $926 |
| Boxes and bags | $1,079 | $1,111 | $1,144 | $1,179 | $1,214 |
| Shipping costs for website sales | $2,157 | $2,222 | $2,289 | $2,357 | $2,428 |
| Subtotal Direct Cost of Sales | $67,951 | $69,989 | $72,089 | $68,405 | $64,468 |
Web Plan Summary
The website for One, Two, Step! will serve as a channel for business. The consumer will be able to:
- View and purchase their shoes and accessories online (VISA, MC, AMEX, DISCOVER)
- Purchase gift cards
- Take a virtual tour of the store
- Read shoe FAQs
- See our Return/Privacy Policy
- Contact Us
- Sign up for One, Two, Step! news and updates
- Complete surveys for customer satisfaction
Website Marketing Strategy
All of our customers will be encouraged to use our website, in state and out of state, for faster service. Shoes and accessories will be sent out via USPS, Fed-Ex, or UPS, depending upon how fast the customer prefers to receive the purchase. The website will include a special “buying shoes online” section, where customers can print out the footprint of each model at actual size, to see how it compares to their foot shape. Each brand that we offer generally conforms to a particular foot shape, regardless of size; tips on picking your best brand for your foot shape will help online customers get a good fit without every leaving home.
Development Requirements
I plan to use a contracted service to design my website. Projected costs are estimated at $3,000. I plan to have the website officially up and running by year 2 of business.
I have estimated the ongoing costs:
- Website name registration for Site Hosting: $60 per year
- Search Engine Registration: $30 or less per month
- Site Design Changes: Changes in the site, such as photography costs (estimated at $150-$200 per shot), are considered to be part of Marketing and Advertising.
Management Summary
When the company begins the start-up phase, I want to hire an assistant to basically be my right hand and one other person for coverage. The hire process will be well-thought-out and will take serious consideration to make sure that the employees will be trustworthy, have great attitudes and can provide excellent customer service. I will continue to be in charge of Operations.
I also would like to reach out to college students looking for part-time jobs or just a summer job to earn some extra money for school. I am also willing to hire to the “right” person with no experience, because I feel that everyone has to start somewhere. I remember someone who gave me a chance when I had no experience and now I feel it’s my turn.
Personnel Plan
There will be two part-time employees working 20-30 hours per week. They will be paid at a rate of $9.00 per hour. All employees will benefit from a one day paid holiday on their respective birthdays and one week of paid vacation after twelve months of employment. Bonuses will be given annually in the month of December.
At this time medical/dental benefits will not be offered to employees. As profits increase in the future medical/dental benefits will be offered to all employees.
| Personnel Plan | |||||
| Year 1 | Year 2 | Year 3 | Year 4 | Year 5 | |
| Operations Assistant (part-time) | $12,150 | $12,200 | $12,300 | $12,300 | $12,300 |
| Sales Associate (Part-Time) | $9,360 | $9,400 | $9,400 | $9,400 | $9,400 |
| Total People | 2 | 2 | 2 | 2 | 2 |
| Total Payroll | $21,510 | $21,600 | $21,700 | $21,700 | $21,700 |
Financial Plan
Sales growth will be aggressive the first 18 months as we sharpen our merchandise assortment, size scales, and stock levels to better meet our customers’ requirements.
However, it is expected that One, Two, Step! will become profitable in the first year, but not excessively so. This is partly due to our lower overall sales price for merchandise, compared to our competitors, but also due to the fact that all our sales must come from customers lured away from other retailers. Once we have a solid customer base, we can increase our margins slightly without risk of losing customers.
Break-even Analysis
Our break-even analysis is summarized by the following chart and table. In order to break even, we must sell at least $7,312 of shoes and accessories per month. We should easily sell more than this even in our first month.

| Break-even Analysis | |
| Monthly Revenue Break-even | $6,585 |
| Assumptions: | |
| Average Percent Variable Cost | 63% |
| Estimated Monthly Fixed Cost | $2,436 |
Projected Profit and Loss
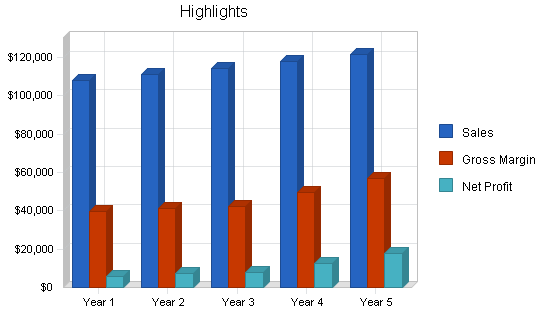
The following table and charts show our profitability for the next three years, and detail our operating expenses. these include a portion of the mortgage for my house, for the spaces which will be dedicated solely to business operations.


| Pro Forma Profit and Loss | |||||
| Year 1 | Year 2 | Year 3 | Year 4 | Year 5 | |
| Sales | $107,859 | $111,094 | $114,427 | $117,859 | $121,396 |
| Direct Cost of Sales | $67,951 | $69,989 | $72,089 | $68,405 | $64,468 |
| Other Costs of Sales | $0 | $0 | $0 | $0 | $0 |
| Total Cost of Sales | $67,951 | $69,989 | $72,089 | $68,405 | $64,468 |
| Gross Margin | $39,908 | $41,105 | $42,338 | $49,454 | $56,928 |
| Gross Margin % | 37.00% | 37.00% | 37.00% | 41.96% | 46.89% |
| Expenses | |||||
| Payroll | $21,510 | $21,600 | $21,700 | $21,700 | $21,700 |
| Marketing/Promotion | $2,375 | $1,500 | $2,000 | $2,500 | $2,750 |
| Depreciation | $0 | $0 | $0 | $0 | $0 |
| Mortgage %/Rent | $1,800 | $1,800 | $1,800 | $1,800 | $1,800 |
| Utilities | $960 | $1,000 | $1,100 | $1,200 | $1,300 |
| Insurance | $1,800 | $1,850 | $2,000 | $2,200 | $2,250 |
| Website maintenance | $372 | $375 | $375 | $375 | $375 |
| POS contract/fees | $420 | $450 | $450 | $450 | $450 |
| Payroll taxes | $0 | $0 | $0 | $0 | $0 |
| Total Operating Expenses | $29,237 | $28,575 | $29,425 | $30,225 | $30,625 |
| Profit Before Interest and Taxes | $10,671 | $12,530 | $12,913 | $19,229 | $26,303 |
| EBITDA | $10,671 | $12,530 | $12,913 | $19,229 | $26,303 |
| Interest Expense | $2,274 | $1,875 | $1,459 | $1,042 | $626 |
| Taxes Incurred | $2,519 | $3,196 | $3,436 | $5,456 | $7,703 |
| Net Profit | $5,878 | $7,458 | $8,018 | $12,731 | $17,974 |
| Net Profit/Sales | 5.45% | 6.71% | 7.01% | 10.80% | 14.81% |
Start-up Funding
I will be investing $10,000 in the business, and am seeking another $25,000 in SBA long-term loans, to be repaid over six years.
| Start-up Funding | |
| Start-up Expenses to Fund | $5,000 |
| Start-up Assets to Fund | $30,000 |
| Total Funding Required | $35,000 |
| Assets | |
| Non-cash Assets from Start-up | $20,000 |
| Cash Requirements from Start-up | $10,000 |
| Additional Cash Raised | $0 |
| Cash Balance on Starting Date | $10,000 |
| Total Assets | $30,000 |
| Liabilities and Capital | |
| Liabilities | |
| Current Borrowing | $0 |
| Long-term Liabilities | $25,000 |
| Accounts Payable (Outstanding Bills) | $0 |
| Other Current Liabilities (interest-free) | $0 |
| Total Liabilities | $25,000 |
| Capital | |
| Planned Investment | |
| Owner | $10,000 |
| Investor | $0 |
| Additional Investment Requirement | $0 |
| Total Planned Investment | $10,000 |
| Loss at Start-up (Start-up Expenses) | ($5,000) |
| Total Capital | $5,000 |
| Total Capital and Liabilities | $30,000 |
| Total Funding | $35,000 |
Projected Cash Flow
Our projected cash flow is outlined in the following chart and table. The table lists sales tax collected and paid out, as well as repayment of the loan we are seeking.

| Pro Forma Cash Flow | |||||
| Year 1 | Year 2 | Year 3 | Year 4 | Year 5 | |
| Cash Received | |||||
| Cash from Operations | |||||
| Cash Sales | $107,859 | $111,094 | $114,427 | $117,859 | $121,396 |
| Subtotal Cash from Operations | $107,859 | $111,094 | $114,427 | $117,859 | $121,396 |
| Additional Cash Received | |||||
| Sales Tax, VAT, HST/GST Received | $0 | $0 | $0 | $0 | $0 |
| New Current Borrowing | $0 | $0 | $0 | $0 | $0 |
| New Other Liabilities (interest-free) | $0 | $0 | $0 | $0 | $0 |
| New Long-term Liabilities | $0 | $0 | $0 | $0 | $0 |
| Sales of Other Current Assets | $0 | $0 | $0 | $0 | $0 |
| Sales of Long-term Assets | $0 | $0 | $0 | $0 | $0 |
| New Investment Received | $0 | $0 | $0 | $0 | $0 |
| Subtotal Cash Received | $107,859 | $111,094 | $114,427 | $117,859 | $121,396 |
| Expenditures | Year 1 | Year 2 | Year 3 | Year 4 | Year 5 |
| Expenditures from Operations | |||||
| Cash Spending | $21,510 | $21,600 | $21,700 | $21,700 | $21,700 |
| Bill Payments | $70,868 | $82,102 | $84,729 | $82,123 | $81,093 |
| Subtotal Spent on Operations | $92,378 | $103,702 | $106,429 | $103,823 | $102,793 |
| Additional Cash Spent | |||||
| Sales Tax, VAT, HST/GST Paid Out | $0 | $0 | $0 | $0 | $0 |
| Principal Repayment of Current Borrowing | $0 | $0 | $0 | $0 | $0 |
| Other Liabilities Principal Repayment | $0 | $0 | $0 | $0 | $0 |
| Long-term Liabilities Principal Repayment | $4,164 | $4,165 | $4,165 | $4,165 | $4,165 |
| Purchase Other Current Assets | $0 | $0 | $0 | $0 | $0 |
| Purchase Long-term Assets | $0 | $0 | $0 | $0 | $0 |
| Dividends | $0 | $0 | $0 | $0 | $0 |
| Subtotal Cash Spent | $96,542 | $107,867 | $110,594 | $107,988 | $106,958 |
| Net Cash Flow | $11,317 | $3,227 | $3,833 | $9,871 | $14,438 |
| Cash Balance | $21,317 | $24,544 | $28,377 | $38,248 | $52,686 |
Important Assumptions
I assume that the economic conditions will improve in the next two to three years. Therefore, business will be good in year one, but years two and years three. One, Two, Step! will be very successful.
| General Assumptions | |||||
| Year 1 | Year 2 | Year 3 | Year 4 | Year 5 | |
| Plan Month | 1 | 2 | 3 | 4 | 5 |
| Current Interest Rate | 10.00% | 10.00% | 10.00% | 10.00% | 10.00% |
| Long-term Interest Rate | 10.00% | 10.00% | 10.00% | 10.00% | 10.00% |
| Tax Rate | 30.00% | 30.00% | 30.00% | 30.00% | 30.00% |
| Other | 0 | 0 | 0 | 0 | 0 |
Projected Balance Sheet
The table below outlines the projected balance sheet. While, as a retail store, we have no plans for long-term assets, we will have a healthy cash balance, growing over the next five years. We plan to pay off our loan within six years, and increase the net worth of the business from $5,000 at start-up to over $15,000 by the end of five years.
| Pro Forma Balance Sheet | |||||
| Year 1 | Year 2 | Year 3 | Year 4 | Year 5 | |
| Assets | |||||
| Current Assets | |||||
| Cash | $21,317 | $24,544 | $28,377 | $38,248 | $52,686 |
| Inventory | $13,255 | $12,111 | $12,475 | $10,905 | $10,208 |
| Other Current Assets | $5,000 | $5,000 | $5,000 | $5,000 | $5,000 |
| Total Current Assets | $39,573 | $41,655 | $45,852 | $54,154 | $67,894 |
| Long-term Assets | |||||
| Long-term Assets | $0 | $0 | $0 | $0 | $0 |
| Accumulated Depreciation | $0 | $0 | $0 | $0 | $0 |
| Total Long-term Assets | $0 | $0 | $0 | $0 | $0 |
| Total Assets | $39,573 | $41,655 | $45,852 | $54,154 | $67,894 |
| Liabilities and Capital | Year 1 | Year 2 | Year 3 | Year 4 | Year 5 |
| Current Liabilities | |||||
| Accounts Payable | $7,859 | $6,649 | $6,992 | $6,728 | $6,660 |
| Current Borrowing | $0 | $0 | $0 | $0 | $0 |
| Other Current Liabilities | $0 | $0 | $0 | $0 | $0 |
| Subtotal Current Liabilities | $7,859 | $6,649 | $6,992 | $6,728 | $6,660 |
| Long-term Liabilities | $20,836 | $16,671 | $12,506 | $8,341 | $4,176 |
| Total Liabilities | $28,695 | $23,320 | $19,498 | $15,069 | $10,836 |
| Paid-in Capital | $10,000 | $10,000 | $10,000 | $10,000 | $10,000 |
| Retained Earnings | ($5,000) | $878 | $8,336 | $16,354 | $29,084 |
| Earnings | $5,878 | $7,458 | $8,018 | $12,731 | $17,974 |
| Total Capital | $10,878 | $18,336 | $26,354 | $39,084 | $57,059 |
| Total Liabilities and Capital | $39,573 | $41,655 | $45,852 | $54,154 | $67,894 |
| Net Worth | $10,878 | $18,336 | $26,354 | $39,084 | $57,059 |
Business Ratios
One, Two, Step!’s ratios can be seen in the table below. For comparison, we have included standard business ratios for the Miscellaneous retails stores industry, SIC Code 5999.
| Ratio Analysis | ||||||
| Year 1 | Year 2 | Year 3 | Year 4 | Year 5 | Industry Profile | |
| Sales Growth | n.a. | 3.00% | 3.00% | 3.00% | 3.00% | 2.79% |
| Percent of Total Assets | ||||||
| Inventory | 33.50% | 29.08% | 27.21% | 20.14% | 15.03% | 33.69% |
| Other Current Assets | 12.64% | 12.00% | 10.90% | 9.23% | 7.36% | 24.88% |
| Total Current Assets | 100.00% | 100.00% | 100.00% | 100.00% | 100.00% | 75.34% |
| Long-term Assets | 0.00% | 0.00% | 0.00% | 0.00% | 0.00% | 24.66% |
| Total Assets | 100.00% | 100.00% | 100.00% | 100.00% | 100.00% | 100.00% |
| Current Liabilities | 19.86% | 15.96% | 15.25% | 12.42% | 9.81% | 37.95% |
| Long-term Liabilities | 52.65% | 40.02% | 27.27% | 15.40% | 6.15% | 16.70% |
| Total Liabilities | 72.51% | 55.98% | 42.52% | 27.83% | 15.96% | 54.65% |
| Net Worth | 27.49% | 44.02% | 57.48% | 72.17% | 84.04% | 45.35% |
| Percent of Sales | ||||||
| Sales | 100.00% | 100.00% | 100.00% | 100.00% | 100.00% | 100.00% |
| Gross Margin | 37.00% | 37.00% | 37.00% | 41.96% | 46.89% | 31.49% |
| Selling, General & Administrative Expenses | 31.55% | 30.29% | 29.99% | 31.16% | 32.09% | 18.95% |
| Advertising Expenses | 0.00% | 0.00% | 0.00% | 0.00% | 0.00% | 1.80% |
| Profit Before Interest and Taxes | 9.89% | 11.28% | 11.28% | 16.32% | 21.67% | 1.05% |
| Main Ratios | ||||||
| Current | 5.04 | 6.27 | 6.56 | 8.05 | 10.20 | 1.77 |
| Quick | 3.35 | 4.44 | 4.77 | 6.43 | 8.66 | 0.70 |
| Total Debt to Total Assets | 72.51% | 55.98% | 42.52% | 27.83% | 15.96% | 61.43% |
| Pre-tax Return on Net Worth | 77.19% | 58.11% | 43.46% | 46.53% | 45.00% | 2.23% |
| Pre-tax Return on Assets | 21.22% | 25.58% | 24.98% | 33.58% | 37.82% | 5.78% |
| Additional Ratios | Year 1 | Year 2 | Year 3 | Year 4 | Year 5 | |
| Net Profit Margin | 5.45% | 6.71% | 7.01% | 10.80% | 14.81% | n.a |
| Return on Equity | 54.03% | 40.68% | 30.42% | 32.57% | 31.50% | n.a |
| Activity Ratios | ||||||
| Inventory Turnover | 5.95 | 5.52 | 5.86 | 5.85 | 6.11 | n.a |
| Accounts Payable Turnover | 10.02 | 12.17 | 12.17 | 12.17 | 12.17 | n.a |
| Payment Days | 27 | 33 | 29 | 31 | 30 | n.a |
| Total Asset Turnover | 2.73 | 2.67 | 2.50 | 2.18 | 1.79 | n.a |
| Debt Ratios | ||||||
| Debt to Net Worth | 2.64 | 1.27 | 0.74 | 0.39 | 0.19 | n.a |
| Current Liab. to Liab. | 0.27 | 0.29 | 0.36 | 0.45 | 0.61 | n.a |
| Liquidity Ratios | ||||||
| Net Working Capital | $31,714 | $35,007 | $38,860 | $47,425 | $61,235 | n.a |
| Interest Coverage | 4.69 | 6.68 | 8.85 | 18.45 | 42.03 | n.a |
| Additional Ratios | ||||||
| Assets to Sales | 0.37 | 0.37 | 0.40 | 0.46 | 0.56 | n.a |
| Current Debt/Total Assets | 20% | 16% | 15% | 12% | 10% | n.a |
| Acid Test | 3.35 | 4.44 | 4.77 | 6.43 | 8.66 | n.a |
| Sales/Net Worth | 9.92 | 6.06 | 4.34 | 3.02 | 2.13 | n.a |
| Dividend Payout | 0.00 | 0.00 | 0.00 | 0.00 | 0.00 | n.a |
Appendix
| Sales Forecast | |||||||||||||
| Month 1 | Month 2 | Month 3 | Month 4 | Month 5 | Month 6 | Month 7 | Month 8 | Month 9 | Month 10 | Month 11 | Month 12 | ||
| Sales | |||||||||||||
| Shoes | 0% | $7,500 | $7,725 | $7,957 | $8,195 | $8,441 | $8,695 | $8,955 | $9,224 | $9,501 | $9,786 | $10,079 | $10,382 |
| Accessories | 0% | $100 | $103 | $106 | $109 | $113 | $116 | $119 | $123 | $127 | $130 | $134 | $138 |
| Total Sales | $7,600 | $7,828 | $8,063 | $8,305 | $8,554 | $8,810 | $9,075 | $9,347 | $9,627 | $9,916 | $10,214 | $10,520 | |
| Direct Cost of Sales | Month 1 | Month 2 | Month 3 | Month 4 | Month 5 | Month 6 | Month 7 | Month 8 | Month 9 | Month 10 | Month 11 | Month 12 | |
| Shoes | 60% | $4,500 | $4,635 | $4,774 | $4,917 | $5,065 | $5,217 | $5,373 | $5,534 | $5,700 | $5,871 | $6,048 | $6,229 |
| Accessories | 60% | $60 | $62 | $64 | $66 | $68 | $70 | $72 | $74 | $76 | $78 | $81 | $83 |
| Boxes and bags | 1% | $76 | $78 | $81 | $83 | $86 | $88 | $91 | $93 | $96 | $99 | $102 | $105 |
| Shipping costs for website sales | 2% | $152 | $157 | $161 | $166 | $171 | $176 | $181 | $187 | $193 | $198 | $204 | $210 |
| Subtotal Direct Cost of Sales | $4,788 | $4,932 | $5,080 | $5,232 | $5,389 | $5,551 | $5,717 | $5,889 | $6,065 | $6,247 | $6,435 | $6,628 | |
| Personnel Plan | |||||||||||||
| Month 1 | Month 2 | Month 3 | Month 4 | Month 5 | Month 6 | Month 7 | Month 8 | Month 9 | Month 10 | Month 11 | Month 12 | ||
| Operations Assistant (part-time) | 0% | $1,013 | $1,013 | $1,013 | $1,013 | $1,013 | $1,013 | $1,013 | $1,013 | $1,013 | $1,013 | $1,013 | $1,013 |
| Sales Associate (Part-Time) | 0% | $780 | $780 | $780 | $780 | $780 | $780 | $780 | $780 | $780 | $780 | $780 | $780 |
| Total People | 2 | 2 | 2 | 2 | 2 | 2 | 2 | 2 | 2 | 2 | 2 | 2 | |
| Total Payroll | $1,793 | $1,793 | $1,793 | $1,793 | $1,793 | $1,793 | $1,793 | $1,793 | $1,793 | $1,793 | $1,793 | $1,793 | |
| Pro Forma Profit and Loss | |||||||||||||
| Month 1 | Month 2 | Month 3 | Month 4 | Month 5 | Month 6 | Month 7 | Month 8 | Month 9 | Month 10 | Month 11 | Month 12 | ||
| Sales | $7,600 | $7,828 | $8,063 | $8,305 | $8,554 | $8,810 | $9,075 | $9,347 | $9,627 | $9,916 | $10,214 | $10,520 | |
| Direct Cost of Sales | $4,788 | $4,932 | $5,080 | $5,232 | $5,389 | $5,551 | $5,717 | $5,889 | $6,065 | $6,247 | $6,435 | $6,628 | |
| Other Costs of Sales | $0 | $0 | $0 | $0 | $0 | $0 | $0 | $0 | $0 | $0 | $0 | $0 | |
| Total Cost of Sales | $4,788 | $4,932 | $5,080 | $5,232 | $5,389 | $5,551 | $5,717 | $5,889 | $6,065 | $6,247 | $6,435 | $6,628 | |
| Gross Margin | $2,812 | $2,896 | $2,983 | $3,073 | $3,165 | $3,260 | $3,358 | $3,458 | $3,562 | $3,669 | $3,779 | $3,892 | |
| Gross Margin % | 37.00% | 37.00% | 37.00% | 37.00% | 37.00% | 37.00% | 37.00% | 37.00% | 37.00% | 37.00% | 37.00% | 37.00% | |
| Expenses | |||||||||||||
| Payroll | $1,793 | $1,793 | $1,793 | $1,793 | $1,793 | $1,793 | $1,793 | $1,793 | $1,793 | $1,793 | $1,793 | $1,793 | |
| Marketing/Promotion | $1,500 | $75 | $100 | $100 | $75 | $75 | $75 | $75 | $75 | $75 | $75 | $75 | |
| Depreciation | $0 | $0 | $0 | $0 | $0 | $0 | $0 | $0 | $0 | $0 | $0 | $0 | |
| Mortgage %/Rent | $150 | $150 | $150 | $150 | $150 | $150 | $150 | $150 | $150 | $150 | $150 | $150 | |
| Utilities | $80 | $80 | $80 | $80 | $80 | $80 | $80 | $80 | $80 | $80 | $80 | $80 | |
| Insurance | $150 | $150 | $150 | $150 | $150 | $150 | $150 | $150 | $150 | $150 | $150 | $150 | |
| Website maintenance | $31 | $31 | $31 | $31 | $31 | $31 | $31 | $31 | $31 | $31 | $31 | $31 | |
| POS contract/fees | 15% | $35 | $35 | $35 | $35 | $35 | $35 | $35 | $35 | $35 | $35 | $35 | $35 |
| Payroll taxes | 15% | $0 | $0 | $0 | $0 | $0 | $0 | $0 | $0 | $0 | $0 | $0 | $0 |
| Total Operating Expenses | $3,739 | $2,314 | $2,339 | $2,339 | $2,314 | $2,314 | $2,314 | $2,314 | $2,314 | $2,314 | $2,314 | $2,314 | |
| Profit Before Interest and Taxes | ($927) | $583 | $645 | $734 | $851 | $946 | $1,044 | $1,145 | $1,249 | $1,356 | $1,466 | $1,579 | |
| EBITDA | ($927) | $583 | $645 | $734 | $851 | $946 | $1,044 | $1,145 | $1,249 | $1,356 | $1,466 | $1,579 | |
| Interest Expense | $205 | $203 | $200 | $197 | $194 | $191 | $188 | $185 | $182 | $179 | $177 | $174 | |
| Taxes Incurred | ($340) | $114 | $134 | $161 | $197 | $227 | $257 | $288 | $320 | $353 | $387 | $422 | |
| Net Profit | ($792) | $266 | $312 | $376 | $460 | $529 | $599 | $672 | $746 | $823 | $902 | $984 | |
| Net Profit/Sales | -10.43% | 3.40% | 3.86% | 4.53% | 5.38% | 6.00% | 6.60% | 7.19% | 7.75% | 8.30% | 8.83% | 9.35% | |
| Pro Forma Cash Flow | |||||||||||||
| Month 1 | Month 2 | Month 3 | Month 4 | Month 5 | Month 6 | Month 7 | Month 8 | Month 9 | Month 10 | Month 11 | Month 12 | ||
| Cash Received | |||||||||||||
| Cash from Operations | |||||||||||||
| Cash Sales | $7,600 | $7,828 | $8,063 | $8,305 | $8,554 | $8,810 | $9,075 | $9,347 | $9,627 | $9,916 | $10,214 | $10,520 | |
| Subtotal Cash from Operations | $7,600 | $7,828 | $8,063 | $8,305 | $8,554 | $8,810 | $9,075 | $9,347 | $9,627 | $9,916 | $10,214 | $10,520 | |
| Additional Cash Received | |||||||||||||
| Sales Tax, VAT, HST/GST Received | 0.00% | $0 | $0 | $0 | $0 | $0 | $0 | $0 | $0 | $0 | $0 | $0 | $0 |
| New Current Borrowing | $0 | $0 | $0 | $0 | $0 | $0 | $0 | $0 | $0 | $0 | $0 | $0 | |
| New Other Liabilities (interest-free) | $0 | $0 | $0 | $0 | $0 | $0 | $0 | $0 | $0 | $0 | $0 | $0 | |
| New Long-term Liabilities | $0 | $0 | $0 | $0 | $0 | $0 | $0 | $0 | $0 | $0 | $0 | $0 | |
| Sales of Other Current Assets | $0 | $0 | $0 | $0 | $0 | $0 | $0 | $0 | $0 | $0 | $0 | $0 | |
| Sales of Long-term Assets | $0 | $0 | $0 | $0 | $0 | $0 | $0 | $0 | $0 | $0 | $0 | $0 | |
| New Investment Received | $0 | $0 | $0 | $0 | $0 | $0 | $0 | $0 | $0 | $0 | $0 | $0 | |
| Subtotal Cash Received | $7,600 | $7,828 | $8,063 | $8,305 | $8,554 | $8,810 | $9,075 | $9,347 | $9,627 | $9,916 | $10,214 | $10,520 | |
| Expenditures | Month 1 | Month 2 | Month 3 | Month 4 | Month 5 | Month 6 | Month 7 | Month 8 | Month 9 | Month 10 | Month 11 | Month 12 | |
| Expenditures from Operations | |||||||||||||
| Cash Spending | $1,793 | $1,793 | $1,793 | $1,793 | $1,793 | $1,793 | $1,793 | $1,793 | $1,793 | $1,793 | $1,793 | $1,793 | |
| Bill Payments | $60 | $1,946 | $5,839 | $5,897 | $6,406 | $6,622 | $6,819 | $7,023 | $7,233 | $7,449 | $7,672 | $7,902 | |
| Subtotal Spent on Operations | $1,853 | $3,739 | $7,632 | $7,689 | $8,199 | $8,414 | $8,612 | $8,816 | $9,025 | $9,242 | $9,465 | $9,694 | |
| Additional Cash Spent | |||||||||||||
| Sales Tax, VAT, HST/GST Paid Out | $0 | $0 | $0 | $0 | $0 | $0 | $0 | $0 | $0 | $0 | $0 | $0 | |
| Principal Repayment of Current Borrowing | $0 | $0 | $0 | $0 | $0 | $0 | $0 | $0 | $0 | $0 | $0 | $0 | |
| Other Liabilities Principal Repayment | $0 | $0 | $0 | $0 | $0 | $0 | $0 | $0 | $0 | $0 | $0 | $0 | |
| Long-term Liabilities Principal Repayment | $347 | $347 | $347 | $347 | $347 | $347 | $347 | $347 | $347 | $347 | $347 | $347 | |
| Purchase Other Current Assets | $0 | $0 | $0 | $0 | $0 | $0 | $0 | $0 | $0 | $0 | $0 | $0 | |
| Purchase Long-term Assets | $0 | $0 | $0 | $0 | $0 | $0 | $0 | $0 | $0 | $0 | $0 | $0 | |
| Dividends | $0 | $0 | $0 | $0 | $0 | $0 | $0 | $0 | $0 | $0 | $0 | $0 | |
| Subtotal Cash Spent | $2,200 | $4,086 | $7,979 | $8,036 | $8,546 | $8,761 | $8,959 | $9,163 | $9,372 | $9,589 | $9,812 | $10,041 | |
| Net Cash Flow | $5,400 | $3,742 | $84 | $269 | $8 | $49 | $116 | $184 | $255 | $328 | $402 | $479 | |
| Cash Balance | $15,400 | $19,143 | $19,227 | $19,496 | $19,504 | $19,553 | $19,669 | $19,853 | $20,108 | $20,436 | $20,838 | $21,317 | |
| Pro Forma Balance Sheet | |||||||||||||
| Month 1 | Month 2 | Month 3 | Month 4 | Month 5 | Month 6 | Month 7 | Month 8 | Month 9 | Month 10 | Month 11 | Month 12 | ||
| Assets | Starting Balances | ||||||||||||
| Current Assets | |||||||||||||
| Cash | $10,000 | $15,400 | $19,143 | $19,227 | $19,496 | $19,504 | $19,553 | $19,669 | $19,853 | $20,108 | $20,436 | $20,838 | $21,317 |
| Inventory | $15,000 | $10,212 | $10,280 | $10,201 | $10,464 | $10,778 | $11,101 | $11,434 | $11,777 | $12,131 | $12,495 | $12,869 | $13,255 |
| Other Current Assets | $5,000 | $5,000 | $5,000 | $5,000 | $5,000 | $5,000 | $5,000 | $5,000 | $5,000 | $5,000 | $5,000 | $5,000 | $5,000 |
| Total Current Assets | $30,000 | $30,612 | $34,423 | $34,428 | $34,960 | $35,281 | $35,654 | $36,103 | $36,631 | $37,239 | $37,930 | $38,707 | $39,573 |
| Long-term Assets | |||||||||||||
| Long-term Assets | $0 | $0 | $0 | $0 | $0 | $0 | $0 | $0 | $0 | $0 | $0 | $0 | $0 |
| Accumulated Depreciation | $0 | $0 | $0 | $0 | $0 | $0 | $0 | $0 | $0 | $0 | $0 | $0 | $0 |
| Total Long-term Assets | $0 | $0 | $0 | $0 | $0 | $0 | $0 | $0 | $0 | $0 | $0 | $0 | $0 |
| Total Assets | $30,000 | $30,612 | $34,423 | $34,428 | $34,960 | $35,281 | $35,654 | $36,103 | $36,631 | $37,239 | $37,930 | $38,707 | $39,573 |
| Liabilities and Capital | Month 1 | Month 2 | Month 3 | Month 4 | Month 5 | Month 6 | Month 7 | Month 8 | Month 9 | Month 10 | Month 11 | Month 12 | |
| Current Liabilities | |||||||||||||
| Accounts Payable | $0 | $1,751 | $5,643 | $5,683 | $6,186 | $6,394 | $6,585 | $6,782 | $6,985 | $7,194 | $7,409 | $7,631 | $7,859 |
| Current Borrowing | $0 | $0 | $0 | $0 | $0 | $0 | $0 | $0 | $0 | $0 | $0 | $0 | $0 |
| Other Current Liabilities | $0 | $0 | $0 | $0 | $0 | $0 | $0 | $0 | $0 | $0 | $0 | $0 | $0 |
| Subtotal Current Liabilities | $0 | $1,751 | $5,643 | $5,683 | $6,186 | $6,394 | $6,585 | $6,782 | $6,985 | $7,194 | $7,409 | $7,631 | $7,859 |
| Long-term Liabilities | $25,000 | $24,653 | $24,306 | $23,959 | $23,612 | $23,265 | $22,918 | $22,571 | $22,224 | $21,877 | $21,530 | $21,183 | $20,836 |
| Total Liabilities | $25,000 | $26,404 | $29,949 | $29,642 | $29,798 | $29,659 | $29,503 | $29,353 | $29,209 | $29,071 | $28,939 | $28,814 | $28,695 |
| Paid-in Capital | $10,000 | $10,000 | $10,000 | $10,000 | $10,000 | $10,000 | $10,000 | $10,000 | $10,000 | $10,000 | $10,000 | $10,000 | $10,000 |
| Retained Earnings | ($5,000) | ($5,000) | ($5,000) | ($5,000) | ($5,000) | ($5,000) | ($5,000) | ($5,000) | ($5,000) | ($5,000) | ($5,000) | ($5,000) | ($5,000) |
| Earnings | $0 | ($792) | ($526) | ($215) | $162 | $622 | $1,151 | $1,750 | $2,422 | $3,168 | $3,991 | $4,894 | $5,878 |
| Total Capital | $5,000 | $4,208 | $4,474 | $4,785 | $5,162 | $5,622 | $6,151 | $6,750 | $7,422 | $8,168 | $8,991 | $9,894 | $10,878 |
| Total Liabilities and Capital | $30,000 | $30,612 | $34,423 | $34,428 | $34,960 | $35,281 | $35,654 | $36,103 | $36,631 | $37,239 | $37,930 | $38,707 | $39,573 |
| Net Worth | $5,000 | $4,208 | $4,474 | $4,785 | $5,162 | $5,622 | $6,151 | $6,750 | $7,422 | $8,168 | $8,991 | $9,894 | $10,878 |


