
Pie in the Sky Wi-Fi
Executive Summary
Pie in the Sky Wi-Fi is an Oregon-based corporation that specializes in the setup, delivery, marketing and maintenance of secure wireless communications (Wi-Fi) for individuals, businesses & entire communities. Pie in the Sky Wi-Fi offers custom, ground-up metropolitan-area data and VoIP installation and delivery.
Wi-Fi is quickly becoming the standard in the delivery of Internet connectivity throughout many organizations, government agencies and businesses. Pie in the Sky Wi-Fi, Inc. is focused on the delivery of secure Wi-Fi services to commercial and residential property owners as well as traditional Internet service providers that are looking to improve the service offerings within their buildings and current services. The primary focus of Pie in the Sky Wi-Fi is to provide full service installation, support and management of wireless networks for individual building owners and municipalities. Pie in the Sky Wi-Fi is a wholesale provider of services to businesses looking to improve their competitiveness and amenities in their commercial properties and townships.
The opportunity for wireless (Wi-Fi) installations and ongoing management of these networks has increased greatly in the past year and is projected to grow at an annual rate of no less than 50% a year. The total industry segment targeted specifically by Pie in the Sky Wi-Fi is expected to grow to $2 billion annually by year four. The Wi-Fi industry as a whole is on track to become a $190.8 billion powerhouse. This year is the beginning of a paradigm shift in how Internet services, hardware and security are all delivered to users throughout the world. Pie in the Sky Wi-Fi has an opportunity to be one of the first movers in this rapidly growing market. Because of the fragmented nature of the market in its current state, the threat from potential competitors is not necessarily a bad thing. Additional competitors in the market will help to increase industry awareness and drive overall sales within the industry. The overall opportunity in this industry is great. Due to the short-term opportunity to grab a foothold in this emerging market, Pie in the Sky Wi-Fi is aggressively rolling out the services anywhere demand is generated. As demand increases, the innovative Pie in the Sky Wi-Fi sales and installer management strategy will allow the company to take advantage of all opportunities, regardless of location. We estimate that by year four, the opportunity or “gold-rush” will be over and market consolidation will begin.
It is the goal of management to position the company as an acquisition target by a market consolidator looking to gain market share and build a larger national network by end of year three. If the business plan is executed as described and all milestones are met on time, Pie in the Sky Wi-Fi will be in a good position to sell the company. The most likely aggregators will be the larger telecom, cable or electrical companies currently looking at providing these services via public “Hot Spots” or through cellular networks. Many companies will enter the market over the next four years, including these traditionally larger telecom and cellular companies. Fortunately, the Pie in the Sky Wi-Fi market focus allows for many competitors, both large and small. Pie in the Sky Wi-Fi expects to sell the company as a going concern for no less than $20 million based on the pro-forma income statement and estimated balance sheet.

1.1 Objectives
- Sales over $500,000 in the first year
- Increase contracted sales force to 30 by year 3
- Net worth over $2,000,000 by year 3.
1.2 Mission
Pie in the Sky Wi-Fi will make it easier and more affordable for our customers to provide Internet access. We will decrease the costs of their initial installation, allow for portability, and provide high-quality, ongoing customer service. For our investors, we will provide a ground-level entry port to the next high-impact technology trend, turning around high value returns when we sell the company at the end of the plan to a market consolidator.
1.3 Keys to Success
- Management’s skill combination: business, sales, technology, and branding expertise
- First-mover advantage in an emerging market
- Detailed installer database, tracking performance and skill sets
Company Summary
Wi-Fi is quickly becoming the standard in the delivery of Internet connectivity throughout many organizations, government agencies and businesses. Pie in the Sky Wi-Fi, Inc. is focused on the delivery of private, secure Wi-Fi services to commercial and residential property owners, as well as small municipalities and governments that are looking to improve the service offerings within their buildings or townships. The primary function of Pie in the Sky Wi-Fi is to provide full service installation, support and monthly management of wireless networks. Pie in the Sky Wi-Fi is a wholesale provider of services for organizations looking to improve their competitiveness and amenities in their commercial properties and townships. Pie in the Sky Wi-Fi charges a set-up fee and a monthly maintenance charge.
2.1 Company Ownership
Articles of Incorporation
Articles of Incorporation were filed with the Secretary of State of Oregon on December 22, 2003. Pie in the Sky Wi-Fi, Inc. filed as a subchapter S Corporation.
Board of Directors
The Board of Directors currently consists of the following individuals:
- Mr. A, Chairman
- Mr. B, Director
- Mr. C, Director
- Mr. D, Director
Election of Officers
The following individuals have been elected by the Board of Directors to serve as Officers in the Corporation:
- Mr. Smith, President & Chief Executive Officer (CEO)
- Mr. Morgan, Chief Communications Officer (CCO)
- Mr. Mann, Chief Technology Officer (CTO)
- Mr. Jones, Chief Revenue Officer (CRO)
Sale of stock to initial stock holders
| Subscriber | Number of Shares | Purchase Price |
| Mr. Smith | 250,000 | $300 |
| Mr. Morgan | 250,000 | $300 |
| Mr. Mann | 250,000 | $300 |
| Mr. Jones | 250,000 | $300 |
2.2 Start-up Summary
The company founders plan to handle all day-to-day operations of the business and will work with outside vendors and partners in order to ensure that this business venture is a success.
It is estimated that the start-up expenses will be $16,500 (including legal costs, advertising, and related expenses). Total start-up requirements include an additional $33,500 for cash on hand to cover the first year’s operating expenses.
Additional investment will be needed in year 1 in order to scale the operation as planned. This is explained further in the financial sections of this document.

| Start-up | |
| Requirements | |
| Start-up Expenses | |
| Legal | $500 |
| Stationery etc. | $1,000 |
| Insurance | $1,000 |
| Rent | $2,000 |
| Computers | $10,000 |
| Other | $2,000 |
| Total Start-up Expenses | $16,500 |
| Start-up Assets | |
| Cash Required | $33,500 |
| Other Current Assets | $0 |
| Long-term Assets | $0 |
| Total Assets | $33,500 |
| Total Requirements | $50,000 |
Services
It has now become standard procedure to include wired connections for all new construction projects, both residential and business-related. The costs associated with wiring an entire building are extremely high when compared to adding a wireless network that will allow for greater speed and flexibility. As more developers focus on this as a utility which must be included, the demand for greater amounts of wireless technology grows. We are also a great solution for those developers looking to provide services for older buildings that do not already have wired connections in place, or where each tenant has individually set up his own wired network. A private Wi-Fi network would be the most cost-effective and quickest way to offer this service across all tenants. As connectivity to the Internet has become a necessary utility, just like water, phone and electrical hookups, so has the trend of providing a central Internet connection.

Pie in the Sky Enterprise – The Pie in the Sky Enterprise solution is a full-service plan for owners and landlords of large commercial and industrial properties. With industrial vacancy rates close to 10% and commercial office space reaching 16%, property owners are looking for ways to stand out in the market and increase revenue. Quickly becoming the “fourth” utility, wireless Internet access gives property owners the ability to provide this service at a fraction of the cost of a traditional high-speed wired network. Pie in the Sky Enterprise is a completely managed service that includes complete installation, 24/7 management and maintenance.
Pie in the Sky Residential – The Pie in the Sky Residential solution is a full-service plan for owners and landlords of multi-family housing units and communities who are looking for ways to add value and improve their occupancy rates. With new housing being built daily, interest rates falling and climbing rental vacancy rates, multi-family property owners are looking for ways to add valued amenities. Over 66 million Americans use the Internet from home and pay individual access fees for their primary Internet connections. By offering a built-in alternative, landlords now have an easy way to decrease their vacancy rates and increase monthly income. The Pie in the Sky Residential solution gives owners the ability to aggregate and redistribute a high-speed Internet connection throughout their property. With cable or DSL, tenants pay anywhere from $10 to $50 a month for an individual Internet connection, either through dial up or broadband. With the Pie in the Sky Residential Enterprise, multi-family property owners can become the preferred Internet provider for their tenants, saving tenants money and increasing landlords’ income and competitive advantage.
Pie in the Sky Travel Hub – Truck Stops: Pie in the Sky Wi-Fi is in the unique position of being able to offer Wi-Fi services to truck stops throughout the U.S. quickly and efficiently. Because of the management team’s prior experience in the trucking industry, our ability to educate and sell to individual truck stops is easily handled using current contacts within the marketplace.
Pie in the Sky ISP Enterprise – Internet Service Providers (ISPs): ISPs play an important role within the company. Pie in the Sky Wi-Fi will partner with key ISPs in order to resell the Pie in the Sky Enterprise solution. The benefit to partnering with the ISPs is focus. The core focus for an ISP is to provide raw connectivity to their clients, whether wired or wireless. In either case, these ISPs need service providers to handle the installation of these networks. ISPs usually either outsource these services, or refer them to a reputable provider, if the company does not do the installation themselves. By partnering with Pie in the Sky Wi-Fi as a hardware solutions provider, the ISPs can remain focused on their core competencies and Pie in the Sky Wi-Fi will tap into an established customer base. Since Pie in the Sky Wi-Fi will need a primary connection to the location where the wireless network is requested, the partnership further solidifies the ISP’s role in providing connectivity to the location. In all circumstances, Pie in the Sky Wi-Fi depends on local ISPs to provide the raw feed to any wireless installation, whether it be a T1 direct to the property or a DS3 powering a larger wireless base station, where Pie in the Sky Wi-Fi can distribute its own T1s wirelessly.
The Pie in the Sky Enterprise Wi-Fi solution can provide network connectivity at speeds starting from 54mbs scalable up to 1Gbps. This connectivity can be distributed throughout an entire area without the need to re-wire any current wired connections. Not only is this faster than older wired networks, but it’s also easier to scale up and upgrade the technology as it improves.
3.1 What is Wi-Fi?
“Wi-Fi” is short for wireless fidelity, technology for broadcasting a high-speed Internet connection to a given area. The Internet connection is plugged into a transmitter, called an access point, and is broadcast to an area about 300 feet in diameter, called a “hotspot.” Properly equipped laptop computers or other portable devices can then pick up the signal and log onto the Internet without the need to be plugged into a hard line connection.
Wi-Fi not only allows users to connect anywhere without the cost and delay of installing wired connections, but it is also faster than traditional DSL or Cable connections. Just like traditional wired connections, Wi-Fi can be securely set up with an existing wired network or set up as a stand-alone wireless network. Wi-Fi prevents the need to install a custom wired network, allowing for greater flexibility, particularly for growing businesses that may need to remain flexible in both location and office layout.
Wi-Fi uses radio technology called 802.11a, 802.11b and 802.11g in order to provide secure, reliable, fast wireless connectivity. All Wi-Fi networks operate in the unlicensed 2.4 and 5 GHz radio bands, with an 11 Mbps (802.11b), or 54 Mbps (802.11a) data rate, or with products that contain both bands (dual band). 802.11g is equally as fast as 802.11a and 802.11b, but boasts the backward compatibility to 802.11b required in order to make inexpensive upgrades.
Enterprise level Wi-Fi is just beginning to gain ground with Internet Service Providers worldwide. The ability to distribute large amounts of bandwidth up to 30 miles between Wi-Fi base stations solves the “last mile” problem in many communities, as well as providing a substantial savings when compared to digging trenches and laying fiber in the ground.
3.2 Detailed Service Descriptions
Although each Wi-Fi installation is unique to the specific needs of each client and building, the options available are simple. The more coverage area needed, the greater economies of scale Pie in the Sky Wi-Fi will enjoy due to the cost structure described below. All products are based on a fixed 40% gross margin on the equipment needed for each installation, plus appropriate installation charges. In addition to the initial installation, a fixed monthly maintenance charge to manage and monitor the network will also be added as part of the standard service offering. These monthly prices are based on the variable raw connection cost (i.e. T1 approximately $800 per month) plus an applicable service fee based on the number of users utilizing the network and the preferred bandwidth for each. For a detailed breakdown of the financial assumptions and pro-forma income statement please refer to the financials section in this document and Appendix I.
Each location receives its primary Internet connection from a wired T1 line or greater. This provides the base station with the ability to transmit connectivity to access points throughout the coverage area so users can access the network. Note: in some cases a high-speed DSL line may be substituted in order to lower the overall installation cost for the client. Although the primary target market for these services consists mostly of larger installations, this may be considered if a T1 is not needed on the property or nearby properties.
Pie in the Sky Wi-Fi provides the installation and maintenance of high-speed wireless networks for specific market segments. All of the installation services are packaged as the “Pie in the Sky Enterprise Solution” with the specific industry applications added. As of the creation of this document the company is actively marketing the Pie in the Sky Enterprise solution to three specific industry segments: commercial property owners, multi-tenant residential property owners, and travel hub operators; we will follow up with marketing to ISPs in the next two to three months. These industry segments will each have a custom package, called Pie in the Sky Wi-Fi Enterprise, Pie in the Sky Residential Wi-Fi & Pie in the Sky Travel Hub Wi Fi, respectively. These three primary service categories will be divided up from a marketing and sales approach, but will all follow the same install and maintenance process.
The Pie in the Sky Commercial Enterprise and Pie in the Sky Residential Enterprise services are both packaged in such a way to allow property owners or individual business owners to increase the value of their property or business by providing tenants or customers with access to high-speed wireless Internet access. These packages are specifically designed to add value to the owner’s enterprise. It is not the goal of Pie in the Sky Wi-Fi to install networks on speculation and market its services directly to the end user. Instead these services are offered to the commercial or residential owner as a way to increase revenue for themselves through greater demand for their services as a result of installing a wireless network, or by actually charging a fee themselves for user access. This can be done in a number of different ways, from increasing base rent or lease rates and including it as an amenity of the property, to adding it as an additional access fee. The Pie in the Sky Enterprise service allows all working areas of the building, property or business to have wireless Internet access.
In addition to the initial installation, the service also includes secure 24/7 remote management and maintenance for a monthly fee. This service provides full service maintenance, user management and monitoring of the entire wireless network. This allows the owner the freedom to offer these services without fear of trying to manage a complex wireless network or troubleshooting problems should they arise. It is completely hands-off for the owner and no technical knowledge is needed in order to offer this at their properties.
The Pie in the Sky ISP Enterprise solution utilizes the same Enterprise installation and monthly management as described above, but it is positioned differently for the ISPs. Since Pie in the Sky Wi-Fi is a wholesale provider of wireless Internet access and does not directly market its services to the end users of any network, an ISP partnership is a great fit. ISPs have similar relationships already created with commercial and residential owners and this is an easy add-on sale when discussing options with these clients. The Pie in the Sky ISP Enterprise service simply allows the ISP to offer the Pie in the Sky Enterprise package through their ISP account, already in place. The installation and management is the same, except the primary connection is still provided through the ISP. The ISP can receive additional revenue as a Pie in the Sky Wi-Fi reseller (at 10%), while adding new customers and maintaining focus on their strengths – raw connectivity.
Pie in the Sky Enterprise – Monthly services included in all plans
- 24/7 remote management
- Network reporting
- Bandwidth management
- Security maintenance
- User management
- User support
- Upgraded equipment as needed
- Hands off management for property owner
- Private customized connection
- No cost truck rolls
Additional services may be added at a later date once the networks are in place at each site. Some of these additional services might include voice over IP (VOIP) and security services. For additional details regarding how these three industry segments will be targeted from a sales and marketing standpoint, please refer to the Marketing Plan section of this document.
3.3 Competitive Comparison
The opportunity for wireless (Wi-Fi) installations and ongoing management of these networks has increased greatly in the past year and is projected by industry experts to grow at an annual rate of no less than 50% a year. The total industry is expected to grow to $2 billion annually by the year 2008. Pie in the Sky Wi-Fi has an opportunity to be one of the first movers in this rapidly growing market. Because of the fragmented nature of the market in its current state, the threat from potential competitors is not necessarily a bad thing. Additional competitors in the market will help grow industry awareness and help drive overall sales within the industry. The overall opportunity in this industry is great and there is unlimited opportunity for wireless installations throughout the next few years. Due to the short-term opportunity to grab a foothold in this emerging market, Pie in the Sky Wi-Fi is aggressively rolling out the services anywhere demand is generated. As demand increases, the scalable sales and installer management strategy will allow the company to take advantage of all opportunities, regardless of location. By 2008 the opportunity, or “gold-rush,” is estimated to be over and market consolidation will begin.
By 2008, Pie in the Sky Wi-Fi will be in a good position to sell the company to a market aggregator looking to increase market share and build a national integrated network of private wireless networks. The most likely aggregators will be the larger telecom, cable or electrical companies currently looking at providing these services via public “Hot Spots” or through cellular networks.
Wi-Fi Advantages
The primary advantage lies in the technology of Wi-Fi itself. Using unlicensed radio frequencies (802.11b, 802.11g & 802.16), each new location can be installed quickly without requiring FCC approval. This not only decreases the total cost of a new installation, but also increases the ability to roll out new networks quickly and efficiently. Cellular technology (including the new 3G band) has significantly higher costs and FCC approval is required. Wi-Fi has absolutely no barriers to entry and can be installed with no restrictions or government regulations. Coupled with the faster connection rate of wireless, the value proposition becomes obvious.
The industry itself has many key advantages over traditional wired networks, from cost to ease, to time for implementation. In many cases, the newer wireless technology will also improve the connection speed at a fraction of the cost. The industry advantage combined with the Pie in the Sky Wi-Fi management team, Board of Advisors and current marketplace demand for such services gives the company a strong starting position and ability to execute on the plan described herein.
3.4 Technology Plan
The Wi-Fi industry is experiencing substantial growth in both technology and user demand. As a result of this fast growth curve it is critical that the Technology department stay up-to-date with the newest technology and ensure that the company dedicate appropriate resources towards the adoption and understanding of any new technology related to the installation, implementation and management of wireless networks. As stated in the marketing section in this document, Pie in the Sky Wi-Fi is a full-service, nimble, professional provider of wireless technology. This requires that our technology department and staff be the leading experts in the field to ensure credibility and success in the marketplace. The technology objective for Pie in the Sky Wi-Fi is to always stay educated on emerging wireless technologies so that it can provide these advanced services to the client in the easiest possible format without the need for the client to understand the complexities involved. The goal is to package the technology provided by Pie in the Sky Wi-Fi in an easy-to-understand service that the client can easily grasp.
3.4.1 Installer Database
In order to expand to the national market quickly and effectively using the suite of products described in this plan, Pie in the Sky Wi-Fi has created a proprietary database of certified installers throughout the US. After the sale has been made, a certified Pie in the Sky Wi-Fi installer will visit the location in order to install the necessary equipment. All other activities, including an initial site assessment and ongoing management of the network, will be operated out of the primary office.
Pie in the Sky Wi-Fi is maintaining an online database for company target, evaluation, and tracking of wireless equipment and service providers that we will use to roll out our Wide Area Network and Local Area Networks. In addition to providing network building and support, we will partner with other service providers to offer value-added services once networks are operational.
The service provider database allows us to track key contact information, service skill sets, pre-contract historical information and Pie in the Sky Wi-Fi contract history. We will track every aspect of contractor relationships.
All service providers will be evaluated on their value and contribution to the Pie in the Sky Wi-Fi Company, utilizing the data stored in the service provider database. The Pie in the Sky Wi-Fi Service Provider database will be key to the success and efficiency of Pie in the Sky Wi-Fi, and will be a cornerstone of all network operations.
3.4.2 New Site Install
Each service location will be completely managed and operated via the Pie in the Sky Wi-Fi remote management system. With an Enterprise Plan, Pie in the Sky Wi-Fi will be that location’s primary ISP for wireless Internet access. For all other plans, the partner ISP will maintain the primary connection, while Pie in the Sky Wi-Fi manages the wireless network via the remote management system. Connectivity will be provided by a wholesale backbone provider or by another Pie in the Sky Wi-Fi access point, depending on location.
3.4.3 Site Assessment
Part of the Pie in the Sky Wi-Fi marketing and technology plan is to include a site assessment in order to determine the costs and return on investment at that particular location. The rep for that particular client will perform the site assessment using a worksheet provided by the company. This site assessment will include mapping out all the necessary data points and equipment needed.
In addition to this initial equipment site assessment, the rep will also provide surveys for owners to distribute to their current tenants in order to determine the demand for the secure Wi-Fi network. In many cases, the survey will help to determine the ROI and potential use of the new wireless network. If the primary connection costs, plus the variable costs to install the necessary access points, is less than the potential revenue that can be derived from the tenants, then the install will not be done unless the client opts for the purchase plan for that location.
Each potential site for a wireless network will be evaluated heavily in two areas before implementation is considered:
- Local needs, goals, and constraints of the company or group of users where the network is being installed.
- Evaluation of role and needs of the site installation in the overall Pie in the Sky Wi-Fi network backbone.
Other local site assessment processes include:
Planning
- Gather and define the business and community requirements of the installation.
- Interview property managers/owners and identify the needs of the users of the network.
- Define security requirements of the installation.
Radio Frequency Survey
- Obtain all site and building plans and documents that are available.
- Document any existing network infrastructure.
- Conduct an on-site Radio Frequency (RF) survey.
- Perform initial RF cell planning.
- Document any existing RF in detail.
- Present findings of survey to network management and design team.
Design
- Determine the placement and characteristics of appropriate access points, power sources, network cabling, wireless gateways, and network monitoring devices.
- Design the RF solution based upon optimum access point, bridge, and repeater placement.
- Determine appropriate security solution for the organization and the environment.
- Determine appropriate billing solution for the installation.
- Shortlist all manufacturers and their equipment and software that will be needed for the installation.
- Design the wireless network producing detailed diagrams and drawings for the installation.
- Determine network support requirements
- Build preliminary costing for the design and implementation.
Backbone Role and Requirements
- Bandwidth Requirements
- Is Pie in the Sky Wi-Fi wireless backbone connectivity an option?
- What other “wired” connectivity options are there?
- What is the business and residential density surrounding and beyond localized network?
Careful planning of all types of wireless network installations prior to implementation will contribute to localized network stability and QOS, as well as contribute to the overall Pie in the Sky Wi-Fi backbone network in a positive way.
3.4.4 Service Provider Recruitment
Not all resources for Pie in the Sky Wi-Fi will come from internal sources; the company will depend on a wide variety of consultant resources for site assessment, installation, service, and support.
We have recruited initial service providers via a directory of potential contractors, compiled through online and offline lists of wireless and network installers nation-wide. We now have a service provider database where the information is refined and qualified to verify they meet the needs of Pie in the Sky Wi-Fi. For a snapshot of this database, please refer to Appendix VII.
We have contacted service providers and solicited their partnership with Pie in the Sky Wi-Fi in their respected geographical service areas. Before a partnership is established, we carefully review the service provider’s business record and establish communication with a few of their businesses references. Only then do we begin contract negotiations.
Continued service provider recruitment will consist of continued online and offline list evaluation, as well as constant presence of partnership/recruitment materials on the Pie in the Sky Wi-Fi website.
3.4.5 Project Implementation
With good planning, Pie in the Sky Wi-Fi can move to implementation fairly rapidly. A standardized approach to installations utilizing proven methods will be used, with a careful eye to the evolution of the process as the industry stabilizes and moves forward.
Here is an overview of Pie in the Sky Wi-Fi network implementation process:
Pre-Installation
- Approve the wireless network design.
- Procure hardware, software.
- Put out Request for Proposal (RFP) to all available installers in Pie in the Sky Wi-Fi database.
- Approve most qualified installer/contractor.
- Schedule network install with approved design and most qualified installer.
Installation
- Install network feed.
- Install equipment.
- Test wireless network.
- Provide training and/or materials to users or support group.
- Go live with the wireless network.
Once a network has gone live, it will be placed into management mode to ensure continued operation of services. However, if warranted, a secondary network design regarding future growth and enhancements to the network will be conducted upon initial project rollout to ensure the network grows in a healthy, revenue generating manner.
3.4.6 Technology Utilized
To satisfy the growing demand for bandwidth, Pie in the Sky Wi-Fi will utilize existing fiber networks tapped with a network switch providing our initial Internet feed. We will always start with a T1 (1.5 Mbps) connection as a foundation. Connected to a network switch, we will use a Point to MultiPoint (PtoMP) wireless base station utilizing the Wireless Outdoor Router Protocol (WORP), 802.16 standard and radius antenna to deliver carrier class broadband Internet to multiple subscriber units at “node points” across an area from the size of facility to several miles. This Point to Multipoint (PtoMP) backbone will utilize the 5.4 GHz unlicensed frequency to deliver each “node point” subscriber unit the broadband connectivity it will need to deliver the last mile service.
Each subscriber unit will then redistribute the broadband Internet wirelessly utilizing the 802.11a, 802.11b, and 80211.g standards via an enterprise-level Access Point (AP) to clients/users with laptops or workstations that are Wi-Fi enabled. Because of the usage of 3 widely adopted wireless standards, authenticated users will be able to connect to the network with low-cost equipment that is obtainable at most computer and electronics stores.
Achieving a high level of Quality of Service (QOS) can prove to be a chore in a wireless network. To ensure success in this area, Pie in the Sky Wi-Fi will follow 802.11e Standards that offer a roadmap for providing a stable, high quality of service for customers connecting to the network.
In order to widen our network and offer inter-operability with outside networks, we will integrate aspects of the 802.11f Standards into our external vendor plans. By watching the 802.11f standards, we can offer roaming and extended off-network services to our customer base, and generate additional revenue.
Network security will be a high priority for the technology team at Pie in the Sky Wi-Fi. The 802.11i Standards will be used as a guideline for Pie in the Sky Wi-Fi security strategies; we will utilize many methods for evaluation and monitoring network usage to ensure security of the network. Though the standard is not 100% ratified it offers a clearer path to follow to take network security beyond current methods and offer security for the network in the future.
Utilizing carrier-class, proven equipment and following global standards for wireless broadband delivery, the Pie in the Sky Wi-Fi technology team will provide Internet services that are just as efficient and fast as traditional wired networks.
3.4.7 Vendor Relationships
Pie in the Sky Wi-Fi uses equipment primarily manufactured by Company A, a global leader in wireless networking technology. Company A provides the equipment needed for backbone distribution, access points, and client access equipment. In additional to Company A, other equipment manufacturer products include Company B, Company C, and D Corporation.
Pie in the Sky Wi-Fi has established an account relationship with E Industries, a value-added distributor which sells all the equipment currently used by Pie in the Sky Wi-Fi. Pie in the Sky Wi-Fi is actively seeking new vendor relationships as manufacturers evolve their product lines and new technologies emerge. Other potential vendors include Company F, a leading 802.16 (MAN) equipment manufacturer, and Company G, an IP voice and video equipment manufacturer.
Keeping an eye on emerging technologies in this fast-paced emerging industry will keep Pie in the Sky Wi-Fi on the cutting edge of the wireless wave. By carefully evaluating standards, equipment, and potential new relationships, we will be able to offer a high level Quality of Service over our networks.
3.4.8 Remote Management
Once a local network has been successfully launched and placed into management mode it will become part of a larger network that is being monitored 24 hours a day, 7 days a week, by system engineers utilizing standardized management software tailored to Pie in the Sky Wi-Fi’s unique network rollout.
Every access point with the network will be configured with management software that can be access remotely by a highly secure network administration interface. Each access point can be monitored separately from the network, or as a whole, by the centralized management system.
All network traffic will be monitored as a whole to evaluate:
- Network bandwidth requirements/usage
- External security threats
- Internal security threats and network misuse
- Service and content usage
Every piece of equipment on the network will be constantly monitored for:
- Network integration and operability
- Quality of Service
- User congestion
All user connections will be monitored individually and as a whole to evaluate:
- Billing requirements
- Network usage statistics
- User bandwidth usage
The entire network will be managed during regular business hours by network engineers, with most changes and updates occurring remotely. However, a team of field resources will be in place to respond to physical equipment failures throughout the network. When critical aspects of the network fail there will be a pager/cell phone communication network to ensure quick response times to any network situation.
Market Analysis Summary
The spectrum Wi-Fi utilizes to deliver broadband is unlicensed by the FCC, which greatly reduces costs in setting up a new network and the time needed in order to install such a network. In turn, this creates a low barrier to entry for Pie in the Sky Wi-Fi and the ability to deliver services in any location without the need to apply for special licenses or permits with the FCC. When compared to setting up a cellular tower in just one area, Wi-Fi takes just a fraction of the time and investment with absolutely no regulatory interference or special permits needed from the FCC.
Fortunately for all users of Wi-Fi, and the company, Wi-Fi is the global standard for this type of connectivity to the Internet. Unlike GSM or CDMA with non-conforming standards, Wi-Fi has become the de facto standard for wireless Internet access, and because of its quick and rapid acceptance, this open standard will stand the test of time. The price of wireless related components, such as the specialized processor chipsets that enable better utilization of this technology, have dramatically decreased in price and jumped in customer demand. For example: in 2002, a Wi-Fi radio chipset cost about $16 wholesale; at the current pace, this price is expected to be lower than $2 by 2006. Demand for these same chipsets has increased over 80% just between 2002 and 2003.
With dropping wholesale prices and rapidly rising demand, the acceptance and implementation of this technology will be very swift. Already in 2003 many manufacturers are offering Wi-Fi cards very inexpensively if not already providing them as built-in options. In 2003 almost all midrange to high-end laptops included built in Wi-Fi capability.
There are various estimates regarding the growth potential of the wireless industry. Some reports look at the Wi-Fi industry as an entire sector, including the sale of both services and hardware, while others examine only the delivery of hardware, chips or services separately. In all cases, the estimated growth is positive for a company like Pie in the Sky Wi-Fi, as a new player in an emerging market. The Wi-Fi industry as a whole is expected to grow at an incredible rate, with projections range from no less than a compounded annual growth rate of 50%, all the way up to 415% over the next five years.
The annual recurring revenue for access services based on unlicensed broadband wireless (UBW) technologies, currently at $250 million, will approach $2 billion by 2008, according to ‘Unlicensed Broadband Wireless: Solutions and Applications,’ a new research report from Parks Associates. This report profiles more than 20 equipment vendors and their unlicensed products, analyzes different service market segments, provides perspectives of incumbent carriers, wireless ISPs, and consumers, addresses market challenges, and forecasts service and equipment revenue growth.
According to this report, residential service revenue will post the most dramatic growth, followed by the small enterprise (SME) market, and the UBW market will have an overall compound annual growth rate (CAGR) of approximately 50%. Underserved markets in the U.S. still represent the low-hanging fruit for service providers using UBW technologies, according to the report, including newly developed communities and urban edge markets.
“In the past two years, the proliferation of wireless ISPs and the declining cost and improved quality of equipment have generated momentum for this industry,” said Yuanzhe (Michael) Cai, research analyst with Parks Associates. “Looking forward, service providers will focus not only on expanding their footprint but also increasing the take rate within existing coverage areas. In the meantime, further declines in equipment costs will help more WISPs justify their residential business plans. Also, the industry will get a further boost around 2006 when real benefits from WiMAX standardization start to materialize.”

By 2005, the analysts cited predict that, “80% of all commercial notebooks sold will be wireless-enabled. They also predict that by 2005, 50% of Fortune 1000 companies will have extensively deployed wireless LAN technology based on the latest 802.11 standards. And, by 2010, the majority of Fortune 2000 companies will have deployed wireless LANs to support standard wired network technology LANs.” –iv
4.1 Market Segmentation
Pie in the Sky Wi-Fi has three primary market segments: Commercial Property owners, Multi-tenant residential property owners, and ISPs. Our marketing efforts toward the first two groups will be similar, while with the third group, we are offering different services, and our marketing focus will be different.
Commercial and Residential Property Owners
The primary customer for Pie in the Sky Wi-Fi is the landlord who has never considered providing Internet access as an additional service to create a competitive advantage, due to cost constraints of installing a wired network. Wired networks do not allow the flexibility that wireless does. For property owners, addressing the individual needs of each tenant is expensive using traditional installation practices, so it was never really a viable option for them due to cost constraints.
Internet Service Providers (ISPs)
The core focus for an ISP is providing raw connectivity to their clients, whether wired or wireless. ISPs need service providers to handle the installation of these networks. In most cases, the ISP will either outsource these services or refer them to a reputable provider if the company does not do the installation themselves.

| Market Analysis | |||||||
| Year 1 | Year 2 | Year 3 | Year 4 | Year 5 | |||
| Potential Customers | Growth | CAGR | |||||
| Commercial property owners | 3% | 3,000 | 3,090 | 3,183 | 3,278 | 3,376 | 3.00% |
| Multi-tenant residential prop owners | 2% | 3,000 | 3,060 | 3,121 | 3,183 | 3,247 | 2.00% |
| Internet Service Providers | 5% | 6,000 | 6,300 | 6,615 | 6,946 | 7,293 | 5.00% |
| Total | 3.77% | 12,000 | 12,450 | 12,919 | 13,407 | 13,916 | 3.77% |
4.2 Target Market Segment Strategy
Although the Pie in the Sky Enterprise solution can be utilized in any area where high-speed wireless Internet access is desired, the company will focus its sales and marketing efforts on three key sectors. We project that the commercial and residential segments will together comprise 50% of overall sales and the ISP segment will fill in the remaining 50%.
Commercial and residential property owners and business owners:
Our primary marketing goal for these segments will be to educate owners about Wi-Fi and the benefits of installing a Wi-Fi network, both as an increased revenue and a cost-saving opportunity. As part of this effort, we will focus on the ease with which a wireless network can be installed or updated in any location without the need to manage the network on-site.
We will also emphasize the value such an amenity can add to a landlord’s property, in terms of attracting and retaining tenants, and differentiating their property from their competitors’. We will use simple analogies, like the extra appeal of a property with private parking included in the rent, to help landlords understand the benefits of investing in a new technology. Just like parking spaces, built-in wireless Internet access offers property owners and businesses an additional competitive advantage over others. What was once a risky, unnecessary and expensive proposition for a building owner is now a needed and highly sought-after utility for all residents, both commercial and residential.
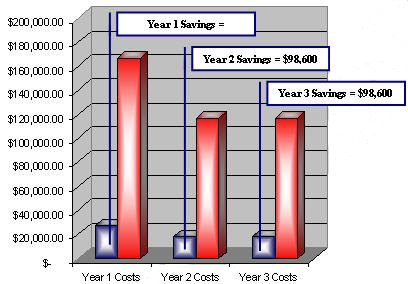
This value proposition will be used throughout all of the marketing initiatives put forth by the company. Below is a cost comparison example for a typical 30,000 square foot office building:
| Pie in the Sky Enterprise Solution | Year 1 Costs | Year 2 Costs | Year 3 Costs |
|
Set-up Costs |
$9,500 | $0 | $0 |
| Pie in the Sky Wi-Fi Remote Management | $18,000 | $18,000 | $18,000 |
| Annual Connection Costs | included | included | included |
| Network maintenance & upgrades | included | included | included |
| User support and installation | included | included | included |
| Server upgrades | included | included | included |
| Total Annual Cost – Wi-Fi | $27,500 | $18,000 | $18,000 |
| Wired Solutions | Year 1 Costs | Year 2 Costs | Year 3 Costs |
| Set-up Costs | $50,000 | $0 | $0 |
| Annual Connection Costs | $9,600 | $9,600 | $9,600 |
| Nework Mainenance & Upgrades* | $60,000 | $60,000 | $60,000 |
| User Support & Installation** | $45,000 | $45,000 | $45,000 |
| Server Upgrades** | $2,000 | $2,000 | $2,000 |
| Total Annual Cost – Wired | $166,600 | $116,600 | $116,600 |
| Total Annual Cost – Pie in the Sky Wi-Fi | $27,500 | $18,000 | $18,000 |
| Total Annual Cost – Wired | $166,600 | $116,600 | $116,600 |
| Cost Savings | $139,100 | $98,600 | $98,600 |
1. Commercial property and business owners
Pie in the Sky Wi-Fi will target office buildings, industrial campuses and truck stops. With vacancy rates at an all time high for commercial property, many building owners are providing Internet access as a way to increase demand and/or increase the lease rates for their property. In most cases, this makes the property more attractive for businesses looking for additional services they do not have to handle themselves. The Pie in the Sky Enterprise solution allows the building owner to provide this service at a low overall cost to them, without the need to manage it themselves.
For developers, including wireless capabilities rather than wired ones allows them to better manage and control the real estate investment, by preventing the need for multiple individual lines coming into the building. This is even more of an issue in renovating older buildings.
Additional Commercial Property owners
Truck Stops: The demand for Wi-Fi service is also greatly increasing in the nation’s truck stops. Pie in the Sky Wi-Fi is in a unique position to offer Wi-Fi services to truck stops throughout the US quickly and efficiently. Because of the management team’s prior experience in the trucking industry, we can easily educate and sell to individual truck stops using current contacts. The truck stop business is very competitive and owners are always looking for way to attract drivers. Pie in the Sky Wi-Fi will heavily target this market, as the company already has a sales force in place that visits over 300 individual truck stops on a monthly basis and will provide a solid foundation for the initial launch of wireless service to these locations.
Industrial Parks: In many industrial parks throughout the U.S. there is no fiber or cable available for broadband access. The individual companies in these parks are often required to purchase a dedicated T1 themselves or simply go without broadband altogether. This segment of the market represents a large opportunity for the company as there are limited “wired” options currently available, and the low price of installing wireless for sharing across multiple tenants will create long-term value, both for the industrial park owner and the tenants as well.
Rural Municipalities: The Pie in the Sky Commercial Enterprise solution is a great option for rural municipalities that are in need of wireless Internet access because the costs of updating wired connections are too great or simply unavailable. This is the single largest opportunity not served by the major players in the market. Currently there are 65 million people living in rural America. 62 million of those individuals are not involved in production agriculture. Rural America comprises over 2,300 counties, 80% of the nation’s land mass, and 65 million people. These areas are often looked at last due to the spread-out nature of the group. The rural communities are very difficult and very expensive to reach with traditional wired connectivity. With the Pie in the Sky commercial Enterprise solution, high-speed wireless access can be delivered inexpensively and more effectively.
2. Multi-tenant residential property owners:
The Pie in the Sky Residential Enterprise solution is focused primarily on multi-tenant housing owners and managers looking to improve the technology available to their renters and/or looking for additional revenue sources outside of the normal rent income collected. Broadband connections are commonplace in new construction for commercial buildings, but are still under-utilized on the residential side. Typically, the tenants themselves arrange the installation of their own broadband connection, whether DSL or cable. In either case, it usually involves additional installation in the individual unit, which must be coordinated and managed by the tenant individually.
Installing a private secure wireless network, with minimal structural modification, not only prevents the need for individual installation in each unit but creates economies of scale for the covered area that benefit both the owner and tenants. The tenants can enjoy a less expensive and faster Internet connection, with the added benefit of portability throughout their living area and common areas of the property. The property owner benefits from the additional revenue generated and competitive advantage in offering these services as an amenity.
3. Internet Service Providers (ISPs):
ISPs play an important role within the company. Pie in the Sky Wi-Fi will partner with key ISPs in order to resell the Pie in the Sky Enterprise solution. The benefit to partnering with the ISPs is focus – Pie in the Sky Wi-Fi can focus on what it does best (assess, design, install, and maintain wireless networks) and let the partnered ISPs focus on their core competencies (providing continuous, high-quality, fast Internet access).
The benefit to the ISP is the ability to receive additional revenue as a Pie in the Sky Wi-Fi reseller (resellers receive 10%), while retaining current customers and adding new ones as a result of the new service offering. This also allows them to stay focus on their core competency, which is providing the raw Internet feed.
Since Pie in the Sky Wi-Fi will need a primary connection to the location where the wireless network is requested, the partnership further solidifies the ISP’s role in providing connectivity to the location. In all circumstances, Pie in the Sky Wi-Fi depends on local ISPs to provide the raw feed to any wireless installation, whether it be a T1 direct to the property, or an OC3 powering a larger wireless base station, where Pie in the Sky Wi-Fi can distribute its own T1s wirelessly. We estimate that ISPs will comprise over 50% of the sales generated for the company.
4.2.1 Market Needs
The current market needs for Wi-Fi are infinite as this is a new industry that is already changing the way Internet access and many other services, such as Voice Over IP (VOIP), will eventually be delivered throughout the world. Although there are many traditional wired networks already established and continuing to roll out today, the cost and ease of implementing a new wireless network will soon become obvious to many businesses and individuals alike. As Wi-Fi capacity increases over the next few years, companies such as Pie in the Sky Wi-Fi will be in the unique position to roll out additional wireless locations without the use of any wired line to the new location. This will decrease the installation time and will require minimal installation and wear and tear on the desired location in order to saturate the entire area with high-speed Internet access.
The true opportunity and advantage Pie in the Sky Wi-Fi will enjoy as the market demand for these services expands will actually result in greater gross margins on the primary connection costs. This is the result of greater economies of scale as each geographical location “fills up” with wireless Internet access. Economies of scale are generated when a specific area within reach of a powered Pie in the Sky Wi-Fi base station has a need for a greater amount of bandwidth. Because of the ability to transmit large amounts of bandwidth through the Pie in the Sky Wi-Fi base stations, one base station can be powered by a T3 or OC3 connection and then provide additional Pie in the Sky Wi-Fi base stations with their primary connection, replacing the need to have a landline connection at that location.
The ability to “cut the cord” at locations that were previously dependent on the primary T1 connection increases the margins for each affected location and centralizes the primary connection point, giving Pie in the Sky even greater ability to provide T1 connections quickly and easily to new locations within reach. For example, a primary base station location with a OC3 connection has enough bandwidth to broadcast up to 28 individual T1 connections wirelessly, without any additional landline use. This will allow Pie in the Sky to activate a new location within minutes of installing the necessary hardware without depending on activating a fixed T1 to that particular location.
The cost savings released by the company would be great, as the fixed T1 cost is no longer needed at the affected location. An example of the break-even point is illustrated on the chart below.

For purposes of this example, existing T1 contracts are not figured in to the return on investment equation, although this is a factor to consider as each area is activated. For estimating purposes the example uses as average monthly service fee estimate of $1,500, T1 wired cost of $800 per location and an OC3 connection cost of $9,000. The break-even point on the monthly connection revenue for installing a central OC3 connection is six clients. From a cost standpoint, the break-even point for expansion is reached when 11 clients are added to the Pie in the Sky network.
Although the wired T1 connections to each location in this illustration will no longer be needed, it should not jeopardize any existing relationships with any partner ISPs, as a larger primary connection to power the base station will still be required. This primary connection will be provided by the partner ISP in that area, thus, mitigating any potential displeasure with the switch from multiple broadband connections to a single larger connection. Long-term, as new wireless installations are added from the new primary base station it could potentially lower the overall margin for the ISP, but significantly increase the overall margins for Pie in the Sky Wi-Fi.
4.2.2 Market Trends
The true potential market for Wi-Fi installations is currently unknown, as the industry is expanding at break-neck speeds and companies are employing multiple strategies in order to build a niche within the industry as a whole. The current trend for many Wi-Fi providers is the rapid deployment of public hot spots, which provide Internet connectivity in places like coffee shops, hotels and other public gathering spots. Although this strategy may prove to be a long-term advantage for these larger providers, the time, resources and return on investment are further out than the Pie in the Sky Wi-Fi business model and are speculative in nature.
4.3 Service Business Analysis
Pie in the Sky Wi-Fi is part of the Data Communications Services industry. Our services are similar to those provided by ISPs and cable modem and DSL installers, in that we help our customers obtain access to the Internet in residential and commercial settings. Unlike the majority of these businesses, however, Pie in the Sky Wi-Fi’s wireless Internet access points are less expensive, less invasive of building infrastructure, more portable, and more scalable. At the moment, wireless data communications are largely being driven by customer demand.
With the explosion of cell phone popularity, consumers have become more demanding about wide-ranging, wireless access to data, communications, and the Internet. The initial wave of Wi-Fi “hotspots” in cafes and airports has fed this demand, and the public now wants better, faster, cheaper, and more accessible wireless connections. Many travelers now seek out wireless access as a necessary amenity in their hotels.
As consumers push demand individually, they are also creating a paradigm shift in business workplaces. Employees comfortable with wireless technology more clearly see the disadvantages to hard-wired, immobile data connections in their offices. As businesses and property owners come to see the public’s eagerness for such technologies, wireless is becoming less of a risk to install, and more of a clear necessity.
The current market for Wi-Fi services is wide open. Aside from a few major providers, mainly focused on public hotspots, the industry is mostly comprised on small local or regional providers. In most cases, the Wi-Fi providers are focused on a small geographical region. The first install a network, then try to sell to individual users within the radius of that signal. Not only is this an expensive and speculative proposition, but the lengthy sales cycle and individual effort needed does not lend to a favorable return on the investment.
4.3.1 Competition and Buying Patterns
For the first two target markets (commercial property owners, multi-unit residential property owners, and business owners), we are competing against hard-wired Internet access, often tenant-installed, and against inertia. There are no direct competitors in our area currently offering wireless access installation for these clients.
Our challenge here is to educate potential customers on the advantages of wireless over wired access, and to encourage them to assume the costs of installation for a larger payoff from tenants in the future (or for the benefits of scalability and upgrading, for business owners).
With ISPs, we are competing against established installers of cable and DSL. We will make ourselves competitive by emphasizing management’s expertise, and by convincing them of the public’s demand for wireless access. As a preferred partner for wireless access installation, we will have a first-mover advantage with ISPs by the time larger conglomerates enter the market.
Web Plan Summary
Pie in the Sky Wi-Fi will create a user-friendly, content-packed website with information on our services and prices, as well as on the general benefits of wireless connections. As we are geared toward wholesale with property owners and ISPs, we will also maintain a section with current news about the use of technology in commercial and residential property management/marketing, as a benefit for our customers.
5.1 Website Marketing Strategy
We will aggressively target managed property advice, information, and association sites with banner ads and pay-per-click links to our website. We will also regularly submit a “technology” column to one of the better real estate management magazines, in order to become known as experts in this field, and build our reputation.
5.2 Development Requirements
The main phase of our website development is already completed. We have assembled the service, pricing, and portal pages for our different target markets, and are compiling articles and useful links for the same groups. We are developing the site ourselves, and will contract with a hosting company for maintenance under our own domain name, once the site is established. Ongoing expenses for maintenance (exclusive of extra marketing, such as pay-per-clicks and banner ads designed to draw traffic) are listed under “Miscellaneous” expenses in the Profit and Loss statement.
Strategy and Implementation Summary
Pie in the Sky Wi-Fi will focus on its strengths, and exploit the market opportunities, by offering a complete service package of wireless installation and management to property owners and ISPs.
6.1 SWOT Analysis
Strengths
Proven and balanced management team
Weaknesses
More working capital needed to fulfill the plan
Opportunities
New and emerging, fast-growing market demand, “gap-filler” position in nationwide coverage
Threats
Possible new competitors drawn to the ripening market
6.1.1 Strengths
The new and emerging market for this technology will require companies with proven expertise in providing technology. The Pie in the Sky Wi-Fi management team has substantial experience, not only in launching new businesses in new markets, but also in developing technology for widespread use.
The biggest strength of Pie in the Sky Wi-Fi is its dynamic and experienced management team. The four principles have an average of ten years of experience directly within new businesses development, emerging technology and telecom. The combination of an experienced management team, coupled with an emerging industry with a projected growth rate of over 300% per year will give Pie in the Sky Wi-Fi a first mover competitive advantage from the outset, with the long-term advantage of a sustainable and scalable business model.
6.1.2 Weaknesses
Although the management team has substantial experience in new business creation and industry expertise in the target market, none of the members have successfully raised enough working capital needed in order to grow a business such as Pie in the Sky Wi-Fi in an emerging market. The stated exit plan is to build the business in a profitable manner and find a company to acquire it by 2008. In order to provide value and attain the stated exit plan it is critical that the business grow as described in this document, stay focused on the businesses model and successfully set up the business so that the equity holders are rewarded for their investment should an acquisition occur. Subsequently, none of the members of the management team have successfully sold a business previously.
To mitigate the risk of these weaknesses, the management team has elected key individuals to participate on the Board of Advisors. This Board of Advisors is set up to fill any perceived management gaps in order to ensure the long-term success of this business plan. The Board of Advisors is comprised of financial experts, merger and acquisition experts, planning experts and technical experts. Members on the Board of Advisors are not compensated monetarily in exchange for their work done on behalf of the company. They will provide an additional feedback to the management team on the implementation of this business plan and assist in the challenges of growing a company in a rapidly changing and emerging market.
6.1.3 Opportunities
Our focus is on owners and managers of commercial and residential property, with an emphasis on private networks for businesses. Although Wi-Fi has started becoming mainstream in the form of public “hotspots,” there is a largely untapped opportunity to introduce Wi-Fi as the new standard in commercial and residential property, particularly in multi-tenant dwellings and business parks.
However, a secondary opportunity will come from the current race to create a blanket Wi-Fi network across the U.S. Many companies right now are trying to cover the entire U.S. with their technology and brand in the form of public hotspots. With our network in place, Pie in the Sky Wi-Fi will be well-positioned to fill in the gaps in this network, through partnerships with many of these aggregators. The fact that Pie in the Sky Wi-Fi is solely focused on non-public hotspots, on private businesses with the ability to broadcast to potential public hotspots, makes the company a strong strategic acquisition for one of the many aggregators currently in the market.
6.1.4 Threats
Because of the current demand and increasing popularity of Wi-Fi installations, many new businesses will enter the marketplace, increasing the competition. This will drive additional investment into the market and create additional competitors which will directly compete with Pie in the Sky Wi-Fi. Fortunately, the market opportunity is still in its early stages, so our first-mover advantage, coupled with our placement as a partner to aggregators and sufficient equity investment should keep the possible threats to a minimum.
6.2 Value Proposition
For all three-market segments targeted, the Pie in the Sky Wi-Fi Enterprise solution can provide value-added services to residential or commercial buildings. With vacancy rates climbing and new housing developments going up every day it is becoming vital for property owners to increase the perceived value of their properties.
As vacancies in commercial buildings climb into the double digits, building owners are seeking ways to differentiate themselves in a cluttered market. A recent trend for many commercial property owners has been to provide additional services such as finished office space, including broadband Internet access, finished office space and even office furnishings like conference tables and office chairs. According to Michael Belka, Senior Vice President of management and leasing at Unico Properties Inc., “it’s all about standing out in a cluttered market. With so much space in the market and few potential tenants, it becomes more important to differentiate your space.”
Pre-built or “speculative” office suites suites offer a fast solution for tenants needing space right away. A tenant with only a month or two to find an office for a start-up business, or one who needs to relocate quickly, is much more likely to choose a pre-built suite with full amenities than to contract for renovation of an existing space.
Pie in the Sky Wi-Fi offers property owners that extra edge in a competitive market, and offers ISPs a reliable partner in meeting the demands of an increasingly wireless customer base.
Why Wireless:
-
Secure
-
Lower costs
-
Value added
-
Quicker ROI
-
Competitive advantage
-
Low Impact
-
Hands-off management
-
Scalable and flexible
-
Potential revenue generator
-
Aggregate Connection for tenants
Managed Services:
- Techonology changes
- Security
- Guaranteed uptime
- User support
- Network administration
- Network monitoring
- Reporting and usage statistics
- Scalable and flexible
- Lower cost
6.3 Sales Strategy
Due to the competitive nature of this rapidly growing market it is necessary to expand and market Pie in the Sky Wi-Fi services through the use of independent contractors. This will allow the company to expand quickly without the added cost and liability of adding employees in-house. These positions will be paid 10% of the initial set-up and a 10% recurring fee based on the recurring revenue collected on a monthly basis. These contractors will solicit residential and commercial business through various forms of contact, i.e. telephone, personal contact, networking groups, etc. All of these independent contractors will report directly to Mr. Jones until a regional manager is established in the area.
Pie in the Sky Wi-Fi will rely on these reps to provide information about the service to both the initial client (landlords, municipalities, etc.) and the end-users. The Commercial division has a longer sales cycle than the Residential division, due to the contract situation of current tenants with their existing wired Internet providers. Commercial accounts are placed into a database with their current contract length and estimated time of expiration for follow-up by the reps at a later date.

The core sales focus, regardless of sales cycle, is equal across all three divisions. Each division will be set up quickly and simultaneously. The company will begin with independent contractors dedicated to these divisions within the specific markets. Although Pie in the Sky Wi-Fi is a nationally focused company, each division will be rolled out using a staged approach, entering region by region for maximum efficiency in installations and sales management.
Rollout started in Oregon, and will begin shortly throughout the northwest, launching a new state no later than every two months, while keeping contractors within their specific divisions. This staged rollout will be accomplished strategically by separating the nation into 6 individual regions consisting of the Northwest, Southwest, North Central, South Central, North East, and South East. The regional breakdown or “footprint” described is illustrated in greater detail in Appendix VI of this document. The goal is to hire a specific regional manager to oversee these specific territories, their businesses, and their contractors as the states in the regions become active.
Mr. Jones and Mr. Smith will kick off the business the week of Jan 26, 2004 with initial sales calls. They will begin actively pursuing business within all 3 divisions while recruiting independent contractors to seek customers within the territories. Since the county in which we are based is somewhat of an anomaly when it comes to the adoption of new business and technology, the founders will not be deterred by the lack of acceptance in the local market. The opportunity for this business model is far greater than one individual market; although the business is based in one location, rapid movement into new markets will be essential to grow the business.
The first goal is to immediately make contact with the primary ISPs and other key accounts. These relationships will give Pie in the Sky Wi-Fi instant credibility in the marketplace and will provide the company with an established business and sales team that will promote the service.
We will emphasize the ISPs’ advantages in partnering with us
- First, we can help them fill the current void in the marketplace by providing a product/service previously unavailable to them
- Second, when they sell Pie in the Sky Wi-Fi services, we will compensate them ISP, as well using the ISP as the primary connection provider. This will solidify the clients’ dependency on that ISP’s connection, giving the ISP a competitive advantage and increasing the revenue generated.
The ISP resale program accounts for 50% of the overall business, so making inroads in this area is vital to the overall success and sustainability of Pie in the Sky Wi-Fi.
6.3.1 Key Account Management
The Executive Management Team will handle key accounts in the beginning; these key accounts will consist of ISPs, Competitive Local Exchange Carriers (CLECs), hardware providers, and installers. Establishing relationships with these groups quickly and effectively will be vital to the success of the business. As we grow, the employed Regional Managers will take on this responsibility. When entering a new market, we will focus immediately upon establishing these relationships.
6.3.2 Sales Forecast
Pie in the Sky Wi-Fi’s sales objectives are to reach as many building owners and ISP operators throughout North America as possible, quickly and for the least amount of capital outlay. The sales department will grow and manage as many capable independent contractors as possible, while maintaining the high level of quality service and the good reputation of Pie in the Sky Wi-Fi in the marketplace. Dedicated management and oversight of these contractors is critical to the success of the company as a whole.
Each territory is split up by specialty and certain metropolitan boundaries will be defined as each location is added to the sales team. The area in which the reps will be working will determine territories. Within each of territory, the company will simultaneously target both the commercial and residential divisions to gain maximum market share and market penetration as quickly as possible.
Sales growth shown in the table and chart below is based on solid industry data, as outlined in the Market Analysis.
Using the average install cost of $10,000 in gross income with a monthly management fee of $1,500, total sales of $586,750 should be easily attained for the first year of operations. Cost of Goods includes all up-front costs assumed by Pie in the Sky Wi-Fi for installation of base stations. Costs for these installations are averaged out into the prices for all customers. Monthly details for the first year sales forecast can be found in the Appendix.


| Sales Forecast | |||
| Year 1 | Year 2 | Year 3 | |
| Sales | |||
| Enterprise Plan Revenue | $200,000 | $660,000 | $1,560,000 |
| ISP Plan Revenue | $200,000 | $660,000 | $1,560,000 |
| Monthly – Enterprise Plan | $124,500 | $936,000 | $2,859,000 |
| Monthly – ISP Plan | $62,250 | $468,000 | $1,429,500 |
| Total Sales | $586,750 | $2,724,000 | $7,408,500 |
| Direct Cost of Sales | Year 1 | Year 2 | Year 3 |
| Enterprise Plan Revenue | $120,000 | $396,000 | $936,000 |
| ISP Plan Revenue | $120,000 | $396,000 | $936,000 |
| Monthly – Enterprise Plan | $66,400 | $499,200 | $1,524,800 |
| Monthly – ISP Plan | $0 | $0 | $0 |
| Subtotal Direct Cost of Sales | $306,400 | $1,291,200 | $3,396,800 |
6.4 Milestones
The management team has established some basic milestones to keep the business plan priorities in place. Responsibility for implementation falls on the shoulders of the founders fairly equally in the first year. This Milestones Table below will be updated as the year progresses using the actual tables. New milestones will be added as the first year of operations commences.

| Milestones | |||||
| Milestone | Start Date | End Date | Budget | Manager | Department |
| First round outside investment | 3/10/2005 | 3/20/2005 | $0 | ABC | Department |
| Interview Potential Employees | 3/10/2005 | 3/25/2005 | $0 | ABC | Department |
| First Employees start | 4/1/2005 | 4/5/2005 | $0 | ABC | Department |
| Deadline for First Sales | 4/1/2005 | 4/10/2005 | $0 | ABC | Department |
| Long-term loan begins | 7/1/2005 | 7/15/2005 | $0 | ABC | Department |
| Hit break-even | 9/1/2005 | 9/30/2005 | $0 | ABC | Department |
| Interviewing for Sales Team | 6/10/2005 | 10/15/2005 | $0 | ABC | Department |
| Sales Commissions reach $10,000/month | 12/1/2005 | 12/31/2005 | $0 | ABC | Department |
| Totals | $0 | ||||
6.5 Competitive Edge
Pie in the Sky Wi-Fi is targeting the 4.25-billion-square-foot commercial office market, the even larger multi-family housing market, the nation’s independent trucks stops and travel plazas, as well as all the ISPs currently providing Internet connectivity throughout the world. The focus is on expanding our customers’ available services by providing value-added features in the form of wireless Internet access to their current services or properties.
Wi-Fi providers are a part of a very fragmented market, with many players all trying to find their niche. Currently there is a race going on to create public hotspots in an effort to control a nationwide network. Although this may be a sound business model in the long-term, Pie in the Sky Wi-Fi does have the desire to provide these services, nor does it have the resources to compete against the major players at this level. Currently there are a few major providers making a name for themselves in the public hotspot arena, but this is a very speculative and costly process. These access points are dependent upon subscribers signing up for a monthly plan or logging in and paying a site access fee. Although this may prove to be a viable way to build a nationwide Wi-Fi network, it is not our main focus.
By focusing on the middle-man (the building owner or ISP), Pie in the Sky Wi-Fi does not have to negotiate contracts with individual end-users, but can focus on installation and service of access for entire buildings, or let the ISP develop contracts and wholesale contract to do the installations. This model gives us a huge advantage over our competitors, who are focused on creating geographical coverage, and then have to find ways to sell this existing utility to end-users, one by one.
For example, MobileStar Network Corp. filed for bankruptcy because it couldn’t sign up enough customers to cover the cost of building its wireless network. With dozens of companies in every city chasing the same market, few people have been willing to pay for the service, which costs about $30 a month. According to analysts, MobileStar was paying large fees to put their service in Starbucks locations, with no clear return on investment.
Since Pie in the Sky Wi-Fi is a wholesale provider of Wi-Fi networks, a new location is not installed until the hardware and installation costs are paid for, plus a 40% margin. Once installed, the wireless feed is provided and managed by Pie in the Sky Wi-Fi, but the individual who requested the network to be installed is responsible for the promotion and user participation of the network. Since the business model does not depend on individual users subscribing to the network, the risk/reward proposition is maximized. It is more effective to sell and maintain one large client and get paid up front, than depend on multiple users sold individually while covering the costs up front. This will allow us to be profitable from the outset and outlast our competitors, so we are well-positioned when the consolidation of the market occurs in 2008 (see exit strategy for additional details).
6.6 Marketing Strategy
Although Wi-Fi has been around for a while, it has just recently become known to the general public and many property owners are still unaware of what it is, much less how it can positively increase the services inside their buildings or municipalities. The largest marketing challenge will be trying to convey the vast benefits of using Wi-Fi and how it works with a simple and easy to understand message. Many traditional clients may not truly understand how the technology works and may shy away from looking at Pie in the Sky Wi-Fi as a viable solution for their broadband needs. The educational materials produced will promote the industry as a whole; examples of the explanations are included below in Sales Literature.
6.6.1 Distribution Strategy
Residential Division:
The residential division will have specific reps targeting apartment buildings, condos, residential developments, and upper end housing developments with an owners’ association. The CRO will establish and define territories prior to hiring representatives.
Commercial Division:
The commercial division will include specific reps targeting Commercial buildings, such as office buildings, industrial parks, and general large-scale businesses and office buildings. Although “hotspot” implementation is not the primary focus, these may be a residual benefit as these commercial footprints are established.
ISP Division:
The ISP division will be handled in the beginning by the Executive Management team. However, as Regional Sales Managers are employed, the responsibility for generating these ISP accounts will be transferred to them.
6.6.2 Marketing Programs
The primary outlet for announcing information about the company will be through the use of press releases distributed on the AP wire and through our website. The company will utilize PR Newswire in order to promote news and updated information about Pie in the Sky Wi-Fi on an ongoing basis. The cost associated with the distribution of each press release is minimal when compared to the credibility and promotion these releases can produce.
The marketing budget will increase as a result of increased sales (variable budget of 2% of revenue). As we increase marketing monies, we will introduce additional promotional initiatives to increase brand awareness in specific target markets. These opportunities will be evaluated on a quarterly basis as they come available. Promotional sponsorships of events may be of benefit in certain areas, based on the sales and marketing mix already used in a particular area.
6.6.3 Sales Literature
Wi-Fi allows individual users to connect to the Internet via a high-speed connection without being tied to a phone line or broadband cable. With recent advancements in Wi-Fi technology, the speed, security and reliability are on par with traditional wired connections. Wireless connections have several advantages over traditional wired ones, including the low cost to connect large areas and the spatial flexibility of locating desktop or laptop computers within the connected area. As described earlier in this document, the cost savings in the first year alone could amount to more than $100,000 when compared to a similarly configured network.
User Benefits
The benefits of a wireless network are still being realized everyday. Some of the many exciting benefits of Wi-Fi are:
- Freedom from wires
- Mobility
- Quick and unobtrusive network rollouts
- Lower cost than fiber or wired networks
- Easy to network many computers and appliances
- Available where cable and DSL are not
- Lower cost phone system, compared to switch phone networks
- Connect multiple buildings/locations efficiently
- Increased worker productivity
- Quicker return on investment
There are many small ways in which wireless is saving time and gaining efficiencies for people everyday. For instance, the ability to go through e-mail in the lobby, check your database during an appointment, or present networked data to colleagues in a meeting, all add up. Businesses and individuals are realizing every day how wireless connections can break down barriers for collaboration and introduce new ways to make the most of online time.
6.6.4 Pricing Strategy
The pricing structure for all installations is based on the direct hardware and installation costs for each particular site plus 40%. For the purposes of this plan, we have based our direct costs on an average 30,000 sq. ft coverage area. With the 40% markup on materials, installation and hardware, the company is assured positive variable margins on any job before it begins. The monthly fee charged will be based on the number of users on network:
- 0 – 30 users = $1,500 a month
- 31 – 50 users = $1,750 a month
- 51 – 100 users = $2,000 a month
- 100 + negotiable
This pricing structure is intended to be competitive with the current fees incurred for traditional networks. Because of the remote management feature of the Pie in the Sky Enterprise system, the cost savings compared to an on-site managed network is significant. For a detailed customer ROI analysis, please refer to the Target Market Segmentation Strategy topic, above.
6.6.5 Promotion Strategy
Our marketing objective is to quickly and aggressively establish Pie in the Sky Wi-Fi’s wireless “footprint.” The executive management team will employ a low-key educational approach.
- First we will introduce Pie in the Sky Wi-Fi to the potential prospect, setting an appointment to discuss Wi-Fi and how it might benefit the prospect.
- We will gain buy-in from the prospect, then do a site assessment of the location to determine the cost associated with launching such a service.
- When the site assessment is made, the prospect may choose to survey his/her tenants to determine their interest in such a service within the building.
- Once the site assessment is done, the rep will return and do a question and answer session, hopefully including potentially-interested tenants.
- We will then present the site assessment and the detailed cost analysis for launching a wireless network.
- The rep will close the prospect, write up an order form, and establish an installation timeline together with the property owner.
Management Summary
The Pie in the Sky Wi-Fi management team was put together specifically for the purpose of building Pie in the Sky Wi-Fi aggressively. This team has worked together for some time in other capacities and can quickly adjust to maintain control, competitiveness and an undying desire to accomplish any challenge.
In addition to the diversified and competent management team, we have created a Board of Advisors in an effort to lend additional experience and expertise to the company. These individuals are not employees of the company, but rather an advisory group selected by the management team in order to assist with the execution of the business model moving forward. Members of the advisory board were selected for their industry knowledge, experience and general interest in assisting the company succeed.
[Proprietary and confidential information has been removed.]
7.1 Personnel Plan
Salesperson/Reseller Recruitment
This is the great challenge, finding good sales people. Our ideal salesperson would be an outside “employed” rep; however, because of the nature of this beginning we are required to start with independent contractors. Initially, we will use the CRO’s pool of contacts for sales recruiting. We may desire to do some advertising on such recruitment websites as Monster.com. We will look for experience in sales, telecom, commercial or residential building management will be looked for, professionalism with a can do attitude will be a must as is the single intangible above the others. Commission payments for these independently contracted sales people can be found in the Profit and Loss Statement.
In-House Sales/Support Staff
As Pie in the Sky Wi-Fi grows and our sales team grows we will hire sales field assistants for the regional managers; these assistants will work out of the corporate office, but will assist regional managers in the field. We plan to hire up to five in-house sales staff in the first year.
| Personnel Plan | |||
| Year 1 | Year 2 | Year 3 | |
| Officer 1 | $35,000 | $60,000 | $75,000 |
| Officer 2 | $35,000 | $60,000 | $75,000 |
| Officer 3 | $35,000 | $60,000 | $75,000 |
| Officer 4 | $35,000 | $60,000 | $75,000 |
| Sales/Support 1 | $31,500 | $42,000 | $42,000 |
| Sales/Support 2 | $31,500 | $42,000 | $42,000 |
| Sales/Support 3 | $21,000 | $42,000 | $42,000 |
| Sales/Support 4 | $14,000 | $42,000 | $42,000 |
| Sales/Support 5 | $7,000 | $42,000 | $42,000 |
| Total People | 9 | 9 | 9 |
| Total Payroll | $245,000 | $450,000 | $510,000 |
Financial Plan
Pie in the Sky Wi-Fi’s establishment requires an investment of $50,000 during start-up, which will be provided by the founders. In order to keep up our growth, and, in particular, to build the base stations necessary for generating sales in the first year, we will need a first-round outside investment of at least $100,000 by March. In July, unless we have raised additional outside investment, we will seek a long-term loan for another $100,000.
Based on solid market research, and known costs, we will be able to grow the business rapidly over the first three years, if we obtain this initial funding. The business will reach the break-even point early in the second year, and begin to generate reasonable profits for a venture of this kind.
After the first year, our Balance Sheet is quite positive. Our ratios will be good for the industry in which we are operating – data communications services.
We do not plan to pay any interim dividends to founders or outside investors, by investment will be bought out at the liquidity event described below in the Exit Strategy, when we sell to a market consolidator. Our financial and sales plans are geared toward positioning us well for this event.
8.1 Exit Strategy
The ultimate goal for Pie in the Sky Wi-Fi is to sell to a market consolidator by 2008. These market consolidators may consist of larger companies such as telecom, cable or other utilities looking to aggregate their services further or well funded development stage companies formed for the sole purpose of creating a large wireless network both public and private. Air-Q, a development stage company, is a prime example of the type of aggregator currently in the marketplace that builds itself on the acquisition of companies such as Pie in the Sky Wi-Fi.
2004 marks the beginning of a new market with the widespread application of wireless applications across the world. While many large companies are still installing fiber networks to tie major metropolitan areas together across their own proprietary network the “last mile” problem still exists. It is far too costly to roll out fiber to each individual home and business, which clearly give wireless access an advantage long-term. With the upcoming adoption of the 802.16 standard speeds available through wireless installations that Pie in the Sky Wi-Fi will have in the Pie in the Sky Enterprise installations will be comparable to fiber at a fraction of the installation time and cost.
As the major companies begin to look at filling in the gaps in their fiber networks, they will use wireless networks and companies with experience installing and maintaining these to do so. Pie in the Sky Wi-Fi will position itself from the outset not only to be an industry leader in the Wi-Fi marketplace, but to make it known that the network and installations and going concern is available for purchase when the market consolidators begin to look at expanding market share. By 2008, we project that Pie in the Sky Wi-Fi will have over 2,000 installed wireless applications under management with the rights and ability to increase the bandwidth and range of the hardware at any given time.
The installed wireless network, coupled with the expertise Pie in the Sky Wi-Fi can offer a larger company, will give an aggregator a competitive advantage in the marketplace with a single purchase as well as the ability to launch new wireless networks quickly and easily. Industry analyses suggest that the wireless market will undergo a large market consolidation in the year 2008, with larger companies purchasing smaller companies such as Pie in the Sky Wi-Fi in order to quickly expand their wireless capabilities with installed access points. With both cable and telephone companies competing for this same user base, we anticipate multiple potential bidders.
The larger telecom companies have already identified wireless as a solution to the cost challenges in a competitive market.
8.2 Start-up Funding
The owners of the company will contribute $50,000 to begin operations in January. Although we will need additional funding within the first year (see Cash Flow for details), this amount should be enough to see us through the initial months, as we set up the office and begin to hire staff.
| Start-up Funding | |
| Start-up Expenses to Fund | $16,500 |
| Start-up Assets to Fund | $33,500 |
| Total Funding Required | $50,000 |
| Assets | |
| Non-cash Assets from Start-up | $0 |
| Cash Requirements from Start-up | $33,500 |
| Additional Cash Raised | $0 |
| Cash Balance on Starting Date | $33,500 |
| Total Assets | $33,500 |
| Liabilities and Capital | |
| Liabilities | |
| Current Borrowing | $0 |
| Long-term Liabilities | $0 |
| Accounts Payable (Outstanding Bills) | $0 |
| Other Current Liabilities (interest-free) | $0 |
| Total Liabilities | $0 |
| Capital | |
| Planned Investment | |
| Owner | $50,000 |
| Investor | $0 |
| Additional Investment Requirement | $0 |
| Total Planned Investment | $50,000 |
| Loss at Start-up (Start-up Expenses) | ($16,500) |
| Total Capital | $33,500 |
| Total Capital and Liabilities | $33,500 |
| Total Funding | $50,000 |
8.3 Important Assumptions
Sales: All base stations will be installed by Pie in the Sky Wi-Fi, at no additional charge to the customer. The cost for this installation is figured into the Cost of Goods sold.
Approximate costs used for planning purposes in this document are as follows:
- Per 100,000 square foot, outdoor installation (Travel Hub Application) = $4,100 w/o base station
- Per 100,000 square foot, outdoor installation (Travel Hub Application) = $2,900 w/ base station
- Per 100,000 square foot, indoor installation (Enterprise Application) = $5,500 w/o base station
- Per 100,000 square foot, indoor installation (Enterprise Application) = $4,300 w/o base station
Approximate pricing for each application is as follows. The price to the client remains the same with or without the base station in place:
- Per 100,000 square foot, outdoor installation (Travel Hub Application) = $6,000 w/ base station
- Per 100,000 square foot, indoor installation (Enterprise Application) = $4,200 w/o base station
Accounts Receivable: The majority of the sales will be cash sales with approximately 25% being sales on credit. We estimate, on average, AR collection in 45 days.
Accounts Payable: The average AP goal is no more than 30 days, with certain payments occurring sooner to take advantage of discounts where applicable.
Tax Rate: Tax rate is estimated at 30%.
Personnel Burden: Personnel Burden is estimated at 15%. This includes taxes, benefits, vacation pay, etc.
8.4 Break-even Analysis
The following table and chart show a break-even analysis for the first year of business. We will pass this point in September, but by that point in the year, we will have hired the full complement of staff, and so the yearly average calculated in this table will not be enough to actually break-even at the end of the year, with such high operating expenses. We anticipate breaking even early in the second year.

| Break-even Analysis | |
| Monthly Revenue Break-even | $69,714 |
| Assumptions: | |
| Average Percent Variable Cost | 52% |
| Estimated Monthly Fixed Cost | $33,309 |
8.5 Projected Profit and Loss
The following table and chart show our projected Profit and Loss for the next three years.
Sales, which includes the sale of both the Enterprise and ISP plans are based on the projected growth of the marketplace, the company’s sales capacity and financial resources. Pie in the Sky Wi-Fi’s ability to install the number of networks listed depends on obtaining sufficient funding.
Expenses, which are comprised primarily of marketing, sales commissions, training and certification for installers, research and development, labor and general company overhead reflect an aggressive posture to penetrate the market quickly in order to take advantage of a short window of opportunity.
2004 will be the first reported fiscal year for Pie in the Sky Wi-Fi. For the first year and a half of start-up operations, we expect a loss, in order to build the organization infrastructure. Due to the infancy of the market and the current rush to supply the demand driven by wireless users, it is critical that Pie in the Sky Wi-Fi dedicate the appropriate amount of resources and time to take advantage of any first mover advantages to be gained by this new market.
In 2004, the four founders and officers of the corporation will take a minimal salary in order to maximize the resources dedicated to building the market and customer base during the first year of operations. Our deadline for completing the first sales is April with moderate growth projections through the end of the year. For the majority of officers, this reflects a reduction in personal income of close to 40%.
The first two quarters of the 2004 fiscal year will be dedicated to setting up the corporation, so that the officers can easily transfer into their new positions from their current roles at ABC, Inc. It is important for the individual officers, the current company they are employed at and Pie in the Sky Wi-Fi that this transition happen quickly yet not too soon as to avoid any adverse affects on all parties involved. Total sales for 2004 are expected to be $586,750. Total Operating Expenses are shown in the table, and profit is projected to be a loss.
5-Year Projected Income Statement
The long-term income estimate for Pie in the Sky Wi-Fi is conservative, based on the projected growth rate of the wireless industry. By 2008, the total market for these services is expected to exceed $2 billion. The annual recurring revenue for access services based on unlicensed broadband wireless (UBW) technologies, currently at $250 million, will approach $2 billion by 2008.
We expect by 2008 to have revenues of $38.7 million with a very strong profits. Pie in the Sky Wi-Fi’s market share, based on industry projections, would be less than 2%. For planning purposes this estimate is intended to be conservative, as the market will not only be changing quickly over the next few years, but it is expected that the market will remain fairly fragmented during this same period. This fragmentation may limit total overall market share for Pie in the Sky Wi-Fi. However, it is the fragmentation that also creates the initial opportunity for Pie in the Sky Wi-Fi to enter markets with relative ease and will be of benefit when looking to execute the exit plan outlined above.


| Pro Forma Profit and Loss | |||
| Year 1 | Year 2 | Year 3 | |
| Sales | $586,750 | $2,724,000 | $7,408,500 |
| Direct Cost of Sales | $306,400 | $1,291,200 | $3,396,800 |
| Other Costs of Sales | $0 | $0 | $0 |
| Total Cost of Sales | $306,400 | $1,291,200 | $3,396,800 |
| Gross Margin | $280,350 | $1,432,800 | $4,011,700 |
| Gross Margin % | 47.78% | 52.60% | 54.15% |
| Expenses | |||
| Payroll | $245,000 | $450,000 | $510,000 |
| Marketing/Promotion | $0 | $0 | $148,170 |
| Depreciation | $0 | $0 | $0 |
| Sales Commissions | $88,013 | $408,600 | $1,111,275 |
| Payroll Taxes | $0 | $0 | $0 |
| Office Rent | $10,500 | $18,000 | $36,000 |
| Telephone | $2,700 | $4,200 | $8,400 |
| Internet & Utilities | $5,600 | $9,600 | $14,400 |
| Computer Supplies and Maintenance | $15,000 | $18,000 | $36,000 |
| Travel | $22,500 | $30,000 | $60,000 |
| Insurance | $1,400 | $2,400 | $4,800 |
| Misc. | $9,000 | $9,000 | $9,000 |
| Total Operating Expenses | $399,713 | $949,800 | $1,938,045 |
| Profit Before Interest and Taxes | ($119,363) | $483,000 | $2,073,655 |
| EBITDA | ($119,363) | $483,000 | $2,073,655 |
| Interest Expense | $4,792 | $8,572 | $7,143 |
| Taxes Incurred | $0 | $0 | $0 |
| Net Profit | ($124,154) | $474,428 | $2,066,512 |
| Net Profit/Sales | -21.16% | 17.42% | 27.89% |
8.6 Projected Cash Flow
Cash flow is expected to be favorable,if we can obtain sufficient funding, as noted in the table, below. It will be necessary to obtain outside funding for the venture two times during the first year. We will need first-round capital of $100,000 as soon as possible in order to begin operations according to the business plan; we have set the deadline for this funding at March. The second round of funding will be needed if all the sales target and expense goals are met accordingly. This is expected to be in the month of September and will need to be a minimum of an additional $100,000. This will allow the cash balance to stay positive, despite a negative net cash flow for the first 13 months of operation.
There are no dividends paid out during the operating period of the plan. Investors will be paid out upon the liquidity event described in the Exit Strategy described above.

| Pro Forma Cash Flow | |||
| Year 1 | Year 2 | Year 3 | |
| Cash Received | |||
| Cash from Operations | |||
| Cash Sales | $440,063 | $2,043,000 | $5,556,375 |
| Cash from Receivables | $108,975 | $543,631 | $1,551,036 |
| Subtotal Cash from Operations | $549,038 | $2,586,631 | $7,107,411 |
| Additional Cash Received | |||
| Sales Tax, VAT, HST/GST Received | $0 | $0 | $0 |
| New Current Borrowing | $0 | $0 | $0 |
| New Other Liabilities (interest-free) | $0 | $0 | $0 |
| New Long-term Liabilities | $100,000 | $0 | $0 |
| Sales of Other Current Assets | $0 | $0 | $0 |
| Sales of Long-term Assets | $0 | $0 | $0 |
| New Investment Received | $100,000 | $0 | $0 |
| Subtotal Cash Received | $749,038 | $2,586,631 | $7,107,411 |
| Expenditures | Year 1 | Year 2 | Year 3 |
| Expenditures from Operations | |||
| Cash Spending | $245,000 | $450,000 | $510,000 |
| Bill Payments | $392,318 | $1,725,248 | $4,582,749 |
| Subtotal Spent on Operations | $637,318 | $2,175,248 | $5,092,749 |
| Additional Cash Spent | |||
| Sales Tax, VAT, HST/GST Paid Out | $0 | $0 | $0 |
| Principal Repayment of Current Borrowing | $0 | $0 | $0 |
| Other Liabilities Principal Repayment | $0 | $0 | $0 |
| Long-term Liabilities Principal Repayment | $7,140 | $14,285 | $14,285 |
| Purchase Other Current Assets | $0 | $0 | $0 |
| Purchase Long-term Assets | $0 | $0 | $0 |
| Dividends | $0 | $0 | $0 |
| Subtotal Cash Spent | $644,458 | $2,189,533 | $5,107,034 |
| Net Cash Flow | $104,580 | $397,098 | $2,000,377 |
| Cash Balance | $138,080 | $535,178 | $2,535,555 |
8.7 Projected Balance Sheet
After the first year, when we invest heavily in establishing Pie in the Sky Wi-Fi’s staff, contacts, infrastructure and reputation, our Balance Sheet will become increasingly solid.
| Pro Forma Balance Sheet | |||
| Year 1 | Year 2 | Year 3 | |
| Assets | |||
| Current Assets | |||
| Cash | $138,080 | $535,178 | $2,535,555 |
| Accounts Receivable | $37,713 | $175,081 | $476,171 |
| Other Current Assets | $0 | $0 | $0 |
| Total Current Assets | $175,792 | $710,259 | $3,011,725 |
| Long-term Assets | |||
| Long-term Assets | $0 | $0 | $0 |
| Accumulated Depreciation | $0 | $0 | $0 |
| Total Long-term Assets | $0 | $0 | $0 |
| Total Assets | $175,792 | $710,259 | $3,011,725 |
| Liabilities and Capital | Year 1 | Year 2 | Year 3 |
| Current Liabilities | |||
| Accounts Payable | $73,586 | $147,910 | $397,150 |
| Current Borrowing | $0 | $0 | $0 |
| Other Current Liabilities | $0 | $0 | $0 |
| Subtotal Current Liabilities | $73,586 | $147,910 | $397,150 |
| Long-term Liabilities | $92,860 | $78,575 | $64,290 |
| Total Liabilities | $166,446 | $226,485 | $461,440 |
| Paid-in Capital | $150,000 | $150,000 | $150,000 |
| Retained Earnings | ($16,500) | ($140,654) | $333,774 |
| Earnings | ($124,154) | $474,428 | $2,066,512 |
| Total Capital | $9,346 | $483,774 | $2,550,286 |
| Total Liabilities and Capital | $175,792 | $710,259 | $3,011,725 |
| Net Worth | $9,346 | $483,774 | $2,550,286 |
8.8 Business Ratios
The following table outlines some of the more important ratios from the Data Communications Services industry. The final column, Industry Profile, details specific ratios based on the industry as it is classified by the Standard Industry Classification (SIC) code, 4899.
| Ratio Analysis | ||||
| Year 1 | Year 2 | Year 3 | Industry Profile | |
| Sales Growth | 0.00% | 364.25% | 171.97% | 1.63% |
| Percent of Total Assets | ||||
| Accounts Receivable | 21.45% | 24.65% | 15.81% | 13.44% |
| Other Current Assets | 0.00% | 0.00% | 0.00% | 54.99% |
| Total Current Assets | 100.00% | 100.00% | 100.00% | 72.36% |
| Long-term Assets | 0.00% | 0.00% | 0.00% | 27.64% |
| Total Assets | 100.00% | 100.00% | 100.00% | 100.00% |
| Current Liabilities | 41.86% | 20.82% | 13.19% | 18.73% |
| Long-term Liabilities | 52.82% | 11.06% | 2.13% | 21.60% |
| Total Liabilities | 94.68% | 31.89% | 15.32% | 40.33% |
| Net Worth | 5.32% | 68.11% | 84.68% | 59.67% |
| Percent of Sales | ||||
| Sales | 100.00% | 100.00% | 100.00% | 100.00% |
| Gross Margin | 47.78% | 52.60% | 54.15% | 57.81% |
| Selling, General & Administrative Expenses | 68.94% | 35.18% | 26.26% | 34.36% |
| Advertising Expenses | 0.00% | 0.00% | 0.00% | 1.02% |
| Profit Before Interest and Taxes | -20.34% | 17.73% | 27.99% | 5.81% |
| Main Ratios | ||||
| Current | 2.39 | 4.80 | 7.58 | 2.18 |
| Quick | 2.39 | 4.80 | 7.58 | 1.76 |
| Total Debt to Total Assets | 94.68% | 31.89% | 15.32% | 49.82% |
| Pre-tax Return on Net Worth | -1328.46% | 98.07% | 81.03% | 7.28% |
| Pre-tax Return on Assets | -70.63% | 66.80% | 68.62% | 14.51% |
| Additional Ratios | Year 1 | Year 2 | Year 3 | |
| Net Profit Margin | -21.16% | 17.42% | 27.89% | n.a |
| Return on Equity | -1328.46% | 98.07% | 81.03% | n.a |
| Activity Ratios | ||||
| Accounts Receivable Turnover | 3.89 | 3.89 | 3.89 | n.a |
| Collection Days | 42 | 57 | 64 | n.a |
| Accounts Payable Turnover | 6.33 | 12.17 | 12.17 | n.a |
| Payment Days | 27 | 22 | 21 | n.a |
| Total Asset Turnover | 3.34 | 3.84 | 2.46 | n.a |
| Debt Ratios | ||||
| Debt to Net Worth | 17.81 | 0.47 | 0.18 | n.a |
| Current Liab. to Liab. | 0.44 | 0.65 | 0.86 | n.a |
| Liquidity Ratios | ||||
| Net Working Capital | $102,206 | $562,349 | $2,614,576 | n.a |
| Interest Coverage | -24.91 | 56.35 | 290.30 | n.a |
| Additional Ratios | ||||
| Assets to Sales | 0.30 | 0.26 | 0.41 | n.a |
| Current Debt/Total Assets | 42% | 21% | 13% | n.a |
| Acid Test | 1.88 | 3.62 | 6.38 | n.a |
| Sales/Net Worth | 62.78 | 5.63 | 2.90 | n.a |
| Dividend Payout | 0.00 | 0.00 | 0.00 | n.a |
References
- TechKnowledge Strategies, June 2003
- The Strategis Group, predicts that wireless broadband revenues will increase at a 418% compound annual rate over the next five years
- Parks Associates
- wirelessnewsfactor.com
- January 2004 – Fast Company: Wireless in San Diego
- US Department of Agriculture, Rural Development Rural Utilities Service: Hilda Gay Legg
- Wall Street Journal, Building Owners Finish Offices to Lure Tenants, December 24, 2003
- Wall Street Journal, Building Owners Finish Offices to Lure Tenants, December 24, 2003
- See appendix I for region breakdowns
- Wireless access firms place Net bets, Yuki Noguchi, WASHINGTON POST 1/29/04
- Peace, Love & Wi-Fi, BY DAN O’SHEA, Telephony, Mar 18, 2002
- http://doc.advisor.com/doc/11165
- Unlicensed Broadband Wireless: Solutions and Applications, Parks Associates
- Investor information available through Air-Q.com
- Reality Wireless Networks, Investor Relations
- Wall Street Journal, January 20, 2004. “Now Comes the Hard Part”
- http://zdnet.com.com/2100-1105-983099.html
- New happy hour, December 26, 2003 Silicon Valley/San Jose Business Journal
9.1 Additional Quotes
- “Wi-Fi is going to get cheaper and easier to deploy,” said Schmidt of NYCWireless. “As people encounter these networks increasingly for free, they are going to expect them for free–as a facility service, just like AC, heating or water.”
- “We needed it to provide what the customers were telling us they wanted — they wanted wireless,” says Axel Suray, general manager at the hotel.
- The total number of enterprise mobile Internet users will grow more than 18% in the next five years. “The greatest percentage of growth will take place in Latin America,” Chamberlain continued. “Businesses today are the predominant subscribers to mobile voice services and they will lead the adoption of wireless Internet as well.”
- Enterprise Wireless Internet Users to Exceed 160 Million by 2008 – from Parks Associates
- Fixed Wireless Broadband Represents Target Market of 20 Million Households – Strategy Analytics
- Sixty-four percent of US households have at least one mobile phone. A growing number of consumers — 9% of mobile users — subscribe to a carrier’s branded data service. But many basic phone and network features go unused. – Forrester Research
- According to IDC, the number of wireless subscribers in the United States will increase at a whopping compound annual growth rate (CAGR) of 73 percent, from approximately 5 million in 2000 to more than 84 million in 2005.
- According to primary IDC research, the number of business wireless Internet users will grow from 2.6 million in 2000 to more than 49 million in 2005.
- IDC’s comprehensive report on wireless Internet service, U.S. Wireless Internet Subscriber Forecast and Analysis, 2000-2005, looks at the overall growth in the U.S. wireless Internet market. This study examines the growth in the type of network wireless services will be delivered on.
- “Wireless Internet in the Enterprise 10 Years On,” a new report from Probe Group, reviews the history of wireless data services and forecasts the worldwide number of enterprise users of wireless Internet services will exceed 160 million by 2008.
- IDC said it expects worldwide information security services (ISS) spending to increase to more than $23.5 billion by 2007, or at a compound annual growth rate (CAGR) of 20.9 percent.
- Total spending in the US on Wi-Fi will grow in 2004 by 7.6% for a total of $144.7 billion, and spending last year totaled $134.5 billion, up 7.9% from 2002, says a new report.
- A TIA (Telecommunications Industry Association) Market Review and Forecast predicts the wireless market will reach $190.8 billion by 2007, with a 9.1% compound annual growth rate from 2004 to 2007.
Appendix
| Sales Forecast | |||||||||||||
| Month 1 | Month 2 | Month 3 | Month 4 | Month 5 | Month 6 | Month 7 | Month 8 | Month 9 | Month 10 | Month 11 | Month 12 | ||
| Sales | |||||||||||||
| Enterprise Plan Revenue | 0% | $0 | $0 | $0 | $10,000 | $10,000 | $20,000 | $20,000 | $20,000 | $30,000 | $30,000 | $30,000 | $30,000 |
| ISP Plan Revenue | 0% | $0 | $0 | $0 | $10,000 | $10,000 | $20,000 | $20,000 | $20,000 | $30,000 | $30,000 | $30,000 | $30,000 |
| Monthly – Enterprise Plan | 0% | $0 | $0 | $0 | $1,500 | $3,000 | $6,000 | $9,000 | $12,000 | $16,500 | $21,000 | $25,500 | $30,000 |
| Monthly – ISP Plan | 0% | $0 | $0 | $0 | $750 | $1,500 | $3,000 | $4,500 | $6,000 | $8,250 | $10,500 | $12,750 | $15,000 |
| Total Sales | $0 | $0 | $0 | $22,250 | $24,500 | $49,000 | $53,500 | $58,000 | $84,750 | $91,500 | $98,250 | $105,000 | |
| Direct Cost of Sales | Month 1 | Month 2 | Month 3 | Month 4 | Month 5 | Month 6 | Month 7 | Month 8 | Month 9 | Month 10 | Month 11 | Month 12 | |
| Enterprise Plan Revenue | $0 | $0 | $0 | $6,000 | $6,000 | $12,000 | $12,000 | $12,000 | $18,000 | $18,000 | $18,000 | $18,000 | |
| ISP Plan Revenue | $0 | $0 | $0 | $6,000 | $6,000 | $12,000 | $12,000 | $12,000 | $18,000 | $18,000 | $18,000 | $18,000 | |
| Monthly – Enterprise Plan | $0 | $0 | $0 | $800 | $1,600 | $3,200 | $4,800 | $6,400 | $8,800 | $11,200 | $13,600 | $16,000 | |
| Monthly – ISP Plan | $0 | $0 | $0 | $0 | $0 | $0 | $0 | $0 | $0 | $0 | $0 | $0 | |
| Subtotal Direct Cost of Sales | $0 | $0 | $0 | $12,800 | $13,600 | $27,200 | $28,800 | $30,400 | $44,800 | $47,200 | $49,600 | $52,000 | |
| Pro Forma Profit and Loss | |||||||||||||
| Month 1 | Month 2 | Month 3 | Month 4 | Month 5 | Month 6 | Month 7 | Month 8 | Month 9 | Month 10 | Month 11 | Month 12 | ||
| Sales | $0 | $0 | $0 | $22,250 | $24,500 | $49,000 | $53,500 | $58,000 | $84,750 | $91,500 | $98,250 | $105,000 | |
| Direct Cost of Sales | $0 | $0 | $0 | $12,800 | $13,600 | $27,200 | $28,800 | $30,400 | $44,800 | $47,200 | $49,600 | $52,000 | |
| Other Costs of Sales | $0 | $0 | $0 | $0 | $0 | $0 | $0 | $0 | $0 | $0 | $0 | $0 | |
| Total Cost of Sales | $0 | $0 | $0 | $12,800 | $13,600 | $27,200 | $28,800 | $30,400 | $44,800 | $47,200 | $49,600 | $52,000 | |
| Gross Margin | $0 | $0 | $0 | $9,450 | $10,900 | $21,800 | $24,700 | $27,600 | $39,950 | $44,300 | $48,650 | $53,000 | |
| Gross Margin % | 0.00% | 0.00% | 0.00% | 42.47% | 44.49% | 44.49% | 46.17% | 47.59% | 47.14% | 48.42% | 49.52% | 50.48% | |
| Expenses | |||||||||||||
| Payroll | $0 | $0 | $0 | $7,000 | $7,000 | $27,000 | $30,500 | $30,500 | $34,000 | $34,000 | $37,500 | $37,500 | |
| Marketing/Promotion | 2% | $0 | $0 | $0 | $0 | $0 | $0 | $0 | $0 | $0 | $0 | $0 | $0 |
| Depreciation | $0 | $0 | $0 | $0 | $0 | $0 | $0 | $0 | $0 | $0 | $0 | $0 | |
| Sales Commissions | 10% | $0 | $0 | $0 | $3,338 | $3,675 | $7,350 | $8,025 | $8,700 | $12,713 | $13,725 | $14,738 | $15,750 |
| Payroll Taxes | 15% | $0 | $0 | $0 | $0 | $0 | $0 | $0 | $0 | $0 | $0 | $0 | $0 |
| Office Rent | $0 | $0 | $0 | $0 | $0 | $1,500 | $1,500 | $1,500 | $1,500 | $1,500 | $1,500 | $1,500 | |
| Telephone | $50 | $50 | $50 | $50 | $50 | $350 | $350 | $350 | $350 | $350 | $350 | $350 | |
| Internet & Utilities | $0 | $0 | $0 | $0 | $0 | $800 | $800 | $800 | $800 | $800 | $800 | $800 | |
| Computer Supplies and Maintenance | $0 | $0 | $1,500 | $1,500 | $1,500 | $1,500 | $1,500 | $1,500 | $1,500 | $1,500 | $1,500 | $1,500 | |
| Travel | $0 | $0 | $0 | $2,500 | $2,500 | $2,500 | $2,500 | $2,500 | $2,500 | $2,500 | $2,500 | $2,500 | |
| Insurance | 15% | $0 | $0 | $0 | $0 | $0 | $200 | $200 | $200 | $200 | $200 | $200 | $200 |
| Misc. | $750 | $750 | $750 | $750 | $750 | $750 | $750 | $750 | $750 | $750 | $750 | $750 | |
| Total Operating Expenses | $800 | $800 | $2,300 | $15,138 | $15,475 | $41,950 | $46,125 | $46,800 | $54,313 | $55,325 | $59,838 | $60,850 | |
| Profit Before Interest and Taxes | ($800) | ($800) | ($2,300) | ($5,688) | ($4,575) | ($20,150) | ($21,425) | ($19,200) | ($14,363) | ($11,025) | ($11,188) | ($7,850) | |
| EBITDA | ($800) | ($800) | ($2,300) | ($5,688) | ($4,575) | ($20,150) | ($21,425) | ($19,200) | ($14,363) | ($11,025) | ($11,188) | ($7,850) | |
| Interest Expense | $0 | $0 | $0 | $0 | $0 | $0 | $823 | $814 | $804 | $794 | $784 | $774 | |
| Taxes Incurred | $0 | $0 | $0 | $0 | $0 | $0 | $0 | $0 | $0 | $0 | $0 | $0 | |
| Net Profit | ($800) | ($800) | ($2,300) | ($5,688) | ($4,575) | ($20,150) | ($22,248) | ($20,014) | ($15,166) | ($11,819) | ($11,971) | ($8,624) | |
| Net Profit/Sales | 0.00% | 0.00% | 0.00% | -25.56% | -18.67% | -41.12% | -41.59% | -34.51% | -17.90% | -12.92% | -12.18% | -8.21% | |
| Pro Forma Cash Flow | |||||||||||||
| Month 1 | Month 2 | Month 3 | Month 4 | Month 5 | Month 6 | Month 7 | Month 8 | Month 9 | Month 10 | Month 11 | Month 12 | ||
| Cash Received | |||||||||||||
| Cash from Operations | |||||||||||||
| Cash Sales | $0 | $0 | $0 | $16,688 | $18,375 | $36,750 | $40,125 | $43,500 | $63,563 | $68,625 | $73,688 | $78,750 | |
| Cash from Receivables | $0 | $0 | $0 | $0 | $2,967 | $5,863 | $9,392 | $12,850 | $13,975 | $18,067 | $22,088 | $23,775 | |
| Subtotal Cash from Operations | $0 | $0 | $0 | $16,688 | $21,342 | $42,613 | $49,517 | $56,350 | $77,538 | $86,692 | $95,775 | $102,525 | |
| Additional Cash Received | |||||||||||||
| Sales Tax, VAT, HST/GST Received | 0.00% | $0 | $0 | $0 | $0 | $0 | $0 | $0 | $0 | $0 | $0 | $0 | $0 |
| New Current Borrowing | $0 | $0 | $0 | $0 | $0 | $0 | $0 | $0 | $0 | $0 | $0 | $0 | |
| New Other Liabilities (interest-free) | $0 | $0 | $0 | $0 | $0 | $0 | $0 | $0 | $0 | $0 | $0 | $0 | |
| New Long-term Liabilities | $0 | $0 | $0 | $0 | $0 | $0 | $100,000 | $0 | $0 | $0 | $0 | $0 | |
| Sales of Other Current Assets | $0 | $0 | $0 | $0 | $0 | $0 | $0 | $0 | $0 | $0 | $0 | $0 | |
| Sales of Long-term Assets | $0 | $0 | $0 | $0 | $0 | $0 | $0 | $0 | $0 | $0 | $0 | $0 | |
| New Investment Received | $0 | $0 | $100,000 | $0 | $0 | $0 | $0 | $0 | $0 | $0 | $0 | $0 | |
| Subtotal Cash Received | $0 | $0 | $100,000 | $16,688 | $21,342 | $42,613 | $149,517 | $56,350 | $77,538 | $86,692 | $95,775 | $102,525 | |
| Expenditures | Month 1 | Month 2 | Month 3 | Month 4 | Month 5 | Month 6 | Month 7 | Month 8 | Month 9 | Month 10 | Month 11 | Month 12 | |
| Expenditures from Operations | |||||||||||||
| Cash Spending | $0 | $0 | $0 | $7,000 | $7,000 | $27,000 | $30,500 | $30,500 | $34,000 | $34,000 | $37,500 | $37,500 | |
| Bill Payments | $27 | $800 | $850 | $2,921 | $20,975 | $22,744 | $42,253 | $45,324 | $48,127 | $66,030 | $69,432 | $72,835 | |
| Subtotal Spent on Operations | $27 | $800 | $850 | $9,921 | $27,975 | $49,744 | $72,753 | $75,824 | $82,127 | $100,030 | $106,932 | $110,335 | |
| Additional Cash Spent | |||||||||||||
| Sales Tax, VAT, HST/GST Paid Out | $0 | $0 | $0 | $0 | $0 | $0 | $0 | $0 | $0 | $0 | $0 | $0 | |
| Principal Repayment of Current Borrowing | $0 | $0 | $0 | $0 | $0 | $0 | $0 | $0 | $0 | $0 | $0 | $0 | |
| Other Liabilities Principal Repayment | $0 | $0 | $0 | $0 | $0 | $0 | $0 | $0 | $0 | $0 | $0 | $0 | |
| Long-term Liabilities Principal Repayment | $0 | $0 | $0 | $0 | $0 | $0 | $1,190 | $1,190 | $1,190 | $1,190 | $1,190 | $1,190 | |
| Purchase Other Current Assets | $0 | $0 | $0 | $0 | $0 | $0 | $0 | $0 | $0 | $0 | $0 | $0 | |
| Purchase Long-term Assets | $0 | $0 | $0 | $0 | $0 | $0 | $0 | $0 | $0 | $0 | $0 | $0 | |
| Dividends | $0 | $0 | $0 | $0 | $0 | $0 | $0 | $0 | $0 | $0 | $0 | $0 | |
| Subtotal Cash Spent | $27 | $800 | $850 | $9,921 | $27,975 | $49,744 | $73,943 | $77,014 | $83,317 | $101,220 | $108,122 | $111,525 | |
| Net Cash Flow | ($27) | ($800) | $99,150 | $6,766 | ($6,634) | ($7,132) | $75,573 | ($20,664) | ($5,779) | ($14,528) | ($12,347) | ($9,000) | |
| Cash Balance | $33,473 | $32,673 | $131,823 | $138,590 | $131,956 | $124,824 | $200,398 | $179,734 | $173,954 | $159,426 | $147,079 | $138,080 | |
| Pro Forma Balance Sheet | |||||||||||||
| Month 1 | Month 2 | Month 3 | Month 4 | Month 5 | Month 6 | Month 7 | Month 8 | Month 9 | Month 10 | Month 11 | Month 12 | ||
| Assets | Starting Balances | ||||||||||||
| Current Assets | |||||||||||||
| Cash | $33,500 | $33,473 | $32,673 | $131,823 | $138,590 | $131,956 | $124,824 | $200,398 | $179,734 | $173,954 | $159,426 | $147,079 | $138,080 |
| Accounts Receivable | $0 | $0 | $0 | $0 | $5,563 | $8,721 | $15,108 | $19,092 | $20,742 | $27,954 | $32,763 | $35,238 | $37,713 |
| Other Current Assets | $0 | $0 | $0 | $0 | $0 | $0 | $0 | $0 | $0 | $0 | $0 | $0 | $0 |
| Total Current Assets | $33,500 | $33,473 | $32,673 | $131,823 | $144,152 | $140,677 | $139,933 | $219,489 | $200,475 | $201,908 | $192,189 | $182,317 | $175,792 |
| Long-term Assets | |||||||||||||
| Long-term Assets | $0 | $0 | $0 | $0 | $0 | $0 | $0 | $0 | $0 | $0 | $0 | $0 | $0 |
| Accumulated Depreciation | $0 | $0 | $0 | $0 | $0 | $0 | $0 | $0 | $0 | $0 | $0 | $0 | $0 |
| Total Long-term Assets | $0 | $0 | $0 | $0 | $0 | $0 | $0 | $0 | $0 | $0 | $0 | $0 | $0 |
| Total Assets | $33,500 | $33,473 | $32,673 | $131,823 | $144,152 | $140,677 | $139,933 | $219,489 | $200,475 | $201,908 | $192,189 | $182,317 | $175,792 |
| Liabilities and Capital | Month 1 | Month 2 | Month 3 | Month 4 | Month 5 | Month 6 | Month 7 | Month 8 | Month 9 | Month 10 | Month 11 | Month 12 | |
| Current Liabilities | |||||||||||||
| Accounts Payable | $0 | $773 | $773 | $2,223 | $20,240 | $21,339 | $40,745 | $43,740 | $45,930 | $63,719 | $67,008 | $70,297 | $73,586 |
| Current Borrowing | $0 | $0 | $0 | $0 | $0 | $0 | $0 | $0 | $0 | $0 | $0 | $0 | $0 |
| Other Current Liabilities | $0 | $0 | $0 | $0 | $0 | $0 | $0 | $0 | $0 | $0 | $0 | $0 | $0 |
| Subtotal Current Liabilities | $0 | $773 | $773 | $2,223 | $20,240 | $21,339 | $40,745 | $43,740 | $45,930 | $63,719 | $67,008 | $70,297 | $73,586 |
| Long-term Liabilities | $0 | $0 | $0 | $0 | $0 | $0 | $0 | $98,810 | $97,620 | $96,430 | $95,240 | $94,050 | $92,860 |
| Total Liabilities | $0 | $773 | $773 | $2,223 | $20,240 | $21,339 | $40,745 | $142,550 | $143,550 | $160,149 | $162,248 | $164,347 | $166,446 |
| Paid-in Capital | $50,000 | $50,000 | $50,000 | $150,000 | $150,000 | $150,000 | $150,000 | $150,000 | $150,000 | $150,000 | $150,000 | $150,000 | $150,000 |
| Retained Earnings | ($16,500) | ($16,500) | ($16,500) | ($16,500) | ($16,500) | ($16,500) | ($16,500) | ($16,500) | ($16,500) | ($16,500) | ($16,500) | ($16,500) | ($16,500) |
| Earnings | $0 | ($800) | ($1,600) | ($3,900) | ($9,588) | ($14,163) | ($34,313) | ($56,561) | ($76,574) | ($91,741) | ($103,559) | ($115,530) | ($124,154) |
| Total Capital | $33,500 | $32,700 | $31,900 | $129,600 | $123,913 | $119,338 | $99,188 | $76,939 | $56,926 | $41,760 | $29,941 | $17,970 | $9,346 |
| Total Liabilities and Capital | $33,500 | $33,473 | $32,673 | $131,823 | $144,152 | $140,677 | $139,933 | $219,489 | $200,475 | $201,908 | $192,189 | $182,317 | $175,792 |
| Net Worth | $33,500 | $32,700 | $31,900 | $129,600 | $123,913 | $119,338 | $99,188 | $76,939 | $56,926 | $41,760 | $29,941 | $17,970 | $9,346 |


