
Stroll Net
Executive Summary
Stroll Net will provide a unique forum for communication and entertainment through the medium of public Internet access. In the first year, we will set up 16 Internet-enabled pay-kiosks in public spaces throughout Tech City, in locations frequented by business travelers and students, but with no nearby internet cafes or other similar competition. Our flagship location will be next to the downtown bus and train station, where, for less than a dollar, travelers can check email, locate phone numbers, and look up directions on any of the multiple online-mapping sites. They can also simply surf the net, as their time and budget allows. By accepting both real money (coins and dollar bills) and credit cards, we can catch both the casual browser and the traveler with money to burn.
Stroll Net is the answer to an increasing demand. Americans want access to the methods of communication and volumes of information now available on the Internet, at a cost they can afford, and in such a way that they aren’t confined to a bedroom or office desk. Stroll Net’s goal is to provide the community with a convenient and affordable way to access the Internet away from home and the office.
This business plan is prepared to obtain financing in the amount of $299,671. The supplemental financing is required to begin the purchase of public Internet terminals, the purchase of an office warehouse, office equipment and supplies and company vehicles, and to cover expenses in the first year of operations. Additional financing has already been secured in the form of $10,500 of personal savings from owners Cam Piotr and Bob Green, and a long-term loan of $100,000.
Stroll Net will be incorporated as a Limited Liability Corporation. This will shield the owners, Cam Piotr and Bob Green, from issues of personal liability and double taxation. The investors will be treated as shareholders and therefore will not be liable for more than their individual personal investment of $5,250 each.
The financing, in addition to the capital contributions from the owners, will allow Stroll Net to successfully open and maintain operations through year one. The large initial capital investment will allow Stroll Net to provide its clients and customers with the most innovative public Internet terminal available. A unique and innovative product is required to provide the customers with a service that is insurmountable by any competition. Successful operation in year one will provide Stroll Net a customer base that will allow it to be self-sufficient in year two.
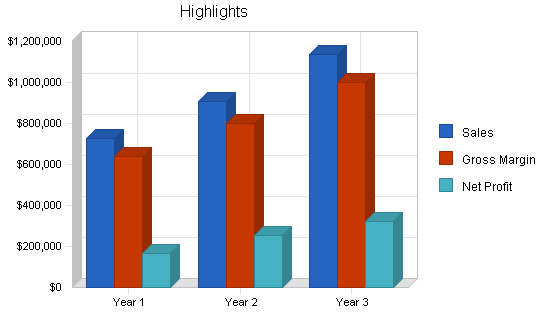
For an investment of $299,671, we project dividends of $100,000 in year two, and $200,000 in year three, depending on cash flows. These projections are based on actual business revenues from similar start-up customers of our internet kiosk supplier in other states. In the first year, with a break-even point of $42,599 per month, we expect revenues of $727,072 and net profit of 18.5%, or $134,305. By year three, revenues will increase to $1,136,067, and the net worth of Stroll Net will increase to $610,320. Dividends thereafter will depend on cash flows; in year five, investors will have the option of being bought out by the company owners.
1.1 Mission
As the popularity of the Internet continues to grow at an exponential rate, easy and affordable access is quickly becoming a necessity of life. Stroll Net will provide internet users and business travelers alike the ability to access the Internet, via our public Internet terminals or a wireless WiFi connection away from home and the office. For a minimal fee, internet users, young and old, will be able to access the internet while they stay in hotels, wait at airports, shop in shopping malls and so on.
We look to be the leader in introducing an innovative and quality public Internet terminal to our current market. We will add value to our community by maintaining a quality product and providing a valuable service. Our terminals will utilize the most advance technologies and our staff will possess the utmost in customer service experience.
1.2 Keys to Success
As a start-up company, new to the industry, we must be focused and work hard to create an acceptance for ourselves and our products and services within the marketplace. The keys to our success are:
- The placement of an innovative product and quality service that is able to both expand existing markets and create new ones.
- A steady, disciplined pattern of growth.
- The development of a good relationship with clients and customers.
1.3 Objectives
Stroll Net’s objectives for the first year of operation include:
- The introduction of an innovative product that offers an affordable and convenient way for Internet users to access the Internet away from home.
- The creation of a unique environment that allows traveling business people access to their own files and programs.
- The placement of 100 public Internet terminals operating throughout the North MyState area.
For the following two years our growth objectives includes:
- A growth in public Internet terminals placed by 20% each year.
- A growth in revenues by 25% per year.
1.4 Risks
The risks involved with starting Stroll Net are:
- Will there be a demand for the services offered by Stroll Net in Tech City?
- Will the popularity of the Internet continue to grow, or is the Internet a fad?
- Will individuals be willing to pay for the service Stroll Net offers?
- Will the cost of accessing the Internet from home drop so significantly that there will not be a market for public Internet terminals?
Company Summary
Stroll Net, soon to be located on the south side of Tech City, MyState, will offer the community convenient and affordable way to access the Internet away from home and the office. Stroll Net’s public Internet terminals will provide full access to email, video email, the Web and other applications, such as a prepaid storefront. Stroll Net will provide clients and customers with a unique and innovative product and service.
Stroll Net’s public Internet terminals will appeal to individuals of all ages and backgrounds. The ease-of-use and instructional menu will appeal to the audience that does not associate themselves with the computer age. Great locations, such as hotel lobbies and coffee shops, will provide business people with a convenient way to access the Internet and office files away from the office.
2.1 Company Ownership
Stroll Net is a privately-held Limited Liability Corporation. Cam Piotr and Bob Green, co-founders of Stroll Net, hold equal stock positions of 26% each as majority owners. Investors will receive one share of Stroll Net stock for every $6,244 of investment, up to 48%.
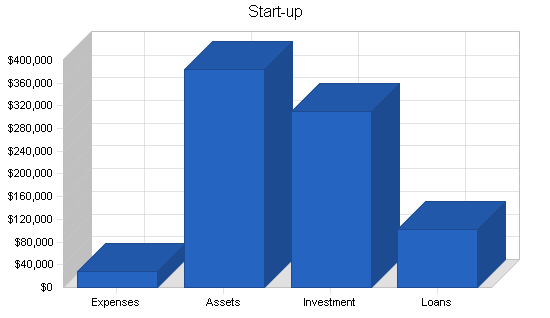
2.2 Start-up Summary
Stroll Net’s start-up costs will cover the purchase of public Internet terminals (our long-term assets), the purchase of an office warehouse, office equipment and supplies, company vehicles, capital to cover losses in the first year, and capital to cover any and all expenses required to operate business on a daily basis for the first year.
Short-term Assets – Fixtures: 2 computers = $4,600, one printer = $1,000, one scanner = $500, 4 tables w/chairs = $2,600, 2 computer desks w/chairs = $2,400, three telephones = $300, for a total fixture cost of $11,400.

In addition, we plan on a large initial marketing/design budget, to cover the kiosk design and grand opening advertising.
| Start-up | |
| Requirements | |
| Start-up Expenses | |
| Marketing/Advertising | $4,000 |
| Design Fee | $14,100 |
| Freight | $6,250 |
| Utilities | $500 |
| Professional Fees | $1,500 |
| Insurance | $1,500 |
| Supplies | $500 |
| Postage | $111 |
| Total Start-up Expenses | $28,461 |
| Start-up Assets | |
| Cash Required | $60,000 |
| Other Current Assets | $11,400 |
| Long-term Assets | $312,810 |
| Total Assets | $384,210 |
| Total Requirements | $412,671 |
| Start-up Funding | |
| Start-up Expenses to Fund | $28,461 |
| Start-up Assets to Fund | $384,210 |
| Total Funding Required | $412,671 |
| Assets | |
| Non-cash Assets from Start-up | $324,210 |
| Cash Requirements from Start-up | $60,000 |
| Additional Cash Raised | $0 |
| Cash Balance on Starting Date | $60,000 |
| Total Assets | $384,210 |
| Liabilities and Capital | |
| Liabilities | |
| Current Borrowing | $0 |
| Long-term Liabilities | $100,000 |
| Accounts Payable (Outstanding Bills) | $2,500 |
| Other Current Liabilities (interest-free) | $0 |
| Total Liabilities | $102,500 |
| Capital | |
| Planned Investment | |
| Mr. Cam Piotr | $5,250 |
| Mr. Bob Green | $5,250 |
| Additional Investment Requirement | $299,671 |
| Total Planned Investment | $310,171 |
| Loss at Start-up (Start-up Expenses) | ($28,461) |
| Total Capital | $281,710 |
| Total Capital and Liabilities | $384,210 |
| Total Funding | $412,671 |
Products and Services
Stroll Net’s public Internet terminals will provide customers full access to email, video email, WWW and other applications such as a prepaid storefront. Stroll Net will provide clients and customers with a unique and innovative product and service.
3.1 Product and Service Description
Walk-up Internet Access: Customers pay with either cash or credit card and receive a specific amount of time on the terminal in exchange for their payment. Customers can surf the Internet, check email and send video email.
Wireless Internet Access: Away from the home, WiFi users can access the Internet through our Wireless Hotspots.
Prepaid Storefront: An application that allows customers to purchase products such as Prepaid Calling Cards, Prepaid Wireless Top-up, and Prepaid Mobile Content (games, graphics, ring tones, etc.).
Multimedia Advertising: Local, regional, or national companies can advertise using multimedia on-screen advertisements. Advertisements consist of full motion video “commercials,” picture files, or twelve advertising buttons.

Technical Specifications
- Wheelchair Accessible
- Front access for easy service and maintenance
- 15.1 inch touch screen LCD monitor
- Industrial spill and vandal proof keyboard
- Web Camera with integrated microphone
- Bill Acceptor and Credit Card Reader
- Stereo Speakers
- Wireless Router
- Surfnet Premier
PC Specifications
- 2.4GHz Celeron Processor
- 40GB hard Drive
- 256MB DDR-RAM
- 52X CD-ROM
- Floppy Drive
- Windows XP Professional
- 3-Year Hotswap
3.2 Competitive Comparison
Stroll Net will be first to place public Internet Terminals in Tech City. Stroll Net will differentiate itself from other ISPs in Tech City by providing its customers with the ability to access the Internet even when they are away from their own computer.
We do not expect to replace standard internet access options (home, school, and work-based computers), but to supplement them; similar ventures, such as Internet cafes, have seen great success.
3.3 Fulfillment
Stroll Net will obtain its public Internet terminals from Supplier One, Inc. located in Vancouver, BC. Supplier One, Inc. will provide the locating service and the hardware required to run Stroll Net. Internet access and networking will be provided through Supplier Two.
3.4 Technology
Stroll Net will invest in terminals with high-speed computers to provide its customers with a fast and efficient connection to the Internet. The computers will be reliable and fun to work with. Stroll Net will continue to upgrade and modify the systems to stay current with communications technology. One of the main attractions associated with public Internet terminals is the state of the art equipment available for use. Not everyone has a Pentium PC in their home or office.
3.5 Future Products and Services
To enhance our initial product line, we will look at a newer model of Supplier One terminal that offers a greater variety of technologies.
As we increase our presence in the public Internet access business, we will continue to seek out applications that will allow us to offer a greater variety of services. A key component of this will be customer feedback.
Market Analysis Summary
Stroll Net is faced with the exciting opportunity of being the first-mover in the Tech City public Internet market. The attractiveness of convenience, combined with the growing interest in the Internet, has been proven to be a winning concept in other markets and will produce the same results in Tech City.
The explosion of the Internet has been well documented. The International Data Corporation predicts that by 2004 there will be 210 million Internet users in the U.S. alone. Our increasingly mobile society manes that a large percentage of these users will access the Internet through public Internet terminals.
Research has confirmed that the demand for public Internet terminals is growing exponentially and that the number of terminals in operation worldwide will reach 434,000 by 2006. By 2007 the number of wireless Hotspots in the U.S. is expected to grow to 41,000 and generate in excess of $3 billion in revenue.
4.1 Market Segmentation
Stroll Net’s clients can be described as individual business owners and medium to large companies that provide a services to tourist and business travelers alike as well as students and everyday Internet users. Such clients include, but are not limited to; airports, hotels, truck stops and coffee shops.
Our customers can be divided into two groups. The first group is familiar with the Internet and desires a convenient and affordable way to access the Internet away from home and their offices. The second group is not familiar with the Internet, yet, and is just waiting for the right opportunity to enter the online community. Stroll Net’s target market includes people between the ages of 18 and 65. According to the 2000 U.S. Census, Tech County has roughly 490,693 residents between the ages of 18 and 65. Of these, many are already internet-savvy.
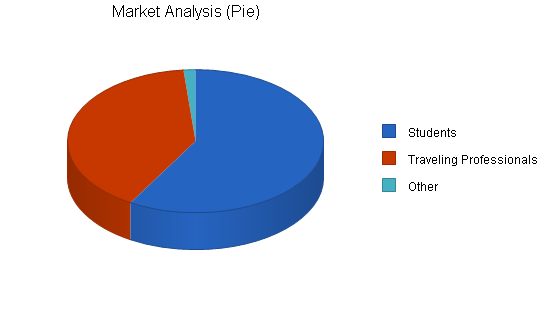
Within this group, we will target two groups in particular:
- Students
- Traveling Business People
| Market Analysis | |||||||
| Year 1 | Year 2 | Year 3 | Year 4 | Year 5 | |||
| Potential Customers | Growth | CAGR | |||||
| Students | 2% | 35,000 | 35,700 | 36,414 | 37,142 | 37,885 | 2.00% |
| Traveling Professionals | 3% | 24,000 | 24,720 | 25,462 | 26,226 | 27,013 | 3.00% |
| Other | 0% | 900 | 900 | 900 | 900 | 900 | 0.00% |
| Total | 2.38% | 59,900 | 61,320 | 62,776 | 64,268 | 65,798 | 2.38% |
4.2 Service Business Analysis
The explosion of the Internet has been well documented. Our increasingly mobile society means that a large percentage of these users will access the Internet through public Internet terminals. To be proactive and remain competitive it is imperative for business travelers to have reliable high-speed access to e-mail, the Internet and corporate networks. As such, it is becoming a standard for business travelers to stay only at hotels with high-speed Internet access and public Internet terminals.
Internet terminals with integrated Wi-Fi hotspots allow users to jump onto the Internet as easily as they would use an ATM. Our Internet terminals allow the public to experience rich multimedia content, that cannot be viewed on PDAs. Internet kiosks will very quickly become a standard feature of all hotels. The growth of Internet kiosks has very closely paralleled that of ATMs and payphones.
The fact that there are no public Internet terminals operating in Tech City, presents Stroll Net with a chance to seize this window of opportunity and enter into a profitable niche.
4.2.1 Competition and Buying Patterns
The main competitors in the public Internet terminal segment are ATT and BellSouth. However, these businesses have yet to establish a presence in Tech City and the immediate surrounding areas.
Competition from online service providers comes from locally-owned businesses as well as national firms. Due to the nature of the Internet, there are no geographical boundaries restricting competition. However, none of these online service providers have public Internet terminals available for placement.
4.3 Target Market Segment Strategy
Stroll Net’s public Internet terminals will be a magnet for local and traveling professionals who desire to work or check their email messages away from the office. These professionals will either use Stroll Net’s terminals, or connect their notebooks to our wireless WiFi Internet connection. Stroll Net’s target market covers a wide range of ages: from members of Generation X who grew up surrounded by computers, to Baby Boomers who have come to the realization that people today cannot afford to ignore computers.
Strategy and Implementation Summary
The important strategy focuses on pulling in power Internet users. Power Internet users are extremely familiar with the Internet and its offerings. This group of customers include students and business professionals.
The second strategy focuses on building a large loyal customer base. A large loyal customer base will serve to attract large, medium and small companies as clients for our interactive advertising service. All of the advertisements can connect the user to the advertiser’s web site. Due to the high traffic locations in which our public Internet terminals will be placed, this advertising space will be in high demand.
5.1 Milestones
The Stroll Net management team has established some basic milestones to keep the business plan priorities in place. Responsibility for implementation falls on the shoulders of Cam Piotr. This Milestones Table below will be updated as the year progresses using the actual tables. New milestones will be added as the first year of operations commences.

| Milestones | |||||
| Milestone | Start Date | End Date | Budget | Manager | Department |
| Business Plan | 10/1/2004 | 11/15/2004 | $1,000 | Cam Piotr | Admin |
| Licensing | 11/22/2004 | 11/27/2004 | $1,000 | Cam Piotr | Admin |
| Secure Start-up Funding | 11/29/2004 | 1/1/2005 | $1,000 | Cam Piotr | Admin |
| Site Selection | 1/15/2005 | 2/20/2005 | $1,000 | Cam Piotr | Admin |
| Architect Designs | 3/1/2005 | 3/30/2005 | $1,000 | Cam Piotr | Admin |
| Designer Proposal | 4/1/2005 | 4/15/2005 | $1,000 | Cam Piotr | Admin |
| Technology Design | 4/1/2005 | 4/15/2005 | $1,000 | Cam Piotr | Admin |
| Year 1 Plan | 6/1/2005 | 6/9/2005 | $1,000 | Cam Piotr | Admin |
| Personnel Plan | 7/1/2005 | 7/5/2005 | $1,000 | Cam Piotr | Admin |
| Accounting Plan | 7/1/2005 | 7/5/2005 | $1,000 | Cam Piotr | Admin |
| Totals | $10,000 | ||||
5.2 Value Proposition
WiFi hotspots offering public Internet access are everywhere you look today, from cafes to hotels, from airports to marinas. Connectivity is what travelers want, and more importantly, are coming to expect. Travelers are making decisions on where to eat, sleep and work based on the availability of wireless service.
Clients offering public internet access will be able to tap into new revenue streams and new customers, and create loyalty.
Stroll Net’s public Internet terminals make it easy to provide convenient and easy access to wireless high-speed Internet connectivity. With Stroll Net’s public Internet terminals customers will be able to connect to their corporate networks and the Internet via a high-speed wireless connection in common areas.
5.3 Competitive Edge
Stroll Net will differentiate itself by providing the community with an innovative product that offers a convenient and affordable way to access the Internet away from home and the office. Stroll Net will enjoy the traditional benefits of being first to the market. As a small company looking to establish itself, we will be attentive and flexible in meeting our customers’ demands.
5.4 Marketing Strategy
Stroll Net will position itself as an aggressive, innovative company that supplies the market with an affordable way to access the Internet away from home and the office. Stroll Net will use advertising as its main source of promotion. We will acquire the services of Empire Communications Group and CyberMark International, Inc. to launch a diverse advertising campaign placed on television, radio, the Internet and in the local newspaper.
Stroll Net’s brochures, letterhead and business correspondence will further reinforce these concepts. We also recognize that it costs six times more to attract a customer than to retain one. With this in mind, we will operate under the principle that our best marketing is an exceedingly satisfied customer.
5.4.1 Pricing Strategy
Stroll Net bases its prices for Internet and wireless WiFi usage on the “retail profit analysis” provided by our supplier, Supplier One, Inc. They have been in the kiosk industry for 5 years and has developed a solid pricing strategy.
Determining a fair-market, per-transaction fee for Internet and wireless WiFi usage is more difficult because there is no direct competition from another public internet terminal business in Tech City. Therefore, Stroll Net considered two sources to determine the hourly charge rate. First, we considered the cost to use other Internet servers, whether it is a local networking firm or a provider such as America Online. Internet access providers use different pricing schemes. Some charge a monthly fee, while others charge an hourly fee. In addition, some providers use a strategy with a combination of both pricing schemes. Thus, it can quickly become a high monthly cost for the individual. Second, Stroll Net looked at how public Internet terminals in other markets, such as Miami and New York, went about pricing Internet access. Evaluating these two factors resulted in the following:
Walk-up Internet Access – Customers utilizing the terminals for internet access will be charged a .25 per minute transaction fee.
Wireless Internet Access – Customers utilizing the wireless WiFi connection will incur a fee of $3.95 per hour with a one hour minimum.
5.4.2 Promotion Strategy
Stroll Net will implement a pull strategy in order to build consumer awareness and demand. Initially, Stroll Net has budgeted $5,000 for promotional efforts which will include advertising with coupons for fifteen minutes of free Internet time.
Stroll Net realizes that in the future, when competition enters the market, additional revenues must be allocated for promotion in order to maintain market share.
5.5 Sales Strategy
Stroll Net employs route operators to collect all sales transactions and to perform routine maintenance on its terminals. Each route operator is responsible for keeping the terminals on his route stocked, clean and operational. Computer literacy is a requirement for Stroll Net employees. If an employee does not possess basic computer skills when they are hired, they are trained by our full-time technician. Our full-time technician is also available for terminals in need of minor repairs. Stroll Net’s commitment to prompt, dependable service is one of the key factors that distinguishes Stroll Net from all other competitors.
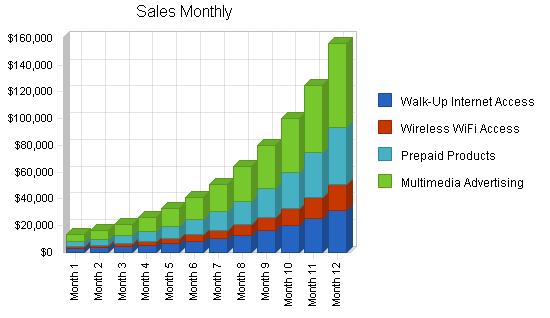
5.5.1 Sales Forecast
Our Sales Forecast is based upon real revenue reports from other customers of Supplier One, operating in similar urban settings in nearby states. Prepaid products and advertising will yield the greatest revenue per unit, but we expect the greatest number of transactions will be in walk-up internet access and Wifi access.

| Sales Forecast | |||
| Year 1 | Year 2 | Year 3 | |
| Unit Sales | |||
| Walk-Up Internet Access | 48,787 | 60,984 | 76,230 |
| Wireless WiFi Access | 23,092 | 28,865 | 36,081 |
| Prepaid Products | 19,677 | 24,596 | 30,745 |
| Multimedia Advertising | 5,854 | 7,318 | 9,147 |
| Total Unit Sales | 97,411 | 121,763 | 152,203 |
| Unit Prices | Year 1 | Year 2 | Year 3 |
| Walk-Up Internet Access | $3.00 | $3.00 | $3.00 |
| Wireless WiFi Access | $3.95 | $3.95 | $3.95 |
| Prepaid Products | $10.00 | $10.00 | $10.00 |
| Multimedia Advertising | $50.00 | $50.00 | $50.00 |
| Sales | |||
| Walk-Up Internet Access | $146,361 | $182,951 | $228,689 |
| Wireless WiFi Access | $91,215 | $114,017 | $142,521 |
| Prepaid Products | $196,774 | $245,963 | $307,453 |
| Multimedia Advertising | $292,721 | $365,875 | $457,344 |
| Total Sales | $727,071 | $908,806 | $1,136,007 |
| Direct Unit Costs | Year 1 | Year 2 | Year 3 |
| Walk-Up Internet Access | $0.60 | $0.60 | $0.60 |
| Wireless WiFi Access | $0.40 | $0.40 | $0.40 |
| Prepaid Products | $1.00 | $1.00 | $1.00 |
| Multimedia Advertising | $5.00 | $5.00 | $5.00 |
| Direct Cost of Sales | |||
| Walk-Up Internet Access | $29,272 | $36,590 | $45,738 |
| Wireless WiFi Access | $9,122 | $11,402 | $14,252 |
| Prepaid Products | $19,677 | $24,596 | $30,745 |
| Multimedia Advertising | $29,272 | $36,588 | $45,734 |
| Subtotal Direct Cost of Sales | $87,343 | $109,176 | $136,470 |
Management Summary
Stroll Net is owned and operated by Cam Piotr and Bob Green. The company, being small in nature, requires a simple organizational structure. Implementation of this organizational form calls for the owners to make all of the major management decisions in addition to monitoring all other business activities.
6.1 Personnel Plan
The staff will consist of 8 full-time route operators working forty hours a week at $10.00 per hour. In addition, one full-time technician (who is more technologically oriented to handle minor terminal repairs/inquiries) will be employed to work forty hours a week at $12.00 per hour. This simple structure provides a great deal of flexibility and allows communication to disperse quickly and directly. Because of these characteristics, there are few coordination problems seen at Stroll Net that are common within larger organizational chains. This strategy will enable Stroll Net to react quickly to changes in the market.
| Personnel Plan | |||
| Year 1 | Year 2 | Year 3 | |
| Lorenzo Mitchell | $42,889 | $49,680 | $59,616 |
| Herman Albany | $42,889 | $49,680 | $59,616 |
| Technician | $25,920 | $27,040 | $29,120 |
| Route Drivers | $172,800 | $183,040 | $199,680 |
| Future Staff | $0 | $0 | $49,920 |
| Total People | 11 | 11 | 13 |
| Total Payroll | $284,498 | $309,440 | $397,952 |
Financial Plan
Sales: Stroll Net is basing their projected Internet usage sales on the financial snapshot information provided to them by Supplier One, Inc. Internet usage was estimated by calculating the average number of minutes each customer will spend accessing the Internet and then generating a conservative estimate as to how many transactions will be made per day.
Cost of Goods Sold: The cost of goods sold was determined by the “retail profit analysis” we obtained from Supplier One, Inc. The cost of prepaid calling cards is 20% of the selling price. The cost of Internet access is $50 per month, paid to Supplier Two for networking fees. The cost of terminal placement is 20% of total internet access sales.
Salaries Expense: The founders of Stroll Net, Cam Piotr and Bob Green, will receive a salary of $24,000 in year one, $26,400 in year two, and $29,040 in year three.
Payroll Expense: Stroll Net intends to hire eight full-time employees at $10.00/hour and a full-time technician at $12.00/hour. The total cost of employing nine people at these rates for the first year is $14,720/month.
Rent Expense: Stroll Net is looking to purchase a 2200 square foot facility at $104.74/sq. foot.
Utilities Expense: Stroll Net is responsible for the payment of utilities including electric, water and garbage disposal. The basic monthly service charge for utilities expense will be $168.04. The phone bill will generated by five phone lines; one will be dedicated to a modem and four for business purposes. The basic monthly service charge for each line provided by Bellsouth is $59.95/month. Therefore, the total cost associated with the five phone lines is estimated at $299.75/month.
Marketing Expense: Stroll Net will allocate $50,000 for promotional expenses at the time of start-up. These dollars will be used for advertising on television, radio, the Internet and the local newspapers in order to build consumer awareness. For additional information, please refer to section 5.0 of the business plan.
Insurance Expense: Stroll Net has allocated $1,500 for insurance for the first year. As revenue increases in the second and third year of business, Stroll Net intends to invest more money for additional insurance coverage.
Legal and Consulting Fees: The cost of obtaining legal consultation in order to draw up the paper work necessary for client contracts is $1,500.
Depreciation: In depreciating our capital equipment, we used the Modified Accelerated Cost Recovery Method. We depreciated our terminals over a three-year time period.
Taxes: Stroll Net is an LLC and, as an entity, it is not taxed. However, there is a 10% payroll burden.
7.1 Important Assumptions
Basic assumptions are presented in the table below.
| General Assumptions | |||
| Year 1 | Year 2 | Year 3 | |
| Plan Month | 1 | 2 | 3 |
| Current Interest Rate | 10.00% | 10.00% | 10.00% |
| Long-term Interest Rate | 11.50% | 10.00% | 10.00% |
| Tax Rate | 25.00% | 25.00% | 25.42% |
| Other | 0 | 0 | 0 |
7.2 Break-even Analysis
Break-even data is presented in the chart and table below. With estimated monthly operating expenses at approximately $37,400, including everything from payroll to rent and insurance to maintenance of the kiosks, and average direct costs at roughly 90¢ for every $7.46 of sales, we reach break-even at approximately 5,700 sales per month. We project reaching the break-even point in the seventh month.

| Break-even Analysis | |
| Monthly Units Break-even | 5,166 |
| Monthly Revenue Break-even | $38,557 |
| Assumptions: | |
| Average Per-Unit Revenue | $7.46 |
| Average Per-Unit Variable Cost | $0.90 |
| Estimated Monthly Fixed Cost | $33,925 |
7.3 Projected Profit and Loss
The following table contains our projections for profit and loss data. We anticipate a net profit of approximately $134,300 in the first year, as the Stroll Net idea catches on and sales increase. With a net profit margin of 18%, these projections are well within a reasonable range.


| Pro Forma Profit and Loss | |||
| Year 1 | Year 2 | Year 3 | |
| Sales | $727,071 | $908,806 | $1,136,007 |
| Direct Cost of Sales | $87,343 | $109,176 | $136,470 |
| Other | $0 | $0 | $0 |
| Total Cost of Sales | $87,343 | $109,176 | $136,470 |
| Gross Margin | $639,728 | $799,630 | $999,537 |
| Gross Margin % | 87.99% | 87.99% | 87.99% |
| Expenses | |||
| Payroll | $284,498 | $309,440 | $397,952 |
| Sales and Marketing and Other Expenses | $53,598 | $59,174 | $68,279 |
| Depreciation | $44,676 | $45,000 | $45,000 |
| Utilities | $5,613 | $6,174 | $6,792 |
| Insurance | $1,500 | $6,000 | $7,500 |
| Maintenence/Repairs | $3,500 | $4,200 | $5,800 |
| Travel | $13,717 | $24,652 | $29,961 |
| Payroll Taxes | $0 | $0 | $0 |
| Total Operating Expenses | $407,102 | $454,640 | $561,284 |
| Profit Before Interest and Taxes | $232,626 | $344,990 | $438,253 |
| EBITDA | $277,302 | $389,990 | $483,253 |
| Interest Expense | $10,877 | $8,500 | $7,500 |
| Taxes Incurred | $55,437 | $84,122 | $109,483 |
| Net Profit | $166,311 | $252,367 | $321,270 |
| Net Profit/Sales | 22.87% | 27.77% | 28.28% |
7.4 Projected Cash Flow
Cash flow data for the first three years is presented in the chart and table below. The table shows anticipated repayment of the long-term loan, as well as projected dividends which will be paid to investors in years two and three. In year three, we will purchase two more paykiosks terminals for new locations. The more detailed monthly cash flow data can be found in the appendix.

| Pro Forma Cash Flow | |||
| Year 1 | Year 2 | Year 3 | |
| Cash Received | |||
| Cash from Operations | |||
| Cash Sales | $727,071 | $908,806 | $1,136,007 |
| Subtotal Cash from Operations | $727,071 | $908,806 | $1,136,007 |
| Additional Cash Received | |||
| Sales Tax, VAT, HST/GST Received | $0 | $0 | $0 |
| New Current Borrowing | $0 | $0 | $0 |
| New Other Liabilities (interest-free) | $0 | $0 | $0 |
| New Long-term Liabilities | $0 | $0 | $0 |
| Sales of Other Current Assets | $0 | $0 | $0 |
| Sales of Long-term Assets | $0 | $0 | $0 |
| New Investment Received | $0 | $0 | $0 |
| Subtotal Cash Received | $727,071 | $908,806 | $1,136,007 |
| Expenditures | Year 1 | Year 2 | Year 3 |
| Expenditures from Operations | |||
| Cash Spending | $284,498 | $309,440 | $397,952 |
| Bill Payments | $184,060 | $327,202 | $366,049 |
| Subtotal Spent on Operations | $468,558 | $636,642 | $764,001 |
| Additional Cash Spent | |||
| Sales Tax, VAT, HST/GST Paid Out | $0 | $0 | $0 |
| Principal Repayment of Current Borrowing | $0 | $0 | $0 |
| Other Liabilities Principal Repayment | $0 | $0 | $0 |
| Long-term Liabilities Principal Repayment | $10,000 | $10,000 | $10,000 |
| Purchase Other Current Assets | $0 | $0 | $0 |
| Purchase Long-term Assets | $0 | $0 | $40,000 |
| Dividends | $0 | $100,000 | $200,000 |
| Subtotal Cash Spent | $478,558 | $746,642 | $1,014,001 |
| Net Cash Flow | $248,513 | $162,163 | $122,006 |
| Cash Balance | $308,513 | $470,676 | $592,682 |
7.5 Projected Balance Sheet
Our projected balance sheet is presented in the table below. As sales increase, and we repay our long-term loan, the net worth of the company will increase from $281,710 at start-up to over $610,000 by year three.
| Pro Forma Balance Sheet | |||
| Year 1 | Year 2 | Year 3 | |
| Assets | |||
| Current Assets | |||
| Cash | $308,513 | $470,676 | $592,682 |
| Other Current Assets | $11,400 | $11,400 | $11,400 |
| Total Current Assets | $319,913 | $482,076 | $604,082 |
| Long-term Assets | |||
| Long-term Assets | $312,810 | $312,810 | $352,810 |
| Accumulated Depreciation | $44,676 | $89,676 | $134,676 |
| Total Long-term Assets | $268,134 | $223,134 | $218,134 |
| Total Assets | $588,047 | $705,210 | $822,216 |
| Liabilities and Capital | Year 1 | Year 2 | Year 3 |
| Current Liabilities | |||
| Accounts Payable | $50,026 | $24,822 | $30,558 |
| Current Borrowing | $0 | $0 | $0 |
| Other Current Liabilities | $0 | $0 | $0 |
| Subtotal Current Liabilities | $50,026 | $24,822 | $30,558 |
| Long-term Liabilities | $90,000 | $80,000 | $70,000 |
| Total Liabilities | $140,026 | $104,822 | $100,558 |
| Paid-in Capital | $310,171 | $310,171 | $310,171 |
| Retained Earnings | ($28,461) | $37,850 | $90,217 |
| Earnings | $166,311 | $252,367 | $321,270 |
| Total Capital | $448,021 | $600,388 | $721,658 |
| Total Liabilities and Capital | $588,047 | $705,210 | $822,216 |
| Net Worth | $448,021 | $600,388 | $721,658 |
7.6 Business Ratios
The following table outlines some of the more important ratios from the Data communications services industry. The final column, Industry Profile, details specific ratios based on the industry as it is classified by the Standard Industry Classification (SIC) code, 4899.9901.
| Ratio Analysis | ||||
| Year 1 | Year 2 | Year 3 | Industry Profile | |
| Sales Growth | 0.00% | 25.00% | 25.00% | 1.63% |
| Percent of Total Assets | ||||
| Other Current Assets | 1.94% | 1.62% | 1.39% | 53.65% |
| Total Current Assets | 54.40% | 68.36% | 73.47% | 74.50% |
| Long-term Assets | 45.60% | 31.64% | 26.53% | 25.50% |
| Total Assets | 100.00% | 100.00% | 100.00% | 100.00% |
| Current Liabilities | 8.51% | 3.52% | 3.72% | 24.78% |
| Long-term Liabilities | 15.30% | 11.34% | 8.51% | 18.28% |
| Total Liabilities | 23.81% | 14.86% | 12.23% | 43.06% |
| Net Worth | 76.19% | 85.14% | 87.77% | 56.94% |
| Percent of Sales | ||||
| Sales | 100.00% | 100.00% | 100.00% | 100.00% |
| Gross Margin | 87.99% | 87.99% | 87.99% | 52.82% |
| Selling, General & Administrative Expenses | 73.78% | 60.22% | 59.71% | 30.92% |
| Advertising Expenses | 6.14% | 4.95% | 3.96% | 0.82% |
| Profit Before Interest and Taxes | 31.99% | 37.96% | 38.58% | 6.18% |
| Main Ratios | ||||
| Current | 6.39 | 19.42 | 19.77 | 1.84 |
| Quick | 6.39 | 19.42 | 19.77 | 1.60 |
| Total Debt to Total Assets | 23.81% | 14.86% | 12.23% | 54.39% |
| Pre-tax Return on Net Worth | 49.50% | 56.05% | 59.69% | 8.03% |
| Pre-tax Return on Assets | 37.71% | 47.71% | 52.39% | 17.61% |
| Additional Ratios | Year 1 | Year 2 | Year 3 | |
| Net Profit Margin | 22.87% | 27.77% | 28.28% | n.a |
| Return on Equity | 37.12% | 42.03% | 44.52% | n.a |
| Activity Ratios | ||||
| Accounts Payable Turnover | 4.63 | 12.17 | 12.17 | n.a |
| Payment Days | 27 | 45 | 27 | n.a |
| Total Asset Turnover | 1.24 | 1.29 | 1.38 | n.a |
| Debt Ratios | ||||
| Debt to Net Worth | 0.31 | 0.17 | 0.14 | n.a |
| Current Liab. to Liab. | 0.36 | 0.24 | 0.30 | n.a |
| Liquidity Ratios | ||||
| Net Working Capital | $269,887 | $457,254 | $573,524 | n.a |
| Interest Coverage | 21.39 | 40.59 | 58.43 | n.a |
| Additional Ratios | ||||
| Assets to Sales | 0.81 | 0.78 | 0.72 | n.a |
| Current Debt/Total Assets | 9% | 4% | 4% | n.a |
| Acid Test | 6.39 | 19.42 | 19.77 | n.a |
| Sales/Net Worth | 1.62 | 1.51 | 1.57 | n.a |
| Dividend Payout | 0.00 | 0.40 | 0.62 | n.a |
Appendix
| Sales Forecast | |||||||||||||
| Month 1 | Month 2 | Month 3 | Month 4 | Month 5 | Month 6 | Month 7 | Month 8 | Month 9 | Month 10 | Month 11 | Month 12 | ||
| Unit Sales | |||||||||||||
| Walk-Up Internet Access | 45% | 900 | 1,125 | 1,406 | 1,758 | 2,197 | 2,747 | 3,433 | 4,292 | 5,364 | 6,706 | 8,382 | 10,477 |
| Wireless WiFi Access | 25% | 426 | 533 | 666 | 832 | 1,040 | 1,300 | 1,625 | 2,031 | 2,539 | 3,174 | 3,967 | 4,959 |
| Prepaid Products | 18% | 363 | 454 | 567 | 709 | 886 | 1,108 | 1,385 | 1,731 | 2,164 | 2,705 | 3,381 | 4,226 |
| Multimedia Advertising | 12% | 108 | 135 | 169 | 211 | 264 | 330 | 412 | 515 | 644 | 805 | 1,006 | 1,257 |
| Total Unit Sales | 1,797 | 2,246 | 2,808 | 3,510 | 4,387 | 5,484 | 6,855 | 8,569 | 10,711 | 13,389 | 16,736 | 20,920 | |
| Unit Prices | Month 1 | Month 2 | Month 3 | Month 4 | Month 5 | Month 6 | Month 7 | Month 8 | Month 9 | Month 10 | Month 11 | Month 12 | |
| Walk-Up Internet Access | $3.00 | $3.00 | $3.00 | $3.00 | $3.00 | $3.00 | $3.00 | $3.00 | $3.00 | $3.00 | $3.00 | $3.00 | |
| Wireless WiFi Access | $3.95 | $3.95 | $3.95 | $3.95 | $3.95 | $3.95 | $3.95 | $3.95 | $3.95 | $3.95 | $3.95 | $3.95 | |
| Prepaid Products | $10.00 | $10.00 | $10.00 | $10.00 | $10.00 | $10.00 | $10.00 | $10.00 | $10.00 | $10.00 | $10.00 | $10.00 | |
| Multimedia Advertising | $50.00 | $50.00 | $50.00 | $50.00 | $50.00 | $50.00 | $50.00 | $50.00 | $50.00 | $50.00 | $50.00 | $50.00 | |
| Sales | |||||||||||||
| Walk-Up Internet Access | $2,700 | $3,375 | $4,219 | $5,273 | $6,592 | $8,240 | $10,300 | $12,875 | $16,093 | $20,117 | $25,146 | $31,432 | |
| Wireless WiFi Access | $1,683 | $2,103 | $2,629 | $3,287 | $4,108 | $5,135 | $6,419 | $8,024 | $10,030 | $12,537 | $15,671 | $19,589 | |
| Prepaid Products | $3,630 | $4,538 | $5,672 | $7,090 | $8,862 | $11,078 | $13,847 | $17,309 | $21,636 | $27,046 | $33,807 | $42,259 | |
| Multimedia Advertising | $5,400 | $6,750 | $8,438 | $10,547 | $13,184 | $16,479 | $20,599 | $25,749 | $32,187 | $40,233 | $50,291 | $62,864 | |
| Total Sales | $13,413 | $16,766 | $20,957 | $26,197 | $32,746 | $40,932 | $51,165 | $63,957 | $79,946 | $99,932 | $124,916 | $156,144 | |
| Direct Unit Costs | Month 1 | Month 2 | Month 3 | Month 4 | Month 5 | Month 6 | Month 7 | Month 8 | Month 9 | Month 10 | Month 11 | Month 12 | |
| Walk-Up Internet Access | 20.00% | $0.60 | $0.60 | $0.60 | $0.60 | $0.60 | $0.60 | $0.60 | $0.60 | $0.60 | $0.60 | $0.60 | $0.60 |
| Wireless WiFi Access | 10.00% | $0.40 | $0.40 | $0.40 | $0.40 | $0.40 | $0.40 | $0.40 | $0.40 | $0.40 | $0.40 | $0.40 | $0.40 |
| Prepaid Products | 10.00% | $1.00 | $1.00 | $1.00 | $1.00 | $1.00 | $1.00 | $1.00 | $1.00 | $1.00 | $1.00 | $1.00 | $1.00 |
| Multimedia Advertising | 10.00% | $5.00 | $5.00 | $5.00 | $5.00 | $5.00 | $5.00 | $5.00 | $5.00 | $5.00 | $5.00 | $5.00 | $5.00 |
| Direct Cost of Sales | |||||||||||||
| Walk-Up Internet Access | $540 | $675 | $844 | $1,055 | $1,318 | $1,648 | $2,060 | $2,575 | $3,219 | $4,023 | $5,029 | $6,286 | |
| Wireless WiFi Access | $168 | $210 | $263 | $329 | $411 | $514 | $642 | $802 | $1,003 | $1,254 | $1,567 | $1,959 | |
| Prepaid Products | $363 | $454 | $567 | $709 | $886 | $1,108 | $1,385 | $1,731 | $2,164 | $2,705 | $3,381 | $4,226 | |
| Multimedia Advertising | $540 | $675 | $844 | $1,055 | $1,318 | $1,648 | $2,060 | $2,575 | $3,219 | $4,023 | $5,029 | $6,286 | |
| Subtotal Direct Cost of Sales | $1,611 | $2,014 | $2,518 | $3,147 | $3,934 | $4,917 | $6,147 | $7,683 | $9,604 | $12,005 | $15,006 | $18,758 | |
| Personnel Plan | |||||||||||||
| Month 1 | Month 2 | Month 3 | Month 4 | Month 5 | Month 6 | Month 7 | Month 8 | Month 9 | Month 10 | Month 11 | Month 12 | ||
| Lorenzo Mitchell | 0% | $3,289 | $3,600 | $3,600 | $3,600 | $3,600 | $3,600 | $3,600 | $3,600 | $3,600 | $3,600 | $3,600 | $3,600 |
| Herman Albany | 0% | $3,289 | $3,600 | $3,600 | $3,600 | $3,600 | $3,600 | $3,600 | $3,600 | $3,600 | $3,600 | $3,600 | $3,600 |
| Technician | 0% | $2,160 | $2,160 | $2,160 | $2,160 | $2,160 | $2,160 | $2,160 | $2,160 | $2,160 | $2,160 | $2,160 | $2,160 |
| Route Drivers | 0% | $14,400 | $14,400 | $14,400 | $14,400 | $14,400 | $14,400 | $14,400 | $14,400 | $14,400 | $14,400 | $14,400 | $14,400 |
| Future Staff | 0% | $0 | $0 | $0 | $0 | $0 | $0 | $0 | $0 | $0 | $0 | $0 | $0 |
| Total People | 11 | 11 | 11 | 11 | 11 | 11 | 11 | 11 | 11 | 11 | 11 | 11 | |
| Total Payroll | $23,138 | $23,760 | $23,760 | $23,760 | $23,760 | $23,760 | $23,760 | $23,760 | $23,760 | $23,760 | $23,760 | $23,760 | |
| General Assumptions | |||||||||||||
| Month 1 | Month 2 | Month 3 | Month 4 | Month 5 | Month 6 | Month 7 | Month 8 | Month 9 | Month 10 | Month 11 | Month 12 | ||
| Plan Month | 1 | 2 | 3 | 4 | 5 | 6 | 7 | 8 | 9 | 10 | 11 | 12 | |
| Current Interest Rate | 10.00% | 10.00% | 10.00% | 10.00% | 10.00% | 10.00% | 10.00% | 10.00% | 10.00% | 10.00% | 10.00% | 10.00% | |
| Long-term Interest Rate | 11.50% | 11.50% | 11.50% | 11.50% | 11.50% | 11.50% | 11.50% | 11.50% | 11.50% | 11.50% | 11.50% | 11.50% | |
| Tax Rate | 25.00% | 25.00% | 25.00% | 25.00% | 25.00% | 25.00% | 25.00% | 25.00% | 25.00% | 25.00% | 25.00% | 25.00% | |
| Other | 0 | 0 | 0 | 0 | 0 | 0 | 0 | 0 | 0 | 0 | 0 | 0 | |
| Pro Forma Profit and Loss | |||||||||||||
| Month 1 | Month 2 | Month 3 | Month 4 | Month 5 | Month 6 | Month 7 | Month 8 | Month 9 | Month 10 | Month 11 | Month 12 | ||
| Sales | $13,413 | $16,766 | $20,957 | $26,197 | $32,746 | $40,932 | $51,165 | $63,957 | $79,946 | $99,932 | $124,916 | $156,144 | |
| Direct Cost of Sales | $1,611 | $2,014 | $2,518 | $3,147 | $3,934 | $4,917 | $6,147 | $7,683 | $9,604 | $12,005 | $15,006 | $18,758 | |
| Other | $0 | $0 | $0 | $0 | $0 | $0 | $0 | $0 | $0 | $0 | $0 | $0 | |
| Total Cost of Sales | $1,611 | $2,014 | $2,518 | $3,147 | $3,934 | $4,917 | $6,147 | $7,683 | $9,604 | $12,005 | $15,006 | $18,758 | |
| Gross Margin | $11,801 | $14,752 | $18,440 | $23,050 | $28,812 | $36,015 | $45,019 | $56,274 | $70,342 | $87,928 | $109,909 | $137,387 | |
| Gross Margin % | 87.99% | 87.99% | 87.99% | 87.99% | 87.99% | 87.99% | 87.99% | 87.99% | 87.99% | 87.99% | 87.99% | 87.99% | |
| Expenses | |||||||||||||
| Payroll | $23,138 | $23,760 | $23,760 | $23,760 | $23,760 | $23,760 | $23,760 | $23,760 | $23,760 | $23,760 | $23,760 | $23,760 | |
| Sales and Marketing and Other Expenses | $4,467 | $4,467 | $4,467 | $4,467 | $4,467 | $4,467 | $4,467 | $4,467 | $4,467 | $4,467 | $4,467 | $4,467 | |
| Depreciation | $3,723 | $3,723 | $3,723 | $3,723 | $3,723 | $3,723 | $3,723 | $3,723 | $3,723 | $3,723 | $3,723 | $3,723 | |
| Utilities | $468 | $468 | $468 | $468 | $468 | $468 | $468 | $468 | $468 | $468 | $468 | $468 | |
| Insurance | $125 | $125 | $125 | $125 | $125 | $125 | $125 | $125 | $125 | $125 | $125 | $125 | |
| Maintenence/Repairs | $292 | $292 | $292 | $292 | $292 | $292 | $292 | $292 | $292 | $292 | $292 | $292 | |
| Travel | 15% | $1,143 | $1,143 | $1,143 | $1,143 | $1,143 | $1,143 | $1,143 | $1,143 | $1,143 | $1,143 | $1,143 | $1,143 |
| Payroll Taxes | 15% | $0 | $0 | $0 | $0 | $0 | $0 | $0 | $0 | $0 | $0 | $0 | $0 |
| Total Operating Expenses | $33,355 | $33,977 | $33,977 | $33,977 | $33,977 | $33,977 | $33,977 | $33,977 | $33,977 | $33,977 | $33,977 | $33,977 | |
| Profit Before Interest and Taxes | ($21,554) | ($19,225) | ($15,537) | ($10,927) | ($5,165) | $2,038 | $11,042 | $22,297 | $36,365 | $53,951 | $75,932 | $103,410 | |
| EBITDA | ($17,831) | ($15,502) | ($11,814) | ($7,204) | ($1,442) | $5,761 | $14,765 | $26,020 | $40,088 | $57,674 | $79,655 | $107,133 | |
| Interest Expense | $950 | $942 | $934 | $926 | $918 | $910 | $902 | $894 | $886 | $879 | $871 | $863 | |
| Taxes Incurred | ($5,626) | ($5,042) | ($4,118) | ($2,963) | ($1,521) | $282 | $2,535 | $5,351 | $8,870 | $13,268 | $18,765 | $25,637 | |
| Net Profit | ($16,878) | ($15,126) | ($12,354) | ($8,890) | ($4,563) | $846 | $7,605 | $16,052 | $26,609 | $39,804 | $56,296 | $76,910 | |
| Net Profit/Sales | -125.84% | -90.22% | -58.95% | -33.94% | -13.93% | 2.07% | 14.86% | 25.10% | 33.28% | 39.83% | 45.07% | 49.26% | |
| Pro Forma Cash Flow | |||||||||||||
| Month 1 | Month 2 | Month 3 | Month 4 | Month 5 | Month 6 | Month 7 | Month 8 | Month 9 | Month 10 | Month 11 | Month 12 | ||
| Cash Received | |||||||||||||
| Cash from Operations | |||||||||||||
| Cash Sales | $13,413 | $16,766 | $20,957 | $26,197 | $32,746 | $40,932 | $51,165 | $63,957 | $79,946 | $99,932 | $124,916 | $156,144 | |
| Subtotal Cash from Operations | $13,413 | $16,766 | $20,957 | $26,197 | $32,746 | $40,932 | $51,165 | $63,957 | $79,946 | $99,932 | $124,916 | $156,144 | |
| Additional Cash Received | |||||||||||||
| Sales Tax, VAT, HST/GST Received | 0.00% | $0 | $0 | $0 | $0 | $0 | $0 | $0 | $0 | $0 | $0 | $0 | $0 |
| New Current Borrowing | $0 | $0 | $0 | $0 | $0 | $0 | $0 | $0 | $0 | $0 | $0 | $0 | |
| New Other Liabilities (interest-free) | $0 | $0 | $0 | $0 | $0 | $0 | $0 | $0 | $0 | $0 | $0 | $0 | |
| New Long-term Liabilities | $0 | $0 | $0 | $0 | $0 | $0 | $0 | $0 | $0 | $0 | $0 | $0 | |
| Sales of Other Current Assets | $0 | $0 | $0 | $0 | $0 | $0 | $0 | $0 | $0 | $0 | $0 | $0 | |
| Sales of Long-term Assets | $0 | $0 | $0 | $0 | $0 | $0 | $0 | $0 | $0 | $0 | $0 | $0 | |
| New Investment Received | $0 | $0 | $0 | $0 | $0 | $0 | $0 | $0 | $0 | $0 | $0 | $0 | |
| Subtotal Cash Received | $13,413 | $16,766 | $20,957 | $26,197 | $32,746 | $40,932 | $51,165 | $63,957 | $79,946 | $99,932 | $124,916 | $156,144 | |
| Expenditures | Month 1 | Month 2 | Month 3 | Month 4 | Month 5 | Month 6 | Month 7 | Month 8 | Month 9 | Month 10 | Month 11 | Month 12 | |
| Expenditures from Operations | |||||||||||||
| Cash Spending | $23,138 | $23,760 | $23,760 | $23,760 | $23,760 | $23,760 | $23,760 | $23,760 | $23,760 | $23,760 | $23,760 | $23,760 | |
| Bill Payments | $2,614 | $3,462 | $4,456 | $5,887 | $7,678 | $9,918 | $12,719 | $16,223 | $20,603 | $26,080 | $32,928 | $41,490 | |
| Subtotal Spent on Operations | $25,752 | $27,222 | $28,216 | $29,647 | $31,438 | $33,678 | $36,479 | $39,983 | $44,363 | $49,840 | $56,688 | $65,250 | |
| Additional Cash Spent | |||||||||||||
| Sales Tax, VAT, HST/GST Paid Out | $0 | $0 | $0 | $0 | $0 | $0 | $0 | $0 | $0 | $0 | $0 | $0 | |
| Principal Repayment of Current Borrowing | $0 | $0 | $0 | $0 | $0 | $0 | $0 | $0 | $0 | $0 | $0 | $0 | |
| Other Liabilities Principal Repayment | $0 | $0 | $0 | $0 | $0 | $0 | $0 | $0 | $0 | $0 | $0 | $0 | |
| Long-term Liabilities Principal Repayment | $833 | $833 | $833 | $833 | $833 | $833 | $833 | $833 | $833 | $833 | $833 | $837 | |
| Purchase Other Current Assets | $0 | $0 | $0 | $0 | $0 | $0 | $0 | $0 | $0 | $0 | $0 | $0 | |
| Purchase Long-term Assets | $0 | $0 | $0 | $0 | $0 | $0 | $0 | $0 | $0 | $0 | $0 | $0 | |
| Dividends | $0 | $0 | $0 | $0 | $0 | $0 | $0 | $0 | $0 | $0 | $0 | $0 | |
| Subtotal Cash Spent | $26,585 | $28,055 | $29,049 | $30,480 | $32,271 | $34,511 | $37,312 | $40,816 | $45,196 | $50,673 | $57,521 | $66,087 | |
| Net Cash Flow | ($13,173) | ($11,290) | ($8,092) | ($4,284) | $475 | $6,421 | $13,853 | $23,141 | $34,750 | $49,259 | $67,394 | $90,057 | |
| Cash Balance | $46,827 | $35,538 | $27,446 | $23,163 | $23,637 | $30,059 | $43,912 | $67,053 | $101,803 | $151,062 | $218,456 | $308,513 | |
| Pro Forma Balance Sheet | |||||||||||||
| Month 1 | Month 2 | Month 3 | Month 4 | Month 5 | Month 6 | Month 7 | Month 8 | Month 9 | Month 10 | Month 11 | Month 12 | ||
| Assets | Starting Balances | ||||||||||||
| Current Assets | |||||||||||||
| Cash | $60,000 | $46,827 | $35,538 | $27,446 | $23,163 | $23,637 | $30,059 | $43,912 | $67,053 | $101,803 | $151,062 | $218,456 | $308,513 |
| Other Current Assets | $11,400 | $11,400 | $11,400 | $11,400 | $11,400 | $11,400 | $11,400 | $11,400 | $11,400 | $11,400 | $11,400 | $11,400 | $11,400 |
| Total Current Assets | $71,400 | $58,227 | $46,938 | $38,846 | $34,563 | $35,037 | $41,459 | $55,312 | $78,453 | $113,203 | $162,462 | $229,856 | $319,913 |
| Long-term Assets | |||||||||||||
| Long-term Assets | $312,810 | $312,810 | $312,810 | $312,810 | $312,810 | $312,810 | $312,810 | $312,810 | $312,810 | $312,810 | $312,810 | $312,810 | $312,810 |
| Accumulated Depreciation | $0 | $3,723 | $7,446 | $11,169 | $14,892 | $18,615 | $22,338 | $26,061 | $29,784 | $33,507 | $37,230 | $40,953 | $44,676 |
| Total Long-term Assets | $312,810 | $309,087 | $305,364 | $301,641 | $297,918 | $294,195 | $290,472 | $286,749 | $283,026 | $279,303 | $275,580 | $271,857 | $268,134 |
| Total Assets | $384,210 | $367,314 | $352,302 | $340,487 | $332,481 | $329,232 | $331,931 | $342,061 | $361,479 | $392,506 | $438,042 | $501,713 | $588,047 |
| Liabilities and Capital | Month 1 | Month 2 | Month 3 | Month 4 | Month 5 | Month 6 | Month 7 | Month 8 | Month 9 | Month 10 | Month 11 | Month 12 | |
| Current Liabilities | |||||||||||||
| Accounts Payable | $2,500 | $3,316 | $4,262 | $5,634 | $7,351 | $9,498 | $12,183 | $15,542 | $19,741 | $24,992 | $31,557 | $39,765 | $50,026 |
| Current Borrowing | $0 | $0 | $0 | $0 | $0 | $0 | $0 | $0 | $0 | $0 | $0 | $0 | $0 |
| Other Current Liabilities | $0 | $0 | $0 | $0 | $0 | $0 | $0 | $0 | $0 | $0 | $0 | $0 | $0 |
| Subtotal Current Liabilities | $2,500 | $3,316 | $4,262 | $5,634 | $7,351 | $9,498 | $12,183 | $15,542 | $19,741 | $24,992 | $31,557 | $39,765 | $50,026 |
| Long-term Liabilities | $100,000 | $99,167 | $98,334 | $97,501 | $96,668 | $95,835 | $95,002 | $94,169 | $93,336 | $92,503 | $91,670 | $90,837 | $90,000 |
| Total Liabilities | $102,500 | $102,483 | $102,596 | $103,135 | $104,019 | $105,333 | $107,185 | $109,711 | $113,077 | $117,495 | $123,227 | $130,602 | $140,026 |
| Paid-in Capital | $310,171 | $310,171 | $310,171 | $310,171 | $310,171 | $310,171 | $310,171 | $310,171 | $310,171 | $310,171 | $310,171 | $310,171 | $310,171 |
| Retained Earnings | ($28,461) | ($28,461) | ($28,461) | ($28,461) | ($28,461) | ($28,461) | ($28,461) | ($28,461) | ($28,461) | ($28,461) | ($28,461) | ($28,461) | ($28,461) |
| Earnings | $0 | ($16,878) | ($32,004) | ($44,358) | ($53,248) | ($57,810) | ($56,965) | ($49,360) | ($33,308) | ($6,700) | $33,104 | $89,401 | $166,311 |
| Total Capital | $281,710 | $264,832 | $249,706 | $237,352 | $228,462 | $223,900 | $224,745 | $232,350 | $248,402 | $275,010 | $314,814 | $371,111 | $448,021 |
| Total Liabilities and Capital | $384,210 | $367,314 | $352,302 | $340,487 | $332,481 | $329,232 | $331,931 | $342,061 | $361,479 | $392,506 | $438,042 | $501,713 | $588,047 |
| Net Worth | $281,710 | $264,832 | $249,706 | $237,352 | $228,462 | $223,900 | $224,745 | $232,350 | $248,402 | $275,010 | $314,814 | $371,111 | $448,021 |

