
Glen Mar Forest Products
Executive Summary
The marketplace for nursery products and services is changing, both in nature and scope. The consumer is more upscale, and the market is expanding.
During the last seven years, the number of U.S. households increased 10 percent to 140.9 million. The National Association of Home Builders anticipates 903,000 new home starts this year, while there will be more than 4.5 million sales of existing homes, according to the National Association of Realtors.
These facts alone paint a future of opportunity for forest by-products. But they do not stand alone. A significant population change has occurred. Baby boomers now dominate the housing market, the 45- to 56-year-old bracket will increase by 54 percent in the next four years, according to the U.S. Department of Commerce. Recently, 45 to 60 year old customers emerged as the nursery industry’s primary buyers, accounting for 50 percent of retail nursery sales.
Last year, a quarter of U.S. households spent an average of $500 each for landscaping (installing plant material in original or renovated landscapes). This helped retailers ring up over $5 billion in sales.
Glen Mar Forest Products will offer this growing customer base a new product line that will change the face of landscaping. The product is called Rainbow Mulch™. This color enhanced shredded hardwood mulch is colorfast and environmentally safe. It does not blow or wash away and is safe for all plants and animals. The product is 100% organic and produced from virgin wood products.
The customer can choose from five rainbow colors:
- Rainbow Gold
- Rainbow Brown
- Rainbow Green
- Rainbow Grey
- Rainbow White
Rainbow Mulch™ gives the customer a new landscaping tool that can change a ho-hum lawn into beautiful landscape.

1.1 Objectives
- Establish Glen Mar Forest Products as the regional leader in producing color enhanced mulch.
- Increase the number of retail outlets carrying Glen Mar Forest Products by 20% over the next two years.
- Build a solid working relationship with all the region’s landscape product wholesale distributors.
1.2 Mission
Glen Mar’s mission is to introduce innovative landscaping products to its target customer base. Charles Marshall, owner of Glen Mar, will utilize his landscaping background, his experience in the wood products industry, and his contacts with the region’s wholesale distributors to create products that will change the face of landscaping.
1.3 Keys to Success
The keys to success in Glen Mar’s business are:
- Offering innovative landscaping products. This is essential for maintaining the niche market sectors mentioned in the mission statement.
- Reliable and timely deliveries. Glen Mar must make good on its delivery promises.
- A reliable administration that is ready to serve customers, prepare accurate billing, follow-up on orders and other documentation, and maintain a close watch on expenses and collection of accounts receivable.
Company Summary
Glen Mar Forest Products will create landscaping products. Glen Mar Forest Products is located in Springfield, Oregon. The location offers access to wood for manufacturing our products as well as excellent shipping resources.
2.1 Company Ownership
Glen Mar’s is owned by Charles Marshall. Charles has ten years of landscaping experience and seven years of experience in wood by-products.
2.2 Start-up Summary
The start-up cost of Glen Mar Forest Products will consist primarily of equipment and inventory. Charles Marshall and silent partner will each invest equally. Charles will also secure a hefty long-term commerical loan in an amount matching the two partners’ investment.
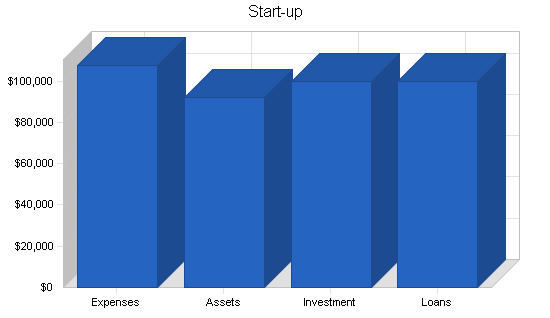
| Start-up Funding | |
| Start-up Expenses to Fund | $107,800 |
| Start-up Assets to Fund | $92,200 |
| Total Funding Required | $200,000 |
| Assets | |
| Non-cash Assets from Start-up | $70,000 |
| Cash Requirements from Start-up | $22,200 |
| Additional Cash Raised | $0 |
| Cash Balance on Starting Date | $22,200 |
| Total Assets | $92,200 |
| Liabilities and Capital | |
| Liabilities | |
| Current Borrowing | $0 |
| Long-term Liabilities | $100,000 |
| Accounts Payable (Outstanding Bills) | $0 |
| Other Current Liabilities (interest-free) | $0 |
| Total Liabilities | $100,000 |
| Capital | |
| Planned Investment | |
| Charles Marshall | $50,000 |
| Silent Partner | $50,000 |
| Additional Investment Requirement | $0 |
| Total Planned Investment | $100,000 |
| Loss at Start-up (Start-up Expenses) | ($107,800) |
| Total Capital | ($7,800) |
| Total Capital and Liabilities | $92,200 |
| Total Funding | $200,000 |
| Start-up | |
| Requirements | |
| Start-up Expenses | |
| Legal | $1,000 |
| Stationery etc. | $800 |
| Brochures | $2,000 |
| Insurance | $1,000 |
| Rent | $3,000 |
| Expensed Equipment | $80,000 |
| Truck | $20,000 |
| Total Start-up Expenses | $107,800 |
| Start-up Assets | |
| Cash Required | $22,200 |
| Start-up Inventory | $20,000 |
| Other Current Assets | $0 |
| Long-term Assets | $50,000 |
| Total Assets | $92,200 |
| Total Requirements | $200,000 |
Products
Our product is called Rainbow Mulch™. This color enhanced shredded hardwood mulch is colorfast and environmentally safe. It does not blow or wash away and is safe for all plants and animals. The product is 100% organic and produced from virgin wood products.
The customer can choose from 5 rainbow colors:
- Rainbow Gold
- Rainbow Brown
- Rainbow Green
- Rainbow Grey
- Rainbow White
Rainbow Mulch™ gives the customer a new landscaping tool that can change a ho-hum lawn into beautiful landscape.
Rainbow Mulch™ is available in either a 25 lb or a 50 lb bag.
Market Analysis Summary
Last year, a quarter of U.S. households spent an average of $500 each for landscaping (installing plant material in original or renovated landscapes). This helped retailers ring up over $5 billion in sales.
The expanding, upscale landscaping market means more demand for the speciality nursery products. Landscaping will be a project of high priority among new homeowners, who expect to spend an average of $3,500 on it. Five percent estimate they will spend $10,000 or more.
Fifty-one percent of these landscape customers are male. Fifty-six percent are 30 to 49 years old, and 46 percent are married with children. Forty-nine percent are college-educated. Fifty-one percent hold business or professional jobs, and 56 percent earn $30,000 or more. Half live in the suburbs.
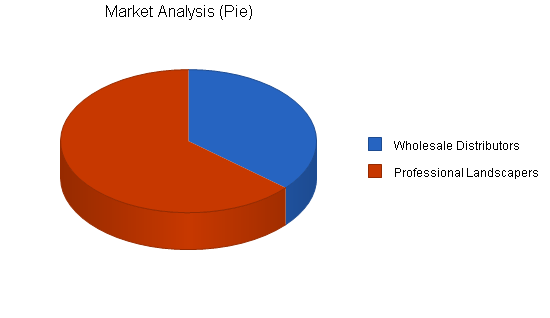
4.1 Market Segmentation
Glen Mar Forest Products will focus on two customer groups:
- Wholesale Distributors: This group is the critical supplier to retail outlets and pivotal to the success of Rainbow Mulch™.
- Landscaping Professionals: An important key to the landscaping market is the ability to add value to property through innovative products or techniques. We believe that Rainbow Mulch™ is an invaluable tool to landscaping professionals that will improve the range of options they have in projects.
| Market Analysis | |||||||
| Year 1 | Year 2 | Year 3 | Year 4 | Year 5 | |||
| Potential Customers | Growth | CAGR | |||||
| Wholesale Distributors | 4% | 20,000 | 20,800 | 21,632 | 22,497 | 23,397 | 4.00% |
| Professional Landscapers | 6% | 35,000 | 37,100 | 39,326 | 41,686 | 44,187 | 6.00% |
| Total | 5.29% | 55,000 | 57,900 | 60,958 | 64,183 | 67,584 | 5.29% |
Strategy and Implementation Summary
Glen Mar Forest Products will focus on becoming the leading provider of color enhanced mulch products.
5.1 Competitive Edge
Charles Marshall is the competitive edge of Glen Mar Forest Products. Charles has worked for both Acme Forest Products and Wilson Landscaping over the past fourteen years.
In his last position with Acme Forest Products, Charles sold wood by-products to numerous markets on the West Coast. He generated sales in excess of $4 million annually. His strength is his customer relation skills and he has been successful in expanding the range of products purchased by wholesale distributors in his sales region.
Before joining Acme Forest Products, Charles was a sales representative for Wilson Landscaping for six years. Wilson Landscaping is the largest landscaping firm in the greater Lane County area with sales in excess of $4 million annually.
During his years with both Acme Forest Products and Wilson Landscaping, Charles has made invaluable contacts with wholesale distributors, landscaping professionals, and commercial retail outlets. This gives Glen Mar Forest Products the competitive edge in introducing its new products to its target customers.
5.2 Sales Strategy
Glen Mar Forest Products will have two distinct sales approaches:
- For Wholesale Distributors: We will offer distributors a 20% discount on wholesale purchases for the first three months of operation.
- For Landscaping Professionals: We will offer landscaping professionals the wholesale price for Rainbow Mulch™ for the first six months of operation.
5.2.1 Sales Forecast
The following is the sales forecast for three years.


| Sales Forecast | |||
| Year 1 | Year 2 | Year 3 | |
| Sales | |||
| Wholesale Distributors | $209,500 | $260,000 | $310,000 |
| Landscaping Professionals | $124,000 | $160,000 | $200,000 |
| Total Sales | $333,500 | $420,000 | $510,000 |
| Direct Cost of Sales | Year 1 | Year 2 | Year 3 |
| Wholesale Distributors | $85,900 | $110,000 | $130,000 |
| Landscaping Professionals | $18,300 | $23,000 | $24,000 |
| Subtotal Direct Cost of Sales | $104,200 | $133,000 | $154,000 |
Management Summary
Charles Marshall will be responsible for sales and marketing. Glen Mar Forest Products will have a Production Manager who will be responsible for the daily manufacturing operation.
6.1 Personnel Plan
The personnel of Glen Mar Forest Product are as follows:
- Owner/sales and marketing manager;
- Production manager;
- Production staff (3).
| Personnel Plan | |||
| Year 1 | Year 2 | Year 3 | |
| Chales Marshall | $33,600 | $40,000 | $50,000 |
| Production Manager | $33,600 | $40,000 | $50,000 |
| Production Staff (3) | $57,600 | $60,000 | $66,000 |
| Total People | 5 | 5 | 5 |
| Total Payroll | $124,800 | $140,000 | $166,000 |
Financial Plan
The following is the financial plan for Glen Mar Forest Products.
7.1 Break-even Analysis
The monthly break-even point is calculated and displayed in the following table and chart.

| Break-even Analysis | |
| Monthly Revenue Break-even | $25,743 |
| Assumptions: | |
| Average Percent Variable Cost | 31% |
| Estimated Monthly Fixed Cost | $17,700 |
7.2 Projected Profit and Loss
The following table and chart will highlight projected profit and loss for the next three years.


| Pro Forma Profit and Loss | |||
| Year 1 | Year 2 | Year 3 | |
| Sales | $333,500 | $420,000 | $510,000 |
| Direct Cost of Sales | $104,200 | $133,000 | $154,000 |
| Other Production Expenses | $0 | $0 | $0 |
| Total Cost of Sales | $104,200 | $133,000 | $154,000 |
| Gross Margin | $229,300 | $287,000 | $356,000 |
| Gross Margin % | 68.76% | 68.33% | 69.80% |
| Expenses | |||
| Payroll | $124,800 | $140,000 | $166,000 |
| Sales and Marketing and Other Expenses | $18,000 | $36,000 | $46,000 |
| Depreciation | $2,880 | $2,880 | $2,880 |
| Leased Equipment | $0 | $0 | $0 |
| Utilities | $6,000 | $6,000 | $6,000 |
| Insurance | $6,000 | $6,000 | $6,000 |
| Rent | $36,000 | $36,000 | $36,000 |
| Payroll Taxes | $18,720 | $21,000 | $24,900 |
| Other | $0 | $0 | $0 |
| Total Operating Expenses | $212,400 | $247,880 | $287,780 |
| Profit Before Interest and Taxes | $16,900 | $39,120 | $68,220 |
| EBITDA | $19,780 | $42,000 | $71,100 |
| Interest Expense | $9,480 | $8,760 | $7,940 |
| Taxes Incurred | $2,226 | $9,108 | $18,084 |
| Net Profit | $5,194 | $21,252 | $42,196 |
| Net Profit/Sales | 1.56% | 5.06% | 8.27% |
7.3 Projected Cash Flow
The following table and chart highlight the projected cash flow for three years.

| Pro Forma Cash Flow | |||
| Year 1 | Year 2 | Year 3 | |
| Cash Received | |||
| Cash from Operations | |||
| Cash Sales | $100,050 | $126,000 | $153,000 |
| Cash from Receivables | $181,790 | $280,601 | $343,059 |
| Subtotal Cash from Operations | $281,840 | $406,601 | $496,059 |
| Additional Cash Received | |||
| Sales Tax, VAT, HST/GST Received | $0 | $0 | $0 |
| New Current Borrowing | $0 | $4,000 | $0 |
| New Other Liabilities (interest-free) | $0 | $0 | $0 |
| New Long-term Liabilities | $0 | $0 | $0 |
| Sales of Other Current Assets | $0 | $0 | $0 |
| Sales of Long-term Assets | $0 | $0 | $0 |
| New Investment Received | $10,000 | $0 | $0 |
| Subtotal Cash Received | $291,840 | $410,601 | $496,059 |
| Expenditures | Year 1 | Year 2 | Year 3 |
| Expenditures from Operations | |||
| Cash Spending | $124,800 | $140,000 | $166,000 |
| Bill Payments | $170,595 | $264,865 | $298,698 |
| Subtotal Spent on Operations | $295,395 | $404,865 | $464,698 |
| Additional Cash Spent | |||
| Sales Tax, VAT, HST/GST Paid Out | $0 | $0 | $0 |
| Principal Repayment of Current Borrowing | $0 | $0 | $1,200 |
| Other Liabilities Principal Repayment | $0 | $0 | $0 |
| Long-term Liabilities Principal Repayment | $9,600 | $9,600 | $9,600 |
| Purchase Other Current Assets | $0 | $0 | $0 |
| Purchase Long-term Assets | $0 | $0 | $0 |
| Dividends | $0 | $0 | $0 |
| Subtotal Cash Spent | $304,995 | $414,465 | $475,498 |
| Net Cash Flow | ($13,155) | ($3,864) | $20,561 |
| Cash Balance | $9,045 | $5,181 | $25,742 |
7.4 Projected Balance Sheet
The following table highlights the projected balance sheet for three years.
| Pro Forma Balance Sheet | |||
| Year 1 | Year 2 | Year 3 | |
| Assets | |||
| Current Assets | |||
| Cash | $9,045 | $5,181 | $25,742 |
| Accounts Receivable | $51,660 | $65,059 | $79,000 |
| Inventory | $15,950 | $20,358 | $23,573 |
| Other Current Assets | $0 | $0 | $0 |
| Total Current Assets | $76,655 | $90,599 | $128,315 |
| Long-term Assets | |||
| Long-term Assets | $50,000 | $50,000 | $50,000 |
| Accumulated Depreciation | $2,880 | $5,760 | $8,640 |
| Total Long-term Assets | $47,120 | $44,240 | $41,360 |
| Total Assets | $123,775 | $134,839 | $169,675 |
| Liabilities and Capital | Year 1 | Year 2 | Year 3 |
| Current Liabilities | |||
| Accounts Payable | $25,981 | $21,393 | $24,833 |
| Current Borrowing | $0 | $4,000 | $2,800 |
| Other Current Liabilities | $0 | $0 | $0 |
| Subtotal Current Liabilities | $25,981 | $25,393 | $27,633 |
| Long-term Liabilities | $90,400 | $80,800 | $71,200 |
| Total Liabilities | $116,381 | $106,193 | $98,833 |
| Paid-in Capital | $110,000 | $110,000 | $110,000 |
| Retained Earnings | ($107,800) | ($102,606) | ($81,354) |
| Earnings | $5,194 | $21,252 | $42,196 |
| Total Capital | $7,394 | $28,646 | $70,842 |
| Total Liabilities and Capital | $123,775 | $134,839 | $169,675 |
| Net Worth | $7,394 | $28,646 | $70,842 |
7.5 Business Ratios
Business ratios for the years of this plan are shown below. Industry profile ratios based on the Standard Industrial Classification (SIC) code 2493, Reconstituted Wood Products, are shown for comparison.
| Ratio Analysis | ||||
| Year 1 | Year 2 | Year 3 | Industry Profile | |
| Sales Growth | 0.00% | 25.94% | 21.43% | 8.10% |
| Percent of Total Assets | ||||
| Accounts Receivable | 41.74% | 48.25% | 46.56% | 22.10% |
| Inventory | 12.89% | 15.10% | 13.89% | 16.70% |
| Other Current Assets | 0.00% | 0.00% | 0.00% | 27.00% |
| Total Current Assets | 61.93% | 67.19% | 75.62% | 65.80% |
| Long-term Assets | 38.07% | 32.81% | 24.38% | 34.20% |
| Total Assets | 100.00% | 100.00% | 100.00% | 100.00% |
| Current Liabilities | 20.99% | 18.83% | 16.29% | 36.60% |
| Long-term Liabilities | 73.04% | 59.92% | 41.96% | 15.70% |
| Total Liabilities | 94.03% | 78.76% | 58.25% | 52.30% |
| Net Worth | 5.97% | 21.24% | 41.75% | 47.70% |
| Percent of Sales | ||||
| Sales | 100.00% | 100.00% | 100.00% | 100.00% |
| Gross Margin | 68.76% | 68.33% | 69.80% | 31.60% |
| Selling, General & Administrative Expenses | 67.15% | 63.13% | 61.33% | 18.10% |
| Advertising Expenses | 3.60% | 7.14% | 7.84% | 0.50% |
| Profit Before Interest and Taxes | 5.07% | 9.31% | 13.38% | 2.00% |
| Main Ratios | ||||
| Current | 2.95 | 3.57 | 4.64 | 1.61 |
| Quick | 2.34 | 2.77 | 3.79 | 0.98 |
| Total Debt to Total Assets | 94.03% | 78.76% | 58.25% | 52.30% |
| Pre-tax Return on Net Worth | 100.35% | 105.98% | 85.09% | 4.20% |
| Pre-tax Return on Assets | 5.99% | 22.52% | 35.53% | 8.90% |
| Additional Ratios | Year 1 | Year 2 | Year 3 | |
| Net Profit Margin | 1.56% | 5.06% | 8.27% | n.a |
| Return on Equity | 70.25% | 74.19% | 59.56% | n.a |
| Activity Ratios | ||||
| Accounts Receivable Turnover | 4.52 | 4.52 | 4.52 | n.a |
| Collection Days | 56 | 72 | 74 | n.a |
| Inventory Turnover | 9.68 | 7.33 | 7.01 | n.a |
| Accounts Payable Turnover | 7.57 | 12.17 | 12.17 | n.a |
| Payment Days | 27 | 33 | 28 | n.a |
| Total Asset Turnover | 2.69 | 3.11 | 3.01 | n.a |
| Debt Ratios | ||||
| Debt to Net Worth | 15.74 | 3.71 | 1.40 | n.a |
| Current Liab. to Liab. | 0.22 | 0.24 | 0.28 | n.a |
| Liquidity Ratios | ||||
| Net Working Capital | $50,674 | $65,206 | $100,682 | n.a |
| Interest Coverage | 1.78 | 4.47 | 8.59 | n.a |
| Additional Ratios | ||||
| Assets to Sales | 0.37 | 0.32 | 0.33 | n.a |
| Current Debt/Total Assets | 21% | 19% | 16% | n.a |
| Acid Test | 0.35 | 0.20 | 0.93 | n.a |
| Sales/Net Worth | 45.10 | 14.66 | 7.20 | n.a |
| Dividend Payout | 0.00 | 0.00 | 0.00 | n.a |
Appendix
| Sales Forecast | |||||||||||||
| Month 1 | Month 2 | Month 3 | Month 4 | Month 5 | Month 6 | Month 7 | Month 8 | Month 9 | Month 10 | Month 11 | Month 12 | ||
| Sales | |||||||||||||
| Wholesale Distributors | 0% | $14,000 | $14,000 | $14,000 | $16,000 | $16,000 | $17,500 | $18,000 | $18,000 | $20,000 | $20,000 | $20,000 | $22,000 |
| Landscaping Professionals | 0% | $5,000 | $5,000 | $6,000 | $6,000 | $8,000 | $10,000 | $12,000 | $12,000 | $13,000 | $14,000 | $16,000 | $17,000 |
| Total Sales | $19,000 | $19,000 | $20,000 | $22,000 | $24,000 | $27,500 | $30,000 | $30,000 | $33,000 | $34,000 | $36,000 | $39,000 | |
| Direct Cost of Sales | Month 1 | Month 2 | Month 3 | Month 4 | Month 5 | Month 6 | Month 7 | Month 8 | Month 9 | Month 10 | Month 11 | Month 12 | |
| Wholesale Distributors | $4,000 | $4,000 | $4,000 | $4,400 | $6,000 | $6,300 | $8,000 | $8,200 | $9,000 | $10,000 | $10,000 | $12,000 | |
| Landscaping Professionals | $1,000 | $1,000 | $1,000 | $1,080 | $1,200 | $1,280 | $1,700 | $1,740 | $1,800 | $2,000 | $2,000 | $2,500 | |
| Subtotal Direct Cost of Sales | $5,000 | $5,000 | $5,000 | $5,480 | $7,200 | $7,580 | $9,700 | $9,940 | $10,800 | $12,000 | $12,000 | $14,500 | |
| Personnel Plan | |||||||||||||
| Month 1 | Month 2 | Month 3 | Month 4 | Month 5 | Month 6 | Month 7 | Month 8 | Month 9 | Month 10 | Month 11 | Month 12 | ||
| Chales Marshall | 0% | $2,800 | $2,800 | $2,800 | $2,800 | $2,800 | $2,800 | $2,800 | $2,800 | $2,800 | $2,800 | $2,800 | $2,800 |
| Production Manager | 0% | $2,800 | $2,800 | $2,800 | $2,800 | $2,800 | $2,800 | $2,800 | $2,800 | $2,800 | $2,800 | $2,800 | $2,800 |
| Production Staff (3) | 0% | $4,800 | $4,800 | $4,800 | $4,800 | $4,800 | $4,800 | $4,800 | $4,800 | $4,800 | $4,800 | $4,800 | $4,800 |
| Total People | 5 | 5 | 5 | 5 | 5 | 5 | 5 | 5 | 5 | 5 | 5 | 5 | |
| Total Payroll | $10,400 | $10,400 | $10,400 | $10,400 | $10,400 | $10,400 | $10,400 | $10,400 | $10,400 | $10,400 | $10,400 | $10,400 | |
| General Assumptions | |||||||||||||
| Month 1 | Month 2 | Month 3 | Month 4 | Month 5 | Month 6 | Month 7 | Month 8 | Month 9 | Month 10 | Month 11 | Month 12 | ||
| Plan Month | 1 | 2 | 3 | 4 | 5 | 6 | 7 | 8 | 9 | 10 | 11 | 12 | |
| Current Interest Rate | 10.00% | 10.00% | 10.00% | 10.00% | 10.00% | 10.00% | 10.00% | 10.00% | 10.00% | 10.00% | 10.00% | 10.00% | |
| Long-term Interest Rate | 10.00% | 10.00% | 10.00% | 10.00% | 10.00% | 10.00% | 10.00% | 10.00% | 10.00% | 10.00% | 10.00% | 10.00% | |
| Tax Rate | 30.00% | 30.00% | 30.00% | 30.00% | 30.00% | 30.00% | 30.00% | 30.00% | 30.00% | 30.00% | 30.00% | 30.00% | |
| Other | 0 | 0 | 0 | 0 | 0 | 0 | 0 | 0 | 0 | 0 | 0 | 0 | |
| Pro Forma Profit and Loss | |||||||||||||
| Month 1 | Month 2 | Month 3 | Month 4 | Month 5 | Month 6 | Month 7 | Month 8 | Month 9 | Month 10 | Month 11 | Month 12 | ||
| Sales | $19,000 | $19,000 | $20,000 | $22,000 | $24,000 | $27,500 | $30,000 | $30,000 | $33,000 | $34,000 | $36,000 | $39,000 | |
| Direct Cost of Sales | $5,000 | $5,000 | $5,000 | $5,480 | $7,200 | $7,580 | $9,700 | $9,940 | $10,800 | $12,000 | $12,000 | $14,500 | |
| Other Production Expenses | $0 | $0 | $0 | $0 | $0 | $0 | $0 | $0 | $0 | $0 | $0 | $0 | |
| Total Cost of Sales | $5,000 | $5,000 | $5,000 | $5,480 | $7,200 | $7,580 | $9,700 | $9,940 | $10,800 | $12,000 | $12,000 | $14,500 | |
| Gross Margin | $14,000 | $14,000 | $15,000 | $16,520 | $16,800 | $19,920 | $20,300 | $20,060 | $22,200 | $22,000 | $24,000 | $24,500 | |
| Gross Margin % | 73.68% | 73.68% | 75.00% | 75.09% | 70.00% | 72.44% | 67.67% | 66.87% | 67.27% | 64.71% | 66.67% | 62.82% | |
| Expenses | |||||||||||||
| Payroll | $10,400 | $10,400 | $10,400 | $10,400 | $10,400 | $10,400 | $10,400 | $10,400 | $10,400 | $10,400 | $10,400 | $10,400 | |
| Sales and Marketing and Other Expenses | $1,500 | $1,500 | $1,500 | $1,500 | $1,500 | $1,500 | $1,500 | $1,500 | $1,500 | $1,500 | $1,500 | $1,500 | |
| Depreciation | $240 | $240 | $240 | $240 | $240 | $240 | $240 | $240 | $240 | $240 | $240 | $240 | |
| Leased Equipment | $0 | $0 | $0 | $0 | $0 | $0 | $0 | $0 | $0 | $0 | $0 | $0 | |
| Utilities | $500 | $500 | $500 | $500 | $500 | $500 | $500 | $500 | $500 | $500 | $500 | $500 | |
| Insurance | $500 | $500 | $500 | $500 | $500 | $500 | $500 | $500 | $500 | $500 | $500 | $500 | |
| Rent | $3,000 | $3,000 | $3,000 | $3,000 | $3,000 | $3,000 | $3,000 | $3,000 | $3,000 | $3,000 | $3,000 | $3,000 | |
| Payroll Taxes | 15% | $1,560 | $1,560 | $1,560 | $1,560 | $1,560 | $1,560 | $1,560 | $1,560 | $1,560 | $1,560 | $1,560 | $1,560 |
| Other | $0 | $0 | $0 | $0 | $0 | $0 | $0 | $0 | $0 | $0 | $0 | $0 | |
| Total Operating Expenses | $17,700 | $17,700 | $17,700 | $17,700 | $17,700 | $17,700 | $17,700 | $17,700 | $17,700 | $17,700 | $17,700 | $17,700 | |
| Profit Before Interest and Taxes | ($3,700) | ($3,700) | ($2,700) | ($1,180) | ($900) | $2,220 | $2,600 | $2,360 | $4,500 | $4,300 | $6,300 | $6,800 | |
| EBITDA | ($3,460) | ($3,460) | ($2,460) | ($940) | ($660) | $2,460 | $2,840 | $2,600 | $4,740 | $4,540 | $6,540 | $7,040 | |
| Interest Expense | $827 | $820 | $813 | $807 | $800 | $793 | $787 | $780 | $773 | $767 | $760 | $753 | |
| Taxes Incurred | ($1,358) | ($1,356) | ($1,054) | ($596) | ($510) | $428 | $544 | $474 | $1,118 | $1,060 | $1,662 | $1,814 | |
| Net Profit | ($3,169) | ($3,164) | ($2,459) | ($1,391) | ($1,190) | $999 | $1,269 | $1,106 | $2,609 | $2,473 | $3,878 | $4,233 | |
| Net Profit/Sales | -16.68% | -16.65% | -12.30% | -6.32% | -4.96% | 3.63% | 4.23% | 3.69% | 7.91% | 7.27% | 10.77% | 10.85% | |
| Pro Forma Cash Flow | |||||||||||||
| Month 1 | Month 2 | Month 3 | Month 4 | Month 5 | Month 6 | Month 7 | Month 8 | Month 9 | Month 10 | Month 11 | Month 12 | ||
| Cash Received | |||||||||||||
| Cash from Operations | |||||||||||||
| Cash Sales | $5,700 | $5,700 | $6,000 | $6,600 | $7,200 | $8,250 | $9,000 | $9,000 | $9,900 | $10,200 | $10,800 | $11,700 | |
| Cash from Receivables | $0 | $443 | $13,300 | $13,323 | $14,047 | $15,447 | $16,882 | $19,308 | $21,000 | $21,070 | $23,123 | $23,847 | |
| Subtotal Cash from Operations | $5,700 | $6,143 | $19,300 | $19,923 | $21,247 | $23,697 | $25,882 | $28,308 | $30,900 | $31,270 | $33,923 | $35,547 | |
| Additional Cash Received | |||||||||||||
| Sales Tax, VAT, HST/GST Received | 0.00% | $0 | $0 | $0 | $0 | $0 | $0 | $0 | $0 | $0 | $0 | $0 | $0 |
| New Current Borrowing | $0 | $0 | $0 | $0 | $0 | $0 | $0 | $0 | $0 | $0 | $0 | $0 | |
| New Other Liabilities (interest-free) | $0 | $0 | $0 | $0 | $0 | $0 | $0 | $0 | $0 | $0 | $0 | $0 | |
| New Long-term Liabilities | $0 | $0 | $0 | $0 | $0 | $0 | $0 | $0 | $0 | $0 | $0 | $0 | |
| Sales of Other Current Assets | $0 | $0 | $0 | $0 | $0 | $0 | $0 | $0 | $0 | $0 | $0 | $0 | |
| Sales of Long-term Assets | $0 | $0 | $0 | $0 | $0 | $0 | $0 | $0 | $0 | $0 | $0 | $0 | |
| New Investment Received | $0 | $0 | $0 | $0 | $0 | $10,000 | $0 | $0 | $0 | $0 | $0 | $0 | |
| Subtotal Cash Received | $5,700 | $6,143 | $19,300 | $19,923 | $21,247 | $33,697 | $25,882 | $28,308 | $30,900 | $31,270 | $33,923 | $35,547 | |
| Expenditures | Month 1 | Month 2 | Month 3 | Month 4 | Month 5 | Month 6 | Month 7 | Month 8 | Month 9 | Month 10 | Month 11 | Month 12 | |
| Expenditures from Operations | |||||||||||||
| Cash Spending | $10,400 | $10,400 | $10,400 | $10,400 | $10,400 | $10,400 | $10,400 | $10,400 | $10,400 | $10,400 | $10,400 | $10,400 | |
| Bill Payments | $218 | $6,529 | $6,567 | $7,985 | $12,901 | $16,437 | $16,417 | $20,359 | $18,591 | $20,748 | $22,183 | $21,662 | |
| Subtotal Spent on Operations | $10,618 | $16,929 | $16,967 | $18,385 | $23,301 | $26,837 | $26,817 | $30,759 | $28,991 | $31,148 | $32,583 | $32,062 | |
| Additional Cash Spent | |||||||||||||
| Sales Tax, VAT, HST/GST Paid Out | $0 | $0 | $0 | $0 | $0 | $0 | $0 | $0 | $0 | $0 | $0 | $0 | |
| Principal Repayment of Current Borrowing | $0 | $0 | $0 | $0 | $0 | $0 | $0 | $0 | $0 | $0 | $0 | $0 | |
| Other Liabilities Principal Repayment | $0 | $0 | $0 | $0 | $0 | $0 | $0 | $0 | $0 | $0 | $0 | $0 | |
| Long-term Liabilities Principal Repayment | $800 | $800 | $800 | $800 | $800 | $800 | $800 | $800 | $800 | $800 | $800 | $800 | |
| Purchase Other Current Assets | $0 | $0 | $0 | $0 | $0 | $0 | $0 | $0 | $0 | $0 | $0 | $0 | |
| Purchase Long-term Assets | $0 | $0 | $0 | $0 | $0 | $0 | $0 | $0 | $0 | $0 | $0 | $0 | |
| Dividends | $0 | $0 | $0 | $0 | $0 | $0 | $0 | $0 | $0 | $0 | $0 | $0 | |
| Subtotal Cash Spent | $11,418 | $17,729 | $17,767 | $19,185 | $24,101 | $27,637 | $27,617 | $31,559 | $29,791 | $31,948 | $33,383 | $32,862 | |
| Net Cash Flow | ($5,718) | ($11,585) | $1,533 | $739 | ($2,854) | $6,060 | ($1,736) | ($3,251) | $1,109 | ($678) | $541 | $2,685 | |
| Cash Balance | $16,482 | $4,897 | $6,430 | $7,169 | $4,315 | $10,375 | $8,639 | $5,388 | $6,497 | $5,820 | $6,361 | $9,045 | |
| Pro Forma Balance Sheet | |||||||||||||
| Month 1 | Month 2 | Month 3 | Month 4 | Month 5 | Month 6 | Month 7 | Month 8 | Month 9 | Month 10 | Month 11 | Month 12 | ||
| Assets | Starting Balances | ||||||||||||
| Current Assets | |||||||||||||
| Cash | $22,200 | $16,482 | $4,897 | $6,430 | $7,169 | $4,315 | $10,375 | $8,639 | $5,388 | $6,497 | $5,820 | $6,361 | $9,045 |
| Accounts Receivable | $0 | $13,300 | $26,157 | $26,857 | $28,933 | $31,687 | $35,490 | $39,608 | $41,300 | $43,400 | $46,130 | $48,207 | $51,660 |
| Inventory | $20,000 | $15,000 | $10,000 | $6,000 | $6,028 | $7,920 | $8,338 | $10,670 | $10,934 | $11,880 | $13,200 | $13,200 | $15,950 |
| Other Current Assets | $0 | $0 | $0 | $0 | $0 | $0 | $0 | $0 | $0 | $0 | $0 | $0 | $0 |
| Total Current Assets | $42,200 | $44,782 | $41,054 | $39,287 | $42,130 | $43,921 | $54,203 | $58,917 | $57,622 | $61,777 | $65,150 | $67,767 | $76,655 |
| Long-term Assets | |||||||||||||
| Long-term Assets | $50,000 | $50,000 | $50,000 | $50,000 | $50,000 | $50,000 | $50,000 | $50,000 | $50,000 | $50,000 | $50,000 | $50,000 | $50,000 |
| Accumulated Depreciation | $0 | $240 | $480 | $720 | $960 | $1,200 | $1,440 | $1,680 | $1,920 | $2,160 | $2,400 | $2,640 | $2,880 |
| Total Long-term Assets | $50,000 | $49,760 | $49,520 | $49,280 | $49,040 | $48,800 | $48,560 | $48,320 | $48,080 | $47,840 | $47,600 | $47,360 | $47,120 |
| Total Assets | $92,200 | $94,542 | $90,574 | $88,567 | $91,170 | $92,721 | $102,763 | $107,237 | $105,702 | $109,617 | $112,750 | $115,127 | $123,775 |
| Liabilities and Capital | Month 1 | Month 2 | Month 3 | Month 4 | Month 5 | Month 6 | Month 7 | Month 8 | Month 9 | Month 10 | Month 11 | Month 12 | |
| Current Liabilities | |||||||||||||
| Accounts Payable | $0 | $6,311 | $6,307 | $7,559 | $12,353 | $15,894 | $15,737 | $19,742 | $17,901 | $20,007 | $21,466 | $20,766 | $25,981 |
| Current Borrowing | $0 | $0 | $0 | $0 | $0 | $0 | $0 | $0 | $0 | $0 | $0 | $0 | $0 |
| Other Current Liabilities | $0 | $0 | $0 | $0 | $0 | $0 | $0 | $0 | $0 | $0 | $0 | $0 | $0 |
| Subtotal Current Liabilities | $0 | $6,311 | $6,307 | $7,559 | $12,353 | $15,894 | $15,737 | $19,742 | $17,901 | $20,007 | $21,466 | $20,766 | $25,981 |
| Long-term Liabilities | $100,000 | $99,200 | $98,400 | $97,600 | $96,800 | $96,000 | $95,200 | $94,400 | $93,600 | $92,800 | $92,000 | $91,200 | $90,400 |
| Total Liabilities | $100,000 | $105,511 | $104,707 | $105,159 | $109,153 | $111,894 | $110,937 | $114,142 | $111,501 | $112,807 | $113,466 | $111,966 | $116,381 |
| Paid-in Capital | $100,000 | $100,000 | $100,000 | $100,000 | $100,000 | $100,000 | $110,000 | $110,000 | $110,000 | $110,000 | $110,000 | $110,000 | $110,000 |
| Retained Earnings | ($107,800) | ($107,800) | ($107,800) | ($107,800) | ($107,800) | ($107,800) | ($107,800) | ($107,800) | ($107,800) | ($107,800) | ($107,800) | ($107,800) | ($107,800) |
| Earnings | $0 | ($3,169) | ($6,333) | ($8,792) | ($10,183) | ($11,373) | ($10,374) | ($9,105) | ($7,999) | ($5,390) | ($2,917) | $961 | $5,194 |
| Total Capital | ($7,800) | ($10,969) | ($14,133) | ($16,592) | ($17,983) | ($19,173) | ($8,174) | ($6,905) | ($5,799) | ($3,190) | ($717) | $3,161 | $7,394 |
| Total Liabilities and Capital | $92,200 | $94,542 | $90,574 | $88,567 | $91,170 | $92,721 | $102,763 | $107,237 | $105,702 | $109,617 | $112,750 | $115,127 | $123,775 |
| Net Worth | ($7,800) | ($10,969) | ($14,133) | ($16,592) | ($17,983) | ($19,173) | ($8,174) | ($6,905) | ($5,799) | ($3,190) | ($717) | $3,161 | $7,394 |


