
Oasis Juice
Executive Summary
Oasis Juice has been a successful product brand in the city of Richmond for three years. The company’s natural, 100% fruit juices has grown in sales by 15% each year and is now available in over 100 store outlets in the greater Richmond area. Oasis Juice will gross $580,000 in sales this year. This was generated from a initial investment of $180,000.
Oasis Juice is planning to expand its operation to include distribution to stores within the entire state. Owner funding and internally generated cash flow will enable most the expansion plan. The company will also secure a $100,000 short-term loan. Sales projections for the next three years are based on current sales success with the target customer base in Richmond. Initial contacts have been completed with retail outlets throughout the state and the potential target markets have been identified.
This plan will result in sales revenues growing to $1.2 million by Year 2.
1.1 Objectives
The objectives of Oasis Juice are the following:
- Create a state-wide sales staff.
- Establish strong sales in the state’s five metro areas by Year 2.
- Maintain tight control of cost and operation during expansion.
1.2 Mission
Oasis Juice’s mission is as follows:
- Quality: Our fruit juices are the highest quality, most nutritious food products…because we will accept nothing less.
- Innovative: Our products have always been in the forefront of the health and nutrition wave. Innovative products, state of the art manufacturing, quality assurance and industry expertise are the bases for our past and future successes.
- Integrity: Our customers depend on the quality of our juice products. Our commitment to the highest standard is the foundation of our customer’s trust in Oasis Juice. Delivering freshly made juice to consumers depends on extensive cooperation and mutual reliance between supplier and retailer. We stand behind our product, our service and our word.
Company Summary
Oasis Juice has built a reputation on offering the most delicious, nutritious, 100% natural juices with no artificial flavors, colors or preservatives.
2.1 Company Ownership
Oasis Juice is owned by Tama Gardner and William Harris.
2.2 Company History
Oasis Juice had its humble beginnings in the kitchen of Tama Gardner. It was in her kitchen that she and William Harris first created the fruit drinks that would soon become the basis for Oasis Juice.
Initially, the fruit drinks were sold at Richmond’s weekend craft fair. They proved to be so popular that the partnership pooled their resources and began Oasis Juice. Over the next three years, Oasis Juice’s drinks, shakes, and smoothies have become one of the city’s most visible signs of a healthy life style.
Oasis Juice’s operations have expanded dramatically over the past three years. Currently, the company has a staff of ten in production, delivery, and sales.
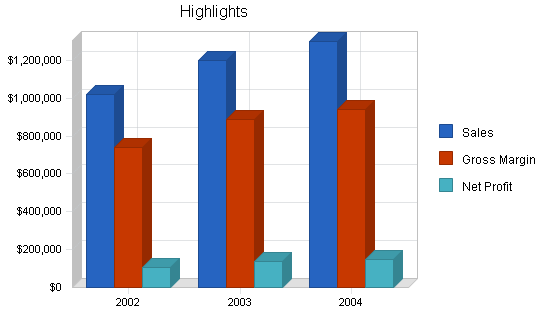
The following table and chart illustrate the rapid sales success of Oasis Juice.

| Past Performance | |||
| 1999 | 2000 | 2001 | |
| Sales | $450,000 | $520,000 | $580,000 |
| Gross Margin | $120,000 | $143,000 | $160,000 |
| Gross Margin % | 26.67% | 27.50% | 27.59% |
| Operating Expenses | $200,000 | $240,000 | $280,000 |
| Collection Period (days) | 0 | 0 | 76 |
| Inventory Turnover | 15.00 | 15.00 | 15.00 |
| Balance Sheet | |||
| 1999 | 2000 | 2001 | |
| Current Assets | |||
| Cash | $20,000 | $30,000 | $40,000 |
| Accounts Receivable | $49,000 | $58,000 | $80,000 |
| Inventory | $10,000 | $10,000 | $10,000 |
| Other Current Assets | $5,000 | $5,000 | $5,000 |
| Total Current Assets | $84,000 | $103,000 | $135,000 |
| Long-term Assets | |||
| Long-term Assets | $70,000 | $50,000 | $50,000 |
| Accumulated Depreciation | $4,000 | $8,000 | $12,000 |
| Total Long-term Assets | $66,000 | $42,000 | $38,000 |
| Total Assets | $150,000 | $145,000 | $173,000 |
| Current Liabilities | |||
| Accounts Payable | $30,000 | $20,000 | $20,000 |
| Current Borrowing | $0 | $0 | $0 |
| Other Current Liabilities (interest free) | $0 | $0 | $0 |
| Total Current Liabilities | $30,000 | $20,000 | $20,000 |
| Long-term Liabilities | $60,000 | $40,000 | $40,000 |
| Total Liabilities | $90,000 | $60,000 | $60,000 |
| Paid-in Capital | $30,000 | $40,000 | $80,000 |
| Retained Earnings | $30,000 | $45,000 | $9,000 |
| Earnings | $0 | $0 | $24,000 |
| Total Capital | $60,000 | $85,000 | $113,000 |
| Total Capital and Liabilities | $150,000 | $145,000 | $173,000 |
| Other Inputs | |||
| Payment Days | 0 | 0 | 12 |
| Sales on Credit | $0 | $0 | $330,000 |
| Receivables Turnover | 0.00 | 0.00 | 4.13 |
2.3 Company Locations and Facilities
Oasis Juice is located on 1234 Main St.
Products
Oasis Juice offers the following products:
- Fruit and vegetable juices;
- Smoothies;
- Super food drinks;
- Fruit and vegetable shakes.
Market Analysis Summary
The demographics of Oasis Juice customers are as follows:
- Young professional, ages 25 – 45;
- Average income of $40,000+ a year;
- Involved in athletic activity;
- Shop in upscale health/natural food stores.
4.1 Market Segmentation
Oasis Juice has identified seven metro locations within the state where we can reach our target customers:
- Montclair;
- Riley;
- Ashford;
- Tracy;
- Wilmington;
- Langsford;
- Willard.

| Market Analysis | |||||||
| 2002 | 2003 | 2004 | 2005 | 2006 | |||
| Potential Customers | Growth | CAGR | |||||
| Montclair | 10% | 60,000 | 66,000 | 72,600 | 79,860 | 87,846 | 10.00% |
| Riley | 10% | 75,000 | 82,500 | 90,750 | 99,825 | 109,808 | 10.00% |
| Ashford | 10% | 85,000 | 93,500 | 102,850 | 113,135 | 124,449 | 10.00% |
| Tracy | 10% | 75,000 | 82,500 | 90,750 | 99,825 | 109,808 | 10.00% |
| Wilmington | 10% | 62,000 | 68,200 | 75,020 | 82,522 | 90,774 | 10.00% |
| Langsford | 10% | 90,000 | 99,000 | 108,900 | 119,790 | 131,769 | 10.00% |
| Willard | 10% | 48,000 | 52,800 | 58,080 | 63,888 | 70,277 | 10.00% |
| Total | 10.00% | 495,000 | 544,500 | 598,950 | 658,845 | 724,731 | 10.00% |
Strategy and Implementation Summary
The strategy of Oasis Juice is to focus on our niche market which is health/natural food stores that serve the young active professional.
5.1 Marketing Strategy
Oasis Juice will introduce its products at 20% off regular price during the first month. In addition, Oasis Juice will co-sponsor local athletic charitable events to raise the visibility of the brand name.
5.2 Sales Strategy
The sales strategy is to build customer loyalty in the new markets. Oasis Juice will increase its sales force to focus on the new markets.
5.2.1 Sales Forecast
The following table and charts shows the rapid ramp-up of sales during the first twelve months of operation.

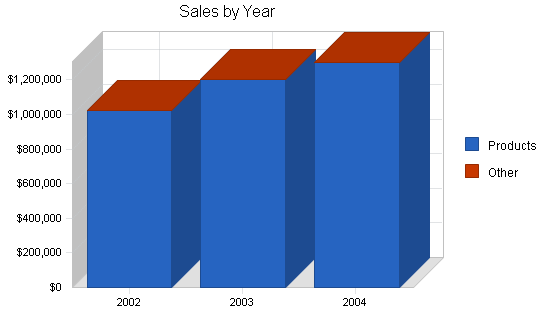
| Sales Forecast | |||
| 2002 | 2003 | 2004 | |
| Sales | |||
| Products | $1,020,000 | $1,200,000 | $1,300,000 |
| Other | $0 | $0 | $0 |
| Total Sales | $1,020,000 | $1,200,000 | $1,300,000 |
| Direct Cost of Sales | 2002 | 2003 | 2004 |
| Products | $278,000 | $310,000 | $360,000 |
| Other | $0 | $0 | $0 |
| Subtotal Direct Cost of Sales | $278,000 | $310,000 | $360,000 |
Management Summary
Co-owners, Tama Gardner and William Harris, currently manage the daily operation of Oasis Juice. Tama and William have fifteen years of experience working in natural food stores. Tama is responsible for production and distribution. William is the Sales Manager for Oasis Juice.
Tama Gardner was one of the founding members of the Mason Peak Natural Grocery, 4th and Tyler. The grocery was established in 1992 by the non-profit NEDCO, the Neighborhood Economic Development Corporation, and a number of concerned neighbors who wished to save the historic Mason Peak Market from destruction. Tama started as a cashier and advanced to the position of Store Manager in 1996. The grocery has grown into a community fixture under her management.
William Harris ran the University’s now defunct Natural Food Collective for three years before the program was defunded. The small on-campus store provided natural food products to student customers. Sales increased by 20% each year under his leadership. Unfortunately, the state budget shortfall impacted the continued funding of the program. Prior to this position, William worked as Buyer for Sunburst Natural Foods for four years.
6.1 Personnel Plan
The following table shows the project personnel plan for Oasis Juice.
| Personnel Plan | |||
| 2002 | 2003 | 2004 | |
| Tama Gardner | $36,000 | $40,000 | $44,000 |
| William Harris | $36,000 | $40,000 | $44,000 |
| Production Staff | $120,000 | $130,000 | $140,000 |
| Distribution Staff | $120,000 | $130,000 | $140,000 |
| Sales Staff | $72,000 | $76,000 | $80,000 |
| Total People | 13 | 13 | 13 |
| Total Payroll | $384,000 | $416,000 | $448,000 |
Financial Plan
The following is the financial plan for Oasis Juice.
7.1 Break-even Analysis
The monthly break-even point is $66,534.

| Break-even Analysis | |
| Monthly Revenue Break-even | $66,534 |
| Assumptions: | |
| Average Percent Variable Cost | 27% |
| Estimated Monthly Fixed Cost | $48,400 |
7.2 Projected Profit and Loss
The following table and charts are the projected profit and loss for three years.


| Pro Forma Profit and Loss | |||
| 2002 | 2003 | 2004 | |
| Sales | $1,020,000 | $1,200,000 | $1,300,000 |
| Direct Cost of Sales | $278,000 | $310,000 | $360,000 |
| Other Production Expenses | $0 | $0 | $0 |
| Total Cost of Sales | $278,000 | $310,000 | $360,000 |
| Gross Margin | $742,000 | $890,000 | $940,000 |
| Gross Margin % | 72.75% | 74.17% | 72.31% |
| Expenses | |||
| Payroll | $384,000 | $416,000 | $448,000 |
| Sales and Marketing and Other Expenses | $72,000 | $132,000 | $132,000 |
| Depreciation | $9,600 | $9,600 | $9,600 |
| Leased Equipment | $0 | $0 | $0 |
| Utilities | $12,000 | $12,000 | $12,000 |
| Insurance | $9,600 | $9,600 | $9,600 |
| Rent | $36,000 | $36,000 | $36,000 |
| Payroll Taxes | $57,600 | $62,400 | $67,200 |
| Other | $0 | $0 | $0 |
| Total Operating Expenses | $580,800 | $677,600 | $714,400 |
| Profit Before Interest and Taxes | $161,200 | $212,400 | $225,600 |
| EBITDA | $170,800 | $222,000 | $235,200 |
| Interest Expense | $9,310 | $13,703 | $14,203 |
| Taxes Incurred | $45,567 | $59,609 | $63,419 |
| Net Profit | $106,323 | $139,088 | $147,978 |
| Net Profit/Sales | 10.42% | 11.59% | 11.38% |
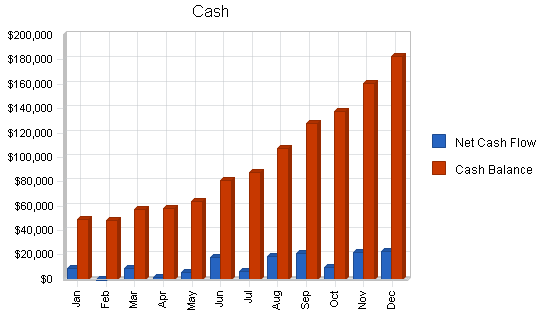
7.3 Projected Cash Flow
The following table and chart are the projected cash flow for three years.
| Pro Forma Cash Flow | |||
| 2002 | 2003 | 2004 | |
| Cash Received | |||
| Cash from Operations | |||
| Cash Sales | $255,000 | $300,000 | $325,000 |
| Cash from Receivables | $697,500 | $873,971 | $960,539 |
| Subtotal Cash from Operations | $952,500 | $1,173,971 | $1,285,539 |
| Additional Cash Received | |||
| Sales Tax, VAT, HST/GST Received | $0 | $0 | $0 |
| New Current Borrowing | $100,163 | $0 | $0 |
| New Other Liabilities (interest-free) | $36,000 | $36,000 | $36,000 |
| New Long-term Liabilities | $36,000 | $36,000 | $36,000 |
| Sales of Other Current Assets | $0 | $0 | $0 |
| Sales of Long-term Assets | $0 | $0 | $0 |
| New Investment Received | $0 | $0 | $0 |
| Subtotal Cash Received | $1,124,663 | $1,245,971 | $1,357,539 |
| Expenditures | 2002 | 2003 | 2004 |
| Expenditures from Operations | |||
| Cash Spending | $384,000 | $416,000 | $448,000 |
| Bill Payments | $511,954 | $637,704 | $695,324 |
| Subtotal Spent on Operations | $895,954 | $1,053,704 | $1,143,324 |
| Additional Cash Spent | |||
| Sales Tax, VAT, HST/GST Paid Out | $0 | $0 | $0 |
| Principal Repayment of Current Borrowing | $19,992 | $19,992 | $19,992 |
| Other Liabilities Principal Repayment | $0 | $0 | $0 |
| Long-term Liabilities Principal Repayment | $18,000 | $18,300 | $3,700 |
| Purchase Other Current Assets | $24,000 | $30,000 | $40,000 |
| Purchase Long-term Assets | $24,000 | $30,000 | $30,000 |
| Dividends | $0 | $0 | $0 |
| Subtotal Cash Spent | $981,946 | $1,151,996 | $1,237,016 |
| Net Cash Flow | $142,717 | $93,975 | $120,524 |
| Cash Balance | $182,717 | $276,692 | $397,216 |

7.4 Projected Balance Sheet
The following table is the projected balance sheet for three years.
| Pro Forma Balance Sheet | |||
| 2002 | 2003 | 2004 | |
| Assets | |||
| Current Assets | |||
| Cash | $182,717 | $276,692 | $397,216 |
| Accounts Receivable | $147,500 | $173,529 | $187,990 |
| Inventory | $33,000 | $36,799 | $42,734 |
| Other Current Assets | $29,000 | $59,000 | $99,000 |
| Total Current Assets | $392,217 | $546,020 | $726,940 |
| Long-term Assets | |||
| Long-term Assets | $74,000 | $104,000 | $134,000 |
| Accumulated Depreciation | $21,600 | $31,200 | $40,800 |
| Total Long-term Assets | $52,400 | $72,800 | $93,200 |
| Total Assets | $444,617 | $618,820 | $820,140 |
| Liabilities and Capital | 2002 | 2003 | 2004 |
| Current Liabilities | |||
| Accounts Payable | $51,123 | $52,530 | $57,564 |
| Current Borrowing | $80,171 | $60,179 | $40,187 |
| Other Current Liabilities | $36,000 | $72,000 | $108,000 |
| Subtotal Current Liabilities | $167,294 | $184,709 | $205,751 |
| Long-term Liabilities | $58,000 | $75,700 | $108,000 |
| Total Liabilities | $225,294 | $260,409 | $313,751 |
| Paid-in Capital | $80,000 | $80,000 | $80,000 |
| Retained Earnings | $33,000 | $139,323 | $278,411 |
| Earnings | $106,323 | $139,088 | $147,978 |
| Total Capital | $219,323 | $358,411 | $506,389 |
| Total Liabilities and Capital | $444,617 | $618,820 | $820,140 |
| Net Worth | $219,323 | $358,411 | $506,389 |
7.5 Business Ratios
Business ratios for the years of this plan are shown below. Industry profile ratios based on the Standard Industrial Classification (SIC) code 5149, Groceries and related products, are shown for comparison.
| Ratio Analysis | ||||
| 2002 | 2003 | 2004 | Industry Profile | |
| Sales Growth | 75.86% | 17.65% | 8.33% | 4.60% |
| Percent of Total Assets | ||||
| Accounts Receivable | 33.17% | 28.04% | 22.92% | 33.30% |
| Inventory | 7.42% | 5.95% | 5.21% | 26.00% |
| Other Current Assets | 6.52% | 9.53% | 12.07% | 20.90% |
| Total Current Assets | 88.21% | 88.24% | 88.64% | 80.20% |
| Long-term Assets | 11.79% | 11.76% | 11.36% | 19.80% |
| Total Assets | 100.00% | 100.00% | 100.00% | 100.00% |
| Current Liabilities | 37.63% | 29.85% | 25.09% | 45.20% |
| Long-term Liabilities | 13.04% | 12.23% | 13.17% | 10.00% |
| Total Liabilities | 50.67% | 42.08% | 38.26% | 55.20% |
| Net Worth | 49.33% | 57.92% | 61.74% | 44.80% |
| Percent of Sales | ||||
| Sales | 100.00% | 100.00% | 100.00% | 100.00% |
| Gross Margin | 72.75% | 74.17% | 72.31% | 44.10% |
| Selling, General & Administrative Expenses | 62.32% | 62.58% | 60.92% | 26.70% |
| Advertising Expenses | 5.88% | 10.00% | 9.23% | 0.70% |
| Profit Before Interest and Taxes | 15.80% | 17.70% | 17.35% | 0.80% |
| Main Ratios | ||||
| Current | 2.34 | 2.96 | 3.53 | 1.69 |
| Quick | 2.15 | 2.76 | 3.33 | 1.01 |
| Total Debt to Total Assets | 50.67% | 42.08% | 38.26% | 55.20% |
| Pre-tax Return on Net Worth | 69.25% | 55.44% | 41.75% | 3.60% |
| Pre-tax Return on Assets | 34.16% | 32.11% | 25.78% | 8.00% |
| Additional Ratios | 2002 | 2003 | 2004 | |
| Net Profit Margin | 10.42% | 11.59% | 11.38% | n.a |
| Return on Equity | 48.48% | 38.81% | 29.22% | n.a |
| Activity Ratios | ||||
| Accounts Receivable Turnover | 5.19 | 5.19 | 5.19 | n.a |
| Collection Days | 59 | 65 | 68 | n.a |
| Inventory Turnover | 10.91 | 8.88 | 9.05 | n.a |
| Accounts Payable Turnover | 10.62 | 12.17 | 12.17 | n.a |
| Payment Days | 28 | 30 | 29 | n.a |
| Total Asset Turnover | 2.29 | 1.94 | 1.59 | n.a |
| Debt Ratios | ||||
| Debt to Net Worth | 1.03 | 0.73 | 0.62 | n.a |
| Current Liab. to Liab. | 0.74 | 0.71 | 0.66 | n.a |
| Liquidity Ratios | ||||
| Net Working Capital | $224,923 | $361,311 | $521,189 | n.a |
| Interest Coverage | 17.31 | 15.50 | 15.88 | n.a |
| Additional Ratios | ||||
| Assets to Sales | 0.44 | 0.52 | 0.63 | n.a |
| Current Debt/Total Assets | 38% | 30% | 25% | n.a |
| Acid Test | 1.27 | 1.82 | 2.41 | n.a |
| Sales/Net Worth | 4.65 | 3.35 | 2.57 | n.a |
| Dividend Payout | 0.00 | 0.00 | 0.00 | n.a |
Appendix
| Sales Forecast | |||||||||||||
| Jan | Feb | Mar | Apr | May | Jun | Jul | Aug | Sep | Oct | Nov | Dec | ||
| Sales | |||||||||||||
| Products | 0% | $60,000 | $60,000 | $70,000 | $80,000 | $80,000 | $90,000 | $90,000 | $90,000 | $100,000 | $100,000 | $100,000 | $100,000 |
| Other | 0% | $0 | $0 | $0 | $0 | $0 | $0 | $0 | $0 | $0 | $0 | $0 | $0 |
| Total Sales | $60,000 | $60,000 | $70,000 | $80,000 | $80,000 | $90,000 | $90,000 | $90,000 | $100,000 | $100,000 | $100,000 | $100,000 | |
| Direct Cost of Sales | Jan | Feb | Mar | Apr | May | Jun | Jul | Aug | Sep | Oct | Nov | Dec | |
| Products | $13,000 | $13,000 | $17,000 | $20,000 | $20,000 | $25,000 | $25,000 | $25,000 | $30,000 | $30,000 | $30,000 | $30,000 | |
| Other | $0 | $0 | $0 | $0 | $0 | $0 | $0 | $0 | $0 | $0 | $0 | $0 | |
| Subtotal Direct Cost of Sales | $13,000 | $13,000 | $17,000 | $20,000 | $20,000 | $25,000 | $25,000 | $25,000 | $30,000 | $30,000 | $30,000 | $30,000 | |
| Personnel Plan | |||||||||||||
| Jan | Feb | Mar | Apr | May | Jun | Jul | Aug | Sep | Oct | Nov | Dec | ||
| Tama Gardner | 0% | $3,000 | $3,000 | $3,000 | $3,000 | $3,000 | $3,000 | $3,000 | $3,000 | $3,000 | $3,000 | $3,000 | $3,000 |
| William Harris | 0% | $3,000 | $3,000 | $3,000 | $3,000 | $3,000 | $3,000 | $3,000 | $3,000 | $3,000 | $3,000 | $3,000 | $3,000 |
| Production Staff | 0% | $10,000 | $10,000 | $10,000 | $10,000 | $10,000 | $10,000 | $10,000 | $10,000 | $10,000 | $10,000 | $10,000 | $10,000 |
| Distribution Staff | 0% | $10,000 | $10,000 | $10,000 | $10,000 | $10,000 | $10,000 | $10,000 | $10,000 | $10,000 | $10,000 | $10,000 | $10,000 |
| Sales Staff | 0% | $6,000 | $6,000 | $6,000 | $6,000 | $6,000 | $6,000 | $6,000 | $6,000 | $6,000 | $6,000 | $6,000 | $6,000 |
| Total People | 13 | 13 | 13 | 13 | 13 | 13 | 13 | 13 | 13 | 13 | 13 | 13 | |
| Total Payroll | $32,000 | $32,000 | $32,000 | $32,000 | $32,000 | $32,000 | $32,000 | $32,000 | $32,000 | $32,000 | $32,000 | $32,000 | |
| General Assumptions | |||||||||||||
| Jan | Feb | Mar | Apr | May | Jun | Jul | Aug | Sep | Oct | Nov | Dec | ||
| Plan Month | 1 | 2 | 3 | 4 | 5 | 6 | 7 | 8 | 9 | 10 | 11 | 12 | |
| Current Interest Rate | 10.00% | 10.00% | 10.00% | 10.00% | 10.00% | 10.00% | 10.00% | 10.00% | 10.00% | 10.00% | 10.00% | 10.00% | |
| Long-term Interest Rate | 10.00% | 10.00% | 10.00% | 10.00% | 10.00% | 10.00% | 10.00% | 10.00% | 10.00% | 10.00% | 10.00% | 10.00% | |
| Tax Rate | 30.00% | 30.00% | 30.00% | 30.00% | 30.00% | 30.00% | 30.00% | 30.00% | 30.00% | 30.00% | 30.00% | 30.00% | |
| Other | 0 | 0 | 0 | 0 | 0 | 0 | 0 | 0 | 0 | 0 | 0 | 0 | |
| Pro Forma Profit and Loss | |||||||||||||
| Jan | Feb | Mar | Apr | May | Jun | Jul | Aug | Sep | Oct | Nov | Dec | ||
| Sales | $60,000 | $60,000 | $70,000 | $80,000 | $80,000 | $90,000 | $90,000 | $90,000 | $100,000 | $100,000 | $100,000 | $100,000 | |
| Direct Cost of Sales | $13,000 | $13,000 | $17,000 | $20,000 | $20,000 | $25,000 | $25,000 | $25,000 | $30,000 | $30,000 | $30,000 | $30,000 | |
| Other Production Expenses | $0 | $0 | $0 | $0 | $0 | $0 | $0 | $0 | $0 | $0 | $0 | $0 | |
| Total Cost of Sales | $13,000 | $13,000 | $17,000 | $20,000 | $20,000 | $25,000 | $25,000 | $25,000 | $30,000 | $30,000 | $30,000 | $30,000 | |
| Gross Margin | $47,000 | $47,000 | $53,000 | $60,000 | $60,000 | $65,000 | $65,000 | $65,000 | $70,000 | $70,000 | $70,000 | $70,000 | |
| Gross Margin % | 78.33% | 78.33% | 75.71% | 75.00% | 75.00% | 72.22% | 72.22% | 72.22% | 70.00% | 70.00% | 70.00% | 70.00% | |
| Expenses | |||||||||||||
| Payroll | $32,000 | $32,000 | $32,000 | $32,000 | $32,000 | $32,000 | $32,000 | $32,000 | $32,000 | $32,000 | $32,000 | $32,000 | |
| Sales and Marketing and Other Expenses | $6,000 | $6,000 | $6,000 | $6,000 | $6,000 | $6,000 | $6,000 | $6,000 | $6,000 | $6,000 | $6,000 | $6,000 | |
| Depreciation | $800 | $800 | $800 | $800 | $800 | $800 | $800 | $800 | $800 | $800 | $800 | $800 | |
| Leased Equipment | $0 | $0 | $0 | $0 | $0 | $0 | $0 | $0 | $0 | $0 | $0 | $0 | |
| Utilities | $1,000 | $1,000 | $1,000 | $1,000 | $1,000 | $1,000 | $1,000 | $1,000 | $1,000 | $1,000 | $1,000 | $1,000 | |
| Insurance | $800 | $800 | $800 | $800 | $800 | $800 | $800 | $800 | $800 | $800 | $800 | $800 | |
| Rent | $3,000 | $3,000 | $3,000 | $3,000 | $3,000 | $3,000 | $3,000 | $3,000 | $3,000 | $3,000 | $3,000 | $3,000 | |
| Payroll Taxes | 15% | $4,800 | $4,800 | $4,800 | $4,800 | $4,800 | $4,800 | $4,800 | $4,800 | $4,800 | $4,800 | $4,800 | $4,800 |
| Other | $0 | $0 | $0 | $0 | $0 | $0 | $0 | $0 | $0 | $0 | $0 | $0 | |
| Total Operating Expenses | $48,400 | $48,400 | $48,400 | $48,400 | $48,400 | $48,400 | $48,400 | $48,400 | $48,400 | $48,400 | $48,400 | $48,400 | |
| Profit Before Interest and Taxes | ($1,400) | ($1,400) | $4,600 | $11,600 | $11,600 | $16,600 | $16,600 | $16,600 | $21,600 | $21,600 | $21,600 | $21,600 | |
| EBITDA | ($600) | ($600) | $5,400 | $12,400 | $12,400 | $17,400 | $17,400 | $17,400 | $22,400 | $22,400 | $22,400 | $22,400 | |
| Interest Expense | $401 | $469 | $538 | $606 | $674 | $742 | $810 | $878 | $946 | $1,014 | $1,082 | $1,151 | |
| Taxes Incurred | ($540) | ($561) | $1,219 | $3,298 | $3,278 | $4,757 | $4,737 | $4,717 | $6,196 | $6,176 | $6,155 | $6,135 | |
| Net Profit | ($1,261) | ($1,309) | $2,844 | $7,696 | $7,648 | $11,101 | $11,053 | $11,006 | $14,458 | $14,410 | $14,363 | $14,314 | |
| Net Profit/Sales | -2.10% | -2.18% | 4.06% | 9.62% | 9.56% | 12.33% | 12.28% | 12.23% | 14.46% | 14.41% | 14.36% | 14.31% | |
| Pro Forma Cash Flow | |||||||||||||
| Jan | Feb | Mar | Apr | May | Jun | Jul | Aug | Sep | Oct | Nov | Dec | ||
| Cash Received | |||||||||||||
| Cash from Operations | |||||||||||||
| Cash Sales | $15,000 | $15,000 | $17,500 | $20,000 | $20,000 | $22,500 | $22,500 | $22,500 | $25,000 | $25,000 | $25,000 | $25,000 | |
| Cash from Receivables | $40,000 | $41,500 | $45,000 | $45,250 | $52,750 | $60,000 | $60,250 | $67,500 | $67,500 | $67,750 | $75,000 | $75,000 | |
| Subtotal Cash from Operations | $55,000 | $56,500 | $62,500 | $65,250 | $72,750 | $82,500 | $82,750 | $90,000 | $92,500 | $92,750 | $100,000 | $100,000 | |
| Additional Cash Received | |||||||||||||
| Sales Tax, VAT, HST/GST Received | 0.00% | $0 | $0 | $0 | $0 | $0 | $0 | $0 | $0 | $0 | $0 | $0 | $0 |
| New Current Borrowing | $8,333 | $8,333 | $8,333 | $8,333 | $8,333 | $8,333 | $8,333 | $8,333 | $8,333 | $8,333 | $8,333 | $8,500 | |
| New Other Liabilities (interest-free) | $3,000 | $3,000 | $3,000 | $3,000 | $3,000 | $3,000 | $3,000 | $3,000 | $3,000 | $3,000 | $3,000 | $3,000 | |
| New Long-term Liabilities | $3,000 | $3,000 | $3,000 | $3,000 | $3,000 | $3,000 | $3,000 | $3,000 | $3,000 | $3,000 | $3,000 | $3,000 | |
| Sales of Other Current Assets | $0 | $0 | $0 | $0 | $0 | $0 | $0 | $0 | $0 | $0 | $0 | $0 | |
| Sales of Long-term Assets | $0 | $0 | $0 | $0 | $0 | $0 | $0 | $0 | $0 | $0 | $0 | $0 | |
| New Investment Received | $0 | $0 | $0 | $0 | $0 | $0 | $0 | $0 | $0 | $0 | $0 | $0 | |
| Subtotal Cash Received | $69,333 | $70,833 | $76,833 | $79,583 | $87,083 | $96,833 | $97,083 | $104,333 | $106,833 | $107,083 | $114,333 | $114,500 | |
| Expenditures | Jan | Feb | Mar | Apr | May | Jun | Jul | Aug | Sep | Oct | Nov | Dec | |
| Expenditures from Operations | |||||||||||||
| Cash Spending | $32,000 | $32,000 | $32,000 | $32,000 | $32,000 | $32,000 | $32,000 | $32,000 | $32,000 | $32,000 | $32,000 | $32,000 | |
| Bill Payments | $21,092 | $32,619 | $28,850 | $38,891 | $42,695 | $39,953 | $51,417 | $46,148 | $46,596 | $58,060 | $52,791 | $52,839 | |
| Subtotal Spent on Operations | $53,092 | $64,619 | $60,850 | $70,891 | $74,695 | $71,953 | $83,417 | $78,148 | $78,596 | $90,060 | $84,791 | $84,839 | |
| Additional Cash Spent | |||||||||||||
| Sales Tax, VAT, HST/GST Paid Out | $0 | $0 | $0 | $0 | $0 | $0 | $0 | $0 | $0 | $0 | $0 | $0 | |
| Principal Repayment of Current Borrowing | $1,666 | $1,666 | $1,666 | $1,666 | $1,666 | $1,666 | $1,666 | $1,666 | $1,666 | $1,666 | $1,666 | $1,666 | |
| Other Liabilities Principal Repayment | $0 | $0 | $0 | $0 | $0 | $0 | $0 | $0 | $0 | $0 | $0 | $0 | |
| Long-term Liabilities Principal Repayment | $1,500 | $1,500 | $1,500 | $1,500 | $1,500 | $1,500 | $1,500 | $1,500 | $1,500 | $1,500 | $1,500 | $1,500 | |
| Purchase Other Current Assets | $2,000 | $2,000 | $2,000 | $2,000 | $2,000 | $2,000 | $2,000 | $2,000 | $2,000 | $2,000 | $2,000 | $2,000 | |
| Purchase Long-term Assets | $2,000 | $2,000 | $2,000 | $2,000 | $2,000 | $2,000 | $2,000 | $2,000 | $2,000 | $2,000 | $2,000 | $2,000 | |
| Dividends | $0 | $0 | $0 | $0 | $0 | $0 | $0 | $0 | $0 | $0 | $0 | $0 | |
| Subtotal Cash Spent | $60,258 | $71,785 | $68,016 | $78,057 | $81,861 | $79,119 | $90,583 | $85,314 | $85,762 | $97,226 | $91,957 | $92,005 | |
| Net Cash Flow | $9,075 | ($952) | $8,817 | $1,526 | $5,222 | $17,714 | $6,500 | $19,019 | $21,071 | $9,857 | $22,376 | $22,495 | |
| Cash Balance | $49,075 | $48,123 | $56,940 | $58,465 | $63,687 | $81,401 | $87,900 | $106,919 | $127,990 | $137,847 | $160,222 | $182,717 | |
| Pro Forma Balance Sheet | |||||||||||||
| Jan | Feb | Mar | Apr | May | Jun | Jul | Aug | Sep | Oct | Nov | Dec | ||
| Assets | Starting Balances | ||||||||||||
| Current Assets | |||||||||||||
| Cash | $40,000 | $49,075 | $48,123 | $56,940 | $58,465 | $63,687 | $81,401 | $87,900 | $106,919 | $127,990 | $137,847 | $160,222 | $182,717 |
| Accounts Receivable | $80,000 | $85,000 | $88,500 | $96,000 | $110,750 | $118,000 | $125,500 | $132,750 | $132,750 | $140,250 | $147,500 | $147,500 | $147,500 |
| Inventory | $10,000 | $14,300 | $14,300 | $18,700 | $22,000 | $22,000 | $27,500 | $27,500 | $27,500 | $33,000 | $33,000 | $33,000 | $33,000 |
| Other Current Assets | $5,000 | $7,000 | $9,000 | $11,000 | $13,000 | $15,000 | $17,000 | $19,000 | $21,000 | $23,000 | $25,000 | $27,000 | $29,000 |
| Total Current Assets | $135,000 | $155,375 | $159,923 | $182,640 | $204,215 | $218,687 | $251,401 | $267,150 | $288,169 | $324,240 | $343,347 | $367,722 | $392,217 |
| Long-term Assets | |||||||||||||
| Long-term Assets | $50,000 | $52,000 | $54,000 | $56,000 | $58,000 | $60,000 | $62,000 | $64,000 | $66,000 | $68,000 | $70,000 | $72,000 | $74,000 |
| Accumulated Depreciation | $12,000 | $12,800 | $13,600 | $14,400 | $15,200 | $16,000 | $16,800 | $17,600 | $18,400 | $19,200 | $20,000 | $20,800 | $21,600 |
| Total Long-term Assets | $38,000 | $39,200 | $40,400 | $41,600 | $42,800 | $44,000 | $45,200 | $46,400 | $47,600 | $48,800 | $50,000 | $51,200 | $52,400 |
| Total Assets | $173,000 | $194,575 | $200,323 | $224,240 | $247,015 | $262,687 | $296,601 | $313,550 | $335,769 | $373,040 | $393,347 | $418,922 | $444,617 |
| Liabilities and Capital | Jan | Feb | Mar | Apr | May | Jun | Jul | Aug | Sep | Oct | Nov | Dec | |
| Current Liabilities | |||||||||||||
| Accounts Payable | $20,000 | $31,669 | $27,558 | $37,464 | $41,377 | $38,233 | $49,879 | $44,609 | $44,655 | $56,301 | $51,030 | $51,076 | $51,123 |
| Current Borrowing | $0 | $6,667 | $13,334 | $20,001 | $26,668 | $33,335 | $40,002 | $46,669 | $53,336 | $60,003 | $66,670 | $73,337 | $80,171 |
| Other Current Liabilities | $0 | $3,000 | $6,000 | $9,000 | $12,000 | $15,000 | $18,000 | $21,000 | $24,000 | $27,000 | $30,000 | $33,000 | $36,000 |
| Subtotal Current Liabilities | $20,000 | $41,336 | $46,892 | $66,465 | $80,045 | $86,568 | $107,881 | $112,278 | $121,991 | $143,304 | $147,700 | $157,413 | $167,294 |
| Long-term Liabilities | $40,000 | $41,500 | $43,000 | $44,500 | $46,000 | $47,500 | $49,000 | $50,500 | $52,000 | $53,500 | $55,000 | $56,500 | $58,000 |
| Total Liabilities | $60,000 | $82,836 | $89,892 | $110,965 | $126,045 | $134,068 | $156,881 | $162,778 | $173,991 | $196,804 | $202,700 | $213,913 | $225,294 |
| Paid-in Capital | $80,000 | $80,000 | $80,000 | $80,000 | $80,000 | $80,000 | $80,000 | $80,000 | $80,000 | $80,000 | $80,000 | $80,000 | $80,000 |
| Retained Earnings | $9,000 | $33,000 | $33,000 | $33,000 | $33,000 | $33,000 | $33,000 | $33,000 | $33,000 | $33,000 | $33,000 | $33,000 | $33,000 |
| Earnings | $24,000 | ($1,261) | ($2,570) | $274 | $7,970 | $15,619 | $26,720 | $37,773 | $48,778 | $63,236 | $77,646 | $92,009 | $106,323 |
| Total Capital | $113,000 | $111,739 | $110,430 | $113,274 | $120,970 | $128,619 | $139,720 | $150,773 | $161,778 | $176,236 | $190,646 | $205,009 | $219,323 |
| Total Liabilities and Capital | $173,000 | $194,575 | $200,323 | $224,240 | $247,015 | $262,687 | $296,601 | $313,550 | $335,769 | $373,040 | $393,347 | $418,922 | $444,617 |
| Net Worth | $113,000 | $111,739 | $110,430 | $113,274 | $120,970 | $128,619 | $139,720 | $150,773 | $161,778 | $176,236 | $190,646 | $205,009 | $219,323 |


