
Wheelie Deals
Executive Summary
Wheelie Deals is a wholesale distributor that serves the retail bicycle industry. Wheelie Deals will carve out a focused niche within this industry, providing closeouts, last-year models, and seconds. Currently, most of the large wholesalers will occasionally have a closeout to offer, however, the availability of special deals is spotty. Wheelie Deals will quickly become the #1 source to provide retail shops with above average margins.
Wheelie Deals is lead by Dan Psycle, MBA, a veteran of the bicycle industry. Dan has modeled Wheelie Deals off of an already successful wholesale distributor business model and will quickly gain market share. Profitability will be reached by month eight with comfortable profits by year three.

1.1 Objectives
The objectives for the first three years of operation include:
- To create a company whose goal is to exceed customer’s expectations.
- To increase the number of customers served by 20% per year.
- To develop a sustainable start-up business, surviving off its own cash.
1.2 Mission
Wheelie Deals’ mission is to create the largest selection of closeout bicycle parts. We exist to attract and maintain customers. When we adhere to this maxim, everything else will fall into place. Our services will exceed the expectations of our customers.
1.3 Keys to Success
The key to success is unbeatable selection and outstanding customer service.
Company Summary
Wheelie Deals is a wholesale distributor of closeout bicycle parts. The warehouse is based in Albany, Oregon. Wheelie Deals services the national retail bicycle industry with manufacturer closeouts, seconds, and last-year model bicycle parts and components.
2.1 Start-up Summary
Wheelie Deals will incur the following start-up costs:
- Pallet racking.
- Pallets.
- Pallet truck.
- Pallet shelving.
- Forklift (used).
- Three computer systems including CD-RW, printer, DSL connection, Microsoft Office, and QuickBooks Pro.
- Three desks and chairs.
- File cabinets.
- Three phone lines.
Please note that the following items which are considered assets to be used for more than a year will labeled long-term assets and will be depreciated using G.A.A.P. approved straight-line depreciation method.

| Start-up | |
| Requirements | |
| Start-up Expenses | |
| Legal | $1,000 |
| Stationery etc. | $100 |
| Brochures | $200 |
| Other | $0 |
| Total Start-up Expenses | $1,300 |
| Start-up Assets | |
| Cash Required | $28,950 |
| Start-up Inventory | $10,000 |
| Other Current Assets | $0 |
| Long-term Assets | $24,750 |
| Total Assets | $63,700 |
| Total Requirements | $65,000 |
| Start-up Funding | |
| Start-up Expenses to Fund | $1,300 |
| Start-up Assets to Fund | $63,700 |
| Total Funding Required | $65,000 |
| Assets | |
| Non-cash Assets from Start-up | $34,750 |
| Cash Requirements from Start-up | $28,950 |
| Additional Cash Raised | $0 |
| Cash Balance on Starting Date | $28,950 |
| Total Assets | $63,700 |
| Liabilities and Capital | |
| Liabilities | |
| Current Borrowing | $0 |
| Long-term Liabilities | $0 |
| Accounts Payable (Outstanding Bills) | $0 |
| Other Current Liabilities (interest-free) | $0 |
| Total Liabilities | $0 |
| Capital | |
| Planned Investment | |
| Dan | $15,000 |
| Friends and family | $40,000 |
| Other | $0 |
| Additional Investment Requirement | $10,000 |
| Total Planned Investment | $65,000 |
| Loss at Start-up (Start-up Expenses) | ($1,300) |
| Total Capital | $63,700 |
| Total Capital and Liabilities | $63,700 |
| Total Funding | $65,000 |
2.2 Company Ownership
Wheelie Deals is an privately held Oregon corporation founded and owned by Dan Psycle.
Products
Wheelie Deals is a wholesale distributor of bicycles and bicycle components. Wheelie Deals specializes in closeouts, last-year models, and seconds. A partial list of the manufacturers that Wheelie Deals sells are:
- Shimano
- Campagnolo
- White Industries
- Syncros
- Mavic
- Chris King
- Tioga
- Michelin
- Easton
- Rock Shox
- Answer Racing
- Salsa
- Race Face
- Sweet Parts
- Grip Shift
- Ritchey
- Wellgo
Market Analysis Summary
The retail bicycle market can be broken down into two segments, the independent bicycle shops and the chain bicycle shops. Most bike shops are independent, however, there is a growing trend of bicycle shops being part of a chain.
4.1 Market Segmentation
The two segments that Wheelie Deals will be targeting are:
- Independent bicycle shop. The large majority of bicycle retailers are independently owned sole proprietorships. They are usually owned by one person and range from three to 10 employees, depending on the season.
- Chain bicycle shops. Although chains are not the predominant business form, most large cities (over 200,000 people) have at least one chain serving the community. Sometimes the chains are franchises with different owners, other times they are same owners with multiple stores.
The majority of sales will be to the independent bicycle shops, the reason being most of the chains have a very uniformed product offering that does not deviate for specials and closeouts. The chains tend to value consistency of product offerings at the expense of profit margins.

| Market Analysis | |||||||
| Year 1 | Year 2 | Year 3 | Year 4 | Year 5 | |||
| Potential Customers | Growth | CAGR | |||||
| Independant bicycle shops | 9% | 12,458 | 13,579 | 14,801 | 16,133 | 17,585 | 9.00% |
| Chain bicycle shops | 8% | 8,045 | 8,689 | 9,384 | 10,135 | 10,946 | 8.00% |
| Other | 0% | 0 | 0 | 0 | 0 | 0 | 0.00% |
| Total | 8.61% | 20,503 | 22,268 | 24,185 | 26,268 | 28,531 | 8.61% |
4.2 Target Market Segment Strategy
Wheelie Deals will target the retail bicycle shops through three means:
- Trade shows. Wheelie Deals will be visible at the two major industry trade shows. 75% of the retail bicycle shops attend at least one trade show a year. The shows provide retailers an opportunity to view upcoming products and chat with a spokesman from the company, as well place pre-season orders.
- Advertisements. Wheelie Deals will be advertising in Bicycle Retailer, the industry magazine. 90% of the bicycle shops in America receive a copy of Bicycle Retailer making the advertising opportunities especially valuable.
- Website. Wheelie Deals will develop a website that includes a current catalog of their offerings. This will be the most up-to-date source of product information and availability. All advertising activities and trade show presence will highlight the website as an indispensable source of information.
4.3 Industry Analysis
Currently the industry is served by 10-15 different wholesalers. Each wholesaler has their own niche to some degree, but generally they have a fairly wide product offering. Some or most of the wholesalers have a sale or closeout section, but this typically makes up a small percentage of their business. It is well known that the margins in the retail bicycle industry are small; 30% for bicycles, 75% for components, and 100% for clothing. Closeouts are a great way to increase store traffic and significantly helps out the shop’s bottom line with higher margins.
4.3.1 Competition and Buying Patterns
The major competitors are:
- Seattle Bike Supply: this is a national distributor with several warehouses spread out across the country. Seattle sells closeout products, but they make up a small portion of their business.
- Quality Bicycle Products: this is a relatively high-end bicycle component distributor that operates on a national scale, however, they only have one warehouse in Minneapolis, MN.
- Riteway: this is a national wholesaler with multiple warehouses. Riteway has an extensive product catalog and does offer a decent amount of closeouts, in part due to a minority holding of the GT bicycle company.
Bicycle retailers tend to favor one type of distributor for certain things. Some variables that influence decision is price, availability, shipping time, and available terms. The retailers will often use one main wholesaler and aggregate as much as possible into an order to save shipping costs.
Strategy and Implementation Summary
Wheelie Deals sales and marketing strategy will be based on occupying an unmet niche in the retail bicycle wholesale industry. Wheelie Deals will be a wholesaler only for closeout items. This focus will allow Wheelie Deals to stand out relative to the other wholesalers in the industry.
5.1 Competitive Edge
Wheelie Deals’ competitive edge is specializing in the closeout niche. Currently, there are no wholesalers that are specializing to a large degree. Everyone carries a fairly wide range of products. It is a clear advantage to be focused and only concentrate a specific niche. By focusing on closeouts, retail shops can contact Wheelie Deals and always find products that offer nice margins, uncharacteristic of the bicycle industry.

The trend of the industry in general is of consolidation. By offering value-added services such as closeout items which provide the retailer with better than average margins, Wheelie Deals is developing value that creates a steady flow of customers.
5.2 Sales Strategy
The sales strategy will be intertwined with the product offerings. It is of small value to have great closeouts if there is little demand. By having a well thought out product selection, Wheelie Deals will significantly increase the chances of turning a prospective customer into a sale. Wheelie Deals will emphasize the popularity and quick turnover of the items that they stock. Wheelie Deals will shy away from items that may be a good deal but are a hard sell because they are likely to sit on the retailers shelf.
Additionally, Wheelie Deals will have constantly changing inventory which will encourage shops to frequently inquire with Wheelie Deals. Lastly, Wheelie Deals will have an email update service that will be sent to interested shops which is a “hotsheet” that details the current specials.
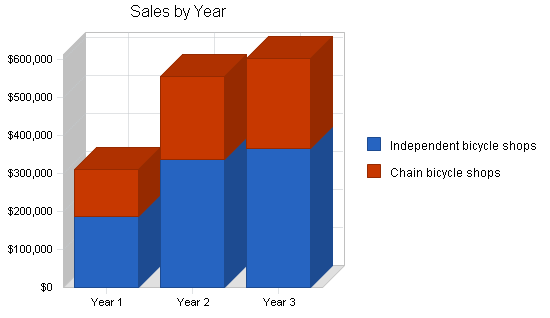
5.2.1 Sales Forecast
The first month will be used to secure warehouse space, set it up to accept inventory, and hire personnel. During the first six weeks relationships will be established with many different manufactures of parts. These relationships will be based on Wheelie Deals willingness to take all of their closeouts. Typically, the manufacturer will call several distributors and eventually will find someone to take some, or all of their product. Wheelie Deals increased willingness to take closeouts will create an incentive for the manufacturer to contact Wheelie Deals first.
Month three will mark the first decent month of sales. It is forecasted that sales will steadily increase after this month.

| Sales Forecast | |||
| Year 1 | Year 2 | Year 3 | |
| Sales | |||
| Independent bicycle shops | $187,239 | $335,458 | $365,454 |
| Chain bicycle shops | $121,705 | $218,048 | $237,545 |
| Total Sales | $308,944 | $553,506 | $602,999 |
| Direct Cost of Sales | Year 1 | Year 2 | Year 3 |
| Independent bicycle shops | $93,620 | $167,729 | $182,727 |
| Chain bicycle shops | $60,853 | $109,024 | $118,773 |
| Subtotal Direct Cost of Sales | $154,472 | $276,753 | $301,500 |
5.3 Milestones
Wheelie Deals will have several milestones early on:
- Business plan completion. This will be done as a roadmap for the organization. This will be an indispensable tool for the ongoing performance and improvement of the company.
- Warehouse set up.
- Establishment of vendor relationships.
- Profitability.
| Milestones | |||||
| Milestone | Start Date | End Date | Budget | Manager | Department |
| Business plan completion | 1/1/2001 | 2/1/2001 | $0 | ABC | Marketing |
| Warehouse set up | 1/1/2001 | 2/1/2001 | $0 | ABC | Department |
| Establishment of vendor relationships | 1/1/2001 | 2/15/2001 | $0 | ABC | Department |
| Profitability | 1/1/2001 | 9/1/2001 | $0 | ABC | Department |
| Totals | $0 | ||||
Management Summary
Dan Psycle received a Bachelor of Arts in philosophy from Washington & Jefferson College. After college he worked in a bicycle shop as a mechanic but quickly moved to sales and finally manager all in a span of a year. Dan stayed at the shop for two more additional years, learning all of the nuances of the bicycle industry. By this time, Dan felt he had a comfortable grasp of the bicycle industry and now it was time for more schooling.
Dan moved out to Eugene, OR to pursue a MBA from the University of Oregon. A friend of Dan’s family had a wholesale distribution company for plumbing supplies. Dan spent a week with this company to gain insight into the wholesale distribution industry in hopes of transferring this information into a distribution business for the bicycling industry.
6.1 Personnel Plan
Dan will be a full-time employee. Dan will also hire one administrative person to handle billing, payroll, and etc. Two other full-time employees will be used for taking phone orders. These two employees will assist a fourth employee with order fulfillment.
| Personnel Plan | |||
| Year 1 | Year 2 | Year 3 | |
| Dan | $36,000 | $40,000 | $45,000 |
| Full time administrative | $17,600 | $19,200 | $20,544 |
| Full time sales | $17,600 | $19,200 | $20,544 |
| Full time sales | $17,600 | $19,200 | $20,544 |
| Full time order fullfillment | $17,600 | $19,200 | $20,544 |
| Total People | 5 | 5 | 5 |
| Total Payroll | $106,400 | $116,800 | $127,176 |
Financial Plan
The following sections will outline important financial information.
Please note that under the Ratio table, in percentage of sales grouping, there is a bit of discrepancy between Wheelie Deals numbers and the industry average. This is explained by different accounting procedures for expenses.
7.1 Important Assumptions
The following table details important financial assumptions.
| General Assumptions | |||
| Year 1 | Year 2 | Year 3 | |
| Plan Month | 1 | 2 | 3 |
| Current Interest Rate | 10.00% | 10.00% | 10.00% |
| Long-term Interest Rate | 10.00% | 10.00% | 10.00% |
| Tax Rate | 30.00% | 30.00% | 30.00% |
| Other | 0 | 0 | 0 |
7.2 Break-even Analysis
The Break-even Analysis indicates what will be needed in monthly revenue to reach the break-even point.

| Break-even Analysis | |
| Monthly Revenue Break-even | $30,819 |
| Assumptions: | |
| Average Percent Variable Cost | 50% |
| Estimated Monthly Fixed Cost | $15,410 |
7.3 Projected Profit and Loss
The following table will indicate projected profit and loss.


| Pro Forma Profit and Loss | |||
| Year 1 | Year 2 | Year 3 | |
| Sales | $308,944 | $553,506 | $602,999 |
| Direct Cost of Sales | $154,472 | $276,753 | $301,500 |
| Other Production Expenses | $0 | $0 | $0 |
| Total Cost of Sales | $154,472 | $276,753 | $301,500 |
| Gross Margin | $154,472 | $276,753 | $301,500 |
| Gross Margin % | 50.00% | 50.00% | 50.00% |
| Expenses | |||
| Payroll | $106,400 | $116,800 | $127,176 |
| Sales and Marketing and Other Expenses | $2,400 | $2,400 | $2,400 |
| Depreciation | $4,956 | $4,956 | $4,956 |
| Utilities | $3,600 | $3,600 | $3,600 |
| Insurance | $3,600 | $3,600 | $3,600 |
| Rent | $48,000 | $48,000 | $48,000 |
| Payroll Taxes | $15,960 | $17,520 | $19,076 |
| Other | $0 | $0 | $0 |
| Total Operating Expenses | $184,916 | $196,876 | $208,808 |
| Profit Before Interest and Taxes | ($30,444) | $79,877 | $92,691 |
| EBITDA | ($25,488) | $84,833 | $97,647 |
| Interest Expense | $0 | $0 | $0 |
| Taxes Incurred | $0 | $23,963 | $27,807 |
| Net Profit | ($30,444) | $55,914 | $64,884 |
| Net Profit/Sales | -9.85% | 10.10% | 10.76% |
7.4 Projected Cash Flow
The following chart and table will indicate projected cash flow.

| Pro Forma Cash Flow | |||
| Year 1 | Year 2 | Year 3 | |
| Cash Received | |||
| Cash from Operations | |||
| Cash Sales | $308,944 | $553,506 | $602,999 |
| Subtotal Cash from Operations | $308,944 | $553,506 | $602,999 |
| Additional Cash Received | |||
| Sales Tax, VAT, HST/GST Received | $0 | $0 | $0 |
| New Current Borrowing | $0 | $0 | $0 |
| New Other Liabilities (interest-free) | $0 | $0 | $0 |
| New Long-term Liabilities | $0 | $0 | $0 |
| Sales of Other Current Assets | $0 | $0 | $0 |
| Sales of Long-term Assets | $0 | $0 | $0 |
| New Investment Received | $0 | $0 | $0 |
| Subtotal Cash Received | $308,944 | $553,506 | $602,999 |
| Expenditures | Year 1 | Year 2 | Year 3 |
| Expenditures from Operations | |||
| Cash Spending | $106,400 | $116,800 | $127,176 |
| Bill Payments | $214,461 | $380,032 | $407,377 |
| Subtotal Spent on Operations | $320,861 | $496,832 | $534,553 |
| Additional Cash Spent | |||
| Sales Tax, VAT, HST/GST Paid Out | $0 | $0 | $0 |
| Principal Repayment of Current Borrowing | $0 | $0 | $0 |
| Other Liabilities Principal Repayment | $0 | $0 | $0 |
| Long-term Liabilities Principal Repayment | $0 | $0 | $0 |
| Purchase Other Current Assets | $0 | $0 | $0 |
| Purchase Long-term Assets | $0 | $0 | $0 |
| Dividends | $0 | $0 | $0 |
| Subtotal Cash Spent | $320,861 | $496,832 | $534,553 |
| Net Cash Flow | ($11,917) | $56,674 | $68,446 |
| Cash Balance | $17,033 | $73,707 | $142,153 |
7.5 Projected Balance Sheet
The following table will indicate the projected balance sheet.
| Pro Forma Balance Sheet | |||
| Year 1 | Year 2 | Year 3 | |
| Assets | |||
| Current Assets | |||
| Cash | $17,033 | $73,707 | $142,153 |
| Inventory | $18,253 | $32,703 | $35,627 |
| Other Current Assets | $0 | $0 | $0 |
| Total Current Assets | $35,287 | $106,410 | $177,781 |
| Long-term Assets | |||
| Long-term Assets | $24,750 | $24,750 | $24,750 |
| Accumulated Depreciation | $4,956 | $9,912 | $14,868 |
| Total Long-term Assets | $19,794 | $14,838 | $9,882 |
| Total Assets | $55,081 | $121,248 | $187,663 |
| Liabilities and Capital | Year 1 | Year 2 | Year 3 |
| Current Liabilities | |||
| Accounts Payable | $21,824 | $32,078 | $33,609 |
| Current Borrowing | $0 | $0 | $0 |
| Other Current Liabilities | $0 | $0 | $0 |
| Subtotal Current Liabilities | $21,824 | $32,078 | $33,609 |
| Long-term Liabilities | $0 | $0 | $0 |
| Total Liabilities | $21,824 | $32,078 | $33,609 |
| Paid-in Capital | $65,000 | $65,000 | $65,000 |
| Retained Earnings | ($1,300) | ($31,744) | $24,170 |
| Earnings | ($30,444) | $55,914 | $64,884 |
| Total Capital | $33,256 | $89,170 | $154,054 |
| Total Liabilities and Capital | $55,081 | $121,248 | $187,663 |
| Net Worth | $33,256 | $89,170 | $154,054 |
7.6 Business Ratios
The following table outlines some of the more important ratios from the Sporting and Recreational Goods and Supplies Merchant Wholesale industry. The final column, Industry Profile, details specific ratios based on the industry as it is classified by the NAICS code, 423910.
| Ratio Analysis | ||||
| Year 1 | Year 2 | Year 3 | Industry Profile | |
| Sales Growth | 0.00% | 79.16% | 8.94% | 11.50% |
| Percent of Total Assets | ||||
| Inventory | 33.14% | 26.97% | 18.98% | 28.00% |
| Other Current Assets | 0.00% | 0.00% | 0.00% | 29.00% |
| Total Current Assets | 64.06% | 87.76% | 94.73% | 88.70% |
| Long-term Assets | 35.94% | 12.24% | 5.27% | 11.30% |
| Total Assets | 100.00% | 100.00% | 100.00% | 100.00% |
| Current Liabilities | 39.62% | 26.46% | 17.91% | 38.00% |
| Long-term Liabilities | 0.00% | 0.00% | 0.00% | 9.00% |
| Total Liabilities | 39.62% | 26.46% | 17.91% | 47.00% |
| Net Worth | 60.38% | 73.54% | 82.09% | 53.00% |
| Percent of Sales | ||||
| Sales | 100.00% | 100.00% | 100.00% | 100.00% |
| Gross Margin | 50.00% | 50.00% | 50.00% | 23.00% |
| Selling, General & Administrative Expenses | 59.85% | 39.90% | 39.24% | 14.80% |
| Advertising Expenses | 0.39% | 0.22% | 0.20% | 0.70% |
| Profit Before Interest and Taxes | -9.85% | 14.43% | 15.37% | 2.00% |
| Main Ratios | ||||
| Current | 1.62 | 3.32 | 5.29 | 2.19 |
| Quick | 0.78 | 2.30 | 4.23 | 1.22 |
| Total Debt to Total Assets | 39.62% | 26.46% | 17.91% | 47.00% |
| Pre-tax Return on Net Worth | -91.54% | 89.58% | 60.17% | 5.30% |
| Pre-tax Return on Assets | -55.27% | 65.88% | 49.39% | 10.10% |
| Additional Ratios | Year 1 | Year 2 | Year 3 | |
| Net Profit Margin | -9.85% | 10.10% | 10.76% | n.a |
| Return on Equity | -91.54% | 62.70% | 42.12% | n.a |
| Activity Ratios | ||||
| Inventory Turnover | 10.08 | 10.86 | 8.82 | n.a |
| Accounts Payable Turnover | 10.83 | 12.17 | 12.17 | n.a |
| Payment Days | 27 | 25 | 29 | n.a |
| Total Asset Turnover | 5.61 | 4.57 | 3.21 | n.a |
| Debt Ratios | ||||
| Debt to Net Worth | 0.66 | 0.36 | 0.22 | n.a |
| Current Liab. to Liab. | 1.00 | 1.00 | 1.00 | n.a |
| Liquidity Ratios | ||||
| Net Working Capital | $13,462 | $74,332 | $144,172 | n.a |
| Interest Coverage | 0.00 | 0.00 | 0.00 | n.a |
| Additional Ratios | ||||
| Assets to Sales | 0.18 | 0.22 | 0.31 | n.a |
| Current Debt/Total Assets | 40% | 26% | 18% | n.a |
| Acid Test | 0.78 | 2.30 | 4.23 | n.a |
| Sales/Net Worth | 9.29 | 6.21 | 3.91 | n.a |
| Dividend Payout | 0.00 | 0.00 | 0.00 | n.a |
Appendix
| Sales Forecast | |||||||||||||
| Month 1 | Month 2 | Month 3 | Month 4 | Month 5 | Month 6 | Month 7 | Month 8 | Month 9 | Month 10 | Month 11 | Month 12 | ||
| Sales | |||||||||||||
| Independent bicycle shops | 0% | $0 | $3,455 | $8,544 | $12,457 | $15,478 | $17,454 | $18,854 | $25,855 | $22,787 | $21,987 | $20,254 | $20,114 |
| Chain bicycle shops | 0% | $0 | $2,246 | $5,554 | $8,097 | $10,061 | $11,345 | $12,255 | $16,806 | $14,812 | $14,292 | $13,165 | $13,074 |
| Total Sales | $0 | $5,701 | $14,098 | $20,554 | $25,539 | $28,799 | $31,109 | $42,661 | $37,599 | $36,279 | $33,419 | $33,188 | |
| Direct Cost of Sales | Month 1 | Month 2 | Month 3 | Month 4 | Month 5 | Month 6 | Month 7 | Month 8 | Month 9 | Month 10 | Month 11 | Month 12 | |
| Independent bicycle shops | $0 | $1,728 | $4,272 | $6,229 | $7,739 | $8,727 | $9,427 | $12,928 | $11,394 | $10,994 | $10,127 | $10,057 | |
| Chain bicycle shops | $0 | $1,123 | $2,777 | $4,049 | $5,030 | $5,673 | $6,128 | $8,403 | $7,406 | $7,146 | $6,583 | $6,537 | |
| Subtotal Direct Cost of Sales | $0 | $2,850 | $7,049 | $10,277 | $12,769 | $14,400 | $15,555 | $21,330 | $18,799 | $18,139 | $16,710 | $16,594 | |
| Personnel Plan | |||||||||||||
| Month 1 | Month 2 | Month 3 | Month 4 | Month 5 | Month 6 | Month 7 | Month 8 | Month 9 | Month 10 | Month 11 | Month 12 | ||
| Dan | 0% | $3,000 | $3,000 | $3,000 | $3,000 | $3,000 | $3,000 | $3,000 | $3,000 | $3,000 | $3,000 | $3,000 | $3,000 |
| Full time administrative | 0% | $0 | $1,600 | $1,600 | $1,600 | $1,600 | $1,600 | $1,600 | $1,600 | $1,600 | $1,600 | $1,600 | $1,600 |
| Full time sales | 0% | $0 | $1,600 | $1,600 | $1,600 | $1,600 | $1,600 | $1,600 | $1,600 | $1,600 | $1,600 | $1,600 | $1,600 |
| Full time sales | 0% | $0 | $1,600 | $1,600 | $1,600 | $1,600 | $1,600 | $1,600 | $1,600 | $1,600 | $1,600 | $1,600 | $1,600 |
| Full time order fullfillment | 0% | $0 | $1,600 | $1,600 | $1,600 | $1,600 | $1,600 | $1,600 | $1,600 | $1,600 | $1,600 | $1,600 | $1,600 |
| Total People | 1 | 5 | 5 | 5 | 5 | 5 | 5 | 5 | 5 | 5 | 5 | 5 | |
| Total Payroll | $3,000 | $9,400 | $9,400 | $9,400 | $9,400 | $9,400 | $9,400 | $9,400 | $9,400 | $9,400 | $9,400 | $9,400 | |
| General Assumptions | |||||||||||||
| Month 1 | Month 2 | Month 3 | Month 4 | Month 5 | Month 6 | Month 7 | Month 8 | Month 9 | Month 10 | Month 11 | Month 12 | ||
| Plan Month | 1 | 2 | 3 | 4 | 5 | 6 | 7 | 8 | 9 | 10 | 11 | 12 | |
| Current Interest Rate | 10.00% | 10.00% | 10.00% | 10.00% | 10.00% | 10.00% | 10.00% | 10.00% | 10.00% | 10.00% | 10.00% | 10.00% | |
| Long-term Interest Rate | 10.00% | 10.00% | 10.00% | 10.00% | 10.00% | 10.00% | 10.00% | 10.00% | 10.00% | 10.00% | 10.00% | 10.00% | |
| Tax Rate | 30.00% | 30.00% | 30.00% | 30.00% | 30.00% | 30.00% | 30.00% | 30.00% | 30.00% | 30.00% | 30.00% | 30.00% | |
| Other | 0 | 0 | 0 | 0 | 0 | 0 | 0 | 0 | 0 | 0 | 0 | 0 | |
| Pro Forma Profit and Loss | |||||||||||||
| Month 1 | Month 2 | Month 3 | Month 4 | Month 5 | Month 6 | Month 7 | Month 8 | Month 9 | Month 10 | Month 11 | Month 12 | ||
| Sales | $0 | $5,701 | $14,098 | $20,554 | $25,539 | $28,799 | $31,109 | $42,661 | $37,599 | $36,279 | $33,419 | $33,188 | |
| Direct Cost of Sales | $0 | $2,850 | $7,049 | $10,277 | $12,769 | $14,400 | $15,555 | $21,330 | $18,799 | $18,139 | $16,710 | $16,594 | |
| Other Production Expenses | $0 | $0 | $0 | $0 | $0 | $0 | $0 | $0 | $0 | $0 | $0 | $0 | |
| Total Cost of Sales | $0 | $2,850 | $7,049 | $10,277 | $12,769 | $14,400 | $15,555 | $21,330 | $18,799 | $18,139 | $16,710 | $16,594 | |
| Gross Margin | $0 | $2,850 | $7,049 | $10,277 | $12,769 | $14,400 | $15,555 | $21,330 | $18,799 | $18,139 | $16,710 | $16,594 | |
| Gross Margin % | 0.00% | 50.00% | 50.00% | 50.00% | 50.00% | 50.00% | 50.00% | 50.00% | 50.00% | 50.00% | 50.00% | 50.00% | |
| Expenses | |||||||||||||
| Payroll | $3,000 | $9,400 | $9,400 | $9,400 | $9,400 | $9,400 | $9,400 | $9,400 | $9,400 | $9,400 | $9,400 | $9,400 | |
| Sales and Marketing and Other Expenses | $100 | $700 | $100 | $100 | $100 | $100 | $100 | $100 | $100 | $700 | $100 | $100 | |
| Depreciation | $413 | $413 | $413 | $413 | $413 | $413 | $413 | $413 | $413 | $413 | $413 | $413 | |
| Utilities | $300 | $300 | $300 | $300 | $300 | $300 | $300 | $300 | $300 | $300 | $300 | $300 | |
| Insurance | $300 | $300 | $300 | $300 | $300 | $300 | $300 | $300 | $300 | $300 | $300 | $300 | |
| Rent | $4,000 | $4,000 | $4,000 | $4,000 | $4,000 | $4,000 | $4,000 | $4,000 | $4,000 | $4,000 | $4,000 | $4,000 | |
| Payroll Taxes | 15% | $450 | $1,410 | $1,410 | $1,410 | $1,410 | $1,410 | $1,410 | $1,410 | $1,410 | $1,410 | $1,410 | $1,410 |
| Other | $0 | $0 | $0 | $0 | $0 | $0 | $0 | $0 | $0 | $0 | $0 | $0 | |
| Total Operating Expenses | $8,563 | $16,523 | $15,923 | $15,923 | $15,923 | $15,923 | $15,923 | $15,923 | $15,923 | $16,523 | $15,923 | $15,923 | |
| Profit Before Interest and Taxes | ($8,563) | ($13,673) | ($8,874) | ($5,646) | ($3,154) | ($1,523) | ($368) | $5,407 | $2,876 | $1,616 | $787 | $671 | |
| EBITDA | ($8,150) | ($13,260) | ($8,461) | ($5,233) | ($2,741) | ($1,110) | $45 | $5,820 | $3,289 | $2,029 | $1,200 | $1,084 | |
| Interest Expense | $0 | $0 | $0 | $0 | $0 | $0 | $0 | $0 | $0 | $0 | $0 | $0 | |
| Taxes Incurred | $0 | $0 | $0 | $0 | $0 | $0 | $0 | $0 | $0 | $0 | $0 | $0 | |
| Net Profit | ($8,563) | ($13,673) | ($8,874) | ($5,646) | ($3,154) | ($1,523) | ($368) | $5,407 | $2,876 | $1,616 | $787 | $671 | |
| Net Profit/Sales | 0.00% | -239.84% | -62.95% | -27.47% | -12.35% | -5.29% | -1.18% | 12.68% | 7.65% | 4.46% | 2.35% | 2.02% | |
| Pro Forma Cash Flow | |||||||||||||
| Month 1 | Month 2 | Month 3 | Month 4 | Month 5 | Month 6 | Month 7 | Month 8 | Month 9 | Month 10 | Month 11 | Month 12 | ||
| Cash Received | |||||||||||||
| Cash from Operations | |||||||||||||
| Cash Sales | $0 | $5,701 | $14,098 | $20,554 | $25,539 | $28,799 | $31,109 | $42,661 | $37,599 | $36,279 | $33,419 | $33,188 | |
| Subtotal Cash from Operations | $0 | $5,701 | $14,098 | $20,554 | $25,539 | $28,799 | $31,109 | $42,661 | $37,599 | $36,279 | $33,419 | $33,188 | |
| Additional Cash Received | |||||||||||||
| Sales Tax, VAT, HST/GST Received | 0.00% | $0 | $0 | $0 | $0 | $0 | $0 | $0 | $0 | $0 | $0 | $0 | $0 |
| New Current Borrowing | $0 | $0 | $0 | $0 | $0 | $0 | $0 | $0 | $0 | $0 | $0 | $0 | |
| New Other Liabilities (interest-free) | $0 | $0 | $0 | $0 | $0 | $0 | $0 | $0 | $0 | $0 | $0 | $0 | |
| New Long-term Liabilities | $0 | $0 | $0 | $0 | $0 | $0 | $0 | $0 | $0 | $0 | $0 | $0 | |
| Sales of Other Current Assets | $0 | $0 | $0 | $0 | $0 | $0 | $0 | $0 | $0 | $0 | $0 | $0 | |
| Sales of Long-term Assets | $0 | $0 | $0 | $0 | $0 | $0 | $0 | $0 | $0 | $0 | $0 | $0 | |
| New Investment Received | $0 | $0 | $0 | $0 | $0 | $0 | $0 | $0 | $0 | $0 | $0 | $0 | |
| Subtotal Cash Received | $0 | $5,701 | $14,098 | $20,554 | $25,539 | $28,799 | $31,109 | $42,661 | $37,599 | $36,279 | $33,419 | $33,188 | |
| Expenditures | Month 1 | Month 2 | Month 3 | Month 4 | Month 5 | Month 6 | Month 7 | Month 8 | Month 9 | Month 10 | Month 11 | Month 12 | |
| Expenditures from Operations | |||||||||||||
| Cash Spending | $3,000 | $9,400 | $9,400 | $9,400 | $9,400 | $9,400 | $9,400 | $9,400 | $9,400 | $9,400 | $9,400 | $9,400 | |
| Bill Payments | $172 | $5,202 | $6,945 | $13,969 | $19,994 | $21,644 | $22,324 | $23,297 | $33,405 | $22,192 | $24,027 | $21,291 | |
| Subtotal Spent on Operations | $3,172 | $14,602 | $16,345 | $23,369 | $29,394 | $31,044 | $31,724 | $32,697 | $42,805 | $31,592 | $33,427 | $30,691 | |
| Additional Cash Spent | |||||||||||||
| Sales Tax, VAT, HST/GST Paid Out | $0 | $0 | $0 | $0 | $0 | $0 | $0 | $0 | $0 | $0 | $0 | $0 | |
| Principal Repayment of Current Borrowing | $0 | $0 | $0 | $0 | $0 | $0 | $0 | $0 | $0 | $0 | $0 | $0 | |
| Other Liabilities Principal Repayment | $0 | $0 | $0 | $0 | $0 | $0 | $0 | $0 | $0 | $0 | $0 | $0 | |
| Long-term Liabilities Principal Repayment | $0 | $0 | $0 | $0 | $0 | $0 | $0 | $0 | $0 | $0 | $0 | $0 | |
| Purchase Other Current Assets | $0 | $0 | $0 | $0 | $0 | $0 | $0 | $0 | $0 | $0 | $0 | $0 | |
| Purchase Long-term Assets | $0 | $0 | $0 | $0 | $0 | $0 | $0 | $0 | $0 | $0 | $0 | $0 | |
| Dividends | $0 | $0 | $0 | $0 | $0 | $0 | $0 | $0 | $0 | $0 | $0 | $0 | |
| Subtotal Cash Spent | $3,172 | $14,602 | $16,345 | $23,369 | $29,394 | $31,044 | $31,724 | $32,697 | $42,805 | $31,592 | $33,427 | $30,691 | |
| Net Cash Flow | ($3,172) | ($8,901) | ($2,247) | ($2,815) | ($3,855) | ($2,245) | ($615) | $9,964 | ($5,206) | $4,687 | ($8) | $2,497 | |
| Cash Balance | $25,778 | $16,877 | $14,630 | $11,815 | $7,959 | $5,715 | $5,100 | $15,064 | $9,858 | $14,545 | $14,536 | $17,033 | |
| Pro Forma Balance Sheet | |||||||||||||
| Month 1 | Month 2 | Month 3 | Month 4 | Month 5 | Month 6 | Month 7 | Month 8 | Month 9 | Month 10 | Month 11 | Month 12 | ||
| Assets | Starting Balances | ||||||||||||
| Current Assets | |||||||||||||
| Cash | $28,950 | $25,778 | $16,877 | $14,630 | $11,815 | $7,959 | $5,715 | $5,100 | $15,064 | $9,858 | $14,545 | $14,536 | $17,033 |
| Inventory | $10,000 | $10,000 | $7,150 | $7,754 | $11,305 | $14,046 | $15,840 | $17,110 | $23,463 | $20,679 | $19,953 | $18,381 | $18,253 |
| Other Current Assets | $0 | $0 | $0 | $0 | $0 | $0 | $0 | $0 | $0 | $0 | $0 | $0 | $0 |
| Total Current Assets | $38,950 | $35,778 | $24,027 | $22,383 | $23,120 | $22,006 | $21,554 | $22,210 | $38,527 | $30,537 | $34,498 | $32,917 | $35,287 |
| Long-term Assets | |||||||||||||
| Long-term Assets | $24,750 | $24,750 | $24,750 | $24,750 | $24,750 | $24,750 | $24,750 | $24,750 | $24,750 | $24,750 | $24,750 | $24,750 | $24,750 |
| Accumulated Depreciation | $0 | $413 | $826 | $1,239 | $1,652 | $2,065 | $2,478 | $2,891 | $3,304 | $3,717 | $4,130 | $4,543 | $4,956 |
| Total Long-term Assets | $24,750 | $24,337 | $23,924 | $23,511 | $23,098 | $22,685 | $22,272 | $21,859 | $21,446 | $21,033 | $20,620 | $20,207 | $19,794 |
| Total Assets | $63,700 | $60,115 | $47,951 | $45,894 | $46,218 | $44,691 | $43,826 | $44,069 | $59,973 | $51,570 | $55,118 | $53,124 | $55,081 |
| Liabilities and Capital | Month 1 | Month 2 | Month 3 | Month 4 | Month 5 | Month 6 | Month 7 | Month 8 | Month 9 | Month 10 | Month 11 | Month 12 | |
| Current Liabilities | |||||||||||||
| Accounts Payable | $0 | $4,978 | $6,486 | $13,304 | $19,273 | $20,900 | $21,559 | $22,171 | $32,667 | $21,388 | $23,319 | $20,539 | $21,824 |
| Current Borrowing | $0 | $0 | $0 | $0 | $0 | $0 | $0 | $0 | $0 | $0 | $0 | $0 | $0 |
| Other Current Liabilities | $0 | $0 | $0 | $0 | $0 | $0 | $0 | $0 | $0 | $0 | $0 | $0 | $0 |
| Subtotal Current Liabilities | $0 | $4,978 | $6,486 | $13,304 | $19,273 | $20,900 | $21,559 | $22,171 | $32,667 | $21,388 | $23,319 | $20,539 | $21,824 |
| Long-term Liabilities | $0 | $0 | $0 | $0 | $0 | $0 | $0 | $0 | $0 | $0 | $0 | $0 | $0 |
| Total Liabilities | $0 | $4,978 | $6,486 | $13,304 | $19,273 | $20,900 | $21,559 | $22,171 | $32,667 | $21,388 | $23,319 | $20,539 | $21,824 |
| Paid-in Capital | $65,000 | $65,000 | $65,000 | $65,000 | $65,000 | $65,000 | $65,000 | $65,000 | $65,000 | $65,000 | $65,000 | $65,000 | $65,000 |
| Retained Earnings | ($1,300) | ($1,300) | ($1,300) | ($1,300) | ($1,300) | ($1,300) | ($1,300) | ($1,300) | ($1,300) | ($1,300) | ($1,300) | ($1,300) | ($1,300) |
| Earnings | $0 | ($8,563) | ($22,236) | ($31,110) | ($36,756) | ($39,909) | ($41,433) | ($41,801) | ($36,394) | ($33,518) | ($31,901) | ($31,115) | ($30,444) |
| Total Capital | $63,700 | $55,137 | $41,464 | $32,590 | $26,944 | $23,791 | $22,267 | $21,899 | $27,306 | $30,182 | $31,799 | $32,585 | $33,256 |
| Total Liabilities and Capital | $63,700 | $60,115 | $47,951 | $45,894 | $46,218 | $44,691 | $43,826 | $44,069 | $59,973 | $51,570 | $55,118 | $53,124 | $55,081 |
| Net Worth | $63,700 | $55,137 | $41,464 | $32,590 | $26,944 | $23,791 | $22,267 | $21,899 | $27,306 | $30,182 | $31,799 | $32,585 | $33,256 |


