
H2O Industries
Executive Summary
H20 Industries, Inc. (H20 Industries) provides the service of ion exchange portable tanks. This is the process of purifying water for industrial purposes. H20 Industries will take advantage of an unsatisfied market need for segregated resin regeneration on a portable basis. The company will primarily focus its marketing strategies on offering segregated regeneration services to the untapped market of customers who require high-quality regeneration for their deionized (DI) water treatment facilities. The facility that H20 Industries will utilize is located in Newark, California and is already in limited production. Full production will begin at the end of September, with sales growing gradually to near capacity by the end of the first year, with very healthy gross sales in the first year, and increasing in the second and third years.
1.1 Objectives
The primary objectives are:
- To segment the market for portable regeneration service by stressing H20 Industries’s capability at providing segregated regeneration. The goal is to reach monthly sales of 1,710 cu ft of segregated resin by the end of the first year.
- To build up a dealership network of 15 knowledgeable and efficient water service companies who will represent H20 Industries in areas outside direct sales from the factory.
- To set up a bulk regeneration facility with a capacity of 40 cu ft daily, and sell its full capacity in the large general portable exchange service market through its own sales force, and through a dealership network.
1.2 Mission
H20 Industries’s mission is to segment the market for pure water by providing niche products to specialized industry sectors who are otherwise not properly serviced by large pure water suppliers. Segregating a customer’s H20 Industries resin and regenerating it on a portable tank basis to hospital dialysis units is an excellent example of such a niche product that stresses quality and service to users who are prepared to pay a premium price.
1.3 Keys to Success
H20 Industries’s primary keys to success are:
- Good quality control in the factory. Customers for high purity water business have a very low tolerance threshold for flaws.
- Fast response. In the case of most of H20 Industries’s customers, the cost of the water is not a major element in their over-all costs, but a very expensive shut-down could result due to poor or slow servicing.
- High-profile allegiances. Key to over-all company success is connected closely with success in achieving the goal of developing a dealership network of service-oriented water companies.
Company Summary
H20 Industries took over a customer base and a small quantity of assets from a predecessor company. By moving to a new location with more space, and by designing an efficient productive capability, H20 Industries will be ready to aggressively penetrate the growing market for portable DI exchange by October 1999.
2.1 Company Ownership
H20 Industries was established in October 1998 through the purchase of the assets of Commercial Waters Systems, Inc. (CWSI). CWSI was an under-capitalized, cash flow-starved DI exchange tank service provider. Three hundred sixty of the shares of H20 Industries are owned by David R. Smith, vice president sales and applications of PROSYS, a large manufacturer and system designer of water treatment equipment. Five hundred sixty of the shares are owned by John Jones who is regional sales manager for DUFF. The remaining 200 shares are currently held by the daughter of the seller, but are expected to soon be transferred to the new owners.
Additional investors have expressed a willingness to invest. This would help bring in needed administrative expertise, while also increasing the equity base.
2.2 Start-up Summary
Assets of a former operating company were bought out and customers of the former company continue to be serviced by the purchasing company, H20 Industries, partly from continuing operations and partly from farming regeneration work out. However, this plan is being written as a start-up primarily because there are no reliable financial figures for prior years for comparison purposes, and partly because of the move to new facilities and the sizable investment in new plant and equipment involved. Due to certain misrepresentations by the seller, the agreed sales price is under protest. It is expected that the matter will be satisfactorily resolved by payment of a much reduced amount.
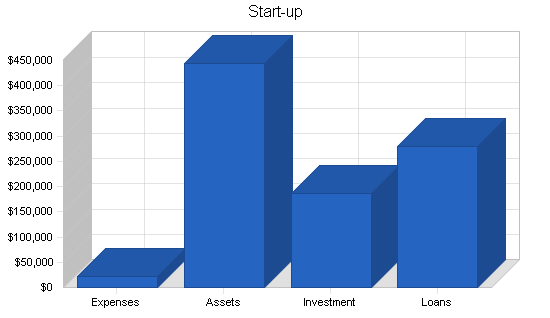
The chart and table below summarize the start-up requirements for H20 Industries.
| Start-up | |
| Requirements | |
| Start-up Expenses | |
| Legal | $10,000 |
| Stationery etc. | $850 |
| Brochures | $6,500 |
| Consultants | $5,000 |
| Insurance | $0 |
| Rent | $0 |
| Research and Development | $0 |
| Expensed Equipment | $0 |
| Other | $0 |
| Total Start-up Expenses | $22,350 |
| Start-up Assets | |
| Cash Required | $124,223 |
| Start-up Inventory | $10,000 |
| Other Current Assets | $90,000 |
| Long-term Assets | $220,000 |
| Total Assets | $444,223 |
| Total Requirements | $466,573 |
| Start-up Funding | |
| Start-up Expenses to Fund | $22,350 |
| Start-up Assets to Fund | $444,223 |
| Total Funding Required | $466,573 |
| Assets | |
| Non-cash Assets from Start-up | $320,000 |
| Cash Requirements from Start-up | $124,223 |
| Additional Cash Raised | $0 |
| Cash Balance on Starting Date | $124,223 |
| Total Assets | $444,223 |
| Liabilities and Capital | |
| Liabilities | |
| Current Borrowing | $21,354 |
| Long-term Liabilities | $180,000 |
| Accounts Payable (Outstanding Bills) | $61,409 |
| Other Current Liabilities (interest-free) | $16,810 |
| Total Liabilities | $279,573 |
| Capital | |
| Planned Investment | |
| Jim Hunt | $56,000 |
| Mike Pacek | $36,000 |
| New Investors | $75,000 |
| Other | $20,000 |
| Additional Investment Requirement | $0 |
| Total Planned Investment | $187,000 |
| Loss at Start-up (Start-up Expenses) | ($22,350) |
| Total Capital | $164,650 |
| Total Capital and Liabilities | $444,223 |
| Total Funding | $466,573 |
2.3 Company Locations and Facilities
The facilities are located in a rented building on an industrial estate in Newark, California.
A description of the technology involved in the production can be found in section 3.5 (Technology). The following is a description of the production layout.
- City water is fed into the building and goes directly to a carbon filter tank to remove organic materials and chlorine.
- A centrifugal pump is installed, in the unlikely event that city water pressure falls below 40 pounds per square inch (psi).
- A hot water boiler is provided to supply hot water (100 degrees F) from part of the incoming city water. This water is needed for anion treatment due to the specific gravity of the caustic material.
- The heated water then passes through a cation and an anion filter tank.
- The deionized hot water goes to the caustic tank where it mixes with the caustic material used to regenerate at the anion pad.
- Part of the unheated incoming city water is deionized by passage through similar cation and anion tanks. These tanks, as well as the tanks deionizing the heated in-coming water, are regenerated automatically at night when production is shut down.
- Water, not H20 Industries, is used at the spent tank staging area to empty the incoming tanks into the separation cones, and more water (H20 Industries) goes to the cation regeneration pad for use in adduction as well as flushing of the regenerate.
- The rinse water, as well as the acid and caustic solutions, now pass into an 8,000-gallon blue tank where, with the help of compressed air for mixing, neutralization takes place to obtain the allowed Ph level.
- A 500-gallon neutralization tank and a 250-gallon polishing tank are provided prior to disposal of the waste water into the city sewer system.
Products and Services
The company is in the water purification business. H20 Industries is engaged in a specific branch of this business called “Service deionization.” Within this branch, the company plans to emphasize a further service specialization known as “segregated regeneration,” as opposed to “bulk regeneration.” This concept is explained in the following sections.
3.1 Product and Service Description
For a simplified explanation of how deionization purifies water please see Section 3.5 (Technology).

The service products offered by H20 Industries are segregated as well as bulk regeneration of portable H20 Industries exchange tanks. The service is offered in three tank sizes of 3.6, 2.5, and 1.4 cubic feet (cu ft). In these sizes, the company will offer:
- Mixed bed (combination of anion and cation regenerated resin)
- Cation regenerated resin
- Anion regenerated resin
- Carbon (used for pre-filtering)
The application of portable deionized water is broad. Practically all industries using water in processing are potential accounts. Size of company is rarely a determining factor. There are applications in electronics and high pressure boilers where flow rates of several hundred gallons per minute are provided by portable exchange systems. The main unique benefits are:
- The client does not have to incur substantial capital costs to install an in-house deionization plant. This could run over $50,000. The company can merely rent the portable tanks (or buy them for approximately $1,200 each) and pay for the regeneration service when the tanks become depleted.
- The company also saves by not needing experienced technicians to maintain an in-house plant.
- Space is another important factor. An in-house H20 Industries capability requires a great deal of space, whereas a portable tank system using flexible hose connections can fit virtually anywhere in minimal space.
- Ease of installation. H20 Industries capability can be arranged virtually in a day and can be easily expanded to accommodate growth.
- There are no chemicals, nor regenerate waste to be handled or concerned with on-site..
- Flexibility in water quality provided. Resin types can be easily changed in tanks if water quality requirements change.
- Even locations that have their own in-house H20 Industries system often use portable DI as a back-up since a shut down can be very expensive.
Providing the service to a customer is simple, usually requiring only minimal equipment. H20 Industries is available from a large competitor, US Filter and a few small competitors, such as Fluid Solutions of Lowell, MA. However, none of the competition can provide segregated regeneration (See Competitive Analysis below).
3.2 Competitive Comparison
In the Northern California area, outside of a small company in Lowell which has to farm out its regeneration business to a “DI” company in Nevada, Simply Clean in Oregon, and a couple of independent Culligan agents, there is only the very large, fully-integrated US Filter (owner of Culligan) to compete with. This company, by virtue of its size and involvement in all fields of water treatment, is not suited to satisfying small users of DI, nor are they able to respond to niche needs. For example, US Filter cannot handle segregated resin. All resin treated by US Filter is regenerated on a bulk basis, which means that various customers’ depleted resin tanks are combined. This is not a problem for many users of DI, but the dialysis department of a hospital might well object to their resin being co-mingled with resin used in the metal plating industry. H20 Industries plans to specialize in portable segregated resin service. US Filter can try to service customers with a desire for segregated DI by promising to always supply tanks with new resin, however, there are technical problems with this.
US Filter’s prices for cation and anion regeneration are $31.25/cu ft and mixed bed $43.05/cu ft. H20 Industries’s prices for the same bulk regeneration are $32 and $43, respectively. The primary market thrust of H20 Industries’s sales will be the segregated regeneration which US Filter does not offer. This product sells at a premium ($57/cu ft and $63/cu ft, respectively). Some small players in the market offer regenerated resin (not segregated) in a price range of $63 to $80 per cu ft (mixed bed).
3.3 Sales Literature
Sales literature will be written and printed. A provision for this has been made in the projected sales and marketing expenses.
3.4 Fulfillment
The service provided by H20 Industries is the regeneration of ion exchange portable tanks. The tanks themselves are supplied to customers on either a monthly rental basis or offered for sale. These tanks, and any other hardware, are readily available from a number of suppliers. By virtue of the owners’ long involvement in the industry, they are fully knowledgeable of existing sources for all hardware, including resin, as well as the supply of the two major chemicals used in the process of regeneration. The only other variable cost of production is the salt used in the brine bath, this is also readily available from a number of suppliers.
3.5 Technology
Ion exchange is a major means of purifying water for industrial purposes. The degree of purity depends on the source of the water and it’s use. Companies, ranging from car washes to the pharmaceutical and semiconductor industries all need various amounts and degrees of purified water. Ion exchange is a chemical process by which ions, or ionic substances that are considered “undesirable” in water, are reduced or removed from water by use of ion exchangers or resins. Most ground water contains unwanted dissolved substances, such as calcium and magnesium, whose molecular structure contain charged ion particles.
The most common impurities with ions of a positive charge are: sodium, calcium, magnesium, potassium, iron, and manganese. These are called cations. The unwanted dissolved substances having negative ion charges, known as anions, are: bicarbonate, chloride, carbonate, sulfate, nitrate, and bisilicate. When a substance separates into ions, each ion is now able to combine with another ion with opposite charge, even if that ion is from a totally different type of molecule. Substances only separate into ions when immersed in water molecules. For example, a molecule of hydrochloric acid is made up of a hydrogen atom and a chloride atom. Hydrochloric acid (HCL), when immersed in water, will split apart into one positively charged hydrogen cation (H+) and one negatively charged chloride anion (CL-). If sodium hydroxide (NaOH) were added to this solution, the NaOH would split into Na+ and OH-, which would combine with the opposite charges of the hydrochloric acid ions to form sodium chloride, better known as “table salt” (Na+CL-) and leftover hydrogen and hydroxide atoms (H+OH-). The field of deionization, known as DI for short, utilizes this natural phenomenon by designing a cation exchange resin which will substitute hydrogen atoms (H+) for virtually all of the other cations, and designing an anion exchange resin which will substitute hydroxyl ions (OH-) for virtually all of the other anions. By means of this process we end up with only H+ and OH- which is equivalent to H2O (water). By forming this demineralized water, we create water which is no longer a conductor. We can measure the purity using an ohm meter. Ohms measure resistance. The higher the ohm count, the lower the conductivity. H20 Industries is routinely formed to 18 mega ohms per centimeter, which is very close to zero conductivity (18.23 at 25 degrees Centigrade). Without giving lengthy chemical explanations, what happens in the process is as follows:
- City tap water is first passed through a carbon filter to remove chlorine, sand, and other unwanted substances. Sometimes, reverse osmosis and ultraviolet light are used to remove non-ionized substances, organic materials, etc., prior to the deionization stage.
- The water then passes into a specially-treated cation resin. This resin takes the form of small beads located inside a tank. The positively charged ions from the unwanted dissolved minerals will attach themselves to the resin. This happens because the resin contains an over-equilibrium abundance of hydrogen ions (H+) which are “bumped off” of the resin beads and replaced by the positively-charged, unwanted, in-coming cation ions. The “bumped off” free hydrogen ions then pair up with anions which are left in the water to form acids.
- The “de-cationized” water then passes to a tank of anion resin to catch the unwanted negatively charged ions that have dissolved in the water. Here, the anions and the anion portions of the acids attached to the hydrogen are attracted to, and held by, the positive sites on the anion exchange resin beads. They do this by kicking off the negative hydroxyl ions that were put on the beads (again in over-abundance). The leftover hydrogen portions of the acids (H+) now join the freed hydroxyl ions (OH-) to form water (H2O).
- If a very high degree of purity is called for, the water will next pass into what is called a “mixed bed” which normally contains resin in a ratio of one part cation resin to two to three parts anion. Steps 1-3 occur again here thus catching the last traces of unwanted ions of the dissolved substances.
- The tanks of resin will continue to purify the water flowing through them until the resin balls expand and their capacity to catch ions is depleted.
- The water flow must stop until the tanks are replaced with tanks containing regenerated resin.
- To regenerate the cation resin, a solution of acid is used to bombard the resin removing all the previously-caught positively-charged ions. Then the tank is flushed to remove any excess acid. The anion resin tank is also given a caustic solution to bombard the previously-caught negative ions. The anion resin is then flushed to remove any residual caustic solution.
- The tanks now contain regenerated resin and the ion exchange process can continue with the tap water turned on.
The regeneration process can take place at the location where the water is being purified, however, most users of H20 Industries do not install the expensive equipment to do this but simply arrange for a service provider, such as H20 Industries, to replace the tanks and perform the regeneration process off-site.
As high-tech industries, such as electronics, communications, and pharmaceuticals, continue to grow, there will almost certainly be increasing use of deionization technology and deionized water. As instrumentation and analysis procedures improve, controlling and monitoring the deionization process will be easier and more efficient, and this will, undoubtedly, help create new uses for deionization that have not yet appeared, as well as make H20 Industries more affordable to sectors now using other methods of purification. As more people in the water treatment industry become familiar with the DI process, the industry for H20 Industries and equipment will benefit.
3.6 Future Products and Services
In addition to bulk and segregated portable H20 Industries, the company plans to expand sales of filters and DI cartridges. These sales have been disregarded in this business plan, but they could become more significant in the future. These products lend themselves to mail order type sales, as they are small and lightweight. Cartridges are disposable items. H20 Industries also has plans to develop a reusable shipping container for its smallest (8″ x 18″) DI exchange tank so that this can also be shipped via UPS. This product will be marketed on a website, as well as through conventional direct mail and yellow page advertising.
In the future, a logical off-shoot of the DI business is reverse osmosis (R/O) used in conjunction with DI exchange tanks. The inclusion of R/O in front of the DI tanks will extend the capacity of an exchange tank by 1000%. This addition to the product line could become a substantial element of total company sales.
Reverse osmosis and electric reversing deionization are beginning to compete with exchange tank DI technology. H20 Industries plans to offer service contracts to maintain this equipment at the customer’s location. This equipment may to either sold or leased.
Market Analysis Summary
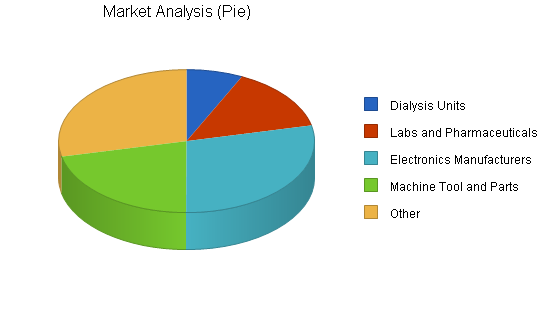
The total market in Northern California for H20 Industries is between 670,000 and 925,000 cu ft of resin annually. H20 Industries’s total productive capacity will be only 36,400 cubic feet, or 3.9-5.4%. Since H20 Industries will have the unique capability of performing segregated regeneration, which is of special interest to the medical industry (dialysis, labs and pharmaceutical), the company will emphasize sales efforts in this segment for high purity H20 Industries. This segment is estimated at 167,000 cu ft annually. Next in terms of marketing emphasis will be the electronic (223,000 cu ft) and machine tool industries.
4.1 Market Segmentation
The market for H20 Industries encompasses many industries, and within them there is a wide range of purity needs. At the low end, a car wash might use H20 Industries in the final rinse only. Their need for purity might be only .5 Megohms (Ohms measure resistance). Water is only a good conductor because of the quantity of dissolved solids in the water. As the ion exchange process lowers the level of total dissolved solids (TDS) the resistance, measured in ohms, increases.
A purity level of .5 Megohms is pure enough for a car wash final rinse cycle, but not even close to pure enough for a electronics wafer manufacturer. They would need 18 Megohms, at which point the water would be pure and incapable of acting as a conductor. Generally speaking, those sectors of the market that need the highest levels of purity are the customers for H20 Industries’s main niche product of segregated DI exchange service. This means that the resin coming back from the customer is never mixed with any other company’s resin. This is a very strong sales feature when dealing with dialysis units of a hospital, labs and pharmaceutical manufacturers, and electronics makers. These customers are happy to pay a premium over the price charged for bulk DI regeneration service because they do not want their resin co-mingled with resin coming from a metal plater or a car wash.
Quantifying the market for segregated portable H20 Industries is not easy. Unlike the market for used cars, metal furniture, or nearly every product one can think of, there are no readily-available statistics on the market for portable DI exchange. There is overwhelming agreement that US Filter has the commanding market share of DI exchange business, opinions range from 85 to 95% majority.
According to the publisher of ULTRAPURE WATER®, (May-June 1999 volume 16, number 5) US Filter had sales of $1 billion in 1990, and has grown to $5 billion in 1999. Portable DI exchange is only a small portion of their business. Sales in Northern California of only DI portable exchange is estimated at $25 million. This has been confirmed from several sources. Firstly, one of the owners of H20 Industries is a former employee of US Filter. In 1996, their DI exchange business reached $12 million. This was only 65% of the market. Then the company acquired Culligan, adding another $8 million in portable DI exchange business in Northern California, and bringing the total to $20 million. It is assumed that sales have grown to $25 million over the past several years.
Based on a recent quotation received by US Filter for a typical portable DI exchange set-up for a 5-gallon per minute customer, the costs come to $590 for a total of 14.4 cu ft of regenerated resin. This amounts to $41 per cubic foot. A sales level of $25 million would translate into 610,000 cubic feet. Assuming that US Filter has as much as 90% of the market, 100% of the market for portable DI exchange in the Northern California states would total approximately 670,000 cu ft annually.
The relationship between input water and DI exchange capacity is charted. Assuming in-coming water quality of 200 parts per million of TDS in the far left column, a 3.6 cu. ft tank of regenerated resin can handle 10,800 gallons. This means that an average user with a flow rate of 10 gallons per minute would use up a 3.6 cu ft tank in 2.57 days, or 1.4 cu ft per day. Assuming the salesman was accurate in his statement of 2,000 customers, this would work out to 840,000 cu ft of regenerated portable DI exchange business per year. This figure is somewhat greater than the figure of 610,000, however, the subject of this business plan, H20 Industries, will have a productive capacity of only 140 cu ft per day, which represents between 4.5% and 6.3% of the total market in Northern California.
Taking the midpoint estimate for the total Northern California market of 780,000 cu ft annually, these high purity users would represent a market 558,000 cu ft
Hospital Dialysis Units and Stand alone Clinics:
California lists 16 stand-alone dialysis clinics, many of whom have multiple locations with varying numbers of stations. Every dialysis clinic, as least in Michigan according to BESCO, use H20 Industries for polishing, after initially running the water through a reverse osmosis system. Hospitals also have dialysis units. In addition, there is blood analysis work which is normally done using “wet” analysis equipment that requires H20 Industries. Assume this sector represents only 10% of the high purity market, or 55,000 cu ft annually.
Labs and pharmaceutical Manufacturers:
A list of labs and pharmaceutical makers in Northern California contains 330 names. A sample calling indicated that some use no pure water, others use such small qualities (10 gals/months) that they buy the water from suppliers like Hubbard-Hall, already made up. Others use so much H20 Industries that they have their own built-in DI system. The rest who have flow rate needs of between one and 20 gallons per minute are in the range most economically serviced by portable DI exchange. Assume this to represent 20% of the 558,000, or 112,000 cu ft.
Electronic Manufacturers:
Semiconductor manufacturers and other makers of electronic components need pure water to flush with. As microprocessors use wafers of ever-decreasing size, the requirements for pure water to rinse with increase, as do various other additional micro filtering. A list of electronics manufacturers in Northern California names 189 makers. Assume this sector represents 40% of 558,000, or 223,000 cu ft.
Machine Tools and Parts:
This is one of the fasting growing sectors as more and more manufacturers conform to the ISO 9000 standard, which requires delivered parts to be clean (defined as rinsed thoroughly with water of one Megohm purity or better). This category includes a need for H20 Industries in machines consuming cutting oil, any machine with cooling systems, and other uses. Assume this sector represents 30% of 558,000, or 167,000 cu ft.
Other:
This sector of the market will represent the market for DI exchange water lower than one Megohm in purity. Assume that the following industries take up the remaining 30% of the total market. Some industries that would be included in this “other” category would be:
- Car washes need H20 Industries for the final rinse
- Food and beverage industry would use it for improving taste and texture of baked goods, cutting and blending alcoholic beverages, dissolving food colors, etc.
- Cosmetics industry needs it for the production of shampoo, liquid soaps, cold creams, hand lotions, nail polish remover, permanent waving solutions, rubbing alcohol, and hydrogen peroxide.
- Electroplating industry utilizes H20 Industries in anodizing, electro-tinning, rinsing, rust proofing, and actual plating with various metals such as nickel, copper, silver, and chromium.
- Ceramics industry requires it to control pH in preparation of slips and glazes, rinsing clay pieces, producing enamel.
- Textile industry uses H20 Industries insteam irons and other steaming equipment, humidification systems, as well as rinsing, dying and bleaching processes.
- Railroad industry for high pressure boilers, cooling systems and storage batteries and for many applications where steam is used)
- Others, such as applications for grinding optical lenses, silvering solutions for mirrors, manufacturers of blueprint paper, manufacturers of ice, humidification of gas supplies to superchargers of high speed aeronautical engines, growing orchids, etc.
The chart and table below summarize the total market potential for the DI exchange services in Northern California.
| Market Analysis | |||||||
| Year 1 | Year 2 | Year 3 | Year 4 | Year 5 | |||
| Potential Customers | Growth | CAGR | |||||
| Dialysis Units | 2% | 55,000 | 56,100 | 57,222 | 58,366 | 59,533 | 2.00% |
| Labs and Pharmaceuticals | 5% | 112,000 | 117,600 | 123,480 | 129,654 | 136,137 | 5.00% |
| Electronics Manufacturers | 0% | 223,000 | 223,000 | 223,000 | 223,000 | 223,000 | 0.00% |
| Machine Tool and Parts | 7% | 167,000 | 178,690 | 191,198 | 204,582 | 218,903 | 7.00% |
| Other | 10% | 222,000 | 244,200 | 268,620 | 295,482 | 325,030 | 10.00% |
| Total | 5.43% | 779,000 | 819,590 | 863,520 | 911,084 | 962,603 | 5.43% |
4.2 Target Market Segment Strategy
The target markets that will receive the most attention will be the sectors which require the highest levels of pure water. This means the 70% of the market that wants quality of one Megohm or better. Within this sector, quantified as 558,000 cu ft annually, H20 Industries will emphasize those users wanting the top echelon of purity (18 Megohms).This sector of the market might be only one third of the 558,000, but even at one third (186,000), it totals more than 300% of H20 Industries’s total capacity, including its bulk portion.
4.2.1 Market Trends
One notable trend in industries is to out-source. Chief financial officers analyze the costs of producing something in-house versus the costs of farming it out. Water purification is no exception. Although many large users of H20 Industries will want to set up their own in-house capacity, the capital costs, the maintenance costs, and the costs of dealing with regenerate waste often make DI portable exchange a more economical solution. Down-sizing within a company with its own pure water manufacturing capability often will lead to a management decision to shut down their in-house plant and switch over to portable service.
Another trend is for more and more industries to need higher degrees of purity in their manufacturing process, which results in an ever-growing market for H20 Industries.
4.2.2 Market Needs
The reasoning behind the attention to the highest purity sector of the market is that H20 Industries is able to provide segregated DI exchange service. A customer’s in-coming tanks for regeneration are tagged, and after regeneration, the same resin is returned to the customer. This specialized service is a major selling feature over US Filter, who must co-mingle customers’ resin in a bulk regenerating facility. Also, bulk regeneration will not achieve the same deionization capacity as H20 Industries’s segregated method which utilizes more chemicals and longer regeneration times. A customer dealing with blood can easily be sold on segregated resin as he would not feel comfortable that his resin would be co-mingled with resin used in a totally different industry.
In addition to the feature mentioned above, H20 Industries will concentrate on those customers who place a premium on response speed and intensity of service. Again, mainly the higher quality users of H20 Industries exchange, where a shut-down would be very expensive, will demand the highest degree of quality available. Segregated exchange service from a smaller supplier is much more likely to satisfy than a huge conglomerate like US Filter where portable exchange can only be done on a bulk batching basis and represents only a small part of their overall business.
4.2.3 Market Growth
The market growth percentages used in the market analysis table were obtained from various articles appearing in ULTRAPURE WATER®, the definitive journal of high-purity water. Specific articles can be located from an index on their website, www.talloaks.com/.
4.3 Service Business Analysis
The industry for providing portable H20 Industries service is dominated by one very large company–US Filter. US Filter controls between 90 to 95% of the H20 Industries service business in Northern California. The company has grown from $1 billion to over $5 billion in the past six years, primarily through an acquisition binge. The company is now finalizing its sale to Vivendi’s Generale des Eaux water subsidiary which will result in combined sales of $12 billion, making it the largest water business in the world. Originally, US Filter’s primary focus was industrial and high purity water. Its acquisitions in other areas include drinking water, waste water, municipal water, and water supply.
Now, less than 20% of its activities relate to technologies and markets connected with high purity water. A much smaller percentage is connected with H20 Industries, and a still-smaller percentage concerned with DI exchange service. After their merger, the percentage will drop even further from 20% to eight percent. This situation has resulted in a growing dissatisfaction with US Filter’s services for H20 Industries exchange. Both owners of this project have been hearing complaints from US Filter customers for quite some time. This is not just a condition evident in Northern California, other sections of the country have noticed it and competitors to US Filter’s DI exchange business have started to grow.
4.3.1 Competition and Buying Patterns
Users of H20 Industries have had little choice in regards to their provider. It is regenerated on a bulk basis only, with no option for segregated regenerated resin (see section on Market Segmentation). Some small customers have obtained the DI exchange service through their local Culligan man or similar water serviceman who in turn obtains it from US Filter. The fact that some small players in the market can capture some of this DI exchange business from US Filter despite a higher price ($63-$80 per cu ft versus $40 per cu ft from US Filter) is a good indication of the importance that service plays in the buying decision. Rarely does the price of H20 Industries represent a significant variable production cost in a manufacturing process. Much more of a factor is worry about quality level and service response time.
4.3.2 Main Competitors
In reaction to the service complaints of customers for US Filter’s DI exchange, a couple of small competitors have sprung up in Northern California. Fluid Solutions in Lowell is one such company. This company has been supplying customers with H20 Industries exchange although they have no regeneration facilities of their own. They merely service the customers and send the tanks to a regeneration facility of another DI exchange company in Pennsylvania.
The prices charged by all local companies to regenerate are between $63 and $80 per cu ft for mixed bed. They charge $20 to $30, depending on tank size, as a monthly rental charge.
The market in Northern California is ripe for growth in competitors to US Filter which does not provide segregated regeneration and whose regenerated resin, on a bulk batch basis, will not serve as high a flow rate as non-bulk regeneration.
4.3.3 Business Participants
Industry participants are varied, as there are several means of obtaining purified water. There are companies which design and engineer reverse osmosis equipment. This equipment has a sizable share of the water market at the end close to the municipal water inlet. Reverse osmosis (R/O), in conjunction with carbon filtering and ultraviolet light, is used (for example in dialysis) to bring the TDS down to a lower level. Ion exchange, either fixed or portable, is then used to polish away the remaining impurities. Other companies may supply e-cell equipment which deionizes electrically. This technology has not advanced sufficiently to compete with traditional H20 Industries but is still occasionally sold in conjunction with a R/O system as the e-cell can only handle small levels of TDS. Some industry participants are primarily engaged in water softening and water filtration for drinking and household purposes. These companies may also utilize green sand to remove iron and magnesium hardness derived from aging municipal piping systems.
In short, there is a full range of industry participants from the local Culligan service representative mainly involved in private households, to large companies involved in engineering, design, consulting, component manufacturing, waste water treatment, etc. With respect to the narrower market for H20 Industries, there are chemical companies who supply (by the gallon) H20 Industries to very small users. There are a few small companies engaged in DI exchange service who do this only as an adjunct to their main business, such as water softening, and who only act as a distributor of DI exchange regeneration facilities located outside of Northern California.
Strategy and Implementation Summary
Besides direct sales effort to large users of H20 Industries, a major element of the company’s marketing efforts will be to develop a distributor network through existing local water service companies. These companies provide local water service to small companies and homes throughout Northern California. Most of their business takes the form of water filtering, water softening, reverse osmosis maintenance, swimming pool service, etc. The best of these will be recruited to add H20 Industries service to their product line.
5.1 Value Proposition
H20 Industries will offer segregated resin regeneration to customers wanting the highest levels of water purity. Segregated regeneration is not offered by any other company in Northern California and indications are, based on present pre-start-up sales, that users of H20 Industries are willing to pay a substantial premium for it. It represents a form of peace of mind which dialysis units, laboratories, etc. feel is important.
The second most important value proposition is service response. When H20 Industries tanks need changing customers insist on, and will receive, an immediate response.
5.2 Competitive Edge
H20 Industries’s ability to segregate a customer’s resin and return it to him regenerated to the maximum limit, should put the company in a strong competitive position.
Approximately all of H20 Industries’s business will be directed at the portable service DI market. This market emphasis should quickly be noticed by users of H20 Industries, who at present rely on US Filter. US Filter’s product range growth through acquisition and buy-outs has de-emphasized the importance of its H20 Industries exchange service.
Hence, the two major aspects of the firm’s competitive advantage would be high quality segregated resin regeneration and fast service response. It will be important to stress these advantages in the sales literature.
5.3 Marketing Strategy
H20 Industries’s marketing strategy will be to execute and communicate its value proposition of service and market segmentation advantage in providing segregated regeneration of customers’ resin.
5.3.1 Distribution Strategy
Wherever H20 Industries cannot economically sell directly, due to distance or quantities, it will utilize a network of water service companies. These companies will be carefully chosen for their quality of service. An arrangement will be set up whereby the distributor will offer DI exchange service along with its other water services. The installations can easily be handled by them. They would tag the tanks and return and pick up from the H20 Industries plant. Being able to offer this service increases the image of the local water service company. It fosters a feeling a one-stop shopping. A 33% discount off the retail price should be adequate to satisfy the distributors.
5.3.2 Positioning Statement
H20 Industries’s ability to regenerate resin on a segregated basis, rather than only bulk, is a capability that should provide quick and easy entry into the user market where the highest water purity is needed. These users, blood analysis, hemodialysis units, and medical laboratories for example, are especially sensitive to contamination risks. Simply pointing out to these users that bulk regeneration involves the co-mingling of their resin with resin used in the metal-finishing and car wash industries usually is quite convincing. Segregated regeneration results in the further advantage of achieving a higher DI capacity per cubic foot as greater quantities of chemicals are used during a longer regeneration period.
The second most important position statement is H20 Industries’s concentration on the DI exchange business. This concentration will force H20 Industries to provide a higher level of service, and more quickly, too. It must be remembered that the cost for H20 Industries in the market for the highest level of water purity is not a significant cost element in the overall cost structure. However, a service shutdown, for quality or for service reasons, would be very costly to high technology users of H20 Industries.
5.3.3 Pricing Strategy
In line with the conclusions drawn in the positioning statements, H20 Industries can charge a higher price for its segregated regenerated resin. There is virtually no competition for this product in the Northern California market.
Charging $63 per cubic foot (mixed bed), as used in the sales projections, is more than a 65% increase over the price for US Filter’s bulk resin price for mixed bed. H20 Industries is currently successfully charging in excess of $70 for this product. It is essential that H20 Industries place a premium price consistent with its superior product.
Wholesale prices have been established to encourage the quick formation of a dealership network. Dealers are afforded a 33% discount.
5.3.4 Promotion Strategy
The main focus of promotion will be two-pronged: promotion to H20 Industries end users, and promotion to wholesalers.
Promotion to wholesalers should receive primary stress due to the extended reach made possible by the wholesaler network with its existing customer base. The sales force of these wholesale distributors needs to be educated on H20 Industries’s positioning statement so that they all understand the important sales advantages of segregated resin. Being able to offer DI exchange service to a distributor’s customer list is a great advantage to the distributor, and this fact needs to be clearly spelled out to them. Therefore, the H20 Industries relationship with a dealership network is one in which both sides benefit.
H20 Industries should strive to create a small-town, friendly relationship with its customers. Company brochures will show a map with all the H20 Industries locations, including each newly acquired distributor. The distributor trucks, as well as H20 Industries vehicles, would carry the H20 Industries logo, helping all to achieve name recognition. Cost savings would result through sharing literature, leads (by territory and/or industry), co-op marketing costs, and the sharing of technical expertise.
Direct marketing to customers within easy reach of H20 Industries should stress service. As a major supplier of resin stated: “US Filter is a huge concern that closes down at 5 P.M. on Friday.” Customers for H20 Industries need to feel that they can get service after hours, and even on a Saturday if need be. These customers feel much more comfortable dealing with an exchange service that is closer in size to the customer, and where the exchange service is an important portion of total sales revenue of the supplier. Prompt deliveries, trouble-free installations, good technical advise, etc. are main building blocks of the promotion strategy.
5.4 Sales Strategy
The sales strategy is to concentrate on that segment of the market most easily captured by the following sales feature: segregated regeneration of portable resin. In addition, the fastest way to reach the sales goal for the first several years is by actively working to develop a dealership network for H20 Industries.
5.4.1 Sales Forecast
Sales Projections:
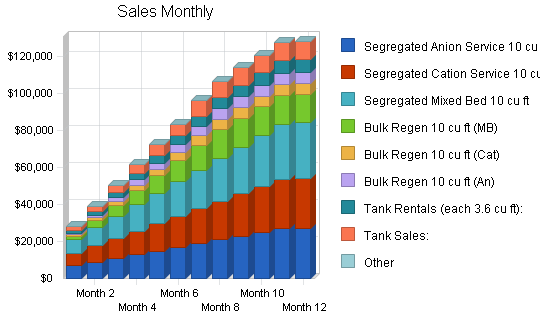
Sales (July 1999) are running at less than 15% capacity monthly, exclusive of rental revenue. This approximates 285 cubic ft per month. The plant capacity will be 100 cu ft per day, on a one-shift basis. Based on the potential market outlined in the Marketing Section of this plan, growth in sales of regenerated segregated resin should reach 433 cu ft per month by October (equals 20 cu ft/day) which is this plan’s starting point, and growing steadily each month until 80 cu ft per day is reached (80% capacity) by the end of the first year. Total production of segregated resin is assumed to be split into equal quantities of anion, cation, and mixed bed.
Once the 80% capacity utilization level is reached (October 2000), unit sales will grow modestly in year two and year three. This growth can be achieved within the capacity limits of 100 cu ft daily (26,000 cu ft per annum) without increases in production labor. Further increases in segregated regeneration would require overtime labor charges. Also, for the projection purposes, direct unit costs for years two and three remain at the level of year one.
The bulk regeneration pad will have a capacity of 20 cu ft and can handle two batches during an eight-hour shift, totaling 40 cu ft/day. We will assume sales for bulk regeneration will grow at the rate of 5 cu ft/day in the first month reaching capacity of 40 cu ft/day after eight months. Sales are split between mixed bed (50%), 25% anion, and 25% cation. Sales of bulk resin will grow 15% each of the first three years. As the bulk regeneration, unlike the segregated regeneration, is not labor intensive, this 15% growth can be achieved without increases in production labor.
In projecting unit prices per ten cu ft. Prices will be assumed at:
- $630/10 cu ft for mixed bed (segregated)
- $570/10 cu ft for anion or cation (segregated)
- $430/10 cu ft for mixed bed (bulk)
- $320/10 cu ft for cation or anion (bulk)
The above prices will be reduced for dealers who will deliver and pick up at the factory to:
- $422/10 cu ft for mixed bed (segregated)
- $382/10 cu ft for anion or cation (segregated)
- $288/10 cu ft for mixed bed (bulk)
- $215/10 cu ft for cation or anion (bulk)
We will assume that 50% of all sales will go through dealers, so the unit price weighted average of the retail and dealer prices will be:
- $526/10 cu ft for mixed bed (segregated)
- $476/10 cu ft for anion or cation (segregated)
- $359/10 cu ft for mixed bed (bulk)
- $267.50/10 cu ft for cation or anion (bulk)
Variable Unit Costs:
The costs connected with one cubic foot of segregated anion treatment involve the cost of:
- City water.
- City sewer disposal.
- Cost of carbon filtering and converting city water to H20 Industries.
- Cost of heating water.
- Cost of Sodium Hydroxide.
- Cost of replacing small amounts of lost resin.
- City water is supplied by Newark, at $2.70 per 100 cu ft, which works out to (7.48 gallons in one cubic foot) $0.0036 per gallon. It requires one gallon per minute for 45 minutes to regenerate one cubic foot of anion, which comes to 45 gallons. The slow rinse needs one gallon/minute for 20 minutes, and the fast rinse needs five gallons/min for 40 minutes. This comes to 220 gallons. Finally, testing takes another 12.5 gallons. Total water consumption per cubic foot of anion resin is 277.5 gallons, or $1.00.
- All water used eventually passes to the sewer which is metered at $2.45 per 100 cubic feet or $0.0032 per gallon. Cost per cubic foot of anion serviced is $0.91.
- Cost of carbon filtering and converting city surface-sourced water to H20 Industries is arrived at by assuming that one cu ft of regenerated resin has the capability of producing sufficient H20 Industries to regenerate five cu ft of spent resin. The costs of regenerating one cu ft of anion resin without H20 Industries costs are approximately $8.96. Dividing this amount by five comes to approximately $1.80 for the H20 Industries per gallon of anion resin serviced.
- Gas to heat incoming city water (average temp 40 degrees) up to 100 degrees goes by a formula (8.34 X number of gallons X temp rise) or 500.4 BTU’s per gallon. 277.5 gallons would need 138,610 BTU’s which, when divided by 104,000 BTU’s per thermal unit, comes to 1.3352 therms. One therm (assume G41 rate class) is billed at $.81 by Essexgas, so 1.3352 therms will cost $1.08.
- Sodium hydroxide is a caustic chemical supplied in a 55-gallon drum containing 50% solution. The regeneration process requires one drum to regenerate 12 anion tanks of each two cu ft. Therefore, one cubic foot of anion requires 2.2917 gallons, or .04167, of a drum. One 55-gallon drum costs $80.50 (Hubbard-Hall Inc.). Cost per cubic foot of anion servicing is $3.35.
Experience indicates that with each regeneration it is necessary to replace approximately two percent of the resin. Anion resin costs $130 per cu ft. Cost is $2.60 per cu ft of anion serviced.
Summary of Anion servicing costs:
- City Water: $1.00
- City Sewer: $0.91
- Carbon filtering and DI: $1.80.
- Gas to heat water: $1.08
- Sodium Hydroxide: $3.35
- Resin replacement: $2.60
Total for anion servicing: $10.74
The costs connected with servicing one cubic foot of segregated cation treatment involve the cost of:
- City water.
- City sewer disposal.
- Cost of carbon filtering and converting city water to H20 Industries.
- Cost of heating water (not needed for cation treatment).
- Cost of Hydrochloric acid.
Cost of replacing small amounts of lost resin.
- City water is supplied by Newark at $2.70 per 100 cubic feet which works out to (7.48 gallons in one cubic foot) $0.0036 per gallon. It requires one gallon per minute for 20 minutes to regenerate one cubic foot of cation, which comes to 20 gallons. The slow rinse needs one gallon/minute for 20 minutes, and the fast rinse needs five gallons/minute for 30 minutes. This comes to 170 gallons. Finally, testing takes another 12.5 gallons. Total water consumption per cubic foot of cation resin is 202.5 gallons, or $0.73.
- All water used eventually passes to the sewer, which is metered at $2.45 per 100 cubic feet, or $0.0032 per gallon. Cost per cubic foot of anion serviced is $0.66.
- Cost of carbon filtering and converting city water to H20 Industries is estimated at $1.46 per cu ft of cation serviced based on experience that one cu ft of regenerated cation resin has the ability to produce enough H20 Industries to regenerate five cu ft of cation resin. ($7.32 divided by five equals $1.46)
- No cost to heat water.
- Hydrochloric acid is supplied in 55-gallon drums containing 30% solution. The regeneration process requires two drums to regenerate 12 tanks of each two cubic feet, using an eight to ten percent solution. Therefore, one cubic foot of cation requires 4.6 gallons or .08363 of a drum. One 55 gallon drum costs $63.70 (Hubbard-Hall Inc.). Cost per cubic foot of anion servicing is $5.33.
Experience indicates that in the process of regeneration about 2% of the resin needs to be replaced. Cation resin costs $30 per cu ft. Cost is $.60 per cu ft of cation serviced.
Summary of Cation servicing costs:
- City Water: $0.73.
- City Sewer: $0.66.
- Carbon filtering and DI: $1.46.
- Gas to heat water: $0.00.
- Hydrochloric acid: $5.33.
- Resin replacement: $0.60.
Total: $8.78 for cation servicing.
Costs of servicing one cubic foot of mixed bed:
A mixed bed tank is more time-consuming as it requires a separation stage prior to regeneration. City water (not DI) is mixed with salt. This solution is used to bathe the anion and cation resin in a cone until the two resins separate, at which point the cation and anion are treated in the regeneration stage in the same manner as the single bed anion and cation. One mixed bed contains twice as much anion as cation. This aspect results in a weighted cost of $10.09 per cu ft Salt consumption: every cubic foot of mixed bed needs 1.5 cu ft of brine solution. There are 7.48 gallons per cu ft This comes to 11 gallons of brine needs. A 22% salt solution in this quantity of water would amount to amount two pounds. Salt is supplied by Hubbard-Hall Inc. at $.095 per pound. Adding the cost of the two pounds of salt to the weighted average cost of $10.09 comes to $10.28.
Total cost of mixed bed serving: $10.28 per cu ft.
- Bulk Regeneration Variable costs:
- Water. According to the spec sheet, 2,459 gallons are needed for 20 cu ft of mixed bed. At $0.0036 per gallon, this comes to $8.87, or $0.444 per cu ft of resin serviced.
- Sewer. Assuming all the water goes down the sewer with a minimal need for balancing chemicals, at $0.0032 per gallon, this comes to $0.4027 per cu ft of resin serviced.
- Per cu ft of mixed bed. $1.39 of acid and $1.10 of caustic soda.
- Salt. $0.07 per cu ft.
- H20 Industries and filtering/softening assume the same costs as in the production of segregated resin (i.e. $1.80 for anion and $1.46 for cation).
- Loss of resin. Assume two percent. At $130 for anion and $30 per cu ft of cation (ratio 2:3 cation to anion), a blended cost of $90 at two percent comes to $1.80 per cu ft.
- Heat for water. 3.2 therm at $.081 divided by 20 cu ft comes to $0.13 per cu ft.
- Total bulk anion: $7.25, or $72.50 for 10 cu ft.
- Total bulk cation $6.14, or $61.40 for 10 cu ft.
- Total bulk mixed bed: $6.95, or $69.50 for 10 cu ft.
Tank Rental Income:
Because of the high costs of purchasing tanks, many new customers opt for renting tanks on a monthly basis. For purposes of these projections we will assume that:
- Dealership-generated sales resulting in tank rentals will be handled by them (i.e. ignored in these projections).
- Half of all directly-generated sales will involve rental tanks (i.e. total unit sales for October amount to 534 cu ft of which half will be dealer-generated. Total direct sales in October = 267 cu ft of which half (133 cu ft) will need rental tanks.
- Assume, for simplification of projections, all rentals will be in 12 inch tanks holding 3.6 cu ft with rental price of $40 per tank. October will see rental income of $1,480 (133 cu ft divided by 3.6 cu ft/tank times $40 rental per tank).
Tank Sales:
It is assumed that those customers who do not opt to rent their tanks will already have their own tanks or will purchase tanks from H20 Industries. Sales of tanks is assumed at only five percent of the number of monthly rental tanks. Sales price is $1,200. Cost equals $450.
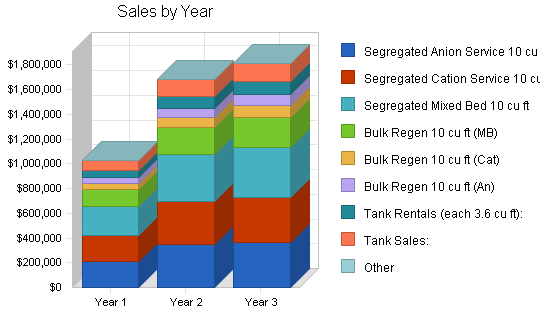
| Sales Forecast | |||
| Year 1 | Year 2 | Year 3 | |
| Unit Sales | |||
| Segregated Anion Service 10 cu ft | 445 | 728 | 764 |
| Segregated Cation Service 10 cu ft | 445 | 728 | 764 |
| Segregated Mixed Bed 10 cu ft | 445 | 728 | 764 |
| Bulk Regen 10 cu ft (MB) | 367 | 598 | 687 |
| Bulk Regen 10 cu ft (Cat) | 183 | 299 | 344 |
| Bulk Regen 10 cu ft (An) | 183 | 299 | 344 |
| Tank Rentals (each 3.6 cu ft): | 1,436 | 2,347 | 2,546 |
| Tank Sales: | 67 | 117 | 127 |
| Other | 0 | 0 | 0 |
| Total Unit Sales | 3,572 | 5,844 | 6,340 |
| Unit Prices | Year 1 | Year 2 | Year 3 |
| Segregated Anion Service 10 cu ft | $476.00 | $476.00 | $476.00 |
| Segregated Cation Service 10 cu ft | $476.00 | $476.00 | $476.00 |
| Segregated Mixed Bed 10 cu ft | $526.00 | $526.00 | $526.00 |
| Bulk Regen 10 cu ft (MB) | $359.00 | $359.00 | $359.00 |
| Bulk Regen 10 cu ft (Cat) | $267.50 | $267.50 | $267.50 |
| Bulk Regen 10 cu ft (An) | $267.50 | $267.50 | $267.50 |
| Tank Rentals (each 3.6 cu ft): | $40.00 | $40.00 | $40.00 |
| Tank Sales: | $1,200.00 | $1,200.00 | $1,200.00 |
| Other | $0.00 | $0.00 | $0.00 |
| Sales | |||
| Segregated Anion Service 10 cu ft | $211,820 | $346,528 | $363,664 |
| Segregated Cation Service 10 cu ft | $211,820 | $346,528 | $363,664 |
| Segregated Mixed Bed 10 cu ft | $234,070 | $382,928 | $401,864 |
| Bulk Regen 10 cu ft (MB) | $131,753 | $214,682 | $246,633 |
| Bulk Regen 10 cu ft (Cat) | $49,080 | $79,983 | $92,020 |
| Bulk Regen 10 cu ft (An) | $49,080 | $79,983 | $92,020 |
| Tank Rentals (each 3.6 cu ft): | $57,440 | $93,880 | $101,840 |
| Tank Sales: | $80,400 | $140,400 | $152,400 |
| Other | $0 | $0 | $0 |
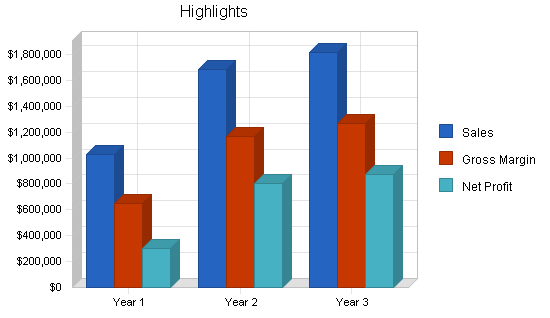
| Total Sales | $1,025,462 | $1,684,911 | $1,814,105 |
| Direct Unit Costs | Year 1 | Year 2 | Year 3 |
| Segregated Anion Service 10 cu ft | $107.40 | $107.40 | $107.40 |
| Segregated Cation Service 10 cu ft | $87.80 | $87.80 | $87.80 |
| Segregated Mixed Bed 10 cu ft | $102.80 | $102.80 | $102.80 |
| Bulk Regen 10 cu ft (MB) | $61.40 | $61.40 | $61.40 |
| Bulk Regen 10 cu ft (Cat) | $69.50 | $69.50 | $69.50 |
| Bulk Regen 10 cu ft (An) | $72.50 | $72.50 | $72.50 |
| Tank Rentals (each 3.6 cu ft): | $0.00 | $0.00 | $0.00 |
| Tank Sales: | $450.00 | $450.00 | $450.00 |
| Other | $0.00 | $0.00 | $0.00 |
| Direct Cost of Sales | |||
| Segregated Anion Service 10 cu ft | $47,793 | $78,187 | $82,054 |
| Segregated Cation Service 10 cu ft | $39,071 | $63,918 | $67,079 |
| Segregated Mixed Bed 10 cu ft | $45,746 | $74,838 | $78,539 |
| Bulk Regen 10 cu ft (MB) | $22,534 | $36,717 | $42,182 |
| Bulk Regen 10 cu ft (Cat) | $12,752 | $20,781 | $23,908 |
| Bulk Regen 10 cu ft (An) | $13,302 | $21,678 | $24,940 |
| Tank Rentals (each 3.6 cu ft): | $0 | $0 | $0 |
| Tank Sales: | $30,150 | $52,650 | $57,150 |
| Other | $0 | $0 | $0 |
| Subtotal Direct Cost of Sales | $211,347 | $348,769 | $375,852 |
5.5 Strategic Alliances
The relationship between dealerships and H20 Industries could be called a strategic alliance. These water service companies have an extensive customer base. Most of the customers have needs such as water softening, filtration, reverse osmosis maintenance, swimming pool maintenance, etc., however, many dealership customers have H20 Industries needs as well. At present, these water service companies must direct their customers to US Filter or supply the customer through US Filter. Forming a relationship between H20 Industries and these dealerships would quickly result in substantial sales increases for H20 Industries and would result in increased prestige and profits for the dealerships.
Management Summary
The management of H20 Industries is made up of individual shareholders with extensive expertise in the water treatment industry, as well as commercial and financial background.
6.1 Management Team
The management team is uniquely qualified to implement this business plan. The founders, John Jones and Dave Smith, have been active in the water treatment industry for years. John’s experience working with dealers in application engineering and sales has prepared him well to present the H20 Industries dealership to water service companies that he already knows. His years of calling on dealerships in all aspects of the water industry have allowed him a birds-eye view of the prevailing marketing and business practices.
Dave has been involved in the manufacturing sector of the water industry and is well respected and connected there. His training and certification as a Professional Engineer give him an advantage when consulting with customers and prospective customers.
The person planned for the position of general manager has wide-ranging experience in finance and manufacturing. He is a former vice president of Chase Manhattan Bank, team leader of a development bank (Saudi Industrial Development Fund), and founder/general manager of a factory which, after 10 years of profitable operations, was bought out in 1989.
The production manager is a chemical engineer by education and professional experience, and has demonstrated his know-how by successfully managing the production activity in the factory despite the challenges presented by the present incomplete production line.
6.2 Personnel Plan
Regeneration Personnel:
A production manager must be a skilled chemical engineer with experience in water treatment applications. This person must be a hands-on individual supervising two assistants. The production manager will label the tanks as they are received to assure customer segregation and supervise the proper regeneration cycle, from separation through backwash, draw, flush, mix, and testing. The assistants will primarily be kept busy moving tanks from one stage in the regeneration cycle to the next, connecting the hosing, performing the chemical mix and draw according to the instructions of the production manager, adding salt to the brine tank, etc. The production manager is in place. One assistant is now in place. A second is needed.
An engineer/fitter is also needed to maintain the equipment and to make installations. This person is in place.
Sales and Marketing Personnel:
It is planned that both owners will continue to maintain their present positions. These sales positions require them to move about the territory which provides an excellent source of knowledge of customers for H20 Industries. This information will be communicated to the sales and marketing manager who will spend his time calling and visiting potential H20 Industries users. He will be paid a base salary plus commissions. The commission will be higher for landing a new customer, and lower for repeat sales. The commission schedule will be constructed in such a way as to permit an annual total compensation that will encourage excellent sales results.
General and Administrative:
An office manager is needed. Answering phones, primary contact with customers, incoming and outgoing mail, etc. He will be the main connection between the owners and the operations of the facility. Within six months, a part-time assistant will need to be added to keep pace with bookkeeping and management.
Delivery Personnel:
One driver, who has additional responsibilities, is now in place. A second will need to be added after approximately four months.
| Personnel Plan | |||
| Year 1 | Year 2 | Year 3 | |
| Production Personnel | |||
| Production Manager | $41,604 | $41,600 | $41,600 |
| Assistant | $20,796 | $20,800 | $20,800 |
| Assistant | $20,796 | $20,800 | $20,800 |
| Engineer/fitter | $31,200 | $31,200 | $31,200 |
| Drivers | $54,198 | $58,400 | $58,400 |
| Other | $0 | $0 | $0 |
| Subtotal | $168,594 | $172,800 | $172,800 |
| Sales and Marketing Personnel | |||
| Sales Manager (base) | $24,000 | $24,000 | $24,000 |
| Sales Manager (commissions) | $38,660 | $51,000 | $60,000 |
| Name or title | $0 | $0 | $0 |
| Other | $0 | $0 | $0 |
| Subtotal | $62,660 | $75,000 | $84,000 |
| General and Administrative Personnel | |||
| Office Manager | $39,996 | $40,000 | $40,000 |
| Bookkeeper (part-time) | $9,100 | $15,600 | $15,600 |
| Name or title | $0 | $0 | $0 |
| Other | $0 | $0 | $0 |
| Subtotal | $49,096 | $55,600 | $55,600 |
| Other Personnel | |||
| Name or Title | $0 | $0 | $0 |
| Name or title | $0 | $0 | $0 |
| Name or title | $0 | $0 | $0 |
| Other | $0 | $0 | $0 |
| Subtotal | $0 | $0 | $0 |
| Total People | 9 | 9 | 9 |
| Total Payroll | $280,350 | $303,400 | $312,400 |
Financial Plan
As of August 1999, stockholder equity stood at $112,000. Additional infusion of equity from new shareholders will boost the equity capital.
To complete the necessary planned additions to plant and equipment, a 5-year term loan will be required from a financial institution. The projected cash-flow is sufficient to repay this loan in quarterly installments. This term loan should be sufficient to cover the increases in accounts receivable, as well as to support growth in inventory of rental tanks.
7.1 Important Assumptions
Tax Rate:
Tax rate reflects the present sliding scale:
- $0 to $50,000 @ 15% Federal, plus 9.5% State tax
- $50 to $75,000 @ 25%
- $75 to $100,000 @ 34%
- $100 to $335,000 @ 39%
- $335,000 and up @ 34%
Inventory Turnover:
Since this is a service business, the only inventory is that of chemicals and some resin, both of which do not need to be stored more than two weeks. Average is one week (inventory turnover rate of 48).
| General Assumptions | |||
| Year 1 | Year 2 | Year 3 | |
| Plan Month | 1 | 2 | 3 |
| Current Interest Rate | 10.00% | 10.00% | 10.00% |
| Long-term Interest Rate | 10.00% | 10.00% | 10.00% |
| Tax Rate | 2.50% | 0.00% | 2.50% |
| Other | 0 | 0 | 0 |
7.2 Break-even Analysis
The following table and chart show the Monthly Units and Monthly Revenue Break-even calculations based on the Average Per-Unit Revenue, Average Per-Unit Variable Costs and the Estimated Monthly Fixed Costs, as drawn from the other financial tables in this plan.
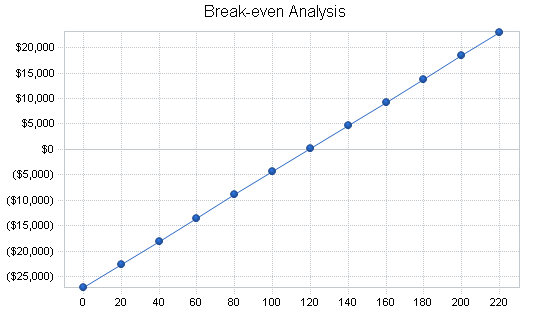
| Break-even Analysis | |
| Monthly Units Break-even | 119 |
| Monthly Revenue Break-even | $34,235 |
| Assumptions: | |
| Average Per-Unit Revenue | $287.08 |
| Average Per-Unit Variable Cost | $59.17 |
| Estimated Monthly Fixed Cost | $27,179 |
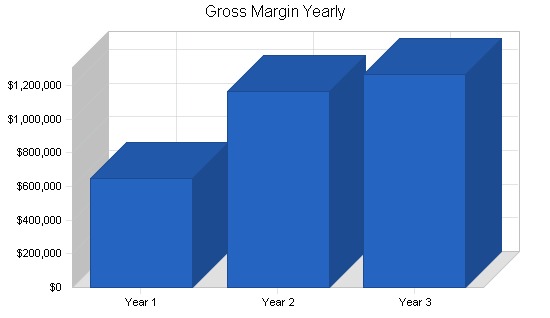
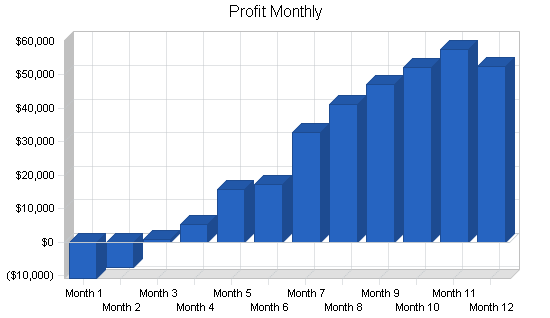
7.3 Projected Profit and Loss
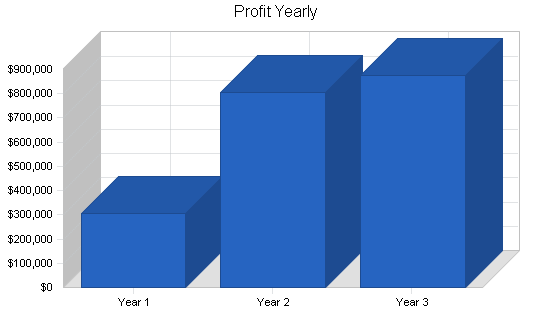
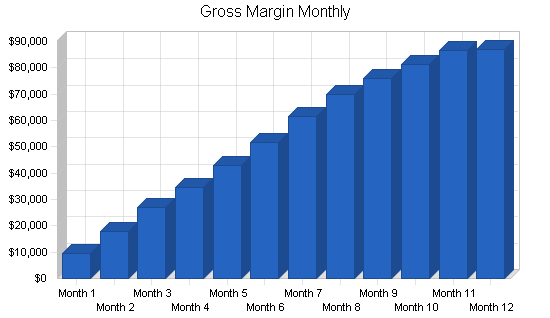
The following table and charts give the yearly projected profit and loss statement for H20 Industries. For a monthly analysis, please see attached appendix.
| Pro Forma Profit and Loss | |||
| Year 1 | Year 2 | Year 3 | |
| Sales | $1,025,462 | $1,684,911 | $1,814,105 |
| Direct Cost of Sales | $211,347 | $348,769 | $375,852 |
| Production Payroll | $168,594 | $172,800 | $172,800 |
| Other | $0 | $0 | $0 |
| Total Cost of Sales | $379,941 | $521,569 | $548,652 |
| Gross Margin | $645,521 | $1,163,342 | $1,265,453 |
| Gross Margin % | 62.95% | 69.04% | 69.76% |
| Operating Expenses | |||
| Sales and Marketing Expenses | |||
| Sales and Marketing Payroll | $62,660 | $75,000 | $84,000 |
| Advertising/Promotion | $16,500 | $12,000 | $12,000 |
| Travel | $3,600 | $6,000 | $6,000 |
| Fuel/oil for Vehicles: | $11,520 | $12,000 | $12,500 |
| Vehicle Repair: | $20,004 | $20,000 | $20,000 |
| Uniforms | $1,200 | $1,200 | $1,200 |
| Miscellaneous | $10,800 | $10,800 | $10,800 |
| Total Sales and Marketing Expenses | $126,284 | $137,000 | $146,500 |
| Sales and Marketing % | 12.31% | 8.13% | 8.08% |
| General and Administrative Expenses | |||
| General and Administrative Payroll | $49,096 | $55,600 | $55,600 |
| Sales and Marketing and Other Expenses | $0 | $0 | $0 |
| Depreciation | $36,000 | $36,000 | $36,000 |
| Leased Equipment | $15,252 | $15,252 | $15,252 |
| Utilities | $2,250 | $2,250 | $2,250 |
| Insurance | $11,796 | $11,800 | $11,800 |
| Business Liab. Insurance: | $12,000 | $12,000 | $12,000 |
| Printing and Postage: | $3,600 | $3,600 | $3,600 |
| Telephone Expenses: | $8,004 | $8,000 | $8,000 |
| Auditing: | $2,400 | $2,400 | $2,400 |
| Rent | $24,000 | $24,000 | $24,000 |
| Payroll Taxes | $35,464 | $38,380 | $39,519 |
| Other General and Administrative Expenses | $0 | $0 | $0 |
| Total General and Administrative Expenses | $199,862 | $209,282 | $210,421 |
| General and Administrative % | 19.49% | 12.42% | 11.60% |
| Other Expenses: | |||
| Other Payroll | $0 | $0 | $0 |
| Consultants | $0 | $0 | $0 |
| Contract/Consultants | $0 | $0 | $0 |
| Total Other Expenses | $0 | $0 | $0 |
| Other % | 0.00% | 0.00% | 0.00% |
| Total Operating Expenses | $326,146 | $346,282 | $356,921 |
| Profit Before Interest and Taxes | $319,375 | $817,060 | $908,533 |
| EBITDA | $355,375 | $853,060 | $944,533 |
| Interest Expense | $19,755 | $12,323 | $9,948 |
| Taxes Incurred | ($4,643) | $0 | $22,465 |
| Net Profit | $304,263 | $804,737 | $876,120 |
| Net Profit/Sales | 29.67% | 47.76% | 48.29% |
7.4 Projected Cash Flow
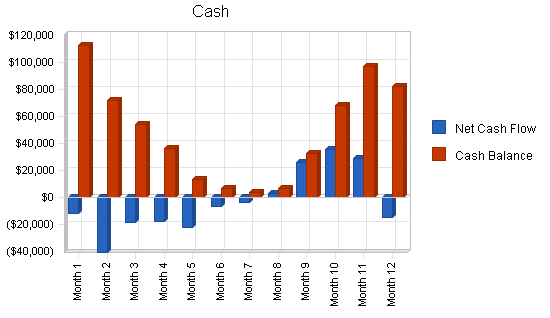
Cash Flow is an intrinsic projection for H20 Industries. We must maintain a suitable cash balance in the bank in order to be successful. The chart and table below outline our basic cash flow assumptions.
| Pro Forma Cash Flow | |||
| Year 1 | Year 2 | Year 3 | |
| Cash Received | |||
| Cash from Operations | |||
| Cash Sales | $0 | $0 | $0 |
| Cash from Receivables | $774,831 | $1,523,736 | $1,782,529 |
| Subtotal Cash from Operations | $774,831 | $1,523,736 | $1,782,529 |
| Additional Cash Received | |||
| Sales Tax, VAT, HST/GST Received | $0 | $0 | $0 |
| New Current Borrowing | $50,000 | $6,250 | $6,250 |
| New Other Liabilities (interest-free) | $0 | $0 | $0 |
| New Long-term Liabilities | $0 | $0 | $0 |
| Sales of Other Current Assets | $50,000 | $0 | $0 |
| Sales of Long-term Assets | $0 | $0 | $0 |
| New Investment Received | $0 | $0 | $0 |
| Subtotal Cash Received | $874,831 | $1,529,986 | $1,788,779 |
| Expenditures | Year 1 | Year 2 | Year 3 |
| Expenditures from Operations | |||
| Cash Spending | $280,350 | $303,400 | $312,400 |
| Bill Payments | $439,684 | $559,027 | $590,514 |
| Subtotal Spent on Operations | $720,034 | $862,427 | $902,914 |
| Additional Cash Spent | |||
| Sales Tax, VAT, HST/GST Paid Out | $0 | $0 | $0 |
| Principal Repayment of Current Borrowing | $56,252 | $0 | $0 |
| Other Liabilities Principal Repayment | $16,810 | $0 | $0 |
| Long-term Liabilities Principal Repayment | $60,000 | $30,000 | $30,000 |
| Purchase Other Current Assets | $63,450 | $10,350 | $9,450 |
| Purchase Long-term Assets | $0 | $0 | $0 |
| Dividends | $0 | $0 | $0 |
| Subtotal Cash Spent | $916,546 | $902,777 | $942,364 |
| Net Cash Flow | ($41,715) | $627,209 | $846,415 |
| Cash Balance | $82,508 | $709,717 | $1,556,132 |
7.5 Projected Balance Sheet
The projected balance sheet for H20 Industries is presented below.
| Pro Forma Balance Sheet | |||
| Year 1 | Year 2 | Year 3 | |
| Assets | |||
| Current Assets | |||
| Cash | $82,508 | $709,717 | $1,556,132 |
| Accounts Receivable | $250,631 | $411,806 | $443,382 |
| Inventory | $28,886 | $47,669 | $51,370 |
| Other Current Assets | $103,450 | $113,800 | $123,250 |
| Total Current Assets | $465,476 | $1,282,992 | $2,174,135 |
| Long-term Assets | |||
| Long-term Assets | $220,000 | $220,000 | $220,000 |
| Accumulated Depreciation | $36,000 | $72,000 | $108,000 |
| Total Long-term Assets | $184,000 | $148,000 | $112,000 |
| Total Assets | $649,476 | $1,430,992 | $2,286,135 |
| Liabilities and Capital | Year 1 | Year 2 | Year 3 |
| Current Liabilities | |||
| Accounts Payable | $45,461 | $45,991 | $48,763 |
| Current Borrowing | $15,102 | $21,352 | $27,602 |
| Other Current Liabilities | $0 | $0 | $0 |
| Subtotal Current Liabilities | $60,563 | $67,343 | $76,365 |
| Long-term Liabilities | $120,000 | $90,000 | $60,000 |
| Total Liabilities | $180,563 | $157,343 | $136,365 |
| Paid-in Capital | $187,000 | $187,000 | $187,000 |
| Retained Earnings | ($22,350) | $281,913 | $1,086,650 |
| Earnings | $304,263 | $804,737 | $876,120 |
| Total Capital | $468,913 | $1,273,650 | $2,149,770 |
| Total Liabilities and Capital | $649,476 | $1,430,992 | $2,286,135 |
| Net Worth | $468,913 | $1,273,650 | $2,149,770 |
7.6 Business Ratios
The following table gives standard business ratios for the water treatment equipment manufacturer industry, as determined by the Standard Industry Classification (SIC) Index code 3589. The last column, Industry Profile, presents specific information and important ratios for this industry.
| Ratio Analysis | ||||
| Year 1 | Year 2 | Year 3 | Industry Profile | |
| Sales Growth | 0.00% | 64.31% | 7.67% | 8.10% |
| Percent of Total Assets | ||||
| Accounts Receivable | 38.59% | 28.78% | 19.39% | 25.10% |
| Inventory | 4.45% | 3.33% | 2.25% | 21.60% |
| Other Current Assets | 15.93% | 7.95% | 5.39% | 25.80% |
| Total Current Assets | 71.67% | 89.66% | 95.10% | 72.50% |
| Long-term Assets | 28.33% | 10.34% | 4.90% | 27.50% |
| Total Assets | 100.00% | 100.00% | 100.00% | 100.00% |
| Current Liabilities | 9.32% | 4.71% | 3.34% | 35.50% |
| Long-term Liabilities | 18.48% | 6.29% | 2.62% | 21.30% |
| Total Liabilities | 27.80% | 11.00% | 5.96% | 56.80% |
| Net Worth | 72.20% | 89.00% | 94.04% | 43.20% |
| Percent of Sales | ||||
| Sales | 100.00% | 100.00% | 100.00% | 100.00% |
| Gross Margin | 62.95% | 69.04% | 69.76% | 32.10% |
| Selling, General & Administrative Expenses | 33.28% | 21.28% | 20.22% | 17.80% |
| Advertising Expenses | 1.61% | 0.71% | 0.66% | 0.90% |
| Profit Before Interest and Taxes | 31.14% | 48.49% | 50.08% | 3.40% |
| Main Ratios | ||||
| Current | 7.69 | 19.05 | 28.47 | 2.12 |
| Quick | 7.21 | 18.34 | 27.80 | 1.20 |
| Total Debt to Total Assets | 27.80% | 11.00% | 5.96% | 56.80% |
| Pre-tax Return on Net Worth | 63.90% | 63.18% | 41.80% | 4.50% |
| Pre-tax Return on Assets | 46.13% | 56.24% | 39.31% | 10.40% |
| Additional Ratios | Year 1 | Year 2 | Year 3 | |
| Net Profit Margin | 29.67% | 47.76% | 48.29% | n.a |
| Return on Equity | 64.89% | 63.18% | 40.75% | n.a |
| Activity Ratios | ||||
| Accounts Receivable Turnover | 4.09 | 4.09 | 4.09 | n.a |
| Collection Days | 56 | 72 | 86 | n.a |
| Inventory Turnover | 10.91 | 9.11 | 7.59 | n.a |
| Accounts Payable Turnover | 9.32 | 12.17 | 12.17 | n.a |
| Payment Days | 31 | 30 | 29 | n.a |
| Total Asset Turnover | 1.58 | 1.18 | 0.79 | n.a |
| Debt Ratios | ||||
| Debt to Net Worth | 0.39 | 0.12 | 0.06 | n.a |
| Current Liab. to Liab. | 0.34 | 0.43 | 0.56 | n.a |
| Liquidity Ratios | ||||
| Net Working Capital | $404,913 | $1,215,650 | $2,097,770 | n.a |
| Interest Coverage | 16.17 | 66.31 | 91.33 | n.a |
| Additional Ratios | ||||
| Assets to Sales | 0.63 | 0.85 | 1.26 | n.a |
| Current Debt/Total Assets | 9% | 5% | 3% | n.a |
| Acid Test | 3.07 | 12.23 | 21.99 | n.a |
| Sales/Net Worth | 2.19 | 1.32 | 0.84 | n.a |
| Dividend Payout | 0.00 | 0.00 | 0.00 | n.a |
Appendix
| Sales Forecast | |||||||||||||
| Month 1 | Month 2 | Month 3 | Month 4 | Month 5 | Month 6 | Month 7 | Month 8 | Month 9 | Month 10 | Month 11 | Month 12 | ||
| Unit Sales | |||||||||||||
| Segregated Anion Service 10 cu ft | 0% | 14 | 19 | 23 | 27 | 31 | 35 | 40 | 44 | 48 | 52 | 56 | 57 |
| Segregated Cation Service 10 cu ft | 0% | 14 | 19 | 23 | 27 | 31 | 35 | 40 | 44 | 48 | 52 | 56 | 57 |
| Segregated Mixed Bed 10 cu ft | 0% | 14 | 19 | 23 | 27 | 31 | 35 | 40 | 44 | 48 | 52 | 56 | 57 |
| Bulk Regen 10 cu ft (MB) | 0% | 5 | 11 | 16 | 22 | 26 | 33 | 38 | 43 | 43 | 43 | 43 | 43 |
| Bulk Regen 10 cu ft (Cat) | 0% | 3 | 5 | 8 | 11 | 13 | 16 | 19 | 22 | 22 | 22 | 22 | 22 |
| Bulk Regen 10 cu ft (An) | 0% | 3 | 5 | 8 | 11 | 13 | 16 | 19 | 22 | 22 | 22 | 22 | 22 |
| Tank Rentals (each 3.6 cu ft): | 0% | 37 | 54 | 70 | 86 | 101 | 118 | 135 | 151 | 160 | 168 | 178 | 178 |
| Tank Sales: | 0% | 2 | 2 | 3 | 4 | 5 | 5 | 7 | 7 | 8 | 8 | 8 | 8 |
| Other | 0% | 0 | 0 | 0 | 0 | 0 | 0 | 0 | 0 | 0 | 0 | 0 | 0 |
| Total Unit Sales | 92 | 133 | 174 | 214 | 251 | 294 | 336 | 376 | 398 | 419 | 442 | 443 | |
| Unit Prices | Month 1 | Month 2 | Month 3 | Month 4 | Month 5 | Month 6 | Month 7 | Month 8 | Month 9 | Month 10 | Month 11 | Month 12 | |
| Segregated Anion Service 10 cu ft | $476.00 | $476.00 | $476.00 | $476.00 | $476.00 | $476.00 | $476.00 | $476.00 | $476.00 | $476.00 | $476.00 | $476.00 | |
| Segregated Cation Service 10 cu ft | $476.00 | $476.00 | $476.00 | $476.00 | $476.00 | $476.00 | $476.00 | $476.00 | $476.00 | $476.00 | $476.00 | $476.00 | |
| Segregated Mixed Bed 10 cu ft | $526.00 | $526.00 | $526.00 | $526.00 | $526.00 | $526.00 | $526.00 | $526.00 | $526.00 | $526.00 | $526.00 | $526.00 | |
| Bulk Regen 10 cu ft (MB) | $359.00 | $359.00 | $359.00 | $359.00 | $359.00 | $359.00 | $359.00 | $359.00 | $359.00 | $359.00 | $359.00 | $359.00 | |
| Bulk Regen 10 cu ft (Cat) | $267.50 | $267.50 | $267.50 | $267.50 | $267.50 | $267.50 | $267.50 | $267.50 | $267.50 | $267.50 | $267.50 | $267.50 | |
| Bulk Regen 10 cu ft (An) | $267.50 | $267.50 | $267.50 | $267.50 | $267.50 | $267.50 | $267.50 | $267.50 | $267.50 | $267.50 | $267.50 | $267.50 | |
| Tank Rentals (each 3.6 cu ft): | $40.00 | $40.00 | $40.00 | $40.00 | $40.00 | $40.00 | $40.00 | $40.00 | $40.00 | $40.00 | $40.00 | $40.00 | |
| Tank Sales: | $1,200.00 | $1,200.00 | $1,200.00 | $1,200.00 | $1,200.00 | $1,200.00 | $1,200.00 | $1,200.00 | $1,200.00 | $1,200.00 | $1,200.00 | $1,200.00 | |
| Other | $0.00 | $0.00 | $0.00 | $0.00 | $0.00 | $0.00 | $0.00 | $0.00 | $0.00 | $0.00 | $0.00 | $0.00 | |
| Sales | |||||||||||||
| Segregated Anion Service 10 cu ft | $6,807 | $8,806 | $10,805 | $12,804 | $14,804 | $16,803 | $18,802 | $20,801 | $22,800 | $24,800 | $26,799 | $26,989 | |
| Segregated Cation Service 10 cu ft | $6,807 | $8,806 | $10,805 | $12,804 | $14,804 | $16,803 | $18,802 | $20,801 | $22,800 | $24,800 | $26,799 | $26,989 | |
| Segregated Mixed Bed 10 cu ft | $7,364 | $9,731 | $11,940 | $14,149 | $16,359 | $18,568 | $20,777 | $22,986 | $25,195 | $27,405 | $29,614 | $29,982 | |
| Bulk Regen 10 cu ft (MB) | $1,939 | $3,877 | $5,834 | $7,772 | $9,334 | $11,668 | $13,606 | $15,545 | $15,545 | $15,545 | $15,545 | $15,545 | |
| Bulk Regen 10 cu ft (Cat) | $722 | $1,445 | $2,173 | $2,889 | $3,478 | $4,347 | $5,069 | $5,791 | $5,791 | $5,791 | $5,791 | $5,791 | |
| Bulk Regen 10 cu ft (An) | $722 | $1,445 | $2,173 | $2,889 | $3,478 | $4,347 | $5,069 | $5,791 | $5,791 | $5,791 | $5,791 | $5,791 | |
| Tank Rentals (each 3.6 cu ft): | $1,480 | $2,160 | $2,800 | $3,440 | $4,040 | $4,720 | $5,400 | $6,040 | $6,400 | $6,720 | $7,120 | $7,120 | |
| Tank Sales: | $2,400 | $2,400 | $3,600 | $4,800 | $6,000 | $6,000 | $8,400 | $8,400 | $9,600 | $9,600 | $9,600 | $9,600 | |
| Other | $0 | $0 | $0 | $0 | $0 | $0 | $0 | $0 | $0 | $0 | $0 | $0 | |
| Total Sales | $28,241 | $38,669 | $50,131 | $61,549 | $72,295 | $83,255 | $95,925 | $106,156 | $113,924 | $120,451 | $127,059 | $127,808 | |
| Direct Unit Costs | Month 1 | Month 2 | Month 3 | Month 4 | Month 5 | Month 6 | Month 7 | Month 8 | Month 9 | Month 10 | Month 11 | Month 12 | |
| Segregated Anion Service 10 cu ft | 0.00% | $107.40 | $107.40 | $107.40 | $107.40 | $107.40 | $107.40 | $107.40 | $107.40 | $107.40 | $107.40 | $107.40 | $107.40 |
| Segregated Cation Service 10 cu ft | 0.00% | $87.80 | $87.80 | $87.80 | $87.80 | $87.80 | $87.80 | $87.80 | $87.80 | $87.80 | $87.80 | $87.80 | $87.80 |
| Segregated Mixed Bed 10 cu ft | 0.00% | $102.80 | $102.80 | $102.80 | $102.80 | $102.80 | $102.80 | $102.80 | $102.80 | $102.80 | $102.80 | $102.80 | $102.80 |
| Bulk Regen 10 cu ft (MB) | 0.00% | $61.40 | $61.40 | $61.40 | $61.40 | $61.40 | $61.40 | $61.40 | $61.40 | $61.40 | $61.40 | $61.40 | $61.40 |
| Bulk Regen 10 cu ft (Cat) | 0.00% | $69.50 | $69.50 | $69.50 | $69.50 | $69.50 | $69.50 | $69.50 | $69.50 | $69.50 | $69.50 | $69.50 | $69.50 |
| Bulk Regen 10 cu ft (An) | 0.00% | $72.50 | $72.50 | $72.50 | $72.50 | $72.50 | $72.50 | $72.50 | $72.50 | $72.50 | $72.50 | $72.50 | $72.50 |
| Tank Rentals (each 3.6 cu ft): | 0.00% | $0.00 | $0.00 | $0.00 | $0.00 | $0.00 | $0.00 | $0.00 | $0.00 | $0.00 | $0.00 | $0.00 | $0.00 |
| Tank Sales: | 0.00% | $450.00 | $450.00 | $450.00 | $450.00 | $450.00 | $450.00 | $450.00 | $450.00 | $450.00 | $450.00 | $450.00 | $450.00 |
| Other | 0.00% | $0.00 | $0.00 | $0.00 | $0.00 | $0.00 | $0.00 | $0.00 | $0.00 | $0.00 | $0.00 | $0.00 | $0.00 |
| Direct Cost of Sales | |||||||||||||
| Segregated Anion Service 10 cu ft | $1,536 | $1,987 | $2,438 | $2,889 | $3,340 | $3,791 | $4,242 | $4,693 | $5,144 | $5,596 | $6,047 | $6,090 | |
| Segregated Cation Service 10 cu ft | $1,256 | $1,624 | $1,993 | $2,362 | $2,731 | $3,099 | $3,468 | $3,837 | $4,206 | $4,574 | $4,943 | $4,978 | |
| Segregated Mixed Bed 10 cu ft | $1,439 | $1,902 | $2,334 | $2,765 | $3,197 | $3,629 | $4,061 | $4,492 | $4,924 | $5,356 | $5,788 | $5,860 | |
| Bulk Regen 10 cu ft (MB) | $332 | $663 | $998 | $1,329 | $1,596 | $1,996 | $2,327 | $2,659 | $2,659 | $2,659 | $2,659 | $2,659 | |
| Bulk Regen 10 cu ft (Cat) | $188 | $375 | $565 | $751 | $904 | $1,129 | $1,317 | $1,505 | $1,505 | $1,505 | $1,505 | $1,505 | |
| Bulk Regen 10 cu ft (An) | $196 | $392 | $589 | $783 | $943 | $1,178 | $1,374 | $1,570 | $1,570 | $1,570 | $1,570 | $1,570 | |
| Tank Rentals (each 3.6 cu ft): | $0 | $0 | $0 | $0 | $0 | $0 | $0 | $0 | $0 | $0 | $0 | $0 | |
| Tank Sales: | $900 | $900 | $1,350 | $1,800 | $2,250 | $2,250 | $3,150 | $3,150 | $3,600 | $3,600 | $3,600 | $3,600 | |
| Other | $0 | $0 | $0 | $0 | $0 | $0 | $0 | $0 | $0 | $0 | $0 | $0 | |
| Subtotal Direct Cost of Sales | $5,846 | $7,843 | $10,266 | $12,679 | $14,960 | $17,072 | $19,939 | $21,906 | $23,607 | $24,859 | $26,110 | $26,260 | |
| Personnel Plan | |||||||||||||
| Month 1 | Month 2 | Month 3 | Month 4 | Month 5 | Month 6 | Month 7 | Month 8 | Month 9 | Month 10 | Month 11 | Month 12 | ||
| Production Personnel | |||||||||||||
| Production Manager | $3,467 | $3,467 | $3,467 | $3,467 | $3,467 | $3,467 | $3,467 | $3,467 | $3,467 | $3,467 | $3,467 | $3,467 | |
| Assistant | $1,733 | $1,733 | $1,733 | $1,733 | $1,733 | $1,733 | $1,733 | $1,733 | $1,733 | $1,733 | $1,733 | $1,733 | |
| Assistant | $1,733 | $1,733 | $1,733 | $1,733 | $1,733 | $1,733 | $1,733 | $1,733 | $1,733 | $1,733 | $1,733 | $1,733 | |
| Engineer/fitter | $2,600 | $2,600 | $2,600 | $2,600 | $2,600 | $2,600 | $2,600 | $2,600 | $2,600 | $2,600 | $2,600 | $2,600 | |
| Drivers | $3,467 | $3,466 | $3,467 | $4,866 | $4,867 | $4,866 | $4,867 | $4,866 | $4,867 | $4,866 | $4,867 | $4,866 | |
| Other | $0 | $0 | $0 | $0 | $0 | $0 | $0 | $0 | $0 | $0 | $0 | $0 | |
| Subtotal | $13,000 | $12,999 | $13,000 | $14,399 | $14,400 | $14,399 | $14,400 | $14,399 | $14,400 | $14,399 | $14,400 | $14,399 | |
| Sales and Marketing Personnel | |||||||||||||
| Sales Manager (base) | $2,000 | $2,000 | $2,000 | $2,000 | $2,000 | $2,000 | $2,000 | $2,000 | $2,000 | $2,000 | $2,000 | $2,000 | |
| Sales Manager (commissions) | $960 | $1,500 | $2,000 | $2,500 | $3,000 | $3,700 | $3,850 | $3,950 | $4,100 | $4,250 | $4,350 | $4,500 | |
| Name or title | $0 | $0 | $0 | $0 | $0 | $0 | $0 | $0 | $0 | $0 | $0 | $0 | |
| Other | $0 | $0 | $0 | $0 | $0 | $0 | $0 | $0 | $0 | $0 | $0 | $0 | |
| Subtotal | $2,960 | $3,500 | $4,000 | $4,500 | $5,000 | $5,700 | $5,850 | $5,950 | $6,100 | $6,250 | $6,350 | $6,500 | |
| General and Administrative Personnel | |||||||||||||
| Office Manager | $3,333 | $3,333 | $3,333 | $3,333 | $3,333 | $3,333 | $3,333 | $3,333 | $3,333 | $3,333 | $3,333 | $3,333 | |
| Bookkeeper (part-time) | $0 | $0 | $0 | $0 | $0 | $1,300 | $1,300 | $1,300 | $1,300 | $1,300 | $1,300 | $1,300 | |
| Name or title | $0 | $0 | $0 | $0 | $0 | $0 | $0 | $0 | $0 | $0 | $0 | $0 | |
| Other | $0 | $0 | $0 | $0 | $0 | $0 | $0 | $0 | $0 | $0 | $0 | $0 | |
| Subtotal | $3,333 | $3,333 | $3,333 | $3,333 | $3,333 | $4,633 | $4,633 | $4,633 | $4,633 | $4,633 | $4,633 | $4,633 | |
| Other Personnel | |||||||||||||
| Name or Title | $0 | $0 | $0 | $0 | $0 | $0 | $0 | $0 | $0 | $0 | $0 | $0 | |
| Name or title | $0 | $0 | $0 | $0 | $0 | $0 | $0 | $0 | $0 | $0 | $0 | $0 | |
| Name or title | $0 | $0 | $0 | $0 | $0 | $0 | $0 | $0 | $0 | $0 | $0 | $0 | |
| Other | $0 | $0 | $0 | $0 | $0 | $0 | $0 | $0 | $0 | $0 | $0 | $0 | |
| Subtotal | $0 | $0 | $0 | $0 | $0 | $0 | $0 | $0 | $0 | $0 | $0 | $0 | |
| Total People | 7 | 7 | 7 | 7 | 8 | 9 | 9 | 9 | 9 | 9 | 9 | 9 | |
| Total Payroll | $19,293 | $19,832 | $20,333 | $22,232 | $22,733 | $24,732 | $24,883 | $24,982 | $25,133 | $25,282 | $25,383 | $25,532 | |
| General Assumptions | |||||||||||||
| Month 1 | Month 2 | Month 3 | Month 4 | Month 5 | Month 6 | Month 7 | Month 8 | Month 9 | Month 10 | Month 11 | Month 12 | ||
| Plan Month | 1 | 2 | 3 | 4 | 5 | 6 | 7 | 8 | 9 | 10 | 11 | 12 | |
| Current Interest Rate | 10.00% | 10.00% | 10.00% | 10.00% | 10.00% | 10.00% | 10.00% | 10.00% | 10.00% | 10.00% | 10.00% | 10.00% | |
| Long-term Interest Rate | 10.00% | 10.00% | 10.00% | 10.00% | 10.00% | 10.00% | 10.00% | 10.00% | 10.00% | 10.00% | 10.00% | 10.00% | |
| Tax Rate | 30.00% | 0.00% | 0.00% | 0.00% | 0.00% | 0.00% | 0.00% | 0.00% | 0.00% | 0.00% | 0.00% | 0.00% | |
| Other | 0 | 0 | 0 | 0 | 0 | 0 | 0 | 0 | 0 | 0 | 0 | 0 | |
| Pro Forma Profit and Loss | |||||||||||||
| Month 1 | Month 2 | Month 3 | Month 4 | Month 5 | Month 6 | Month 7 | Month 8 | Month 9 | Month 10 | Month 11 | Month 12 | ||
| Sales | $28,241 | $38,669 | $50,131 | $61,549 | $72,295 | $83,255 | $95,925 | $106,156 | $113,924 | $120,451 | $127,059 | $127,808 | |
| Direct Cost of Sales | $5,846 | $7,843 | $10,266 | $12,679 | $14,960 | $17,072 | $19,939 | $21,906 | $23,607 | $24,859 | $26,110 | $26,260 | |
| Production Payroll | $13,000 | $12,999 | $13,000 | $14,399 | $14,400 | $14,399 | $14,400 | $14,399 | $14,400 | $14,399 | $14,400 | $14,399 | |
| Other | $0 | $0 | $0 | $0 | $0 | $0 | $0 | $0 | $0 | $0 | $0 | $0 | |
| Total Cost of Sales | $18,846 | $20,842 | $23,266 | $27,078 | $29,360 | $31,471 | $34,339 | $36,305 | $38,007 | $39,258 | $40,510 | $40,659 | |
| Gross Margin | $9,395 | $17,827 | $26,865 | $34,470 | $42,935 | $51,783 | $61,586 | $69,852 | $75,917 | $81,194 | $86,549 | $87,148 | |
| Gross Margin % | 33.27% | 46.10% | 53.59% | 56.01% | 59.39% | 62.20% | 64.20% | 65.80% | 66.64% | 67.41% | 68.12% | 68.19% | |
| Operating Expenses | |||||||||||||
| Sales and Marketing Expenses | |||||||||||||
| Sales and Marketing Payroll | $2,960 | $3,500 | $4,000 | $4,500 | $5,000 | $5,700 | $5,850 | $5,950 | $6,100 | $6,250 | $6,350 | $6,500 | |
| Advertising/Promotion | $1,900 | $1,900 | $1,900 | $1,900 | $1,900 | $1,000 | $1,000 | $1,000 | $1,000 | $1,000 | $1,000 | $1,000 | |
| Travel | $300 | $300 | $300 | $300 | $300 | $300 | $300 | $300 | $300 | $300 | $300 | $300 | |
| Fuel/oil for Vehicles: | $960 | $960 | $960 | $960 | $960 | $960 | $960 | $960 | $960 | $960 | $960 | $960 | |
| Vehicle Repair: | $1,667 | $1,667 | $1,667 | $1,667 | $1,667 | $1,667 | $1,667 | $1,667 | $1,667 | $1,667 | $1,667 | $1,667 | |
| Uniforms | $100 | $100 | $100 | $100 | $100 | $100 | $100 | $100 | $100 | $100 | $100 | $100 | |
| Miscellaneous | $900 | $900 | $900 | $900 | $900 | $900 | $900 | $900 | $900 | $900 | $900 | $900 | |
| Total Sales and Marketing Expenses | $8,787 | $9,327 | $9,827 | $10,327 | $10,827 | $10,627 | $10,777 | $10,877 | $11,027 | $11,177 | $11,277 | $11,427 | |
| Sales and Marketing % | 31.11% | 24.12% | 19.60% | 16.78% | 14.98% | 12.76% | 11.23% | 10.25% | 9.68% | 9.28% | 8.88% | 8.94% | |
| General and Administrative Expenses | |||||||||||||
| General and Administrative Payroll | $3,333 | $3,333 | $3,333 | $3,333 | $3,333 | $4,633 | $4,633 | $4,633 | $4,633 | $4,633 | $4,633 | $4,633 | |
| Sales and Marketing and Other Expenses | $0 | $0 | $0 | $0 | $0 | $0 | $0 | $0 | $0 | $0 | $0 | $0 | |
| Depreciation | $3,000 | $3,000 | $3,000 | $3,000 | $3,000 | $3,000 | $3,000 | $3,000 | $3,000 | $3,000 | $3,000 | $3,000 | |
| Leased Equipment | $1,271 | $1,271 | $1,271 | $1,271 | $1,271 | $1,271 | $1,271 | $1,271 | $1,271 | $1,271 | $1,271 | $1,271 | |
| Utilities | $250 | $250 | $250 | $250 | $250 | $250 | $250 | $100 | $100 | $100 | $100 | $100 | |
| Insurance | $983 | $983 | $983 | $983 | $983 | $983 | $983 | $983 | $983 | $983 | $983 | $983 | |
| Business Liab. Insurance: | $0 | $0 | $0 | $0 | $0 | $6,000 | $0 | $0 | $0 | $0 | $0 | $6,000 | |
| Printing and Postage: | $300 | $300 | $300 | $300 | $300 | $300 | $300 | $300 | $300 | $300 | $300 | $300 | |
| Telephone Expenses: | $667 | $667 | $667 | $667 | $667 | $667 | $667 | $667 | $667 | $667 | $667 | $667 | |
| Auditing: | $0 | $0 | $0 | $2,400 | $0 | $0 | $0 | $0 | $0 | $0 | $0 | $0 | |
| Rent | $2,000 | $2,000 | $2,000 | $2,000 | $2,000 | $2,000 | $2,000 | $2,000 | $2,000 | $2,000 | $2,000 | $2,000 | |
| Payroll Taxes | 13% | $2,441 | $2,509 | $2,572 | $2,812 | $2,876 | $3,129 | $3,148 | $3,160 | $3,179 | $3,198 | $3,211 | $3,230 |
| Other General and Administrative Expenses | $0 | $0 | $0 | $0 | $0 | $0 | $0 | $0 | $0 | $0 | $0 | $0 | |
| Total General and Administrative Expenses | $14,245 | $14,313 | $14,376 | $17,016 | $14,680 | $22,233 | $16,252 | $16,114 | $16,133 | $16,152 | $16,165 | $22,184 | |
| General and Administrative % | 50.44% | 37.01% | 28.68% | 27.65% | 20.31% | 26.70% | 16.94% | 15.18% | 14.16% | 13.41% | 12.72% | 17.36% | |
| Other Expenses: | |||||||||||||
| Other Payroll | $0 | $0 | $0 | $0 | $0 | $0 | $0 | $0 | $0 | $0 | $0 | $0 | |
| Consultants | $0 | $0 | $0 | $0 | $0 | $0 | $0 | $0 | $0 | $0 | $0 | $0 | |
| Contract/Consultants | $0 | $0 | $0 | $0 | $0 | $0 | $0 | $0 | $0 | $0 | $0 | $0 | |
| Total Other Expenses | $0 | $0 | $0 | $0 | $0 | $0 | $0 | $0 | $0 | $0 | $0 | $0 | |
| Other % | 0.00% | 0.00% | 0.00% | 0.00% | 0.00% | 0.00% | 0.00% | 0.00% | 0.00% | 0.00% | 0.00% | 0.00% | |
| Total Operating Expenses | $23,032 | $23,640 | $24,203 | $27,343 | $25,507 | $32,860 | $27,029 | $26,991 | $27,160 | $27,329 | $27,442 | $33,611 | |
| Profit Before Interest and Taxes | ($13,636) | ($5,812) | $2,662 | $7,127 | $17,428 | $18,924 | $34,558 | $42,860 | $48,756 | $53,864 | $59,107 | $53,538 | |
| EBITDA | ($10,636) | ($2,812) | $5,662 | $10,127 | $20,428 | $21,924 | $37,558 | $45,860 | $51,756 | $56,864 | $62,107 | $56,538 | |
| Interest Expense | $1,840 | $1,773 | $1,769 | $1,765 | $1,698 | $1,694 | $1,689 | $1,622 | $1,618 | $1,614 | $1,547 | $1,126 | |
| Taxes Incurred | ($4,643) | $0 | $0 | $0 | $0 | $0 | $0 | $0 | $0 | $0 | $0 | $0 | |
| Net Profit | ($10,834) | ($7,586) | $893 | $5,362 | $15,730 | $17,230 | $32,868 | $41,238 | $47,138 | $52,251 | $57,560 | $52,412 | |
| Net Profit/Sales | -38.36% | -19.62% | 1.78% | 8.71% | 21.76% | 20.70% | 34.26% | 38.85% | 41.38% | 43.38% | 45.30% | 41.01% | |
| Pro Forma Cash Flow | |||||||||||||
| Month 1 | Month 2 | Month 3 | Month 4 | Month 5 | Month 6 | Month 7 | Month 8 | Month 9 | Month 10 | Month 11 | Month 12 | ||
| Cash Received | |||||||||||||
| Cash from Operations | |||||||||||||
| Cash Sales | $0 | $0 | $0 | $0 | $0 | $0 | $0 | $0 | $0 | $0 | $0 | $0 | |
| Cash from Receivables | $0 | $941 | $28,588 | $39,051 | $50,512 | $61,907 | $72,660 | $83,677 | $96,266 | $106,415 | $114,141 | $120,672 | |
| Subtotal Cash from Operations | $0 | $941 | $28,588 | $39,051 | $50,512 | $61,907 | $72,660 | $83,677 | $96,266 | $106,415 | $114,141 | $120,672 | |
| Additional Cash Received | |||||||||||||
| Sales Tax, VAT, HST/GST Received | 0.00% | $0 | $0 | $0 | $0 | $0 | $0 | $0 | $0 | $0 | $0 | $0 | $0 |
| New Current Borrowing | $50,000 | $0 | $0 | $0 | $0 | $0 | $0 | $0 | $0 | $0 | $0 | $0 | |
| New Other Liabilities (interest-free) | $0 | $0 | $0 | $0 | $0 | $0 | $0 | $0 | $0 | $0 | $0 | $0 | |
| New Long-term Liabilities | $0 | $0 | $0 | $0 | $0 | $0 | $0 | $0 | $0 | $0 | $0 | $0 | |
| Sales of Other Current Assets | $50,000 | $0 | $0 | $0 | $0 | $0 | $0 | $0 | $0 | $0 | $0 | $0 | |
| Sales of Long-term Assets | $0 | $0 | $0 | $0 | $0 | $0 | $0 | $0 | $0 | $0 | $0 | $0 | |
| New Investment Received | $0 | $0 | $0 | $0 | $0 | $0 | $0 | $0 | $0 | $0 | $0 | $0 | |
| Subtotal Cash Received | $100,000 | $941 | $28,588 | $39,051 | $50,512 | $61,907 | $72,660 | $83,677 | $96,266 | $106,415 | $114,141 | $120,672 | |
| Expenditures | Month 1 | Month 2 | Month 3 | Month 4 | Month 5 | Month 6 | Month 7 | Month 8 | Month 9 | Month 10 | Month 11 | Month 12 | |
| Expenditures from Operations | |||||||||||||
| Cash Spending | $19,293 | $19,832 | $20,333 | $22,232 | $22,733 | $24,732 | $24,883 | $24,982 | $25,133 | $25,282 | $25,383 | $25,532 | |
| Bill Payments | $61,849 | $13,625 | $25,719 | $28,739 | $33,600 | $33,584 | $40,540 | $38,353 | $39,147 | $40,550 | $41,335 | $42,644 | |
| Subtotal Spent on Operations | $81,142 | $33,457 | $46,052 | $50,971 | $56,333 | $58,316 | $65,423 | $63,335 | $64,280 | $65,832 | $66,718 | $68,176 | |
| Additional Cash Spent | |||||||||||||
| Sales Tax, VAT, HST/GST Paid Out | $0 | $0 | $0 | $0 | $0 | $0 | $0 | $0 | $0 | $0 | $0 | $0 | |
| Principal Repayment of Current Borrowing | $521 | $521 | $521 | $521 | $521 | $521 | $521 | $521 | $521 | $521 | $521 | $50,521 | |
| Other Liabilities Principal Repayment | $0 | $0 | $0 | $0 | $0 | $0 | $0 | $0 | $0 | $0 | $0 | $16,810 | |
| Long-term Liabilities Principal Repayment | $30,000 | $7,500 | $0 | $0 | $7,500 | $0 | $0 | $7,500 | $0 | $0 | $7,500 | $0 | |
| Purchase Other Current Assets | $0 | $0 | $0 | $5,400 | $8,550 | $9,900 | $9,900 | $9,450 | $5,400 | $4,500 | $10,350 | $0 | |
| Purchase Long-term Assets | $0 | $0 | $0 | $0 | $0 | $0 | $0 | $0 | $0 | $0 | $0 | $0 | |
| Dividends | $0 | $0 | $0 | $0 | $0 | $0 | $0 | $0 | $0 | $0 | $0 | $0 | |
| Subtotal Cash Spent | $111,663 | $41,478 | $46,573 | $56,892 | $72,904 | $68,737 | $75,844 | $80,806 | $70,201 | $70,853 | $85,089 | $135,507 | |
| Net Cash Flow | ($11,663) | ($40,537) | ($17,984) | ($17,840) | ($22,392) | ($6,830) | ($3,184) | $2,871 | $26,066 | $35,562 | $29,052 | ($14,836) | |
| Cash Balance | $112,560 | $72,023 | $54,039 | $36,198 | $13,806 | $6,977 | $3,793 | $6,664 | $32,730 | $68,292 | $97,344 | $82,508 | |
| Pro Forma Balance Sheet | |||||||||||||
| Month 1 | Month 2 | Month 3 | Month 4 | Month 5 | Month 6 | Month 7 | Month 8 | Month 9 | Month 10 | Month 11 | Month 12 | ||
| Assets | Starting Balances | ||||||||||||
| Current Assets | |||||||||||||
| Cash | $124,223 | $112,560 | $72,023 | $54,039 | $36,198 | $13,806 | $6,977 | $3,793 | $6,664 | $32,730 | $68,292 | $97,344 | $82,508 |
| Accounts Receivable | $0 | $28,241 | $65,969 | $87,511 | $110,009 | $131,792 | $153,140 | $176,405 | $198,884 | $216,541 | $230,577 | $243,495 | $250,631 |
| Inventory | $10,000 | $6,430 | $8,627 | $11,293 | $13,947 | $16,456 | $18,780 | $21,933 | $24,096 | $25,968 | $27,345 | $28,721 | $28,886 |
| Other Current Assets | $90,000 | $40,000 | $40,000 | $40,000 | $45,400 | $53,950 | $63,850 | $73,750 | $83,200 | $88,600 | $93,100 | $103,450 | $103,450 |
| Total Current Assets | $224,223 | $187,230 | $186,619 | $192,843 | $205,554 | $216,004 | $242,746 | $275,881 | $312,844 | $363,839 | $419,314 | $473,010 | $465,476 |
| Long-term Assets | |||||||||||||
| Long-term Assets | $220,000 | $220,000 | $220,000 | $220,000 | $220,000 | $220,000 | $220,000 | $220,000 | $220,000 | $220,000 | $220,000 | $220,000 | $220,000 |
| Accumulated Depreciation | $0 | $3,000 | $6,000 | $9,000 | $12,000 | $15,000 | $18,000 | $21,000 | $24,000 | $27,000 | $30,000 | $33,000 | $36,000 |
| Total Long-term Assets | $220,000 | $217,000 | $214,000 | $211,000 | $208,000 | $205,000 | $202,000 | $199,000 | $196,000 | $193,000 | $190,000 | $187,000 | $184,000 |
| Total Assets | $444,223 | $404,230 | $400,619 | $403,843 | $413,554 | $421,004 | $444,746 | $474,881 | $508,844 | $556,839 | $609,314 | $660,010 | $649,476 |
| Liabilities and Capital | Month 1 | Month 2 | Month 3 | Month 4 | Month 5 | Month 6 | Month 7 | Month 8 | Month 9 | Month 10 | Month 11 | Month 12 | |
| Current Liabilities | |||||||||||||
| Accounts Payable | $61,409 | $12,771 | $24,766 | $27,618 | $32,488 | $32,230 | $39,262 | $37,050 | $37,796 | $39,173 | $39,919 | $41,076 | $45,461 |
| Current Borrowing | $21,354 | $70,833 | $70,312 | $69,791 | $69,270 | $68,749 | $68,228 | $67,707 | $67,186 | $66,665 | $66,144 | $65,623 | $15,102 |
| Other Current Liabilities | $16,810 | $16,810 | $16,810 | $16,810 | $16,810 | $16,810 | $16,810 | $16,810 | $16,810 | $16,810 | $16,810 | $16,810 | $0 |
| Subtotal Current Liabilities | $99,573 | $100,414 | $111,888 | $114,219 | $118,568 | $117,789 | $124,300 | $121,567 | $121,792 | $122,648 | $122,873 | $123,509 | $60,563 |
| Long-term Liabilities | $180,000 | $150,000 | $142,500 | $142,500 | $142,500 | $135,000 | $135,000 | $135,000 | $127,500 | $127,500 | $127,500 | $120,000 | $120,000 |
| Total Liabilities | $279,573 | $250,414 | $254,388 | $256,719 | $261,068 | $252,789 | $259,300 | $256,567 | $249,292 | $250,148 | $250,373 | $243,509 | $180,563 |
| Paid-in Capital | $187,000 | $187,000 | $187,000 | $187,000 | $187,000 | $187,000 | $187,000 | $187,000 | $187,000 | $187,000 | $187,000 | $187,000 | $187,000 |
| Retained Earnings | ($22,350) | ($22,350) | ($22,350) | ($22,350) | ($22,350) | ($22,350) | ($22,350) | ($22,350) | ($22,350) | ($22,350) | ($22,350) | ($22,350) | ($22,350) |
| Earnings | $0 | ($10,834) | ($18,420) | ($17,527) | ($12,164) | $3,566 | $20,796 | $53,664 | $94,902 | $142,040 | $194,291 | $251,851 | $304,263 |
| Total Capital | $164,650 | $153,816 | $146,230 | $147,123 | $152,486 | $168,216 | $185,446 | $218,314 | $259,552 | $306,690 | $358,941 | $416,501 | $468,913 |
| Total Liabilities and Capital | $444,223 | $404,230 | $400,619 | $403,843 | $413,554 | $421,004 | $444,746 | $474,881 | $508,844 | $556,839 | $609,314 | $660,010 | $649,476 |
| Net Worth | $164,650 | $153,816 | $146,230 | $147,123 | $152,486 | $168,216 | $185,446 | $218,314 | $259,552 | $306,690 | $358,941 | $416,501 | $468,913 |


