
Evergreen TV Productions
Executive Summary
EvergreenTV Productions, Inc. is a multi-faceted company, with the potential to branch into new venues as the company grows. There are currently three phases to development, beginning with our home division. By developing this division to include three stores in the Tampa/St. Petersburg area, we can generate enough revenue to assist in the growth of two other divisions; tour and travel, and the business to business division. However, we will need additional funding to accomplish this plan.
The Home Division produces digital video scrapbooks by digitizing customers’ photos, setting them to music, and using selected digital effects to create the video memory. Our operations manual is a business system designed to produce the maximum number of videos per week while maintaining a rigid standard for quality. Using this system, and following this video production business plan, we will generate the revenue needed to allow us flexibility in accepting other projects more commonly associated with a production company, leading into the next division.
The Tour and Travel Division provides specialized production on a wide range of hand-picked projects, depending upon the client’s needs. This division creates videos of local interest for play in doctors offices’ waiting rooms, videos to promote area businesses, and tour/travel videos for tour companies. We will develop this division into a self-sufficient branch within the first year.
The Business to Business (B2B) Division markets the news stories of college and university communications students, and provides a resume posting service for said students. Those stories are sold to small market tv stations nationwide. This division is the heart of EvergreenTV Productions, and the reason for incorporation. After seven months of development, our website is complete. We are ready to revolutionize television news programming. Selecting only the best, we gather an impressive selection of “timeless” news stories produced by college and university students. Market research shows that nearly every day, small market tv stations need “filler” news, either local, regional or national, to complete their newscasts. Many subscribe to costly services, with little choice for story selection. EvergreenTV Productions will provide them with quality news stories, “filler news” which these stations can use for any time, any day, any cast. This division of EvergreenTV Productions is meeting two needs. First, those of students anxious to get professional experience and an introduction into the tv news industry. By promoting their news stories and publishing their resumes on our website, we’re helping them get that first foot in the door. Secondly, the needs of small market tv stations which cannot afford to budget tens of thousands of dollars for news programming.
Objectives
Short Term:
- Open two stores in the Tampa/St. Petersburg area by the beginning of year two. Each store will follow a business system designed to operate at maximum efficiency while maintaining the highest standards of quality, as per a franchise.
- Produce an hour-long video of points of interest with the Tampa/St. Petersburg area to sell to doctor’s offices in the area by the end of month six. Revenue generated by tape sales will be used to support travel and expenses to meet goal three.
- Generate an inventory of 15 stories for the business to business division by the end of month six, and 50 stories by the end of month nine.
- Obtain 30 sales to small market tv stations by the end of year one.
Long Term:
- B2B Division sales increasing to XX by the third year.
- Build B2B news stories inventory to a minimum of 300 stories by the third year.
- Open two home division stores per year in various markets throughout state. i.e., Naples, Miami, Orlando, Jacksonville, Pensacola. Each store following our business system to maintain consistency and product control.
- Maintain a profit, to reinvest into business and further expansion.
Keys to Success
Home Division:
- Product quality. Begins with a complete customer’s understanding of the process. Customers should be comfortable turning over their treasured photos for production, and should be completely satisfied with the end product.
- Implementation of business system. Every employee should be fully trained and able to assist other employees in the goals and objectives as defined within the business system. This ensures that the first key to success is achieved.
- Marketing. Initial market saturation within key customer demographics is essential, followed by an extensive referral program, as outlined in the business system guidelines. Presentations to select demographics, such as retirement villas and professional photographers is vital. Building alliances and co-promotions programs with like businesses (such as wedding photographers, disc jockeys, travel agencies and photo processing centers) is key to further growth.
Tour and Travel Division:
- Product quality/customer satisfaction. All productions must meet the complete satisfaction of the client, regardless of genre. Employees must be trained to anticipate client’s needs and company’s ability to meet these needs. No project is too small to ignore the importance of quality and customer satisfaction.
- Development of referral program. This division will not actively seek projects, but will respond to the needs of referral clients. A well-defined web of referrals will contribute to the consistency of client’s expectations and this division’s output.
Business to Business Division:
- Product quality. Extensive review of each story submitted. Guidelines sent to communications professors to encourage the development of these stories.
- Marketing. Consistent, repetitious and personal contacting of colleges, universities, technical schools, as well as tv stations in the bottom 115 Nielsen markets. Fresh news releases notifying students and stations of upcoming stories. Faxes, newsletter mail-ins, and a constantly updated website promoting the students and product.
- Management. On-time product delivery. Budgets under control. Legal and accounting advice concerning new development or budgeting, such as QuickBooks instruction and copyright/trademark requirements.
Mission
“In the factory Revlon manufactures cosmetics, but in the store Revlon sells hope.” Charles Revson, founder of Revlon.
While EvergreenTV Productions, Inc. operates as a production company, it sells personal memories, opportunities and trust.
The home division creates video scrapbooks set to music, but sells memories and quality service. Customers must trust that we cherish their photos and will produce every video as if for our own families. Our employees must feel equal to the standards expected of them, and feel free to contribute new ideas to improve upon our business model. Employees are also our internal customers, and should be treated with the same respect given to customers who walk through the door.
The tour and travel division maintains an open mind to new video projects, so the client understands that his goal is our objective. While we will suggest alternatives and bring our experience to the table, we hold the client’s goal as the primary target. If we cannot achieve our client’s goal, we will present that information in our initial encounter and suggest other possible production means, rather than altering the project to our comfort level.
The business to business division of EvergreenTV Productions, Inc. understands the frustrations and needs of small market tv news, and the desire of broadcast students to become part of the tv news environment. Using skills developed in tv newsrooms, EvergreenTV Productions provides a service and a product which match the quality and expectations of tv news directors. It makes professional experience accessible to hundreds of broadcast students every year. It unites students with stations, according to industry quality standards. While keeping these standards high, it makes a profit and generates cash. It provides a personal service and guidance system to students. It provides a professional service and an affordable programming opportunity to stations. And EvergreenTV Productions constantly searches for innovative news programming ideas to take this company to the next level, while loyally serving its clients in every possible capacity.


Company Summary
EvergreenTV Productions is a multi-faceted production company operating on three basic levels.
The Home Division of EvergreenTV Productions is centered around one product. Using the most advanced, all-digital editing equipment, our company turns standard photos into video “scrapbooks” of various length and style, all set to selected music backgrounds. Customers are given a free consultation to review the process, help in selecting needed music, and given an explanation of each of the four packages of videos from which they may choose. Each package is a detailed rate plan, with varying costs. By using this free consultation, customers are assured a unique and personalized video.
The Tour and Travel Division handles various projects which may present themselves to our production company. This division is not primarily a revenue generator, but is vital to the growth of the company. Projects will be hand picked based upon a referral system. By minimizing the number of projects, we control quality and reputation as a production company which specializes, rather than an all-encompassing production facility which forsakes quality for quantity of projects. This division is responsible every quarter for producing a new hour long video of areas of interest around Tampa Bay.
The Business to Business Division (B2B) is the heart and soul of EvergreenTV Productions, the center of the vision for which the company began. It is a marketing service for college and university students of broadcasting, and a news programming service for small market tv stations. News directors are encouraged to contact the students for job openings, and students are given an account history of which stations purchased their story. These stories are marketed to the bottom 115 (Nielsen market) tv stations nationwide.
EvergreenTV Productions, Inc. started in Tampa, Florida in October 2000. It is a privately owned, Florida corporation, Subchapter S.
Company Ownership
EvergreenTV Productions is a privately-held Subchapter S corporation owned in majority by its founder and president, Louanne Walters. There is one other director, Bobby G. Walters, Louanne’s father, who is also vice-president. Louanne owns 70%, with Bobby owning 30%. Shares are available for additional ownership.
Company Locations and Facilities
All equipment and office management space is held within one room, approximately 10×10 feet at Louanne Walters’ home.
We are currently looking for an initial storefront, and have priced several in the North Tampa and Carrollwood areas. Needed space is 500-750 sq. ft. In these areas, price per square foot runs $1-$1.50, or approximately $500-$1,125 per month for rent. Many of these locations include utilities.
Start-up Summary
Expenses and funding for the business start-up are shown below.

| Start-up | |
| Requirements | |
| Start-up Expenses | |
| Legal | $200 |
| Brochures, Stationery, Etc. | $100 |
| Rent | $300 |
| Office Computer | $200 |
| Office Furniture | $0 |
| Total Start-up Expenses | $800 |
| Start-up Assets | |
| Cash Required | $14,100 |
| Start-up Inventory | $0 |
| Other Current Assets | $500 |
| Long-term Assets | $0 |
| Total Assets | $14,600 |
| Total Requirements | $15,400 |
| Start-up Funding | |
| Start-up Expenses to Fund | $800 |
| Start-up Assets to Fund | $14,600 |
| Total Funding Required | $15,400 |
| Assets | |
| Non-cash Assets from Start-up | $500 |
| Cash Requirements from Start-up | $14,100 |
| Additional Cash Raised | $0 |
| Cash Balance on Starting Date | $14,100 |
| Total Assets | $14,600 |
| Liabilities and Capital | |
| Liabilities | |
| Current Borrowing | $0 |
| Long-term Liabilities | $0 |
| Accounts Payable (Outstanding Bills) | $400 |
| Other Current Liabilities (interest-free) | $0 |
| Total Liabilities | $400 |
| Capital | |
| Planned Investment | |
| Investor 1 | $15,000 |
| Other | $0 |
| Additional Investment Requirement | $0 |
| Total Planned Investment | $15,000 |
| Loss at Start-up (Start-up Expenses) | ($800) |
| Total Capital | $14,200 |
| Total Capital and Liabilities | $14,600 |
| Total Funding | $15,400 |
Products and Services
As stated in the Company Summary section, Evergreen TV Productions is a company of three divisions, selling both products and services according to each division.
Product and Service Description
Services include:
- Marketing college and university students’ news stories to small market tv stations nationwide.
- Posting students’ resumes for a certain period (three months) on its website.
- Assigning each student an account from which he/she can contact stations which purchased his/her tape for potential job opportunities.
- Assigning each station an account from which the news director may contact students as potential future reporters.
Products include:
- Video scrapbooks, produced from photos digitized and set to music.
- Tour and travel videos of local, business or other interest for use in area businesses, as advertising of area businesses, or to promote tour agencies.
- All types of “evergreen” or “timeless” news stories, such as Health, Travel, Business, Leisure, Sports, Politics, Feature Personalities, etc., which may be of interest to stations and their viewers.
Competitive Comparison
We stand apart from our competition in price and value.
Home Division:
Currently, production companies are hesitant to offer video scrapbooks due to the amount of work necessary for a minimal return on revenue. They would much rather produce corporate productions with a high fee. Locally, a few companies will produce these scrapbooks, but they charge enormous fees. The reason for this is that they do not have a business system in place to allow them to produce these scrapbooks on a timely schedule with minimal cost. From an informal phone survey we gathered rates for a 10 minute video from $500 to $2,000. Additionally, this phone survey showed no true committment to the production elements of music and digital effects. Again, this is due to having no business system in place to provide these essential elements. It can be compared to a hamburger stand trying to become McDonald’s with no actual system in place to keep quality consistent.
Tour and Travel Division:
We offer high value and quality to our customers, and treat every project as if it were the only project. Production companies in general have a reputation for sloppy and careless producing, for overbooking projects, and for inconsistent and exorbitant charges. Our referral acceptance program ensure we will not overbook, we will have a higher degree of responsibility with each customer who is referred, and we cannot charge one customer amount X, and another customer amount Y, as they will probably know each other. The referral program sets us apart, and reassures otherwise wary customers.
B2B Division:
CONUS sells yearly subscriptions of regional news to tv stations nationwide for $20,000/year. Dr. Dean Edell sells yearly subscriptions of health news only, for nearly $30,000/year. MedStar sells yearly subscriptions of health news only, for $24,000/year. Mr. Food, Mrs. Fixit, TravelNet and many others all rank in the $20,000 and above category, and all offer only one topic, either health, food, travel, or how-to’s, but not something from each.
At our online website, EvergreenTV Productions offers a variety of topics to chose from, and stations can pick their own five stories each week to match their news or specific story trends, at a lower cost. They can customize their filler news, instead of throwing in whatever is available, making their newscasts flow smoothly, and eventually helping them generate viewers and thus sales, and all at a much more affordable cost.
Sales Literature
EvergreenTV Productions will rely heavily on presentations to retirement villas, business clubs, and other social outlets for advertising the Home Division. The B2B Division will rely upon one on one sales calls to colleges/universities and tv stations, and upon the Internet for e-mails, faxes and advertising of products and services.
Fulfillment
All end product supplies can be purchased locally from Office Depot, Sam’s Club, or Staples, or from a production company on the Internet at minimal cost. End product supplies include tape labels, and VHS/Beta/DVC video tape.
All photos being turned into video are provided by our clients and returned with the finished video product.
For the B2B Division, we do not buy our stories, but trade our marketing and resume services to students for their stories. A legally drawn-up contract is held between EvergreenTV Productions and each student, once his/her story is accepted. By agreeing, the student gives us the story for any commercial use, and he/she agrees to use that story only in job-searching. We then sell the story for profit and expenses (such as video tapes for dubbing purposes).
We also own over $12,000 worth of video and editing equipment, and can do our own stories, at no further cost to the company.
Technology
We use both Windows and Macintosh technology in our company. Windows and Office products are used mainly for all databases, word processing, and accounting needs. Macintosh products are used primarily for video editing, and loading video onto our website. We also have all the necessary components for a digital video production center, including cameras, mini-disc recorders, microphones, and lights. All other items can be rented per project at a low cost. Eventually, we would like to include DVD-R drives on our computers, to allow us to copy to DVD, rather than simply VHS tape (Home Division).
In addition to standard computers, scanner-copier-printer centers, we also use electronic faxing via the Internet, cell phone, DSL Internet subscriber line and several video tape recorders of various formats, including Beta SP, SVHS, DVC, and 3/4″. We are currently in communication with a media streaming Internet company regarding posting these news stories on the Internet to be downloaded directly to the tv stations who purchase the stories. This would eliminate the need for hard tape, and would give the stations instant access to stories they could download to their specific tape format.
Future Products and Services
Within the next five years, we will add storefronts statewide, all following consistent guidelines in our business system.
We would like to franchise this store nationwide.
Within the next three to five years, we will add production of our own brand of travel news to our product line.
Market Analysis Summary
Home Division:
There are no production companies in the area which currently focus on video scrapbooks. Several smaller companies “can” and “will” produce this for a high cost to the customer. With the advertising by both Apple and Sony focused on home digital video production, the awareness of this type of production is growing within the community, but as yet, no company has stepped up to the plate to offer this product. Consumers are becoming more educated about what can be done, but they do not know how to do it themselves.
For several months, EvergreenTV Productions has promoted this concept via word of mouth to small businesses, consumers on the street, and educated professionals. All show a keen interest in buying the product.
Tour and Travel Division:
Many production facilities exist in the Tampa Bay Area; and all are capable of producing professional projects. As this is a referral division only, we do not plan to compete regularly for business. Instead, we will build a web of quality prospects by maintaining high productions standards, and accepting only those clients who come highly recommended. This is not our main focus, but is a tool to generate business and reputation.
B2B Division:
EvergreenTV Productions focuses on the bottom 115 (Nielsen) tv markets. These are the markets whose station budgets don’t easily allow an expense of $20,000+ per year for programming services. We will offer the affordable alternative.
EvergreenTV Productions conducted a mail-in survey of 113 stations in the bottom 65 markets. The majority of these do subscribe to CONUS, Dr. Dean Edell, MedStar, or Medical Breakthrough. Of the 10 responses received, four stations did not subscribe to any news provider, but did indicate an interest in “filler news” at a reasonable cost. The conclusion is that many stations need stories, but cannot stretch their budgets to accommodate the high cost of programming. At this time, no service exists like EvergreenTV Productions programming alternative. Numbers for projected growth are not possible without history.
Market Segmentation
Three loosely defined market segments are identified. The “Home Division” category is by far the largest potential segment and represents the consumer most likely to be our client.

| Market Analysis | |||||||
| Year 1 | Year 2 | Year 3 | Year 4 | Year 5 | |||
| Potential Customers | Growth | CAGR | |||||
| Home Division | 9% | 22,000 | 23,980 | 26,138 | 28,490 | 31,054 | 9.00% |
| Tour and Travel Division | 4% | 756 | 786 | 817 | 850 | 884 | 3.99% |
| B2B Division | 1% | 45 | 45 | 45 | 45 | 45 | 0.00% |
| Other | 0% | 0 | 0 | 0 | 0 | 0 | 0.00% |
| Total | 8.83% | 22,801 | 24,811 | 27,000 | 29,385 | 31,983 | 8.83% |
Target Market Segment Strategy
Home Division:
Strategy for the home division is two-fold. First, we must find the appropriate means to communicate our product to potential customers. Because nearly everyone today has the ability to take photos and has a wide selection of photos at home, we must first narrow down our customer base by appealing to the emotions people attach to their photos. Older persons with larger families are more inclined to want to share their family histories. Newlyweds want their family and friends to share in their newfound happiness. By emphasizing these traits (nostalgia and euphoria) we can begin to gain a following for our product. Second, we must find a suitable location for our storefront, which enables us to find customers who share these traits. Malls and movie theaters appeal to “togetherness,” shopping together for gifts, weekend outings, brunch/lunch/dinner dates. The right location will give us access to our primary customers, those who will help us launch the product in the area by word of mouth.
Tour and Travel Division:
This division’s strategy relies entirely on our referral program. Doctors’ offices and travel agencies give us a wider demographic schematic, as patients and families of patients are confined to a waiting room during a visit. Instead of watching afternoon televised programming, doctors will be able to provide their clients with informative, educational and entertaining programming as compared to many daytime talk shows.
B2B Division:
Because EvergreenTV Productions utilizes the stories of university students, it is important to recognize the average age of a station’s reporters. A previous survey conducted by our company did confirm our experience, in that most small market tv stations hire only young “cub” reporters, as experienced reporters tend to move onward to larger markets and bigger stations. The quality of our product will match the quality of the station’s news. Therefore it is essential to target the bottom markets. This is also important to recognize from the service end of our business, as news directors will be interested in hiring reporters from our pool of news stories.
Market Growth
Home Division:
We will be better able to track market growth in this division following the first two quarters of sales. At this time, with no active competition, we expect our growth rate to double and triple weekly. As Tampa Bay is a large retirement community, these numbers could be increasing for several quarters. We then expect to see a slight down curve as the product finds its niche within the community, with a more consistent level of sales.
B2B Division:
Market growth can only be gauged by comparing the numbers of programming companies now available to those present a decade before. Ten years ago, Dr. Dean Edell was a radio host in San Francisco, now he’s available in dozens of tv markets nationwide. While the number of markets is not diminishing, the size of each market is changing. Depending upon population readjustment, the markets themselves adjust every year. One station may be in Nielsen market 110 this year, market 98 next year, and market 113 the following year due to population decline in year two and growth in year three.
Market Needs
Home Division:
With the advent of digital editing capabilities on home computer systems, more consumers are aware of the potential of creating video scrapbooks, but most are not familiar enough with the technology to accomplish a simple video. Apple and Sony are selling large numbers of these computers despite a recent turndown in the computer industry. Digital still cameras are a must have, with consumers expanding their vocabularies to include “Memory Stick,” “Pixels,” and “Jpegs.” Yet, in the Tampa Bay area, no production companies are actively marketing video scrapbooks. We can use the above product interest, and the continued success of photo processing centers, to create a gauge for interest in this product. However, as with any relatively new product, we will not know the market’s true needs until several quarters of sales.
B2B Division:
A void currently exists in the area of news programming. Larger stations are able to budget tens of thousands of dollars per year to support their needs. Smaller stations often rely on extending the weather and sports segments, or sitting on credits at the end of cast to “eat up extra time.” This reduces the newscasts’ value, and thus reduces the price of selling advertising as commercials, which is where tv stations make money.
Other small markets may subscribe to one or two programming services, at the expense of hiring quality personnel. These services limit the news directors and producers, because they have to run whatever story comes down on the satellite link that day. It may have nothing to do with other stories in a cast, or interest to the local viewing audience.
EvergreenTV Productions allows the stations to pick their own stories and run them when needed. In addition, by ordering weekly, they can choose from a constantly upgraded catalogue and pick stories which relate to news they are already running or have run recently. In other words, on a slow news day, CONUS may offer a story from a station in another state about a family lawsuit which has no relevance to that station’s viewers. EvergreenTV Productions, however, may offer a story about “Buying a puppy for your five year old.” It is timeless, and applies to a greater percentage of the viewing audience than the distant family’s lawsuit.
Within the service branch of this division, there is a greater range of competition, but few meet student’s needs. Many news talent agencies and resume services exist. However, none of them offer posting of resumes, marketing of resume tapes, and especially an opportunity to earn professional experience while the student is still in college, at no cost to the student. By positioning themselves with EvergreenTV Productions, students can hone in on various stations who have purchased their stories. They can link directly to those stations for future jobs, rather than send out a multitude of resume tapes in a shotgun style to get a foot in the door. And, they will not have to pay our company 10% of their first salary!
Market Trends
Home Division:
The advent of home computers capable of digital editing can certainly be considered a market trend, and one that is highly influential to our home division. As more consumers know of the technology, more interest is created in our product. While large corporations spend millions in advertising to promote these computers, we can take advantage of this advertising second-hand. The interest is created by the large corporations, and we use like advertising and terminology to increase interest in our particular product. A second major trend is with photo processing centers, such as those at Walgreens, offering pictures on CD-ROMS. These centers are already taking pictures to the next level, with the purpose of sharing these memories with family and friends. The logical next step is to put these pictures together in a creative and professional video scrapbook, then copy them to VHS tape or DVD.
B2B Division:
One major trend in the television news industry is staffing cut-backs. Newsrooms are using fewer reporters and photographers and replacing them with bought programming. Instead of paying $18,000/year for a reporter and $16,000/year for a photographer, smaller markets are buying news programming services at $20,000/year and saving on salary and health care expenses, while increasing the number of stories running per day. On average, a reporter will turn out one or two stories per day, while CONUS offers the ability to run two or three stories per day.
Another trend focuses on freelancing opportunities for reporters. Many are now working on their own, producing stories bought by several different companies. As tv begins to reflect the magazine industry in freelancing opportunities, more and more reporters will make a living working for themselves. In a long-term analysis, EvergreenTV Productions will be able to utilize these freelancers to do specific stories which fit the mission of our company.
A third trend is greater reliance on the Internet for programming. With the advent of TIVO, viewers can choose what they want to watch when they want to watch it. An even further long-term analysis could lend EvergreenTV Productions the opportunity to provide news that viewers can access specifically without going through their local tv stations. In the short term, local news stations may soon be able to download news stories directly to their control centers, without needing a tape for playback. By initially locating on the Internet, EvergreenTV Productions is putting itself in the position to take advantage of the increasing opportunities of Internet business, while at the present time offering easy access to a catalog of stories for order.
Service Business Analysis
Home Division:
We are primarily a production company within the retail industry. Some industries are similar, but as this is new technology, it is a unique industry. At the current time, we know of only a few other production companies which consistently turn out video scrapbooks. The photography industry is similar in creating still pictures for retail.
- Production companies: Most are individually owned and rarely produce small projects such as video scrapbooks. We do not know of any production companies designed solely for this type of product, but do know of several small corporations who have similar guidelines. The downside to these companies is that they are limited in timely production ability. They cannot accept 10 orders for video scrapbooks simultaneously, as they are set up to produce one scrapbook every two to three days, rather than two to three hours.
- Photography companies: Like-minded companies which produce wedding, family, vacation, etc., still photos for families to treasure. They do not produce video scrapbooks from these photos.
Tour and Travel Division:
We are limiting our production output in this division to a referral basis only. In general, the production company industry is very large, with companies specializing in corporate training videos, tour videos, advertising, etc. They rarely limit their productions to referral only, which means most often they will specialize in one area. To the customer, this means outsourcing to several production companies to meet his needs. A corporate president may have to hire two production companies to produce a training video and a travel video.
B2B Division:
We are both a marketing service and news provider. Therefore, half of our business deals within the marketing industry, promoting students, while the other half deals within the news industry, selling news programming to news stations.
- Marketing services for students:
- Industry magazines: For a nominal fee, students seeking employment can post a want ad, specifying the type of job they are looking for. These magazines have good responses from tv stations advertising jobs, but have a lower success rate for students seeking jobs.
- Internet websites: For a nominal fee, students may post their resume and information on an industry targeted website such as www.tvjobs.com. Thousands of students and currently employed reporters compete for the same positions, again with lower success rates.
- News Programming:
- Network-based programming: Affiliates belong to network news services which provide daily programming on hourly feeds. These stories are limited in region and topic, extremely time-sensitive, and restricted to the affiliation only. NBC affiliates belong to NBC Newschannel. ABC affiliates belong to NewsOne, etc.
- Subscription programming: For an annual rate, any affiliate may subscribe to these programming services. Their downside is in limiting the stories they offer to one specific topic such as healthcare, travel, or politics, rather than offering a wide variety of topics from which to choose. In addition, stations do not have a choice in which stories to run each day. Either stations can take one story daily from a satellite feed, or stations are sent a week of stories on tape.
Business Participants
Home Division:
Most production companies have a full plate with a wide assortment of projects. They are benefiting from the growing need for corporate advertising/projects, and prices on production equipment are continuing to fall.
B2B Division:
Student Services:
- There are hundreds of national talent agents within the tv industry. A select few work with esteemed firms and take on only proven, exceptional talent. Hundreds of others are available to college students for a fee of 10-13% of their salaries. This is where agents make money, searching for a job for the students, gaining an interview, then reaping the rewards. Fewer reporters are looking for agents due to the fee and the increasing abilities of the Internet. Like travel agents, talent agents are finding their once lucrative positions threatened by the Internet.
- There are dozens of job search services available, more in the past few years due to the insurgence of the Internet. Most require an upfront fee of $10-15 per month for resume posting service, and the privilege of searching for jobs on their website from those stations which have subscribed to them. They will continue to do well as long as reporters are seeking positions.
Station Services:
- While there are many production companies, few offer news to tv stations. Most programming services are based in larger markets where their product has taken hold. They offer topic specific news for tv stations nationally, at a high cost. Most generate stories by one well-known personality and offer only one story possibility per day. They make the majority of their revenue from mid-to-large markets. They have a strong position in the industry, and because they are topic specific, do not threaten each other. Internet news on demand, where viewers can watch their favorite station from their home computers, is the biggest threat.
- Freelance reporters infrequently sell their stories to stations.
Distributing a Service
Home Division:
Customers are accustomed to going into retail locations to make purchases or place orders. Having a storefront will provide them with this opportunity. Initially, we will host presentations to explain the product at various outlets such as retirement villas and apartment clubhouses.
B2B Division:
TV Stations buy directly from the programming source. A sales representative may call or visit a station for a programming product, or the station may purchase directly via the Internet.
Initially, it will be vital for us to visit one-on-one with small market stations to obtain a base clientele. Those stations across the country will be targeted via telephone and direct mailing promotional kits. Those stations which responded to our initial marketing survey are prime first clients–those who have already defined their needs according to our questionnaire.
Competition and Buying Patterns
Home Division:
As with any retail line, customers feel more comfortable and believe they are truly getting their money’s worth when they are given one-on-one attention. It is this attention we will give them in our 30-minute free consultations. Our customers will be more inclined to refer our business and product to friends and family if they believe we do not see them as simply a sale, but as people with needs being met. At the same time, it is essential we see the photos the customer is bringing in, and have the customer present to ask questions and verify the photo placement within the video. This initial attention to detail will also provide our customers with the knowledge that we will produce exactly the video they have in mind.
B2B Division:
TV stations are prone to purchase news stories based on the bottom line. If one programming service becomes too expensive, the station will spin off to another programming service for a few thousand dollars less. Small market tv stations do not have this option, as most services are too expensive for their budgets.
EvergreenTV Productions will offer quality news stories at a very competitive price–in fact, half the cost of most other programming services–to gain access to those smaller markets. In addition, having a variety of news topics makes us a hot choice. Stations do not have to spend thousands for only one brand of news, i.e., health stories. They can choose from a wide variety, health, politics, financial, innovative, unusual, personalities, etc.
Main Competitors
Home Division (Video Scrapbook Production Companies):
Family Tree Videos:
Strengths: A franchise production company geared toward genealogy, but includes producing video scrapbooks. Good-looking productions revolving around family interviews, documentation, and photos.
Weaknesses: The formula is too complex to generate quality products in quantity. Many smaller production companies learn this method first, then give up due to lost time and not enough revenue.Independent Companies:
Strengths: Nationwide, dozens of independently owned production companies produce video scrapbooks. Most are your neighbors, businesses you want to trust.
Weaknesses: Quality is inconsistent and depends entirely upon the owner’s ability. If you’re not a close friend or family member, you may not get the product you really want or thought you ordered. Due to time constraints and the need for revenue, many of these smaller companies will put video scrapbooks on the back burner for bigger projects, such as weddings.
B2B Division (Programming Services):
Dr. Dean Edell:
Strengths: Well known after years of radio and tv broadcasting. Big service, using satellite feeds to get stories to stations. National image, high volume.
Weaknesses: Very expensive. At the top of the scale at $24,000+ per year. Limited to one topic, health news.MedStar:
Strengths: Competitive pricing, less expensive than Dr. Dean. Utilizes chain of universities for national syndication.
Weaknesses: Still too high a cost for smaller markets. Limited to one topic, health news.TravelNet:
Strengths: National syndication, high volume. Has satellite feeds to stations.
Weaknesses: Generic writing for travel pieces. Limited to one topic, travel news. Too high a cost for smaller markets.Mrs. Fix It:
Strengths: Appealing change of gender, national image, excellent writing and presentation.
Weaknesses: Too high a cost for smaller markets, limited to one topic, do-it-yourself home/yard/car improvements.
Many other services fall within this category, too many to mention. Some are purely regional and do not appeal nationally. Most are of high cost to small market stations. None that we’ve found offers a variety of news topics.
Strategy and Implementation Summary
Home Division:
- Create a “gotta have it” campaign. Our marketing efforts need to focus on a) introducing our specific brand of video scrapbooks and b) telling our customers why they and their friends all need one.
- Emphasize service and quality. Especially as this is a fairly new product to be launched into the market, customers need to know that we will cherish their memories and create a quality video.
B2B Division:
- Emphasize variety and cost savings. We must differentiate ourselves from the large programming services by detailing the variety of news stories and affordable pricing.
- Build a relationship with schools and stations. Build long-term relationships with professors, deans and news directors to continue service and sales annually.
- Focus on key schools and markets. We need to focus on building a client base of schools who know and believe in our student oriented objectives, and who will help promote those objectives yearly. We also need to build loyalty and consistent quality with target small market tv stations/news directors.
Competitive Edge
Home Division:
Our competitive edge in producing video scrapbooks is in our business system, which allows us a) to produce large numbers of videos while retaining quality, thus giving more customers a grade A product with a short turn-around time, b) to maintain consistency at every location, so customers can be assured they will get the same quality at one store that their friends/family received at another, and c) to train all employees using consistent customer service guidelines from initial consultation through any complaints/issues.
B2B Division:
For TV stations, our competitive edge is having a variety of news topics to offer, and at a much more affordable cost to small market tv stations than larger programming services can offer.
For students, our competitive edge is offering a FREE resume service, FREE marketing service for that first job out of school, and a DIRECT connection to news directors in markets known to hire graduating broadcasting students.
Sales Strategy
Home Division:
- We need to sell the memories and emotions of these videos, not the product. While we produce videos, we create and tap into a lifetime of emotions cherished by our customers. Our advertising and marketing need to reflect this concept.
- We need to understand exactly what our service is, so our customers will also understand. Our customers must feel confident that we value their memories and emotions as much as our own, and will treasure them individually. An order for a video is not a product order, but a piece of family gold we are holding in safekeeping.
B2B Division:
- We need to sell both the company and the product. As this is a new venture into an antiquated system, generating sales will require an enthusiastic approach in order to renovate the tv news programming concept. In-person sales are essential in the primary stages of generating sales. A reputation for service excellence, news variety and affordable pricing will continue the momentum of sales in the future.
- We have to sell our service and support to schools nationwide. Gaining the support of deans and professors is a vital element to generating inventory on a yearly basis. By developing a loyal clientele of professors, we ensure continued inventory growth annually.
Sales Forecast
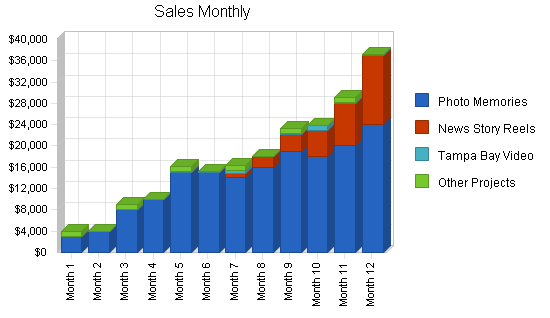
Yearly sales forecasts are shown below and the initial year’s monthly forecast is shown in the appendix.
| Sales Forecast | |||
| Year 1 | Year 2 | Year 3 | |
| Unit Sales | |||
| Photo Memories | 800 | 2,880 | 4,800 |
| News Story Reels | 160 | 1,000 | 2,000 |
| Tampa Bay Video | 48 | 50 | 50 |
| Other Projects | 6 | 12 | 20 |
| Total Unit Sales | 1,014 | 3,942 | 6,870 |
| Unit Prices | Year 1 | Year 2 | Year 3 |
| Photo Memories | $207.50 | $208.20 | $208.20 |
| News Story Reels | $200.00 | $200.00 | $200.00 |
| Tampa Bay Video | $47.92 | $50.00 | $50.00 |
| Other Projects | $1,000.00 | $1,000.00 | $1,000.00 |
| Sales | |||
| Photo Memories | $166,000 | $599,616 | $999,360 |
| News Story Reels | $32,000 | $200,000 | $400,000 |
| Tampa Bay Video | $2,300 | $2,500 | $2,500 |
| Other Projects | $6,000 | $12,000 | $20,000 |
| Total Sales | $206,300 | $814,116 | $1,421,860 |
| Direct Unit Costs | Year 1 | Year 2 | Year 3 |
| Photo Memories | $3.00 | $4.00 | $4.00 |
| News Story Reels | $15.00 | $15.00 | $15.00 |
| Tampa Bay Video | $4.79 | $5.00 | $5.00 |
| Other Projects | $354.17 | $500.00 | $500.00 |
| Direct Cost of Sales | |||
| Photo Memories | $2,400 | $11,520 | $19,200 |
| News Story Reels | $2,400 | $15,000 | $30,000 |
| Tampa Bay Video | $230 | $250 | $250 |
| Other Projects | $2,125 | $6,000 | $10,000 |
| Subtotal Direct Cost of Sales | $7,155 | $32,770 | $59,450 |
Strategic Alliances
Home Division:
Strategic alliances with photographers, photo processing centers and travel agents will be key to generating sales in the first few quarters. We plan to initiate a co-marketing campaign, by possibly adding on 30-second commercials at the end of each video, promoting a photographer or travel agency. These will be tasteful and placed at the end of the tape, but will also co-promote a like business. In the future, we could sell these spots to like businesses to generate revenue.
Additionally, our alliances with retirement villas will be instrumental from start-up. While these will not involve co-promotions, it will be necessary to build a strong relationship so the villa officials welcome us to their facilities.
B2B Division:
We heavily depend upon building a strong alliance with schools to create a substantial inventory to generate sales. The greater the size of inventory, the greater the variety we have to offer stations. We need to concentrate on making as many contacts with schools as possible. If we cannot offer students a marketing position, i.e., a substantial time frame in which we market their stories and post their resumes, we will not have their interest and it would follow, their stories to add to our inventory.
After the first year, the inventory will grow at a consistent rate. However, the first year’s inventory size could well determine our company’s sales success.
Marketing Strategy
Home/Travel Divisions:
- Build relationships with primary target customers (Market Segmentation section) and like businesses, such as photography shops, photography processing centers, and travel agencies.
- Emphasize service and quality while building a referral basis.
B2B Division:
- Emphasize variety and affordability.
- Emphasize service while building relationships.
- Focus on schools with tv stations and broadcast communications programs.
- Focus on small market tv stations, bottom 115 Nielsen markets.
Positioning Statement
Home Division:
Initially, for people celebrating an event or recognizing a lifetime of memories who would like to share photos of those memories in a video scrapbook with friends and family, our videos provide a special and unique gift opportunity. Unlike standard production companies which produce video scrapbooks in a random and time-consuming fashion, our videos meet consistently professional standards in quality in a timely manner. (See Competitive Comparison section.)
B2B Division:
For students about to graduate and seek their first job within the tv news industry, EvergreenTV Productions offers an incredible marketing and resume posting service. Unlike www.tvjobs.com and others, it offers these services for free, and for a longer period of time (i.e., three months as opposed to one month).
For small market tv stations which need news stories daily to fill their newscasts, EvergreenTV Productions offers an affordable programming service. Unlike larger programming services such as Dr. Dean Edell and TravelNet, it offers a variety of programming at half the cost.
Pricing Strategy
Home Division:
Our business system has helped define our pricing strategy. If our video scrapbooks are too time-consuming, the customer will be charged an exorbitant amount. If our video scrapbooks are even middle to low quality, we cannot charge the customer low enough. By making the productions both time-efficient and consistent in high quality, we can maximize our pricing to acceptable market levels. Our strategy is also based upon the fact that we are introducing video scrapbooks on a large scale into the market, with no previous history for this product. As our video style becomes more popular, we will be able to adjust the pricing accordingly. We are offering four package styles from which our customers may choose. By charting the most popular package, we will better determine the right price for our product.
B2B Division:
Our pricing strategy is key to our offering. If we charge too much, or even 3/4 the price of larger programming services, we are undercutting our potential orders. The market of small market stations cannot bear the higher prices offered by larger programming services.
Likewise, by offering a free resume and marketing service to students, we are ensuring continued interest in our service in exchange for news stories. We need to be positioned to offer payment for these stories a few years down the road. As the popularity of EvergreenTV Productions grows, so will the number of programming services offering similar services.
Promotion Strategy
Home Division:
Initially, we will depend upon presentations and business relationships to reach new customers.
- Retirement villas “social nights:” We have been invited to attend certain nights set aside at retirement villas for residents and family members in which we will present Photo Memories thru discussion and a brief video presentation.
- Photographers, photo processing centers, and travel agencies: We will form business referral relationships with like businesses to promote the product.
B2B Division:
We depend on direct contact with communications deans and professors as our main way to reach students. That contact will be made to specific schools.
- Promotional Kits. We are sending colleges, universities and technical schools with tv stations on campus promotional kits which will include our objectives and student guidelines for various topics.
- Campus Visits and Phone Calls. We are contacting the professors and deans directly, either through campus visits or phone calls, to gain the support needed from deans and professors, who in turn are encouraging their students to submit news stories to us.
Distribution Strategy
Home Division:
Our primary distribution will be through our storefront, which will also be the order center, consultation location, and production office. To make it easier for our customers at retirement villas, we offer to accept orders at and deliver to these locations.
B2B Division:
Our distribution will focus mainly around our website, taking orders and processing them through direct mailings. In the initial period, we will be distributing tapes during person-to-person presentations.
We are prepared to mail on order, via the USPS. Stations may order for regular three-day delivery, up to overnight shipments, depending upon their needs.
Milestones
Part of the business’s success will be based on planned tasks and timely completion of those steps. The table below lists steps, timeline and estimated budgets.
| Milestones | |||||
| Milestone | Start Date | End Date | Budget | Manager | Department |
| Build Website | 9/7/2000 | 5/31/2001 | $19,000 | LW | President |
| Contact 30 Colleges/Universities | 11/1/2000 | 2/28/2001 | $20 | LW | President |
| Brochures Photeo Memories | 3/15/2001 | 5/15/2001 | $220 | LW | President |
| Write/Finalize Operations Manual | 5/31/2001 | 12/31/2001 | $0 | LW | President |
| Store Location | 5/31/2001 | 7/15/2001 | $0 | LW | President |
| Office Furniture | 5/31/2001 | 7/31/2001 | $2,000 | LW | President |
| Open Photeo Memories Store #1 | 5/31/2001 | 7/15/2001 | $2,000 | LW | President |
| Additional Office Equipment | 7/15/2001 | 8/15/2001 | $2,000 | LW | President |
| Hire 1st Employee | 7/15/2001 | 8/15/2001 | $30 | LW | President |
| Produce 1 Hr Tampa Bay Video | 6/1/2001 | 9/15/2001 | $5 | LW | President |
| Sell Tampa Bay Video to Dr’s Offices | 9/15/2001 | 12/31/2001 | $100 | LW | President |
| Build Inventory to 15 News Stories | 9/1/2001 | 12/15/2001 | $500 | LW | President |
| Build Inventory to 50 News Stories | 12/15/2001 | 3/31/2002 | $500 | LW | President |
| Obtain 30 Sales to TV Stations | 12/15/2001 | 4/1/2002 | $1,000 | LW/Sales Rp | B2B Sales |
| Hire Employees per Personnel Forecast | 10/1/2001 | 12/31/2001 | $50 | Store Mgr | Home Div. |
| Name me | 12/1/2001 | 6/30/2002 | $6,000 | LW | President |
| Totals | $33,425 | ||||
Management Summary
EvergreenTV Productions is owned and operated by its founders, Louanne Walters and Bobby Gene Walters. It is a small company with immediate plans for hiring one or two employees per store. Each employee’s responsibilities will be outlined in our business system “Operations Manual.”
As we grow into the Tour and Travel and B2B Divisions, we will evaluate which positions need to be filled first. Long term growth includes plans for an Operations Manager, who will report to the President and handle all accounting and marketing responsibilities. Three managers will answer to the Ops Mgr, one per division. Each manager will be primarily responsible for accounting and marketing within his/her division, and will handle all hiring/training needs.
We currently receive a great deal of advice from outside sources, such as our accountant and attorney; however, we follow the advice which meets our goals and needs.
Organizational Structure
As a start-up, our divisions and departments are inter-related and handled for the most part by Louanne Walters. With time and revenue, we will expand to accommodate several departments: sales & marketing, service and administration, product development, and finance. Each division manager will fill these departments according to specific needs and the company’s business system operations manual.
The following chart outlines the anticipated organizational set-up for the first three to five years of EvergreenTV Productions, Inc.
Management Team
Louanne Walters, president: 33 years old, extensive experience in the radio and tv news industries. Formerly a tv news producer, reporter and anchor. Degree in broadcast communications, seven years with three NBC affiliates (KPOM, Ft. Smith, Arkansas – KRIS, Corpus Christ, Texas – KWQC, Davenport, Iowa) and one year as video programmer with Royal Caribbean International. Extensive public relations background as anchor and cruise director with Royal Caribbean International. Strong writing skills, strong story development and news sense. Attending courses at Small Business Development Center USF. Louanne also has strong sales skills, and is formerly a Toyota new car product specialist, and Voice Stream territory representative.
Bobby G. Walters, vice-president: 61 years old, extensive management background during 33 years with USAF. Degree in business and management. Twelve years as manager with local Wal-Mart stores.
Management Team Gaps
We believe we have strong leadership for developing the concept behind EvergreenTV Productions. At present, our weakest area is in accounting. We are currently taking an accounting course produced by “Great Courses on Tape,” focusing on finance and accounting. Additionally, we have hired Jim Wessman, CPA to advise and aid us in the development of EvergreenTV Productions. Jim is a qualified management counselor, and QuickBooks advisor.
We also need to hire division managers with a well-rounded management background, including human resources, accounting, benchmarking and goal-setting abilities.
Following the opening of stores for the Home Division, we will need to hire an operations manager, with an MBA and at least five years experience with a start-up organization.
Personnel Plan
Details of store staffing is presented in the Personnel Table, below and in the appendix.
Benefits
We assume hiring employees on hourly pay the first year, and adding a few salaried management positions with benefits the second year. Our management salaries (marketing manager, president, operations manager) as shown below include taxable benefits. Payroll taxes for all employees are shown in the Profit and Loss.
| Personnel Plan | |||
| Year 1 | Year 2 | Year 3 | |
| Production Personnel | |||
| Photo Editor | $13,500 | $18,500 | $19,000 |
| Photo Editor | $12,000 | $18,500 | $19,000 |
| Photo Editor | $6,000 | $18,500 | $19,000 |
| Photo Editor (2) | $1,500 | $18,500 | $19,000 |
| Additional Employees (3 stores) | $0 | $92,500 | $100,000 |
| Additional Employees (5 stores) | $0 | $0 | $209,000 |
| Subtotal | $33,000 | $166,500 | $385,000 |
| Sales and Marketing Personnel | |||
| Marketing Manager (President) | $0 | $41,400 | $46,000 |
| News Sales Representative | $4,998 | $22,000 | $24,000 |
| News Sales Representative Commission | $3,000 | $15,000 | $15,000 |
| Other | $0 | $0 | $0 |
| Subtotal | $7,998 | $78,400 | $85,000 |
| General and Administrative Personnel | |||
| Store Manager | $17,600 | $20,000 | $20,000 |
| Store Manager Commission | $4,200 | $5,000 | $5,000 |
| Store Manager (2) | $3,200 | $20,000 | $20,000 |
| Store Manager Commission (2) | $800 | $5,000 | $5,000 |
| Store Mgr/Commission (3 & 5 stores) | $0 | $25,000 | $75,000 |
| Subtotal | $25,800 | $75,000 | $125,000 |
| Other Personnel | |||
| President | $37,500 | $51,750 | $69,000 |
| Operations Manager | $0 | $46,000 | $63,250 |
| Home Division Manager | $0 | $0 | $40,000 |
| B2B Division Manager | $0 | $0 | $45,000 |
| Other | $0 | $0 | $0 |
| Subtotal | $37,500 | $97,750 | $217,250 |
| Total People | 8 | 16 | 26 |
| Total Payroll | $104,298 | $417,650 | $812,250 |
Financial Plan
The most important element in the financial plan is the critical need for additional capital to assist in business operations through the remaining start-up process, and to maintain a positive cash balance for the first fiscal quarters. We do not anticipate any changes to our financial plan through accounts receivables or inventory, as our company operates upon the “payment upon receipt” principal for all goods, and our inventory cycle does not meet the standard criteria.
Moving from a home office to a storefront with employees, introduces greater liabilities. During the past seven month start-up process, we have largely committed to EvergreenTV Productions through personal savings, cashed stocks, personal credit lines and personal long-term loan options.
Important Assumptions
The financial plan depends on important assumptions, most of which are shown in the following table. The key underlying assumptions are:
We assume access to equity capital and financing sufficient to follow and maintain our financial plan as shown in the tables. We anticipate our financing to hold higher long-term interest than our current loan against stock. We assume that as our company grows, we will be able to utilize a larger credit line, decreasing our expenses in cash. Likewise, our short-term credit line will be available with a lower short-term interest rate, making more cash available.
We assume opening and promoting three stores within the Tampa Bay area before reaching saturation. Likewise, we assume relatively quick initial growth within the Home Division, following our plan of two stores open within the first year, and 10 stores statewide within five years.
We assume many tv markets are, or will become, Internet proficient. We assume most colleges and universities are, or will become, Internet proficient. We assume slow initial growth within the B2B Division. However, the majority of our long-term payments are for one time, or long-term purchases which will not need to be replaced in the first five years.
| General Assumptions | |||
| Year 1 | Year 2 | Year 3 | |
| Plan Month | 1 | 2 | 3 |
| Current Interest Rate | 13.00% | 13.00% | 13.00% |
| Long-term Interest Rate | 0.80% | 0.80% | 0.80% |
| Tax Rate | 25.42% | 25.00% | 25.42% |
| Other | 0 | 0 | 0 |
Key Financial Indicators
The benchmark chart shows the nature of our company. We estimate consistent turns on inventory, as our inventory is available for resale on a constant basis. In our Home Division, we do not keep inventory, but customers bring their photos to us. In our B2B Division, our inventory consists of news stories we will keep on hand for multiple sales. Several stations may purchase the same story, we simply make a copy of that story. Our blank tape inventory will be replenished monthly to avoid keeping a large inventory of tapes.
Our Gross Margin increases with increased sales, but as we have a very low direct cost of sales, this number will only increase fractionally compared to sales.
Sales and Operating Expenses are our closest measurements in this forecast. While sales increase dramatically, operating expenses increase with new stores, additional employees and taxes. However, by maximizing the number of employees within each store, we are also maximizing our location and limiting further expenses that additional storefronts would incur. We are also able to save drastically on advertising expenses, which would naturally increase with each new location.

Break-even Analysis
We assume running costs which include rent, utilities, office expenses, and an average of travel, advertising and miscellaneous costs. Miscellaneous costs are equal to quarterly costs such as business cards, brochures, bulk tape supplies and occasional equipment rental. Payroll increases every other month as we add new employees.

| Break-even Analysis | |
| Monthly Units Break-even | 51 |
| Monthly Revenue Break-even | $10,303 |
| Assumptions: | |
| Average Per-Unit Revenue | $203.45 |
| Average Per-Unit Variable Cost | $7.06 |
| Estimated Monthly Fixed Cost | $9,946 |
Projected Profit and Loss
Profit and Loss projects look very good, with the usual start-up loss limited to the first two months. The monthly projections for the first year are included in the appendix.


| Pro Forma Profit and Loss | |||
| Year 1 | Year 2 | Year 3 | |
| Sales | $206,300 | $814,116 | $1,421,860 |
| Direct Cost of Sales | $7,155 | $32,770 | $59,450 |
| Production Payroll | $33,000 | $166,500 | $385,000 |
| Other | $0 | $0 | $0 |
| Total Cost of Sales | $40,155 | $199,270 | $444,450 |
| Gross Margin | $166,145 | $614,846 | $977,410 |
| Gross Margin % | 80.54% | 75.52% | 68.74% |
| Operating Expenses | |||
| Sales and Marketing Expenses | |||
| Sales and Marketing Payroll | $7,998 | $78,400 | $85,000 |
| Advertising/Promotion | $20,000 | $20,000 | $30,000 |
| Travel | $6,500 | $10,000 | $8,000 |
| Miscellaneous | $9,500 | $7,500 | $10,000 |
| Total Sales and Marketing Expenses | $43,998 | $115,900 | $133,000 |
| Sales and Marketing % | 21.33% | 14.24% | 9.35% |
| General and Administrative Expenses | |||
| General and Administrative Payroll | $25,800 | $75,000 | $125,000 |
| Sales and Marketing and Other Expenses | $0 | $0 | $0 |
| Depreciation | $0 | $0 | $0 |
| Leased Equipment | $0 | $0 | $0 |
| Utilities | $1,260 | $3,600 | $6,000 |
| Insurance | $1,040 | $2,880 | $4,800 |
| Rent | $9,750 | $27,000 | $45,000 |
| Payroll Taxes | $0 | $0 | $0 |
| Other General and Administrative Expenses | $0 | $0 | $0 |
| Total General and Administrative Expenses | $37,850 | $108,480 | $180,800 |
| General and Administrative % | 18.35% | 13.32% | 12.72% |
| Other Expenses: | |||
| Other Payroll | $37,500 | $97,750 | $217,250 |
| Consultants | $0 | $0 | $0 |
| Contract/Consultants | $0 | $0 | $0 |
| Total Other Expenses | $37,500 | $97,750 | $217,250 |
| Other % | 18.18% | 12.01% | 15.28% |
| Total Operating Expenses | $119,348 | $322,130 | $531,050 |
| Profit Before Interest and Taxes | $46,797 | $292,716 | $446,360 |
| EBITDA | $46,797 | $292,716 | $446,360 |
| Interest Expense | $423 | $141 | $0 |
| Taxes Incurred | $11,488 | $73,144 | $113,450 |
| Net Profit | $34,886 | $219,431 | $332,910 |
| Net Profit/Sales | 16.91% | 26.95% | 23.41% |
Projected Cash Flow
Cash flow projections are good, as shown in the annual table below, and the monthly table in the appendix. There are only two months of negative cash flow the foreseen the first year, and the all important cash balance shows steady increases.

| Pro Forma Cash Flow | |||
| Year 1 | Year 2 | Year 3 | |
| Cash Received | |||
| Cash from Operations | |||
| Cash Sales | $206,300 | $814,116 | $1,421,860 |
| Subtotal Cash from Operations | $206,300 | $814,116 | $1,421,860 |
| Additional Cash Received | |||
| Sales Tax, VAT, HST/GST Received | $0 | $0 | $0 |
| New Current Borrowing | $5,000 | $0 | $0 |
| New Other Liabilities (interest-free) | $0 | $0 | $0 |
| New Long-term Liabilities | $0 | $0 | $0 |
| Sales of Other Current Assets | $0 | $0 | $0 |
| Sales of Long-term Assets | $0 | $0 | $0 |
| New Investment Received | $0 | $0 | $0 |
| Subtotal Cash Received | $211,300 | $814,116 | $1,421,860 |
| Expenditures | Year 1 | Year 2 | Year 3 |
| Expenditures from Operations | |||
| Cash Spending | $104,298 | $417,650 | $812,250 |
| Bill Payments | $59,036 | $189,141 | $264,923 |
| Subtotal Spent on Operations | $163,334 | $606,791 | $1,077,173 |
| Additional Cash Spent | |||
| Sales Tax, VAT, HST/GST Paid Out | $0 | $0 | $0 |
| Principal Repayment of Current Borrowing | $2,830 | $2,170 | $0 |
| Other Liabilities Principal Repayment | $0 | $0 | $0 |
| Long-term Liabilities Principal Repayment | $0 | $0 | $0 |
| Purchase Other Current Assets | $0 | $0 | $0 |
| Purchase Long-term Assets | $0 | $0 | $0 |
| Dividends | $0 | $0 | $0 |
| Subtotal Cash Spent | $166,164 | $608,961 | $1,077,173 |
| Net Cash Flow | $45,136 | $205,155 | $344,687 |
| Cash Balance | $59,236 | $264,391 | $609,079 |
Projected Balance Sheet
The balance sheet below and in the appendix show steady increase in net worth over the life of the plan.
| Pro Forma Balance Sheet | |||
| Year 1 | Year 2 | Year 3 | |
| Assets | |||
| Current Assets | |||
| Cash | $59,236 | $264,391 | $609,079 |
| Inventory | $1,480 | $19,672 | $14,136 |
| Other Current Assets | $500 | $500 | $500 |
| Total Current Assets | $61,216 | $284,563 | $623,715 |
| Long-term Assets | |||
| Long-term Assets | $0 | $0 | $0 |
| Accumulated Depreciation | $0 | $0 | $0 |
| Total Long-term Assets | $0 | $0 | $0 |
| Total Assets | $61,216 | $284,563 | $623,715 |
| Liabilities and Capital | Year 1 | Year 2 | Year 3 |
| Current Liabilities | |||
| Accounts Payable | $9,960 | $16,046 | $22,287 |
| Current Borrowing | $2,170 | $0 | $0 |
| Other Current Liabilities | $0 | $0 | $0 |
| Subtotal Current Liabilities | $12,130 | $16,046 | $22,287 |
| Long-term Liabilities | $0 | $0 | $0 |
| Total Liabilities | $12,130 | $16,046 | $22,287 |
| Paid-in Capital | $15,000 | $15,000 | $15,000 |
| Retained Earnings | ($800) | $34,086 | $253,517 |
| Earnings | $34,886 | $219,431 | $332,910 |
| Total Capital | $49,086 | $268,517 | $601,427 |
| Total Liabilities and Capital | $61,216 | $284,563 | $623,715 |
| Net Worth | $49,086 | $268,517 | $601,427 |
Business Ratios
Business ratios for the years of this plan are shown below. Industry profile ratios based on the Standard Industrial Classification (SIC) code 7812, Motion Picture and Video Production, are shown for comparison.
| Ratio Analysis | ||||
| Year 1 | Year 2 | Year 3 | Industry Profile | |
| Sales Growth | n.a. | 294.63% | 74.65% | 14.20% |
| Percent of Total Assets | ||||
| Inventory | 2.42% | 6.91% | 2.27% | 3.40% |
| Other Current Assets | 0.82% | 0.18% | 0.08% | 46.90% |
| Total Current Assets | 100.00% | 100.00% | 100.00% | 68.40% |
| Long-term Assets | 0.00% | 0.00% | 0.00% | 31.60% |
| Total Assets | 100.00% | 100.00% | 100.00% | 100.00% |
| Current Liabilities | 19.82% | 5.64% | 3.57% | 41.60% |
| Long-term Liabilities | 0.00% | 0.00% | 0.00% | 17.20% |
| Total Liabilities | 19.82% | 5.64% | 3.57% | 58.80% |
| Net Worth | 80.18% | 94.36% | 96.43% | 41.20% |
| Percent of Sales | ||||
| Sales | 100.00% | 100.00% | 100.00% | 100.00% |
| Gross Margin | 80.54% | 75.52% | 68.74% | 0.00% |
| Selling, General & Administrative Expenses | 63.71% | 46.92% | 43.99% | 74.80% |
| Advertising Expenses | 9.69% | 2.46% | 2.11% | 1.60% |
| Profit Before Interest and Taxes | 22.68% | 35.96% | 31.39% | 1.60% |
| Main Ratios | ||||
| Current | 5.05 | 17.73 | 27.98 | 1.67 |
| Quick | 4.92 | 16.51 | 27.35 | 1.12 |
| Total Debt to Total Assets | 19.82% | 5.64% | 3.57% | 58.80% |
| Pre-tax Return on Net Worth | 94.48% | 108.96% | 74.22% | 1.80% |
| Pre-tax Return on Assets | 75.76% | 102.82% | 71.56% | 4.50% |
| Additional Ratios | Year 1 | Year 2 | Year 3 | |
| Net Profit Margin | 16.91% | 26.95% | 23.41% | n.a |
| Return on Equity | 71.07% | 81.72% | 55.35% | n.a |
| Activity Ratios | ||||
| Inventory Turnover | 7.63 | 3.10 | 3.52 | n.a |
| Accounts Payable Turnover | 6.89 | 12.17 | 12.17 | n.a |
| Payment Days | 27 | 24 | 26 | n.a |
| Total Asset Turnover | 3.37 | 2.86 | 2.28 | n.a |
| Debt Ratios | ||||
| Debt to Net Worth | 0.25 | 0.06 | 0.04 | n.a |
| Current Liab. to Liab. | 1.00 | 1.00 | 1.00 | n.a |
| Liquidity Ratios | ||||
| Net Working Capital | $49,086 | $268,517 | $601,427 | n.a |
| Interest Coverage | 110.63 | 2,075.26 | 0.00 | n.a |
| Additional Ratios | ||||
| Assets to Sales | 0.30 | 0.35 | 0.44 | n.a |
| Current Debt/Total Assets | 20% | 6% | 4% | n.a |
| Acid Test | 4.92 | 16.51 | 27.35 | n.a |
| Sales/Net Worth | 4.20 | 3.03 | 2.36 | n.a |
| Dividend Payout | 0.00 | 0.00 | 0.00 | n.a |
Appendix
| Sales Forecast | |||||||||||||
| Month 1 | Month 2 | Month 3 | Month 4 | Month 5 | Month 6 | Month 7 | Month 8 | Month 9 | Month 10 | Month 11 | Month 12 | ||
| Unit Sales | |||||||||||||
| Photo Memories | 0% | 15 | 20 | 40 | 50 | 60 | 60 | 70 | 80 | 95 | 90 | 100 | 120 |
| News Story Reels | 0% | 0 | 0 | 0 | 0 | 0 | 0 | 4 | 10 | 16 | 25 | 40 | 65 |
| Tampa Bay Video | 0% | 0 | 0 | 0 | 2 | 3 | 5 | 12 | 2 | 2 | 18 | 2 | 2 |
| Other Projects | 0% | 1 | 0 | 1 | 0 | 1 | 0 | 1 | 0 | 1 | 0 | 1 | 0 |
| Total Unit Sales | 16 | 20 | 41 | 52 | 64 | 65 | 87 | 92 | 114 | 133 | 143 | 187 | |
| Unit Prices | Month 1 | Month 2 | Month 3 | Month 4 | Month 5 | Month 6 | Month 7 | Month 8 | Month 9 | Month 10 | Month 11 | Month 12 | |
| Photo Memories | $200.00 | $200.00 | $200.00 | $200.00 | $250.00 | $250.00 | $200.00 | $200.00 | $200.00 | $200.00 | $200.00 | $200.00 | |
| News Story Reels | $0.00 | $0.00 | $0.00 | $0.00 | $0.00 | $0.00 | $200.00 | $200.00 | $200.00 | $200.00 | $200.00 | $200.00 | |
| Tampa Bay Video | $0.00 | $0.00 | $0.00 | $0.00 | $50.00 | $50.00 | $50.00 | $50.00 | $50.00 | $50.00 | $50.00 | $50.00 | |
| Other Projects | $1,000.00 | $0.00 | $1,000.00 | $0.00 | $1,000.00 | $0.00 | $1,000.00 | $1,000.00 | $1,000.00 | $1,000.00 | $1,000.00 | $1,000.00 | |
| Sales | |||||||||||||
| Photo Memories | $3,000 | $4,000 | $8,000 | $10,000 | $15,000 | $15,000 | $14,000 | $16,000 | $19,000 | $18,000 | $20,000 | $24,000 | |
| News Story Reels | $0 | $0 | $0 | $0 | $0 | $0 | $800 | $2,000 | $3,200 | $5,000 | $8,000 | $13,000 | |
| Tampa Bay Video | $0 | $0 | $0 | $0 | $150 | $250 | $600 | $100 | $100 | $900 | $100 | $100 | |
| Other Projects | $1,000 | $0 | $1,000 | $0 | $1,000 | $0 | $1,000 | $0 | $1,000 | $0 | $1,000 | $0 | |
| Total Sales | $4,000 | $4,000 | $9,000 | $10,000 | $16,150 | $15,250 | $16,400 | $18,100 | $23,300 | $23,900 | $29,100 | $37,100 | |
| Direct Unit Costs | Month 1 | Month 2 | Month 3 | Month 4 | Month 5 | Month 6 | Month 7 | Month 8 | Month 9 | Month 10 | Month 11 | Month 12 | |
| Photo Memories | 0.00% | $3.00 | $3.00 | $3.00 | $3.00 | $3.00 | $3.00 | $3.00 | $3.00 | $3.00 | $3.00 | $3.00 | $3.00 |
| News Story Reels | 0.00% | $15.00 | $15.00 | $15.00 | $15.00 | $15.00 | $15.00 | $15.00 | $15.00 | $15.00 | $15.00 | $15.00 | $15.00 |
| Tampa Bay Video | 0.00% | $0.00 | $0.00 | $0.00 | $0.00 | $5.00 | $5.00 | $5.00 | $5.00 | $5.00 | $5.00 | $5.00 | $5.00 |
| Other Projects | 0.00% | $75.00 | $0.00 | $50.00 | $0.00 | $500.00 | $0.00 | $500.00 | $0.00 | $500.00 | $0.00 | $500.00 | $0.00 |
| Direct Cost of Sales | |||||||||||||
| Photo Memories | $45 | $60 | $120 | $150 | $180 | $180 | $210 | $240 | $285 | $270 | $300 | $360 | |
| News Story Reels | $0 | $0 | $0 | $0 | $0 | $0 | $60 | $150 | $240 | $375 | $600 | $975 | |
| Tampa Bay Video | $0 | $0 | $0 | $0 | $15 | $25 | $60 | $10 | $10 | $90 | $10 | $10 | |
| Other Projects | $75 | $0 | $50 | $0 | $500 | $0 | $500 | $0 | $500 | $0 | $500 | $0 | |
| Subtotal Direct Cost of Sales | $120 | $60 | $170 | $150 | $695 | $205 | $830 | $400 | $1,035 | $735 | $1,410 | $1,345 | |
| Personnel Plan | |||||||||||||
| Month 1 | Month 2 | Month 3 | Month 4 | Month 5 | Month 6 | Month 7 | Month 8 | Month 9 | Month 10 | Month 11 | Month 12 | ||
| Production Personnel | |||||||||||||
| Photo Editor | $0 | $0 | $0 | $1,500 | $1,500 | $1,500 | $1,500 | $1,500 | $1,500 | $1,500 | $1,500 | $1,500 | |
| Photo Editor | $0 | $0 | $0 | $0 | $1,500 | $1,500 | $1,500 | $1,500 | $1,500 | $1,500 | $1,500 | $1,500 | |
| Photo Editor | $0 | $0 | $0 | $0 | $0 | $0 | $0 | $0 | $1,500 | $1,500 | $1,500 | $1,500 | |
| Photo Editor (2) | $0 | $0 | $0 | $0 | $0 | $0 | $0 | $0 | $0 | $0 | $0 | $1,500 | |
| Additional Employees (3 stores) | $0 | $0 | $0 | $0 | $0 | $0 | $0 | $0 | $0 | $0 | $0 | $0 | |
| Additional Employees (5 stores) | $0 | $0 | $0 | $0 | $0 | $0 | $0 | $0 | $0 | $0 | $0 | $0 | |
| Subtotal | $0 | $0 | $0 | $1,500 | $3,000 | $3,000 | $3,000 | $3,000 | $4,500 | $4,500 | $4,500 | $6,000 | |
| Sales and Marketing Personnel | |||||||||||||
| Marketing Manager (President) | $0 | $0 | $0 | $0 | $0 | $0 | $0 | $0 | $0 | $0 | $0 | $0 | |
| News Sales Representative | $0 | $0 | $0 | $0 | $0 | $0 | $0 | $0 | $0 | $1,666 | $1,666 | $1,666 | |
| News Sales Representative Commission | $0 | $0 | $0 | $0 | $0 | $0 | $0 | $0 | $0 | $500 | $1,000 | $1,500 | |
| Other | $0 | $0 | $0 | $0 | $0 | $0 | $0 | $0 | $0 | $0 | $0 | $0 | |
| Subtotal | $0 | $0 | $0 | $0 | $0 | $0 | $0 | $0 | $0 | $2,166 | $2,666 | $3,166 | |
| General and Administrative Personnel | |||||||||||||
| Store Manager | $0 | $1,600 | $1,600 | $1,600 | $1,600 | $1,600 | $1,600 | $1,600 | $1,600 | $1,600 | $1,600 | $1,600 | |
| Store Manager Commission | $0 | $300 | $300 | $400 | $400 | $400 | $400 | $400 | $400 | $400 | $400 | $400 | |
| Store Manager (2) | $0 | $0 | $0 | $0 | $0 | $0 | $0 | $0 | $0 | $0 | $1,600 | $1,600 | |
| Store Manager Commission (2) | $0 | $0 | $0 | $0 | $0 | $0 | $0 | $0 | $0 | $0 | $400 | $400 | |
| Store Mgr/Commission (3 & 5 stores) | $0 | $0 | $0 | $0 | $0 | $0 | $0 | $0 | $0 | $0 | $0 | $0 | |
| Subtotal | $0 | $1,900 | $1,900 | $2,000 | $2,000 | $2,000 | $2,000 | $2,000 | $2,000 | $2,000 | $4,000 | $4,000 | |
| Other Personnel | |||||||||||||
| President | $2,500 | $2,500 | $2,500 | $2,500 | $2,500 | $2,500 | $3,500 | $3,500 | $3,500 | $4,000 | $4,000 | $4,000 | |
| Operations Manager | $0 | $0 | $0 | $0 | $0 | $0 | $0 | $0 | $0 | $0 | $0 | $0 | |
| Home Division Manager | $0 | $0 | $0 | $0 | $0 | $0 | $0 | $0 | $0 | $0 | $0 | $0 | |
| B2B Division Manager | $0 | $0 | $0 | $0 | $0 | $0 | $0 | $0 | $0 | $0 | $0 | $0 | |
| Other | $0 | $0 | $0 | $0 | $0 | $0 | $0 | $0 | $0 | $0 | $0 | $0 | |
| Subtotal | $2,500 | $2,500 | $2,500 | $2,500 | $2,500 | $2,500 | $3,500 | $3,500 | $3,500 | $4,000 | $4,000 | $4,000 | |
| Total People | 1 | 2 | 2 | 3 | 4 | 4 | 4 | 4 | 5 | 6 | 6 | 8 | |
| Total Payroll | $2,500 | $4,400 | $4,400 | $6,000 | $7,500 | $7,500 | $8,500 | $8,500 | $10,000 | $12,666 | $15,166 | $17,166 | |
| General Assumptions | |||||||||||||
| Month 1 | Month 2 | Month 3 | Month 4 | Month 5 | Month 6 | Month 7 | Month 8 | Month 9 | Month 10 | Month 11 | Month 12 | ||
| Plan Month | 1 | 2 | 3 | 4 | 5 | 6 | 7 | 8 | 9 | 10 | 11 | 12 | |
| Current Interest Rate | 13.00% | 13.00% | 13.00% | 13.00% | 13.00% | 13.00% | 13.00% | 13.00% | 13.00% | 13.00% | 13.00% | 13.00% | |
| Long-term Interest Rate | 0.80% | 0.80% | 0.80% | 0.80% | 0.80% | 0.80% | 0.80% | 0.80% | 0.80% | 0.80% | 0.80% | 0.80% | |
| Tax Rate | 30.00% | 25.00% | 25.00% | 25.00% | 25.00% | 25.00% | 25.00% | 25.00% | 25.00% | 25.00% | 25.00% | 25.00% | |
| Other | 0 | 0 | 0 | 0 | 0 | 0 | 0 | 0 | 0 | 0 | 0 | 0 | |
| Pro Forma Profit and Loss | |||||||||||||
| Month 1 | Month 2 | Month 3 | Month 4 | Month 5 | Month 6 | Month 7 | Month 8 | Month 9 | Month 10 | Month 11 | Month 12 | ||
| Sales | $4,000 | $4,000 | $9,000 | $10,000 | $16,150 | $15,250 | $16,400 | $18,100 | $23,300 | $23,900 | $29,100 | $37,100 | |
| Direct Cost of Sales | $120 | $60 | $170 | $150 | $695 | $205 | $830 | $400 | $1,035 | $735 | $1,410 | $1,345 | |
| Production Payroll | $0 | $0 | $0 | $1,500 | $3,000 | $3,000 | $3,000 | $3,000 | $4,500 | $4,500 | $4,500 | $6,000 | |
| Other | $0 | $0 | $0 | $0 | $0 | $0 | $0 | $0 | $0 | $0 | $0 | $0 | |
| Total Cost of Sales | $120 | $60 | $170 | $1,650 | $3,695 | $3,205 | $3,830 | $3,400 | $5,535 | $5,235 | $5,910 | $7,345 | |
| Gross Margin | $3,880 | $3,940 | $8,830 | $8,350 | $12,455 | $12,045 | $12,570 | $14,700 | $17,765 | $18,665 | $23,190 | $29,755 | |
| Gross Margin % | 97.00% | 98.50% | 98.11% | 83.50% | 77.12% | 78.98% | 76.65% | 81.22% | 76.24% | 78.10% | 79.69% | 80.20% | |
| Operating Expenses | |||||||||||||
| Sales and Marketing Expenses | |||||||||||||
| Sales and Marketing Payroll | $0 | $0 | $0 | $0 | $0 | $0 | $0 | $0 | $0 | $2,166 | $2,666 | $3,166 | |
| Advertising/Promotion | $2,000 | $1,500 | $1,500 | $2,000 | $2,000 | $2,000 | $1,500 | $1,500 | $1,500 | $1,500 | $1,500 | $1,500 | |
| Travel | $0 | $0 | $0 | $0 | $0 | $750 | $750 | $750 | $750 | $1,500 | $1,000 | $1,000 | |
| Miscellaneous | $500 | $500 | $500 | $500 | $500 | $500 | $1,000 | $1,000 | $1,000 | $1,000 | $1,000 | $1,500 | |
| Total Sales and Marketing Expenses | $2,500 | $2,000 | $2,000 | $2,500 | $2,500 | $3,250 | $3,250 | $3,250 | $3,250 | $6,166 | $6,166 | $7,166 | |
| Sales and Marketing % | 62.50% | 50.00% | 22.22% | 25.00% | 15.48% | 21.31% | 19.82% | 17.96% | 13.95% | 25.80% | 21.19% | 19.32% | |
| General and Administrative Expenses | |||||||||||||
| General and Administrative Payroll | $0 | $1,900 | $1,900 | $2,000 | $2,000 | $2,000 | $2,000 | $2,000 | $2,000 | $2,000 | $4,000 | $4,000 | |
| Sales and Marketing and Other Expenses | $0 | $0 | $0 | $0 | $0 | $0 | $0 | $0 | $0 | $0 | $0 | $0 | |
| Depreciation | $0 | $0 | $0 | $0 | $0 | $0 | $0 | $0 | $0 | $0 | $0 | $0 | |
| Leased Equipment | $0 | $0 | $0 | $0 | $0 | $0 | $0 | $0 | $0 | $0 | $0 | $0 | |
| Utilities | $100 | $100 | $100 | $100 | $100 | $100 | $100 | $100 | $100 | $100 | $100 | $160 | |
| Insurance | $80 | $80 | $80 | $80 | $80 | $80 | $80 | $80 | $80 | $80 | $80 | $160 | |
| Rent | $750 | $750 | $750 | $750 | $750 | $750 | $750 | $750 | $750 | $750 | $750 | $1,500 | |
| Payroll Taxes | 15% | $0 | $0 | $0 | $0 | $0 | $0 | $0 | $0 | $0 | $0 | $0 | $0 |
| Other General and Administrative Expenses | $0 | $0 | $0 | $0 | $0 | $0 | $0 | $0 | $0 | $0 | $0 | $0 | |
| Total General and Administrative Expenses | $930 | $2,830 | $2,830 | $2,930 | $2,930 | $2,930 | $2,930 | $2,930 | $2,930 | $2,930 | $4,930 | $5,820 | |
| General and Administrative % | 23.25% | 70.75% | 31.44% | 29.30% | 18.14% | 19.21% | 17.87% | 16.19% | 12.58% | 12.26% | 16.94% | 15.69% | |
| Other Expenses: | |||||||||||||
| Other Payroll | $2,500 | $2,500 | $2,500 | $2,500 | $2,500 | $2,500 | $3,500 | $3,500 | $3,500 | $4,000 | $4,000 | $4,000 | |
| Consultants | $0 | $0 | $0 | $0 | $0 | $0 | $0 | $0 | $0 | $0 | $0 | $0 | |
| Contract/Consultants | $0 | $0 | $0 | $0 | $0 | $0 | $0 | $0 | $0 | $0 | $0 | $0 | |
| Total Other Expenses | $2,500 | $2,500 | $2,500 | $2,500 | $2,500 | $2,500 | $3,500 | $3,500 | $3,500 | $4,000 | $4,000 | $4,000 | |
| Other % | 62.50% | 62.50% | 27.78% | 25.00% | 15.48% | 16.39% | 21.34% | 19.34% | 15.02% | 16.74% | 13.75% | 10.78% | |
| Total Operating Expenses | $5,930 | $7,330 | $7,330 | $7,930 | $7,930 | $8,680 | $9,680 | $9,680 | $9,680 | $13,096 | $15,096 | $16,986 | |
| Profit Before Interest and Taxes | ($2,050) | ($3,390) | $1,500 | $420 | $4,525 | $3,365 | $2,890 | $5,020 | $8,085 | $5,569 | $8,094 | $12,769 | |
| EBITDA | ($2,050) | ($3,390) | $1,500 | $420 | $4,525 | $3,365 | $2,890 | $5,020 | $8,085 | $5,569 | $8,094 | $12,769 | |
| Interest Expense | $54 | $44 | $42 | $40 | $38 | $36 | $34 | $32 | $30 | $28 | $26 | $24 | |
| Taxes Incurred | ($631) | ($858) | $365 | $95 | $1,122 | $832 | $714 | $1,247 | $2,014 | $1,385 | $2,017 | $3,186 | |
| Net Profit | ($1,473) | ($2,575) | $1,094 | $285 | $3,366 | $2,497 | $2,142 | $3,741 | $6,042 | $4,156 | $6,051 | $9,559 | |
| Net Profit/Sales | -36.82% | -64.38% | 12.15% | 2.85% | 20.84% | 16.37% | 13.06% | 20.67% | 25.93% | 17.39% | 20.80% | 25.77% | |
| Pro Forma Cash Flow | |||||||||||||
| Month 1 | Month 2 | Month 3 | Month 4 | Month 5 | Month 6 | Month 7 | Month 8 | Month 9 | Month 10 | Month 11 | Month 12 | ||
| Cash Received | |||||||||||||
| Cash from Operations | |||||||||||||
| Cash Sales | $4,000 | $4,000 | $9,000 | $10,000 | $16,150 | $15,250 | $16,400 | $18,100 | $23,300 | $23,900 | $29,100 | $37,100 | |
| Subtotal Cash from Operations | $4,000 | $4,000 | $9,000 | $10,000 | $16,150 | $15,250 | $16,400 | $18,100 | $23,300 | $23,900 | $29,100 | $37,100 | |
| Additional Cash Received | |||||||||||||
| Sales Tax, VAT, HST/GST Received | 0.00% | $0 | $0 | $0 | $0 | $0 | $0 | $0 | $0 | $0 | $0 | $0 | $0 |
| New Current Borrowing | $5,000 | $0 | $0 | $0 | $0 | $0 | $0 | $0 | $0 | $0 | $0 | $0 | |
| New Other Liabilities (interest-free) | $0 | $0 | $0 | $0 | $0 | $0 | $0 | $0 | $0 | $0 | $0 | $0 | |
| New Long-term Liabilities | $0 | $0 | $0 | $0 | $0 | $0 | $0 | $0 | $0 | $0 | $0 | $0 | |
| Sales of Other Current Assets | $0 | $0 | $0 | $0 | $0 | $0 | $0 | $0 | $0 | $0 | $0 | $0 | |
| Sales of Long-term Assets | $0 | $0 | $0 | $0 | $0 | $0 | $0 | $0 | $0 | $0 | $0 | $0 | |
| New Investment Received | $0 | $0 | $0 | $0 | $0 | $0 | $0 | $0 | $0 | $0 | $0 | $0 | |
| Subtotal Cash Received | $9,000 | $4,000 | $9,000 | $10,000 | $16,150 | $15,250 | $16,400 | $18,100 | $23,300 | $23,900 | $29,100 | $37,100 | |
| Expenditures | Month 1 | Month 2 | Month 3 | Month 4 | Month 5 | Month 6 | Month 7 | Month 8 | Month 9 | Month 10 | Month 11 | Month 12 | |
| Expenditures from Operations | |||||||||||||
| Cash Spending | $2,500 | $4,400 | $4,400 | $6,000 | $7,500 | $7,500 | $8,500 | $8,500 | $10,000 | $12,666 | $15,166 | $17,166 | |
| Bill Payments | $528 | $3,795 | $2,156 | $3,344 | $3,632 | $5,571 | $5,082 | $6,050 | $5,539 | $7,866 | $7,366 | $8,106 | |
| Subtotal Spent on Operations | $3,028 | $8,195 | $6,556 | $9,344 | $11,132 | $13,071 | $13,582 | $14,550 | $15,539 | $20,532 | $22,532 | $25,272 | |
| Additional Cash Spent | |||||||||||||
| Sales Tax, VAT, HST/GST Paid Out | $0 | $0 | $0 | $0 | $0 | $0 | $0 | $0 | $0 | $0 | $0 | $0 | |
| Principal Repayment of Current Borrowing | $0 | $980 | $185 | $185 | $185 | $185 | $185 | $185 | $185 | $185 | $185 | $185 | |
| Other Liabilities Principal Repayment | $0 | $0 | $0 | $0 | $0 | $0 | $0 | $0 | $0 | $0 | $0 | $0 | |
| Long-term Liabilities Principal Repayment | $0 | $0 | $0 | $0 | $0 | $0 | $0 | $0 | $0 | $0 | $0 | $0 | |
| Purchase Other Current Assets | $0 | $0 | $0 | $0 | $0 | $0 | $0 | $0 | $0 | $0 | $0 | $0 | |
| Purchase Long-term Assets | $0 | $0 | $0 | $0 | $0 | $0 | $0 | $0 | $0 | $0 | $0 | $0 | |
| Dividends | $0 | $0 | $0 | $0 | $0 | $0 | $0 | $0 | $0 | $0 | $0 | $0 | |
| Subtotal Cash Spent | $3,028 | $9,175 | $6,741 | $9,529 | $11,317 | $13,256 | $13,767 | $14,735 | $15,724 | $20,717 | $22,717 | $25,457 | |
| Net Cash Flow | $5,972 | ($5,175) | $2,259 | $471 | $4,833 | $1,994 | $2,633 | $3,365 | $7,576 | $3,183 | $6,383 | $11,643 | |
| Cash Balance | $20,072 | $14,897 | $17,156 | $17,627 | $22,460 | $24,453 | $27,086 | $30,451 | $38,027 | $41,210 | $47,593 | $59,236 | |
| Pro Forma Balance Sheet | |||||||||||||
| Month 1 | Month 2 | Month 3 | Month 4 | Month 5 | Month 6 | Month 7 | Month 8 | Month 9 | Month 10 | Month 11 | Month 12 | ||
| Assets | Starting Balances | ||||||||||||
| Current Assets | |||||||||||||
| Cash | $14,100 | $20,072 | $14,897 | $17,156 | $17,627 | $22,460 | $24,453 | $27,086 | $30,451 | $38,027 | $41,210 | $47,593 | $59,236 |
| Inventory | $0 | $880 | $820 | $650 | $500 | $805 | $600 | $913 | $513 | $1,139 | $1,404 | $1,551 | $1,480 |
| Other Current Assets | $500 | $500 | $500 | $500 | $500 | $500 | $500 | $500 | $500 | $500 | $500 | $500 | $500 |
| Total Current Assets | $14,600 | $21,452 | $16,217 | $18,306 | $18,627 | $23,765 | $25,553 | $28,499 | $31,464 | $39,665 | $43,113 | $49,644 | $61,216 |
| Long-term Assets | |||||||||||||
| Long-term Assets | $0 | $0 | $0 | $0 | $0 | $0 | $0 | $0 | $0 | $0 | $0 | $0 | $0 |
| Accumulated Depreciation | $0 | $0 | $0 | $0 | $0 | $0 | $0 | $0 | $0 | $0 | $0 | $0 | $0 |
| Total Long-term Assets | $0 | $0 | $0 | $0 | $0 | $0 | $0 | $0 | $0 | $0 | $0 | $0 | $0 |
| Total Assets | $14,600 | $21,452 | $16,217 | $18,306 | $18,627 | $23,765 | $25,553 | $28,499 | $31,464 | $39,665 | $43,113 | $49,644 | $61,216 |
| Liabilities and Capital | Month 1 | Month 2 | Month 3 | Month 4 | Month 5 | Month 6 | Month 7 | Month 8 | Month 9 | Month 10 | Month 11 | Month 12 | |
| Current Liabilities | |||||||||||||
| Accounts Payable | $400 | $3,724 | $2,045 | $3,225 | $3,446 | $5,403 | $4,880 | $5,868 | $5,277 | $7,621 | $7,098 | $7,762 | $9,960 |
| Current Borrowing | $0 | $5,000 | $4,020 | $3,835 | $3,650 | $3,465 | $3,280 | $3,095 | $2,910 | $2,725 | $2,540 | $2,355 | $2,170 |
| Other Current Liabilities | $0 | $0 | $0 | $0 | $0 | $0 | $0 | $0 | $0 | $0 | $0 | $0 | $0 |
| Subtotal Current Liabilities | $400 | $8,724 | $6,065 | $7,060 | $7,096 | $8,868 | $8,160 | $8,963 | $8,187 | $10,346 | $9,638 | $10,117 | $12,130 |
| Long-term Liabilities | $0 | $0 | $0 | $0 | $0 | $0 | $0 | $0 | $0 | $0 | $0 | $0 | $0 |
| Total Liabilities | $400 | $8,724 | $6,065 | $7,060 | $7,096 | $8,868 | $8,160 | $8,963 | $8,187 | $10,346 | $9,638 | $10,117 | $12,130 |
| Paid-in Capital | $15,000 | $15,000 | $15,000 | $15,000 | $15,000 | $15,000 | $15,000 | $15,000 | $15,000 | $15,000 | $15,000 | $15,000 | $15,000 |
| Retained Earnings | ($800) | ($800) | ($800) | ($800) | ($800) | ($800) | ($800) | ($800) | ($800) | ($800) | ($800) | ($800) | ($800) |
| Earnings | $0 | ($1,473) | ($4,048) | ($2,954) | ($2,669) | $697 | $3,194 | $5,336 | $9,078 | $15,119 | $19,275 | $25,327 | $34,886 |
| Total Capital | $14,200 | $12,727 | $10,152 | $11,246 | $11,531 | $14,897 | $17,394 | $19,536 | $23,278 | $29,319 | $33,475 | $39,527 | $49,086 |
| Total Liabilities and Capital | $14,600 | $21,452 | $16,217 | $18,306 | $18,627 | $23,765 | $25,553 | $28,499 | $31,464 | $39,665 | $43,113 | $49,644 | $61,216 |
| Net Worth | $14,200 | $12,727 | $10,152 | $11,246 | $11,531 | $14,897 | $17,394 | $19,536 | $23,278 | $29,319 | $33,475 | $39,527 | $49,086 |


