
Chef Vending
Executive Summary
Introduction
Chef Vending, LLC is a family start-up business that specializes in importing vending machines and commercial food & beverage equipment from Spain. We will penetrate the vending industry with innovative, first to market, high quality vending machines. We will establish our own vending routes in the Southern and Central Florida region. We also plan to participate in the $321 billion food & beverage industry by supplying high-quality innovative equipment. With the establishment of one strategic alliance with a national brand name in either of our vending lines, we expect to easily exceed our financial forecasts.
The Company
Chef Vending’s mission is to be the leader in introducing innovative, quality vending machines and restaurant equipment to the market. Through close customer contact and excellent relationships, we will meet the needs of our customers wherever we can.
Chef Vending, LLC, is a privately-held Florida corporation and maintains an office and a small warehouse in a mixed-use area of North Miami Beach, Florida.
Three of the four investors in the company have full operational responsibility. Mauricio Ordonez and Javier Palmera, the co-founders, have both entrepreneurial and industry experience. Charles Mulligan brings operational management and financial skills to the operation.
The Products
Chef Vending will have two product lines, each for the various markets it serves. Our vending products line will include our unique Sandwich Express machine, our Fresh Orange Juice machine and our Multi-line Dispenser. Our restaurant equipment products will be toasters, espresso makers, and fresh juice squeezers.
Most of our products, such as Sandwich Express are innovative machines that have functions and advantages not found in today’s common vending machines, thus providing Chef Vending a competitive advantage over more established competitors.
We plan to aggressively enhance our existing line in the future. Our immediate plans are to include a larger model of Sandwich Express that will offer a greater variety of sandwiches, and a more diverse product line, such as pizza. Other products are in the exploratory phase.
We are also pursuing supplier relationships with large nationally-branded juice and sandwich manufacturers, to customize our machines to their products. This would enable Chef Vending to supply machines to national companies and allow them to brand the machines with their product lines.
The Market
Revenue from U.S. vending consumable merchandise was $24.5 billion last year, an increase of 4.9% over the previous year, according to the Automatic Merchandiser magazine’s latest State of the Vending Industry Report. Small companies, with sales of less than $1 million, accounted for 5.8% of the market and had projected sales of $1.35 billion. Three quarters of all vending operators are classified in the small category.
Within the industry, snacks and cold beverages are the largest product segments and these two categories are the driving force of the industry. The food category grew at a rate of 7% last year, according to the Automatic Merchandiser. Cold storage machines grew at an even more impressive 42% last ylear, with this growth coming at the expense of shelf-stable products.
According to the National Restaurant Association, revenues from restaurants are expected to reach $321 billion. This is a large and healthy industry in our economy, and suppliers to this industry are expected to benefit from this growth.
All of this indicates that a fast moving, innovative company that can introduce enhanced products to vending machine/restaurant equipment customers stand to gain significant market share in a relatively short time span.
Chef Vending will market its machines to three distinct market segments including; distributors, branded sandwich and juice manufacturers, and end users. For our restaurant equipment business we will focus on restaurants and hotels and equipment supply companies.
Financial Considerations
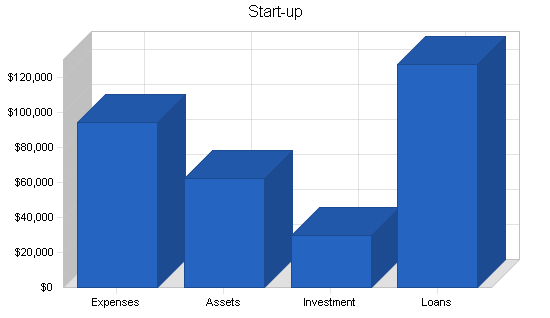
The company has an initial start-up cost of approximately $157,000 of which $125,000 will come from a ten year SBA loan. Short-term borrowing will provide us with an additional $2,500 and the rest will be provided by investment capital.
We project our monthly break even will by roughly $93,000 or 27 vending units. The attractiveness of our innovative vending machines and restaurant equipment will provide us with a sales level far above this break-even point. We expect to generate $500,000 of net profit on $2.8 million worth of sales in the first year.
1.1 Objectives
Chef Vending’s objectives in our first year of operation are:
- Sell 400 vending machines.
- Directly place 10 vending machines, that we will operate, in the South Florida area.
- Achieve $500,000 in sales in our restaurant equipment line.
For the following two years our growth objectives are:
- Grow our vending machine and equipment business by 20% each year.
- Grow revenues by 25% in our directly operated vending machines.
1.2 Mission
Chef Vending’s mission is to be the leader in introducing innovative, quality vending machines and restaurant equipment to the market. Through close customer contact and excellent relationships, we will meet the needs of our customers wherever we can. Chef Vending will secure sufficient profits from free cash flow from operations, to sustain its stability and finance future growth. We will add value to our community by maintaining a friendly, familial work environment.
1.3 Keys to Success
As a start-up company, new to the industry, and introducing new products, we must be focused and work hard to create acceptance for ourselves and our products within the marketplace. The keys to our success are:
- Quality support and service, recognizing that Chef Vending’s success depends most critically on the relationships it’s able to create.
- Innovative, quality products that are able to both expand existing markets and create new ones for our customers.
- Steady, disciplined pattern of growth.
- Our customers and keeping them happy.
Company Summary
Chef Vending, LLC, is a family-owned and operated import company that focuses on importing innovative vending machines and restaurant equipment from Spain. By serving a niche segment of the $24.5 billion dollar vending industry, we will position Chef Vending as a high-quality, innovative company, that creates value for its customers.
Located in North Miami Beach, Florida, three of the four investors have full operational responsibility. Mauricio Ordonez and Javier Palmera, the co-founders, have both entrepreneurial and industry experience. Charles Mulligan brings operational management and financial skills to the operation.
2.1 Company Ownership
Chef Vending, LLC, is a privately-held Florida corporation. Chef Vending is owned by three of its key employees, and one financial investor. The ownership breakdown is as follows:
- Mauricio Ordonez- 40%
- Javier Palmera- 20%
- Charles Mulligan- 20%
- Pedro Herrera- 20%
2.2 Start-up Summary
Our start-up costs, listed below, have been financed to date by the investment from its owners.
| Start-up | |
| Requirements | |
| Start-up Expenses | |
| Cash Purchases | $2,500 |
| Utilities | $855 |
| Repairs & Maintanence | $2,388 |
| Professional Fees | $500 |
| Insurance | $921 |
| Rent | $7,136 |
| Travel | $9,271 |
| Inventory | $43,086 |
| Telephone | $1,166 |
| Postage | $111 |
| Office Equipment/Supplies | $4,645 |
| Marketing/Advertising | $15,587 |
| Freight | $4,926 |
| Other | $1,400 |
| Total Start-up Expenses | $94,492 |
| Start-up Assets | |
| Cash Required | $25,000 |
| Start-up Inventory | $37,508 |
| Other Current Assets | $0 |
| Long-term Assets | $0 |
| Total Assets | $62,508 |
| Total Requirements | $157,000 |
| Start-up Funding | |
| Start-up Expenses to Fund | $94,492 |
| Start-up Assets to Fund | $62,508 |
| Total Funding Required | $157,000 |
| Assets | |
| Non-cash Assets from Start-up | $37,508 |
| Cash Requirements from Start-up | $25,000 |
| Additional Cash Raised | $0 |
| Cash Balance on Starting Date | $25,000 |
| Total Assets | $62,508 |
| Liabilities and Capital | |
| Liabilities | |
| Current Borrowing | $0 |
| Long-term Liabilities | $125,000 |
| Accounts Payable (Outstanding Bills) | $2,500 |
| Other Current Liabilities (interest-free) | $0 |
| Total Liabilities | $127,500 |
| Capital | |
| Planned Investment | |
| Investor 1 | $10,500 |
| Investor 2 | $9,000 |
| Investor 3 | $5,000 |
| Investor 4 | $5,000 |
| Additional Investment Requirement | $0 |
| Total Planned Investment | $29,500 |
| Loss at Start-up (Start-up Expenses) | ($94,492) |
| Total Capital | ($64,992) |
| Total Capital and Liabilities | $62,508 |
| Total Funding | $157,000 |
2.3 Company Locations and Facilities
Chef Vending maintains an office and a small warehouse in a mixed-use area of North Miami Beach, Florida. We maintain a showroom, where we provide customers with product demonstrations, a warehouse, where we keep an inventory of machines and supplies, and an administrative area to handle the business functions.

Products
Chef Vending imports a variety of innovative products that serve the needs of special segments of the market. These machines all aim to expand existing sales and open new lines of sales for our customers.
3.1 Product Description
Chef Vending has three vending machines and three lines of restaurant equipment.
Our vending products are:
- Sandwich Express– This machine stores, in a refrigerated unit, up to 140 pre-packaged sandwiches. When an order is placed, the machine sends a sandwich from the refrigerator to the toaster, toasts the sandwich for a pre-determined time, and at a predetermined temperature. In approximately 60 seconds, a fresh, delicious, hot sandwich is served.
- Fresh Orange Juice (OJ) Machine– This machine, as its name implies, delivers a chilled 7 oz. cup of fresh squeezed orange juice. In a refrigerated unit, the machine stores up to 140 lbs. of juice oranges. This will yield approximately 110, 7 oz. cups. When an order is placed, the machine will dispense, from its refrigerated container, whole oranges that will be sliced in half, and then each half is pulverized for its juice. The juice will run through a filtering system to keep out the seeds and most of the pulp, to finally provide the customer with a 100% all natural cup of OJ in approximately 30 seconds.
- Multi-line– These versatile, low-cost, easy-to-maintain machines provide the end user with a variety of vending options, from phone cards to disposable cameras. Chef Vending is able to provide customers with machines that have either two, three, or four product lines; this will provide flexibility to maximize unit revenue.
Our restaurant equipment products are:
- Toasters– Coming with either a single or double toaster, these panini-type toasters provide the commercial establishment with an automatic machine that frees up service personnel for other customer service tasks. These machines will toast sandwiches, pastries, and a variety of other menu items, in a predetermined time and temperature, automatically dispensing the food item when done.
- Espresso Maker– This high-quality espresso maker makes single-serve cups of delicious gourmet coffee from pre-packaged coffee pods. These pods provide great benefit to the owner by reducing the cost of measuring for each new order, and eliminating the waste associated with the traditional methods.
- Fresh Juice Squeezer– This commercial grade machine will squeeze fresh, whole-juice oranges to allow the owner to sell a cup of fresh-squeezed orange juice.
3.2 Competitive Comparison
Both our Sandwich Express and Fresh OJ machines will be first to market. Currently, the market only provides a sandwich, or other hot meals, that must then be microwaved. We will be the first to market a vending machine that both toasts the sandwich, and then delivers it hot to the customer. Our machine’s products will enjoy a qualitative advantage over microwaved products as well.
For juice drinks, the market only offers bottled or canned juices for a customer to purchase. Our OJ machine will literally squeeze a fresh cup each and every vend. A qualitative advantage over other machines is the fact that the product is free of additives and refined sugars.
There are a number of similar multi-line machines on the market today. We will offer the customer a quality product at prices below the prevailing market rates. Our machines also enjoy distinctive packaging that will compete favorably with the products currently in the market.
We will also be first to market a fully automated line of toasters. Currently, the toasters on the market require the food service worker to manually monitor the cooking process, where ours automatically toast and dispense, freeing the service worker to engage in other customer service tasks.
Our espresso coffee makers will compete with the existing espresso makers on the market today. Our machines will offer the pre-packaged coffee pod which will be a cost savings to the end user. We will also compete with an aggressive pricing strategy.
Our fresh juice machines will be priced aggressively as well, in order to better compete in the market.
3.3 Sales Literature
Sales brochures have been developed as part of our start-up expenses.
3.4 Sourcing
Chef Vending imports its machines from Spain. For oranges and sandwiches, we contract with local suppliers.
3.5 Technology
Chef Vending’s mission is to be the company that introduces innovative products to the market. To achieve this, we will search out the latest in food preparation technology in the vending and equipment business. As first to market, we currently enjoy a technological advantage over the competition.
3.6 Future Products
To enhance our existing line, we are looking at a larger model of Sandwich Express that will offer a greater variety of sandwiches, and a more diverse product line, such as pizza.
We are also pursuing supplier relationships with large nationally-branded juice and sandwich manufacturers, to customize our machines to their products. This would enable Chef Vending to supply machines to national companies and allow them to brand the machines with their product lines.
As we increase our presence in the equipment business, we will continuously search out products to expand our existing line. A key component of this will be the feedback from our customer base.
Market Analysis Summary
Revenue from U.S. vending consumable merchandise was $24.5 billion in 1999, an increase of 4.9% over 1998, according to the Automatic Merchandiser magazine’s State of the Vending Industry Report in August 2000. This figure includes both machines and products. Small companies, with sales of less than $1 million, accounted for 5.8% of the market and had projected sales for 1999 of $1.35 billion. Three quarters of all vending operators are classified in the small category.
Within the industry, snacks and cold beverages are the largest product segments, representing 29% and 25% of the industry, respectively. These two segments are the driving force of the industry. The food category grew at a rate of 7% last year, according to the Automatic Merchandiser. Cold storage machines grew at an even more impressive 42% in 1999, with this growth coming at the expense of shelf-stable products.
Broader economic and cultural trends are also positively impacting the industry. Food sales away from home have become a larger part of total food sales in the U.S. since the 50’s, according to the Department of Agriculture. Technomic, a Chicago-based research firm, reports an increase in demand for takeout meals as the percentage of two-parent households declines, along with the decline of the three regular sit down meals per day.
Consumer preferences about taste, price, nutrition, convenience, and technology are changing. These changes favor the vending industry, which now has the opportunity to spot these trends and develop their markets.
According to the National Restaurant Association, revenues from restaurants are expected to reach $321 billion in 1999. This is a large and healthy industry in our economy, and suppliers to this industry are expected to benefit from this growth.
4.1 Market Segmentation
Chef Vending will market its machines to three distinct market segments:
- End Users– Operators that have their own vending routes who wish to expand their product selections. Included in this category are large institutional food service companies that engage in vending operations as part of their overall food service business.
- Distributors– Companies that supply operators with machines and supplies for their operations.
- Branded Sandwich Manufacturers and Branded Juice Companies– By working closely with these companies, we will customize our machines to meet their specifications and to allow them to “brand” our machines with their products. They will either supply the machines or sell them to their customers who will buy product supply for the machines from these companies.
We have two markets for our equipment business:
- Restaurants and Hotels – End users who benefit from the equipment purchased.
- Equipment Supply Companies– These are large supply houses that offer a variety of equipment to the food & beverage industry.
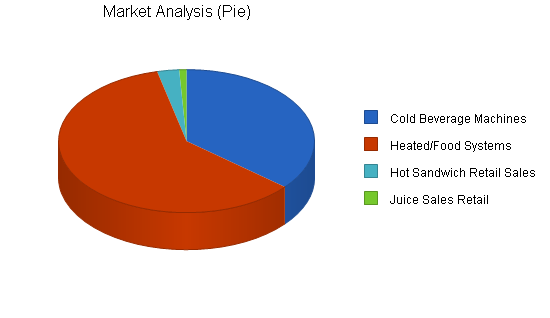
The following Market Analysis table and chart are broken down by general market segments, versus the specifics listed above.
| Market Analysis | |||||||
| Year 1 | Year 2 | Year 3 | Year 4 | Year 5 | |||
| Potential Customers | Growth | CAGR | |||||
| Cold Beverage Machines | 4% | 900 | 936 | 973 | 1,012 | 1,052 | 3.98% |
| Heated/Food Systems | 5% | 1,500 | 1,575 | 1,654 | 1,737 | 1,824 | 5.01% |
| Hot Sandwich Retail Sales | 5% | 69 | 72 | 76 | 80 | 84 | 5.23% |
| Juice Sales Retail | 4% | 23 | 24 | 25 | 26 | 27 | 4.09% |
| Total | 4.64% | 2,492 | 2,607 | 2,728 | 2,855 | 2,987 | 4.64% |
4.2 Industry Analysis
The U.S vending industry is divided into three main segments:
- Operators– Companies that buy and place vending machines on their routes, sell the product and service the machine, and range from small family businesses to large national companies.
- Manufacturers– Companies that manufacture machines for sale to operators.
- Distributors– The link between the manufacturer and the operator. Supplies the market with both machines and products for operators.
The food & beverage industry is divided into similar segments:
- Food & Beverage Establishments– This segment covers the entire spectrum of bars and restaurants.
- Suppliers– Companies that supply the establishments with all of their food, paper, and equipment needs.
- Supply Houses– Acting as a distributor, these firms supply an area with their required supply needs.
4.2.1 Competition and Buying Patterns
Both the food & beverage and vending industries are highly competitive. Price, Return On Investment (ROI), reliability, and customer service are the factors most effecting a buying decision.
There are many large name brand companies with vending machines in the market. We will focus on creating a niche market for our innovative machines, to compete with larger more recognizable names. By being first to market, we have a unique opportunity to brand ourselves and our machines.
Buying patterns are fairly consistent across the year.
4.2.2 Distribution Patterns
Distribution in the vending industry typically runs through a distributor. These distributors will carry a brand of machine for sale in a defined geographic region. In some instances, manufacturers sell direct to operators or end users. Another form of distribution is to be a supplier to a nationally branded company. Similar distribution patterns are established in the food & beverage industry.
4.3 Target Market Segment Strategy
Chef Vending’s initial strategy is to offer all of our products to all segments of the market. We will focus on both the end user and the distributor initially, as the strategy to secure accounts with the nationally branded companies will take some time to realize. We will reach our target market in one of three ways. First, we have begun a small advertising scheme in industry trade publications highlighting the many features and benefits of our products. Secondly, we have joined the National Automatic Merchandiser Association (NAMA) and have introduced ourselves and our products to distributors and end users at the NAMA annual convention in October, 2000; we will also participate in their Southeast regional show in South Carolina and in their national show next year. Finally, we will pursue personalized relationships with contacts developed at these shows and with regional companies in the South and Central Florida area.
For equipment sales, we will focus on end users and distributors in the South and Central Florida regions. As we gain market share in these markets we will expand geographically.
4.3.1 Market Needs
The principle market need we will be addressing will be revenue. Each of our machines will act to expand existing sales for operators, and in many cases will create new markets entirely. For the operator that is already vending snacks, a high end sandwich will enable this operator to expand his or her sales without cannibalizing existing sales. For the coffee vendor, a perfect compliment to a gourmet cup of vended coffee will be a fresh cup of orange juice. By creating a new untapped market, the operator will be able to expand revenue streams beyond their existing accounts. Another important need we will fill with our multi-line machines and our equipment, will be price. As we will be competing with existing supplies already in the market, we will price our products to be highly competitive in order to attract clients.
4.3.2 Market Trends
Growth rates in both the vending industry and the restaurant industry remain strong. This growth is fueled by the changes in the workplace and workforce that are causing workers to consume more of their meals away from home. Away from home food sales are expected to increase by 53%, according to NAMA.
As more and more consumers eat away from home, the demand for higher quality is also growing. Vendors are now offering a full line of packaged frozen meals in their machines. Margins will increase as premium prices are being placed on branded, high-quality products.
Demographic trends are affecting the industry. A large group of young adults, who mainly grew up on fast food, have emerged as an economic force. This group’s perceptions on fast food, technology, and vending, will have a positive impact in the vending business. Furthermore, overall population growth rates, and immigration trends particularly, will also have a tremendous economic impact on the vending industry. Much of the growth in both of these areas will be in the Southeast, where Chef Vending is poised to capitalize on these trends.
4.3.3 Market Growth
Studies by Automatic Merchandiser reflect an industry growth rate of approximately 4.8% over the last five years, matching the overall growth of the U.S. economy.
Strategy and Implementation Summary
Chef Vending will achieve its sales targets through a combination of relationship building and aggressive pricing. Our initial targets will be medium-sized operators and distributors who have the capital to invest in our machines. We will continue to participate in industry trade shows and expand our advertising budget when the funds become available. Concurrent with this strategy, we will establish relationships with larger brand name companies to become a supplier of choice.
5.1 Value Proposition
Chef Vending’s customers will derive immediate and lasting value from our products. Our vending machines, as shown earlier, will both expand existing markets and create new ones. The ROI exceeds the industry norm of 12-18 months. The quality of the products, as well as the attractive and distinctive design features, will work to satisfy existing customers and to attract new ones.
5.2 Competitive Edge
Chef Vending will enjoy the traditional benefits of first to market. We will attempt to leverage this position to establish and solidify our brand in the market. As a small company looking to establish itself, we will be attentive and flexible in meeting our customer’s demands.
For our other products we have design features that will make us very competitive. In addition to these design features, we will also be competing on price.
5.3 Marketing Strategy
Our marketing strategy will emphasize the strengths of both our company and our products. We will position ourselves as an aggressive, innovative company that supplies the market with new, high-quality products. We will position ourselves in trade shows, within industry publications, and the Internet, to reinforce this marketing strategy. Our brochures, letterhead, and business correspondence will further reinforce these concepts.
We also recognize that it costs six times more to attract a customer than to retain one. To that end, we will operate under the principle that our best marketing is an exceedingly satisfied customer. While the industries we operate in are large, reputations play an important part.
5.3.1 Promotion Strategy
Chef Vending will participate each year in two NAMA-sponsored trade shows. We will also attend a number of local and regional trade shows and distributor open houses to promote our product lines. During the year we will expand our advertising budget to allow us greater and higher quality exposure on the trade publications. We are also positioned on the Internet at www.chefvending.com to allow our company greater exposure and easier communication with our customers.
5.3.2 Distribution Strategy
Chef Vending will pursue distribution agreements with large regional and national distributors. Until these agreements are in place, we will sell directly to the operator. We are also pursuing relationships with nationally-branded companies to supply them with machines for their products.
5.3.3 Marketing Programs
Chef Vending’s most important marketing program is our participation at the NAMA trade show. We were able to introduce our machines to important end users and distributors. We followed up with the contacts through a mailing campaign and follow-up phone calls. We will measure how many of these contacts we are able to turn into accounts, and track the volume of each of these accounts.
Another key component of our marketing plan is the relationships we are able to build within our local marketplace. Everyone involved spends time each day developing and cultivating relationships with local companies. We will measure our success in two ways. First, we will track the number of contacts that we turn into customers and the volume of their business. Secondly, we will track these contacts into the number of machines we will be able to place into the marketplace and the volume that each location is able to produce.
Chef Vending will also expand its advertising budget, participate in regional and local shows and open houses, and seek out innovative creative ways in which to market our company.
5.3.4 Pricing Strategy
Chef Vending will pursue two distinct pricing strategies. For our Sandwich Express and Fresh OJ machines, we will price these machines at the higher end of the market. For the other machines, we will compete aggressively in our pricing strategies in order to attract and retain new customers. Below is a table outlining the pricing strategy of Chef Vending.
| Machine | Cost |
| Sandwich Express | $9,500 |
| Fresh OJ | $6,500/$7,500 |
| Multi-line Machines | $2,750/$3,800 |
| Toaster | $2,750/$3,800 |
| Espresso Maker | $250 |
| Juice Machine | $4,200 |
5.4 Sales Strategy
We will identify large- and medium-sized regional and national operators, distributors, and manufacturers as our primary targets. We will focus our efforts on the key decision makers at each company. We will also look to our customers as important sources of industry information and create new leads from them.
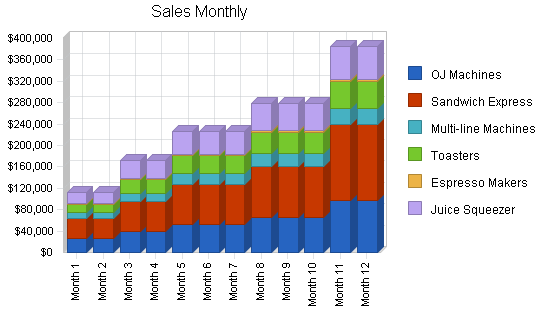
5.4.1 Sales Forecast
The following table and chart reflect the forecasted sales for Chef Vending. We are forecasting sales growth of 20% a year for our vending and equipment sales, and 25% for the vending routes that we will establish and manage ourselves.
| Sales Forecast | |||
| Year 1 | Year 2 | Year 3 | |
| Unit Sales | |||
| OJ Machines | 104 | 125 | 150 |
| Sandwich Express | 104 | 125 | 150 |
| Multi-line Machines | 245 | 294 | 353 |
| Toasters | 122 | 146 | 176 |
| Espresso Makers | 122 | 146 | 176 |
| Juice Squeezer | 122 | 146 | 176 |
| Total Unit Sales | 819 | 983 | 1,179 |
| Unit Prices | Year 1 | Year 2 | Year 3 |
| OJ Machines | $6,500.00 | $6,695.00 | $6,895.85 |
| Sandwich Express | $9,500.00 | $9,785.00 | $10,078.55 |
| Multi-line Machines | $1,000.00 | $1,030.00 | $1,060.90 |
| Toasters | $3,275.00 | $3,373.25 | $3,474.45 |
| Espresso Makers | $250.00 | $257.50 | $265.23 |
| Juice Squeezer | $4,200.00 | $4,326.00 | $4,455.78 |
| Sales | |||
| OJ Machines | $676,000 | $835,536 | $1,032,722 |
| Sandwich Express | $988,000 | $1,221,168 | $1,509,364 |
| Multi-line Machines | $245,000 | $302,820 | $374,286 |
| Toasters | $399,550 | $493,844 | $610,391 |
| Espresso Makers | $30,500 | $37,698 | $46,595 |
| Juice Squeezer | $512,400 | $633,326 | $782,791 |
| Total Sales | $2,851,450 | $3,524,392 | $4,356,149 |
| Direct Unit Costs | Year 1 | Year 2 | Year 3 |
| OJ Machines | $4,700.00 | $4,841.00 | $4,986.23 |
| Sandwich Express | $6,326.92 | $6,516.73 | $6,712.23 |
| Multi-line Machines | $500.00 | $515.00 | $530.45 |
| Toasters | $1,650.00 | $1,699.50 | $1,750.49 |
| Espresso Makers | $160.00 | $164.80 | $169.74 |
| Juice Squeezer | $960.00 | $988.80 | $1,018.46 |
| Direct Cost of Sales | |||
| OJ Machines | $488,800 | $604,157 | $746,738 |
| Sandwich Express | $658,000 | $813,288 | $1,005,224 |
| Multi-line Machines | $122,500 | $151,410 | $187,143 |
| Toasters | $201,300 | $248,807 | $307,525 |
| Espresso Makers | $19,520 | $24,127 | $29,821 |
| Juice Squeezer | $117,120 | $144,760 | $178,924 |
| Subtotal Direct Cost of Sales | $1,607,240 | $1,986,549 | $2,455,374 |
5.5 Strategic Alliances
A leading objective of Chef Vending is the development of key strategic alliances. We will pursue alliances with branded, national sandwich makers such as Oscar Mayer, Pierre, and others to create a greater market potential for Sandwich Express. We will also seek out strategic alliances with national juice brands, such as Tropicana, Sunkist, and others to increase the market potential for our Fresh OJ machines.
Chef Vending views the relationship between ourselves and our distributors as a strategic alliance. We will work closely with each distributor to co-market and promote our products and will work, wherever possible, in partnership to achieve desired market penetration.
Management Summary
Chef Vending is a small, family-owned and operated business. The work is organized by function, and the business is carried out in a logical and organized structure. The work environment is characterized by hard work, respect, and a familial structure.
6.1 Organizational Structure
Chef Vending is organized around three functional areas:
- Sales and marketing.
- Finance and administration.
- Route development and service.
6.2 Management Team
Javier Palmera- Partner and co-founder of Chef Vending. Palmera brings a diverse background which includes sales, marketing, and promotion in the beverage industry in Colombia. Additionally, he has experience in promotions and productions through his work at a morning TV program in Philadelphia. He is a graduate of the Art Institute of Philadelphia. Single, 27 years old.
Mauricio Ordonez- Partner and co-founder of Chef Vending. Utilizing his law degree in Colombia, Ordonez has spent time in both public and private enterprises. He has vast entrepreneurial experience, having developed restaurants, hotels, and distribution companies in Miami and in Bogota. Married, two children, 50 years old.
Charles Mulligan- Partner. Mulligan has spent the last twelve years in the hospital management business. With an MBA from Drexel University, he has experience in financial and operational management. Additionally, he has had experience in marketing, contract negotiations, and distribution. Single, 39 years old.
6.3 Management Team Gaps
There are some important gaps as follows:
- Limited vending industry experience.
- Technical support needs to be developed.
As we grow and generate additional business, we will look to bring on technical staff to provide us the support and service capabilities that we will provide to our customers. We will also look to bring on a sales team and we will focus on bringing in knowledgeable, experienced industry hands.
6.4 Personnel Plan
Chef Vending will begin with only two employees, Mulligan and Palmera. Chef Vending will contract with Ordonez, through his affiliate company, MO Global. Compensation for this staff is low at the beginning, and we will look to have a 15% and a 20% increase in the following two years.
As revenue allows, we will add technical staff, sales staff, and an office administrator to handle the increased volume.
| Personnel Plan | |||
| Year 1 | Year 2 | Year 3 | |
| Javier Palmera | $43,200 | $49,680 | $59,616 |
| Charles Mulligan | $43,200 | $49,680 | $59,616 |
| Technician | $16,500 | $18,900 | $19,845 |
| M&O | $50,160 | $57,684 | $69,221 |
| Future Staff | $0 | $75,000 | $115,000 |
| Total People | 4 | 7 | 9 |
| Total Payroll | $153,060 | $250,944 | $323,298 |
Financial Plan
Chef Vending will meet its future needs for capital through the free cash flow generated from its operations. This will require us to be disciplined, tempered, and prudent in our operations and our growth.
7.1 Important Assumptions
The financial plan depends on important financial assumptions outlined in the following table. Key underlying assumptions are as follows:
- Industry growth trends will continue as they have for the past five years.
- Inflation will be at 3% for the next two years.
- We will access the capital we need to meet our cash needs for the first six months.
| General Assumptions | |||
| Year 1 | Year 2 | Year 3 | |
| Plan Month | 1 | 2 | 3 |
| Current Interest Rate | 10.00% | 10.00% | 10.00% |
| Long-term Interest Rate | 11.50% | 11.50% | 11.50% |
| Tax Rate | 25.42% | 25.00% | 25.42% |
| Other | 0 | 0 | 0 |
7.2 Projected Profit and Loss
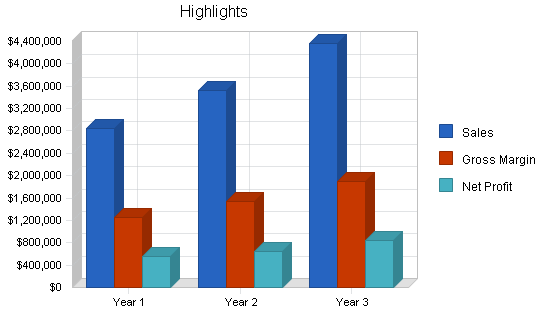
Chef Vending is projected to make over $500,000 profit on $2.8 million of sales. The following table indicates how we will achieve this performance.


| Pro Forma Profit and Loss | |||
| Year 1 | Year 2 | Year 3 | |
| Sales | $2,851,450 | $3,524,392 | $4,356,149 |
| Direct Cost of Sales | $1,607,240 | $1,986,549 | $2,455,374 |
| Other | $0 | $0 | $0 |
| Total Cost of Sales | $1,607,240 | $1,986,549 | $2,455,374 |
| Gross Margin | $1,244,210 | $1,537,844 | $1,900,775 |
| Gross Margin % | 43.63% | 43.63% | 43.63% |
| Expenses | |||
| Payroll | $153,060 | $250,944 | $323,298 |
| Sales and Marketing and Other Expenses | $51,600 | $59,174 | $68,279 |
| Depreciation | $25,905 | $30,984 | $3,111 |
| Repairs & Maintanence | $6,000 | $6,180 | $6,365 |
| Commissions | $99,801 | $119,761 | $143,713 |
| Loan Repayments | $29,136 | $29,136 | $29,136 |
| Raw Materials | $7,736 | $9,670 | $12,088 |
| Freight | $64,290 | $77,148 | $92,577 |
| Office Supplies | $2,400 | $2,472 | $2,546 |
| Postage | $1,020 | $1,051 | $1,082 |
| Telephone | $9,000 | $9,270 | $9,548 |
| Utilities | $3,000 | $3,090 | $3,183 |
| Insurance | $3,600 | $3,708 | $3,819 |
| Rent | $15,972 | $25,000 | $35,000 |
| Payroll Taxes | $15,306 | $25,094 | $32,330 |
| Other | $0 | $0 | $0 |
| Total Operating Expenses | $487,825 | $652,681 | $766,075 |
| Profit Before Interest and Taxes | $756,385 | $885,162 | $1,134,699 |
| EBITDA | $782,290 | $916,146 | $1,137,810 |
| Interest Expense | $15,057 | $15,790 | $14,966 |
| Taxes Incurred | $185,909 | $217,343 | $284,599 |
| Net Profit | $555,419 | $652,029 | $835,135 |
| Net Profit/Sales | 19.48% | 18.50% | 19.17% |
7.3 Key Financial Indicators
- Free cash flow to finance our growth.
- Gross margins will be an important gauge on our profitability.
- The exchange rates between the U.S. dollar and the Euro, which is tied to the Spanish Peseta.

7.4 Break-even Analysis
The following table indicates our break-even unit volume measure. An important element will be the product mix that went into the unit sales. We believe that we have outlined a conservative sales forecast that we should be able to achieve by year-end. The start-up months will be the most difficult as we attempt to break into the market, but after a three to four month successful product testing period, we should see tremendous sales, easily reaching our year-end targets.

| Break-even Analysis | |
| Monthly Units Break-even | 27 |
| Monthly Revenue Break-even | $93,166 |
| Assumptions: | |
| Average Per-Unit Revenue | $3,481.62 |
| Average Per-Unit Variable Cost | $1,962.44 |
| Estimated Monthly Fixed Cost | $40,652 |
7.5 Projected Cash Flow
We expect to manage cash flow from an initial Small Business Administration (SBA) loan of $125,000, and then through our free cash flow generated from operations.

| Pro Forma Cash Flow | |||
| Year 1 | Year 2 | Year 3 | |
| Cash Received | |||
| Cash from Operations | |||
| Cash Sales | $1,425,725 | $1,762,196 | $2,178,074 |
| Cash from Receivables | $1,046,281 | $1,672,647 | $2,067,392 |
| Subtotal Cash from Operations | $2,472,006 | $3,434,843 | $4,245,467 |
| Additional Cash Received | |||
| Sales Tax, VAT, HST/GST Received | $0 | $0 | $0 |
| New Current Borrowing | $0 | $0 | $0 |
| New Other Liabilities (interest-free) | $0 | $0 | $0 |
| New Long-term Liabilities | $24,280 | $4,856 | $0 |
| Sales of Other Current Assets | $0 | $0 | $0 |
| Sales of Long-term Assets | $0 | $0 | $0 |
| New Investment Received | $125,000 | $0 | $0 |
| Subtotal Cash Received | $2,621,286 | $3,439,699 | $4,245,467 |
| Expenditures | Year 1 | Year 2 | Year 3 |
| Expenditures from Operations | |||
| Cash Spending | $153,060 | $250,944 | $323,298 |
| Bill Payments | $2,048,212 | $2,707,861 | $3,214,920 |
| Subtotal Spent on Operations | $2,201,272 | $2,958,805 | $3,538,217 |
| Additional Cash Spent | |||
| Sales Tax, VAT, HST/GST Paid Out | $0 | $0 | $0 |
| Principal Repayment of Current Borrowing | $0 | $0 | $0 |
| Other Liabilities Principal Repayment | $0 | $0 | $0 |
| Long-term Liabilities Principal Repayment | $9,600 | $9,600 | $9,600 |
| Purchase Other Current Assets | $0 | $0 | $0 |
| Purchase Long-term Assets | $60,000 | $0 | $0 |
| Dividends | $0 | $0 | $0 |
| Subtotal Cash Spent | $2,270,872 | $2,968,405 | $3,547,817 |
| Net Cash Flow | $350,414 | $471,294 | $697,649 |
| Cash Balance | $375,414 | $846,708 | $1,544,358 |
7.6 Projected Balance Sheet
Our Balance Sheet projections are presented in the table below.
| Pro Forma Balance Sheet | |||
| Year 1 | Year 2 | Year 3 | |
| Assets | |||
| Current Assets | |||
| Cash | $375,414 | $846,708 | $1,544,358 |
| Accounts Receivable | $379,444 | $468,992 | $579,675 |
| Inventory | $243,705 | $301,219 | $372,307 |
| Other Current Assets | $0 | $0 | $0 |
| Total Current Assets | $998,563 | $1,616,920 | $2,496,339 |
| Long-term Assets | |||
| Long-term Assets | $60,000 | $60,000 | $60,000 |
| Accumulated Depreciation | $25,905 | $56,889 | $60,000 |
| Total Long-term Assets | $34,095 | $3,111 | ($0) |
| Total Assets | $1,032,658 | $1,620,031 | $2,496,339 |
| Liabilities and Capital | Year 1 | Year 2 | Year 3 |
| Current Liabilities | |||
| Accounts Payable | $277,551 | $217,640 | $268,413 |
| Current Borrowing | $0 | $0 | $0 |
| Other Current Liabilities | $0 | $0 | $0 |
| Subtotal Current Liabilities | $277,551 | $217,640 | $268,413 |
| Long-term Liabilities | $139,680 | $134,936 | $125,336 |
| Total Liabilities | $417,231 | $352,576 | $393,749 |
| Paid-in Capital | $154,500 | $154,500 | $154,500 |
| Retained Earnings | ($94,492) | $460,927 | $1,112,956 |
| Earnings | $555,419 | $652,029 | $835,135 |
| Total Capital | $615,427 | $1,267,456 | $2,102,590 |
| Total Liabilities and Capital | $1,032,658 | $1,620,031 | $2,496,339 |
| Net Worth | $615,427 | $1,267,456 | $2,102,590 |
7.7 Business Ratios
The computed standard Business Ratios are presented in the table below. Industry Profile ratios are based on Standard Industry Classification (SIC) code, 5962.
| Ratio Analysis | ||||
| Year 1 | Year 2 | Year 3 | Industry Profile | |
| Sales Growth | 0.00% | 23.60% | 23.60% | -1.30% |
| Percent of Total Assets | ||||
| Accounts Receivable | 36.74% | 28.95% | 23.22% | 19.20% |
| Inventory | 23.60% | 18.59% | 14.91% | 36.00% |
| Other Current Assets | 0.00% | 0.00% | 0.00% | 24.80% |
| Total Current Assets | 96.70% | 99.81% | 100.00% | 80.00% |
| Long-term Assets | 3.30% | 0.19% | 0.00% | 20.00% |
| Total Assets | 100.00% | 100.00% | 100.00% | 100.00% |
| Current Liabilities | 26.88% | 13.43% | 10.75% | 36.40% |
| Long-term Liabilities | 13.53% | 8.33% | 5.02% | 11.70% |
| Total Liabilities | 40.40% | 21.76% | 15.77% | 48.10% |
| Net Worth | 59.60% | 78.24% | 84.23% | 51.90% |
| Percent of Sales | ||||
| Sales | 100.00% | 100.00% | 100.00% | 100.00% |
| Gross Margin | 43.63% | 43.63% | 43.63% | 38.00% |
| Selling, General & Administrative Expenses | 24.15% | 25.32% | 25.21% | 22.60% |
| Advertising Expenses | 0.83% | 0.81% | 0.79% | 3.00% |
| Profit Before Interest and Taxes | 26.53% | 25.12% | 26.05% | 1.90% |
| Main Ratios | ||||
| Current | 3.60 | 7.43 | 9.30 | 2.18 |
| Quick | 2.72 | 6.05 | 7.91 | 0.89 |
| Total Debt to Total Assets | 40.40% | 21.76% | 15.77% | 48.10% |
| Pre-tax Return on Net Worth | 120.46% | 68.59% | 53.25% | 4.30% |
| Pre-tax Return on Assets | 71.79% | 53.66% | 44.86% | 8.20% |
| Additional Ratios | Year 1 | Year 2 | Year 3 | |
| Net Profit Margin | 19.48% | 18.50% | 19.17% | n.a |
| Return on Equity | 90.25% | 51.44% | 39.72% | n.a |
| Activity Ratios | ||||
| Accounts Receivable Turnover | 3.76 | 3.76 | 3.76 | n.a |
| Collection Days | 56 | 88 | 88 | n.a |
| Inventory Turnover | 10.91 | 7.29 | 7.29 | n.a |
| Accounts Payable Turnover | 8.37 | 12.17 | 12.17 | n.a |
| Payment Days | 27 | 34 | 27 | n.a |
| Total Asset Turnover | 2.76 | 2.18 | 1.75 | n.a |
| Debt Ratios | ||||
| Debt to Net Worth | 0.68 | 0.28 | 0.19 | n.a |
| Current Liab. to Liab. | 0.67 | 0.62 | 0.68 | n.a |
| Liquidity Ratios | ||||
| Net Working Capital | $721,012 | $1,399,281 | $2,227,926 | n.a |
| Interest Coverage | 50.24 | 56.06 | 75.82 | n.a |
| Additional Ratios | ||||
| Assets to Sales | 0.36 | 0.46 | 0.57 | n.a |
| Current Debt/Total Assets | 27% | 13% | 11% | n.a |
| Acid Test | 1.35 | 3.89 | 5.75 | n.a |
| Sales/Net Worth | 4.63 | 2.78 | 2.07 | n.a |
| Dividend Payout | 0.00 | 0.00 | 0.00 | n.a |
Appendix
| Sales Forecast | |||||||||||||
| Month 1 | Month 2 | Month 3 | Month 4 | Month 5 | Month 6 | Month 7 | Month 8 | Month 9 | Month 10 | Month 11 | Month 12 | ||
| Unit Sales | |||||||||||||
| OJ Machines | 0% | 4 | 4 | 6 | 6 | 8 | 8 | 8 | 10 | 10 | 10 | 15 | 15 |
| Sandwich Express | 0% | 4 | 4 | 6 | 6 | 8 | 8 | 8 | 10 | 10 | 10 | 15 | 15 |
| Multi-line Machines | 0% | 10 | 10 | 15 | 15 | 20 | 20 | 20 | 25 | 25 | 25 | 30 | 30 |
| Toasters | 0% | 5 | 5 | 8 | 8 | 10 | 10 | 10 | 12 | 12 | 12 | 15 | 15 |
| Espresso Makers | 0% | 5 | 5 | 8 | 8 | 10 | 10 | 10 | 12 | 12 | 12 | 15 | 15 |
| Juice Squeezer | 0% | 5 | 5 | 8 | 8 | 10 | 10 | 10 | 12 | 12 | 12 | 15 | 15 |
| Total Unit Sales | 33 | 33 | 51 | 51 | 66 | 66 | 66 | 81 | 81 | 81 | 105 | 105 | |
| Unit Prices | Month 1 | Month 2 | Month 3 | Month 4 | Month 5 | Month 6 | Month 7 | Month 8 | Month 9 | Month 10 | Month 11 | Month 12 | |
| OJ Machines | $6,500.00 | $6,500.00 | $6,500.00 | $6,500.00 | $6,500.00 | $6,500.00 | $6,500.00 | $6,500.00 | $6,500.00 | $6,500.00 | $6,500.00 | $6,500.00 | |
| Sandwich Express | $9,500.00 | $9,500.00 | $9,500.00 | $9,500.00 | $9,500.00 | $9,500.00 | $9,500.00 | $9,500.00 | $9,500.00 | $9,500.00 | $9,500.00 | $9,500.00 | |
| Multi-line Machines | $1,000.00 | $1,000.00 | $1,000.00 | $1,000.00 | $1,000.00 | $1,000.00 | $1,000.00 | $1,000.00 | $1,000.00 | $1,000.00 | $1,000.00 | $1,000.00 | |
| Toasters | $3,275.00 | $3,275.00 | $3,275.00 | $3,275.00 | $3,275.00 | $3,275.00 | $3,275.00 | $3,275.00 | $3,275.00 | $3,275.00 | $3,275.00 | $3,275.00 | |
| Espresso Makers | $250.00 | $250.00 | $250.00 | $250.00 | $250.00 | $250.00 | $250.00 | $250.00 | $250.00 | $250.00 | $250.00 | $250.00 | |
| Juice Squeezer | $4,200.00 | $4,200.00 | $4,200.00 | $4,200.00 | $4,200.00 | $4,200.00 | $4,200.00 | $4,200.00 | $4,200.00 | $4,200.00 | $4,200.00 | $4,200.00 | |
| Sales | |||||||||||||
| OJ Machines | $26,000 | $26,000 | $39,000 | $39,000 | $52,000 | $52,000 | $52,000 | $65,000 | $65,000 | $65,000 | $97,500 | $97,500 | |
| Sandwich Express | $38,000 | $38,000 | $57,000 | $57,000 | $76,000 | $76,000 | $76,000 | $95,000 | $95,000 | $95,000 | $142,500 | $142,500 | |
| Multi-line Machines | $10,000 | $10,000 | $15,000 | $15,000 | $20,000 | $20,000 | $20,000 | $25,000 | $25,000 | $25,000 | $30,000 | $30,000 | |
| Toasters | $16,375 | $16,375 | $26,200 | $26,200 | $32,750 | $32,750 | $32,750 | $39,300 | $39,300 | $39,300 | $49,125 | $49,125 | |
| Espresso Makers | $1,250 | $1,250 | $2,000 | $2,000 | $2,500 | $2,500 | $2,500 | $3,000 | $3,000 | $3,000 | $3,750 | $3,750 | |
| Juice Squeezer | $21,000 | $21,000 | $33,600 | $33,600 | $42,000 | $42,000 | $42,000 | $50,400 | $50,400 | $50,400 | $63,000 | $63,000 | |
| Total Sales | $112,625 | $112,625 | $172,800 | $172,800 | $225,250 | $225,250 | $225,250 | $277,700 | $277,700 | $277,700 | $385,875 | $385,875 | |
| Direct Unit Costs | Month 1 | Month 2 | Month 3 | Month 4 | Month 5 | Month 6 | Month 7 | Month 8 | Month 9 | Month 10 | Month 11 | Month 12 | |
| OJ Machines | 0.00% | $4,700.00 | $4,700.00 | $4,700.00 | $4,700.00 | $4,700.00 | $4,700.00 | $4,700.00 | $4,700.00 | $4,700.00 | $4,700.00 | $4,700.00 | $4,700.00 |
| Sandwich Express | 0.00% | $7,000.00 | $6,300.00 | $6,300.00 | $6,300.00 | $6,300.00 | $6,300.00 | $6,300.00 | $6,300.00 | $6,300.00 | $6,300.00 | $6,300.00 | $6,300.00 |
| Multi-line Machines | 0.00% | $500.00 | $500.00 | $500.00 | $500.00 | $500.00 | $500.00 | $500.00 | $500.00 | $500.00 | $500.00 | $500.00 | $500.00 |
| Toasters | 0.00% | $1,650.00 | $1,650.00 | $1,650.00 | $1,650.00 | $1,650.00 | $1,650.00 | $1,650.00 | $1,650.00 | $1,650.00 | $1,650.00 | $1,650.00 | $1,650.00 |
| Espresso Makers | 0.00% | $160.00 | $160.00 | $160.00 | $160.00 | $160.00 | $160.00 | $160.00 | $160.00 | $160.00 | $160.00 | $160.00 | $160.00 |
| Juice Squeezer | 0.00% | $960.00 | $960.00 | $960.00 | $960.00 | $960.00 | $960.00 | $960.00 | $960.00 | $960.00 | $960.00 | $960.00 | $960.00 |
| Direct Cost of Sales | |||||||||||||
| OJ Machines | $18,800 | $18,800 | $28,200 | $28,200 | $37,600 | $37,600 | $37,600 | $47,000 | $47,000 | $47,000 | $70,500 | $70,500 | |
| Sandwich Express | $28,000 | $25,200 | $37,800 | $37,800 | $50,400 | $50,400 | $50,400 | $63,000 | $63,000 | $63,000 | $94,500 | $94,500 | |
| Multi-line Machines | $5,000 | $5,000 | $7,500 | $7,500 | $10,000 | $10,000 | $10,000 | $12,500 | $12,500 | $12,500 | $15,000 | $15,000 | |
| Toasters | $8,250 | $8,250 | $13,200 | $13,200 | $16,500 | $16,500 | $16,500 | $19,800 | $19,800 | $19,800 | $24,750 | $24,750 | |
| Espresso Makers | $800 | $800 | $1,280 | $1,280 | $1,600 | $1,600 | $1,600 | $1,920 | $1,920 | $1,920 | $2,400 | $2,400 | |
| Juice Squeezer | $4,800 | $4,800 | $7,680 | $7,680 | $9,600 | $9,600 | $9,600 | $11,520 | $11,520 | $11,520 | $14,400 | $14,400 | |
| Subtotal Direct Cost of Sales | $65,650 | $62,850 | $95,660 | $95,660 | $125,700 | $125,700 | $125,700 | $155,740 | $155,740 | $155,740 | $221,550 | $221,550 | |
| Personnel Plan | |||||||||||||
| Month 1 | Month 2 | Month 3 | Month 4 | Month 5 | Month 6 | Month 7 | Month 8 | Month 9 | Month 10 | Month 11 | Month 12 | ||
| Javier Palmera | 0% | $3,600 | $3,600 | $3,600 | $3,600 | $3,600 | $3,600 | $3,600 | $3,600 | $3,600 | $3,600 | $3,600 | $3,600 |
| Charles Mulligan | 0% | $3,600 | $3,600 | $3,600 | $3,600 | $3,600 | $3,600 | $3,600 | $3,600 | $3,600 | $3,600 | $3,600 | $3,600 |
| Technician | 0% | $0 | $1,500 | $1,500 | $1,500 | $1,500 | $1,500 | $1,500 | $1,500 | $1,500 | $1,500 | $1,500 | $1,500 |
| M&O | 0% | $4,180 | $4,180 | $4,180 | $4,180 | $4,180 | $4,180 | $4,180 | $4,180 | $4,180 | $4,180 | $4,180 | $4,180 |
| Future Staff | 0% | $0 | $0 | $0 | $0 | $0 | $0 | $0 | $0 | $0 | $0 | $0 | $0 |
| Total People | 3 | 4 | 4 | 4 | 4 | 4 | 4 | 4 | 4 | 4 | 4 | 4 | |
| Total Payroll | $11,380 | $12,880 | $12,880 | $12,880 | $12,880 | $12,880 | $12,880 | $12,880 | $12,880 | $12,880 | $12,880 | $12,880 | |
| General Assumptions | |||||||||||||
| Month 1 | Month 2 | Month 3 | Month 4 | Month 5 | Month 6 | Month 7 | Month 8 | Month 9 | Month 10 | Month 11 | Month 12 | ||
| Plan Month | 1 | 2 | 3 | 4 | 5 | 6 | 7 | 8 | 9 | 10 | 11 | 12 | |
| Current Interest Rate | 10.00% | 10.00% | 10.00% | 10.00% | 10.00% | 10.00% | 10.00% | 10.00% | 10.00% | 10.00% | 10.00% | 10.00% | |
| Long-term Interest Rate | 11.50% | 11.50% | 11.50% | 11.50% | 11.50% | 11.50% | 11.50% | 11.50% | 11.50% | 11.50% | 11.50% | 11.50% | |
| Tax Rate | 30.00% | 25.00% | 25.00% | 25.00% | 25.00% | 25.00% | 25.00% | 25.00% | 25.00% | 25.00% | 25.00% | 25.00% | |
| Other | 0 | 0 | 0 | 0 | 0 | 0 | 0 | 0 | 0 | 0 | 0 | 0 | |
| Pro Forma Profit and Loss | |||||||||||||
| Month 1 | Month 2 | Month 3 | Month 4 | Month 5 | Month 6 | Month 7 | Month 8 | Month 9 | Month 10 | Month 11 | Month 12 | ||
| Sales | $112,625 | $112,625 | $172,800 | $172,800 | $225,250 | $225,250 | $225,250 | $277,700 | $277,700 | $277,700 | $385,875 | $385,875 | |
| Direct Cost of Sales | $65,650 | $62,850 | $95,660 | $95,660 | $125,700 | $125,700 | $125,700 | $155,740 | $155,740 | $155,740 | $221,550 | $221,550 | |
| Other | $0 | $0 | $0 | $0 | $0 | $0 | $0 | $0 | $0 | $0 | $0 | $0 | |
| Total Cost of Sales | $65,650 | $62,850 | $95,660 | $95,660 | $125,700 | $125,700 | $125,700 | $155,740 | $155,740 | $155,740 | $221,550 | $221,550 | |
| Gross Margin | $46,975 | $49,775 | $77,140 | $77,140 | $99,550 | $99,550 | $99,550 | $121,960 | $121,960 | $121,960 | $164,325 | $164,325 | |
| Gross Margin % | 41.71% | 44.20% | 44.64% | 44.64% | 44.20% | 44.20% | 44.20% | 43.92% | 43.92% | 43.92% | 42.59% | 42.59% | |
| Expenses | |||||||||||||
| Payroll | $11,380 | $12,880 | $12,880 | $12,880 | $12,880 | $12,880 | $12,880 | $12,880 | $12,880 | $12,880 | $12,880 | $12,880 | |
| Sales and Marketing and Other Expenses | $7,250 | $2,000 | $2,500 | $4,150 | $3,650 | $3,900 | $7,150 | $3,650 | $3,900 | $3,650 | $3,650 | $6,150 | |
| Depreciation | $1,582 | $1,582 | $1,582 | $2,166 | $2,166 | $2,166 | $2,166 | $2,166 | $2,582 | $2,582 | $2,582 | $2,582 | |
| Repairs & Maintanence | $500 | $500 | $500 | $500 | $500 | $500 | $500 | $500 | $500 | $500 | $500 | $500 | |
| Commissions | $3,942 | $3,942 | $6,048 | $6,048 | $7,884 | $7,884 | $7,884 | $9,720 | $9,720 | $9,720 | $13,506 | $13,506 | |
| Loan Repayments | $2,428 | $2,428 | $2,428 | $2,428 | $2,428 | $2,428 | $2,428 | $2,428 | $2,428 | $2,428 | $2,428 | $2,428 | |
| Raw Materials | $480 | $583 | $583 | $608 | $608 | $608 | $608 | $608 | $656 | $787 | $787 | $820 | |
| Freight | $2,626 | $2,514 | $3,826 | $3,826 | $5,028 | $5,028 | $5,028 | $6,230 | $6,230 | $6,230 | $8,862 | $8,862 | |
| Office Supplies | $200 | $200 | $200 | $200 | $200 | $200 | $200 | $200 | $200 | $200 | $200 | $200 | |
| Postage | $85 | $85 | $85 | $85 | $85 | $85 | $85 | $85 | $85 | $85 | $85 | $85 | |
| Telephone | $750 | $750 | $750 | $750 | $750 | $750 | $750 | $750 | $750 | $750 | $750 | $750 | |
| Utilities | $250 | $250 | $250 | $250 | $250 | $250 | $250 | $250 | $250 | $250 | $250 | $250 | |
| Insurance | $300 | $300 | $300 | $300 | $300 | $300 | $300 | $300 | $300 | $300 | $300 | $300 | |
| Rent | $1,331 | $1,331 | $1,331 | $1,331 | $1,331 | $1,331 | $1,331 | $1,331 | $1,331 | $1,331 | $1,331 | $1,331 | |
| Payroll Taxes | 10% | $1,138 | $1,288 | $1,288 | $1,288 | $1,288 | $1,288 | $1,288 | $1,288 | $1,288 | $1,288 | $1,288 | $1,288 |
| Other | $0 | $0 | $0 | $0 | $0 | $0 | $0 | $0 | $0 | $0 | $0 | $0 | |
| Total Operating Expenses | $34,242 | $30,633 | $34,552 | $36,810 | $39,348 | $39,598 | $42,848 | $42,385 | $43,099 | $42,980 | $49,399 | $51,932 | |
| Profit Before Interest and Taxes | $12,733 | $19,142 | $42,588 | $40,330 | $60,202 | $59,952 | $56,702 | $79,575 | $78,861 | $78,980 | $114,926 | $112,393 | |
| EBITDA | $14,315 | $20,724 | $44,171 | $42,496 | $62,368 | $62,118 | $58,868 | $81,741 | $81,443 | $81,562 | $117,508 | $114,975 | |
| Interest Expense | $1,190 | $1,183 | $1,198 | $1,214 | $1,229 | $1,245 | $1,261 | $1,276 | $1,292 | $1,307 | $1,323 | $1,339 | |
| Taxes Incurred | $3,463 | $4,490 | $10,348 | $9,779 | $14,743 | $14,677 | $13,860 | $19,575 | $19,392 | $19,418 | $28,401 | $27,764 | |
| Net Profit | $8,080 | $13,469 | $31,043 | $29,337 | $44,230 | $44,030 | $41,581 | $58,724 | $58,177 | $58,254 | $85,203 | $83,291 | |
| Net Profit/Sales | 7.17% | 11.96% | 17.96% | 16.98% | 19.64% | 19.55% | 18.46% | 21.15% | 20.95% | 20.98% | 22.08% | 21.58% | |
| Pro Forma Cash Flow | |||||||||||||
| Month 1 | Month 2 | Month 3 | Month 4 | Month 5 | Month 6 | Month 7 | Month 8 | Month 9 | Month 10 | Month 11 | Month 12 | ||
| Cash Received | |||||||||||||
| Cash from Operations | |||||||||||||
| Cash Sales | $56,313 | $56,313 | $86,400 | $86,400 | $112,625 | $112,625 | $112,625 | $138,850 | $138,850 | $138,850 | $192,938 | $192,938 | |
| Cash from Receivables | $0 | $1,877 | $56,313 | $57,315 | $86,400 | $87,274 | $112,625 | $112,625 | $113,499 | $138,850 | $138,850 | $140,653 | |
| Subtotal Cash from Operations | $56,313 | $58,190 | $142,713 | $143,715 | $199,025 | $199,899 | $225,250 | $251,475 | $252,349 | $277,700 | $331,788 | $333,590 | |
| Additional Cash Received | |||||||||||||
| Sales Tax, VAT, HST/GST Received | 0.00% | $0 | $0 | $0 | $0 | $0 | $0 | $0 | $0 | $0 | $0 | $0 | $0 |
| New Current Borrowing | $0 | $0 | $0 | $0 | $0 | $0 | $0 | $0 | $0 | $0 | $0 | $0 | |
| New Other Liabilities (interest-free) | $0 | $0 | $0 | $0 | $0 | $0 | $0 | $0 | $0 | $0 | $0 | $0 | |
| New Long-term Liabilities | $0 | $0 | $2,428 | $2,428 | $2,428 | $2,428 | $2,428 | $2,428 | $2,428 | $2,428 | $2,428 | $2,428 | |
| Sales of Other Current Assets | $0 | $0 | $0 | $0 | $0 | $0 | $0 | $0 | $0 | $0 | $0 | $0 | |
| Sales of Long-term Assets | $0 | $0 | $0 | $0 | $0 | $0 | $0 | $0 | $0 | $0 | $0 | $0 | |
| New Investment Received | $0 | $125,000 | $0 | $0 | $0 | $0 | $0 | $0 | $0 | $0 | $0 | $0 | |
| Subtotal Cash Received | $56,313 | $183,190 | $145,141 | $146,143 | $201,453 | $202,327 | $227,678 | $253,903 | $254,777 | $280,128 | $334,216 | $336,018 | |
| Expenditures | Month 1 | Month 2 | Month 3 | Month 4 | Month 5 | Month 6 | Month 7 | Month 8 | Month 9 | Month 10 | Month 11 | Month 12 | |
| Expenditures from Operations | |||||||||||||
| Cash Spending | $11,380 | $12,880 | $12,880 | $12,880 | $12,880 | $12,880 | $12,880 | $12,880 | $12,880 | $12,880 | $12,880 | $12,880 | |
| Bill Payments | $6,710 | $124,801 | $84,339 | $162,220 | $130,771 | $197,924 | $166,255 | $170,901 | $235,877 | $204,059 | $209,104 | $355,252 | |
| Subtotal Spent on Operations | $18,090 | $137,681 | $97,219 | $175,100 | $143,651 | $210,804 | $179,135 | $183,781 | $248,757 | $216,939 | $221,984 | $368,132 | |
| Additional Cash Spent | |||||||||||||
| Sales Tax, VAT, HST/GST Paid Out | $0 | $0 | $0 | $0 | $0 | $0 | $0 | $0 | $0 | $0 | $0 | $0 | |
| Principal Repayment of Current Borrowing | $0 | $0 | $0 | $0 | $0 | $0 | $0 | $0 | $0 | $0 | $0 | $0 | |
| Other Liabilities Principal Repayment | $0 | $0 | $0 | $0 | $0 | $0 | $0 | $0 | $0 | $0 | $0 | $0 | |
| Long-term Liabilities Principal Repayment | $800 | $800 | $800 | $800 | $800 | $800 | $800 | $800 | $800 | $800 | $800 | $800 | |
| Purchase Other Current Assets | $0 | $0 | $0 | $0 | $0 | $0 | $0 | $0 | $0 | $0 | $0 | $0 | |
| Purchase Long-term Assets | $0 | $0 | $0 | $35,000 | $0 | $0 | $0 | $0 | $25,000 | $0 | $0 | $0 | |
| Dividends | $0 | $0 | $0 | $0 | $0 | $0 | $0 | $0 | $0 | $0 | $0 | $0 | |
| Subtotal Cash Spent | $18,890 | $138,481 | $98,019 | $210,900 | $144,451 | $211,604 | $179,935 | $184,581 | $274,557 | $217,739 | $222,784 | $368,932 | |
| Net Cash Flow | $37,423 | $44,709 | $47,121 | ($64,757) | $57,002 | ($9,276) | $47,743 | $69,322 | ($19,780) | $62,389 | $111,431 | ($32,914) | |
| Cash Balance | $62,423 | $107,132 | $154,253 | $89,496 | $146,499 | $137,222 | $184,965 | $254,287 | $234,507 | $296,897 | $408,328 | $375,414 | |
| Pro Forma Balance Sheet | |||||||||||||
| Month 1 | Month 2 | Month 3 | Month 4 | Month 5 | Month 6 | Month 7 | Month 8 | Month 9 | Month 10 | Month 11 | Month 12 | ||
| Assets | Starting Balances | ||||||||||||
| Current Assets | |||||||||||||
| Cash | $25,000 | $62,423 | $107,132 | $154,253 | $89,496 | $146,499 | $137,222 | $184,965 | $254,287 | $234,507 | $296,897 | $408,328 | $375,414 |
| Accounts Receivable | $0 | $56,313 | $110,748 | $140,835 | $169,920 | $196,145 | $221,496 | $221,496 | $247,721 | $273,072 | $273,072 | $327,159 | $379,444 |
| Inventory | $37,508 | $72,215 | $69,135 | $105,226 | $105,226 | $138,270 | $138,270 | $138,270 | $171,314 | $171,314 | $171,314 | $243,705 | $243,705 |
| Other Current Assets | $0 | $0 | $0 | $0 | $0 | $0 | $0 | $0 | $0 | $0 | $0 | $0 | $0 |
| Total Current Assets | $62,508 | $190,950 | $287,015 | $400,315 | $364,642 | $480,914 | $496,988 | $544,731 | $673,322 | $678,893 | $741,282 | $979,192 | $998,563 |
| Long-term Assets | |||||||||||||
| Long-term Assets | $0 | $0 | $0 | $0 | $35,000 | $35,000 | $35,000 | $35,000 | $35,000 | $60,000 | $60,000 | $60,000 | $60,000 |
| Accumulated Depreciation | $0 | $1,582 | $3,165 | $4,747 | $6,913 | $9,079 | $11,245 | $13,411 | $15,577 | $18,159 | $20,741 | $23,323 | $25,905 |
| Total Long-term Assets | $0 | ($1,582) | ($3,165) | ($4,747) | $28,087 | $25,921 | $23,755 | $21,589 | $19,423 | $41,841 | $39,259 | $36,677 | $34,095 |
| Total Assets | $62,508 | $189,368 | $283,850 | $395,568 | $392,729 | $506,835 | $520,743 | $566,320 | $692,745 | $720,734 | $780,541 | $1,015,869 | $1,032,658 |
| Liabilities and Capital | Month 1 | Month 2 | Month 3 | Month 4 | Month 5 | Month 6 | Month 7 | Month 8 | Month 9 | Month 10 | Month 11 | Month 12 | |
| Current Liabilities | |||||||||||||
| Accounts Payable | $2,500 | $122,080 | $78,893 | $157,940 | $124,137 | $192,384 | $160,634 | $163,002 | $229,075 | $197,259 | $197,184 | $345,681 | $277,551 |
| Current Borrowing | $0 | $0 | $0 | $0 | $0 | $0 | $0 | $0 | $0 | $0 | $0 | $0 | $0 |
| Other Current Liabilities | $0 | $0 | $0 | $0 | $0 | $0 | $0 | $0 | $0 | $0 | $0 | $0 | $0 |
| Subtotal Current Liabilities | $2,500 | $122,080 | $78,893 | $157,940 | $124,137 | $192,384 | $160,634 | $163,002 | $229,075 | $197,259 | $197,184 | $345,681 | $277,551 |
| Long-term Liabilities | $125,000 | $124,200 | $123,400 | $125,028 | $126,656 | $128,284 | $129,912 | $131,540 | $133,168 | $134,796 | $136,424 | $138,052 | $139,680 |
| Total Liabilities | $127,500 | $246,280 | $202,293 | $282,968 | $250,793 | $320,668 | $290,546 | $294,542 | $362,243 | $332,055 | $333,608 | $483,733 | $417,231 |
| Paid-in Capital | $29,500 | $29,500 | $154,500 | $154,500 | $154,500 | $154,500 | $154,500 | $154,500 | $154,500 | $154,500 | $154,500 | $154,500 | $154,500 |
| Retained Earnings | ($94,492) | ($94,492) | ($94,492) | ($94,492) | ($94,492) | ($94,492) | ($94,492) | ($94,492) | ($94,492) | ($94,492) | ($94,492) | ($94,492) | ($94,492) |
| Earnings | $0 | $8,080 | $21,549 | $52,592 | $81,929 | $126,158 | $170,189 | $211,770 | $270,494 | $328,671 | $386,925 | $472,128 | $555,419 |
| Total Capital | ($64,992) | ($56,912) | $81,557 | $112,600 | $141,937 | $186,166 | $230,197 | $271,778 | $330,502 | $388,679 | $446,933 | $532,136 | $615,427 |
| Total Liabilities and Capital | $62,508 | $189,368 | $283,850 | $395,568 | $392,729 | $506,835 | $520,743 | $566,320 | $692,745 | $720,734 | $780,541 | $1,015,869 | $1,032,658 |
| Net Worth | ($64,992) | ($56,912) | $81,557 | $112,600 | $141,937 | $186,166 | $230,197 | $271,778 | $330,502 | $388,679 | $446,933 | $532,136 | $615,427 |

