
Nine Lives Outdoor Gear Consignment Shop
Executive Summary
Nine Lives – An Outdoor Clothing & Gear Consignment Store is a new business in Eugene, Oregon. Nine Lives will be run by Jim Gearboy, a veteran of the outdoor industry. Additionally, Jim is very familiar with the outdoor community in Eugene and has leveraged his regionally specific industry insights into a niche store that has no direct competition.
With a selection of used goods not replicated in the city, superior customer service, and reasonable prices, Nine Lives will capitalize on this incredible opportunity. The owner, Jim Gearboy, has secured a location that offers very good foot traffic and easy accessibility. Jim will efficiently lay out the store to increase sales and give the customers the utmost in attention. This attention to detail, combined with Jim’s passion and knowledge of the outdoor recreation industry, will help the store reach a profitable level quickly.
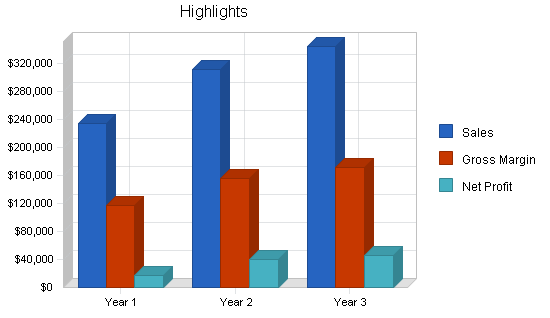
The projected growth rate for Nine Lives is quite steady, with profitability estimated by month six and revenue of $45,000 by year three.
1.1 Mission
Nine Lives’ mission is to provide the customer with quality outdoor clothing and gear at reasonable prices. We exist to attract and maintain customers. When we adhere to this maxim, everything else will fall into place. Our services will exceed the expectations of our customers.
1.2 Objectives
The objectives for the first three years of operation include:
- To create a retail store whose primary goal is to exceed customer’s expectations.
- To increase the number of clients served by at least 20% per year through superior performance and selection.
- To decrease dependence on nonrenewable resources through the use of reused goods.
- To obtain annual revenues exceeding $50,000.
Company Summary
Nine Lives, to be located in Eugene, OR will be a consignment shop for outdoor clothing and gear. Nine Lives will offer used outdoor clothing and gear for reasonable prices, allowing a wider range of people to enjoy the outdoors. Nine Lives will sell the items on consignment, meaning Nine Lives will sell other owner’s items and pay for them when sold. Typically the items on consignment will be used. They will also consist of new manufacturers’ closeouts and seconds. Occassionally, Nine Lives will purchase outright manufacturers’ closeouts and seconds. This will only occur when the savings are large and the items are likely to be sold quickly.
The business will make a profit in month six, and will grow steadily each consecutive month.
2.1 Company Ownership
Nine Lives will be an Oregon corporation. Its founder and sole stock holder is Jim Gearboy.
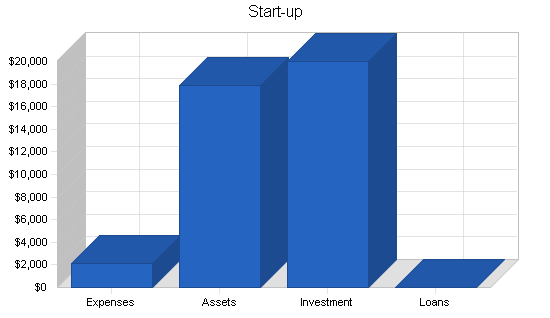
2.2 Start-up Summary
Nine Lives’ start-up costs will include:
- Computer system, with CD-RW, printer, Internet connection.
- Copier, fax.
- Assorted office supplies.
- Office furniture (used).
- Display equipment including racks, hangers, and shelves (these will be purchased used from a recent retailer bankruptcy.
- Mirrors (for theft protection, also to be found used).
- Bar code label printer, scanner and corresponding inventory management software.
- Advertising- in local outdoors publications and general newspaper in the outdoor section.
- Legal fees for the creation of the corporation and general business forms.
The items appropriate for depreciation will be depreciated using the straight-line method.
| Start-up | |
| Requirements | |
| Start-up Expenses | |
| Legal | $1,000 |
| Advertising | $1,000 |
| Office supplies | $150 |
| Other | $0 |
| Total Start-up Expenses | $2,150 |
| Start-up Assets | |
| Cash Required | $14,150 |
| Start-up Inventory | $0 |
| Other Current Assets | $0 |
| Long-term Assets | $3,700 |
| Total Assets | $17,850 |
| Total Requirements | $20,000 |
| Start-up Funding | |
| Start-up Expenses to Fund | $2,150 |
| Start-up Assets to Fund | $17,850 |
| Total Funding Required | $20,000 |
| Assets | |
| Non-cash Assets from Start-up | $3,700 |
| Cash Requirements from Start-up | $14,150 |
| Additional Cash Raised | $0 |
| Cash Balance on Starting Date | $14,150 |
| Total Assets | $17,850 |
| Liabilities and Capital | |
| Liabilities | |
| Current Borrowing | $0 |
| Long-term Liabilities | $0 |
| Accounts Payable (Outstanding Bills) | $0 |
| Other Current Liabilities (interest-free) | $0 |
| Total Liabilities | $0 |
| Capital | |
| Planned Investment | |
| Owner | $20,000 |
| Other | $0 |
| Additional Investment Requirement | $0 |
| Total Planned Investment | $20,000 |
| Loss at Start-up (Start-up Expenses) | ($2,150) |
| Total Capital | $17,850 |
| Total Capital and Liabilities | $17,850 |
| Total Funding | $20,000 |
Products
Nine Lives will sell a wide range of outdoor clothing and gear. The following is a partial list of the offerings at any one time:
- Fleece outerwear.
- Rain gear, waterproof as well as coated nylon.
- Thermal underwear.
- Synthetic clothing for sports or travel.
- Hats.
- Gloves.
- Gaiters.
- Shorts.
- Pants.
- Shirts.
- Packs.
- Sleeping bags.
- Sleeping pads.
- Tents.
- Duffel bags.
- Bicycles.
- Kayaks.
- Roof racks.
- Canoes.
- GPS.
- Cookware and stoves, and much much more.
Market Analysis Summary
The market for an outdoor clothing and gear consignment shop in Eugene is wide open. Eugene is the perfect community to support Nine Lives as it is a hotbed for outdoor activities. Additionally, there are no other used outdoor clothing and gear stores. By analogy, the used outdoor stores in Bend (half the size of Eugene) and Portland have done very well. For these reasons the market is ripe in Eugene for a store like Nine Lives.
4.1 Market Segmentation
Nine Lives will be focusing on three distinct groups of people that purchase outdoor clothing and gear:
- Outdoor participants with limited financial resources. This group of people has some discretionary income and enjoys spending time participating in outdoor activities. These customers however must maximize their limited money to be able to participate in the wide range of outdoor activities. For them, an outdoor consignment shop is ideal because for the same amount of money it allows them to have more or better equipment than they could get through traditional retail outlets.
- Gearheads. This is a group of people that collects outdoor gear. This is not a “poser” group; they actually use the stuff, they just like to have the right piece of clothing or gear for each individual occasion/ activity. Offering better prices than regular retail outlets allows them to buy more stuff for the same amount of money.
- Bargain hunters. This group will buy things because it is a good deal, not because they really need the item. While some of the used items will appeal to them, the manufacturers’ closeouts and seconds will really excite this group.

| Market Analysis | |||||||
| Year 1 | Year 2 | Year 3 | Year 4 | Year 5 | |||
| Potential Customers | Growth | CAGR | |||||
| Outdoor participants with limited financial resources | 9% | 27,014 | 27,014 | 29,445 | 32,095 | 34,984 | 6.68% |
| Gearheads | 8% | 14,025 | 14,025 | 15,147 | 16,359 | 17,668 | 5.94% |
| Bargain hunters | 8% | 10,584 | 11,431 | 12,345 | 13,333 | 14,400 | 8.00% |
| Total | 6.76% | 51,623 | 52,470 | 56,937 | 61,787 | 67,052 | 6.76% |
4.2 Target Market Segment Strategy
Nine Lives intends to target people that have a need for outdoor clothing and gear but do not have unlimited financial resources. Many or most outdoor enthusiasts do not have unlimited financial resources. This is a somewhat intuitive conclusion, these people value quality of life, and one aspect of this is free time in the outdoors. Spending a decent amount of time in the outdoors precludes being at the office making money concurrently. This is even more consistent with the choice of the market segment groups that live in Eugene. People typically choose to live in Eugene for its quality of life and wonderful outdoor activities, and people are willing to make significantly less (relatively) than in Portland because quality of life is so important.
With a large population of outdoor enthusiasts, particularly those that sacrifice financial gains for quality of life, Nine Lives has a large population base to draw off of. The University of Oregon is located in Eugene and has an active outdoor student body. Additionally, the U of O has a large Outdoor Program which will be a large source of buyers and sellers.
4.3 Industry Analysis
Nine Lives will be procuring the merchandise from a variety of sources:
- Individuals– These people believe that it is preferable to receive something for their goods rather than packing them up to a thrift store. Alternatively, these people might want the newest generation piece of gear or clothing and the way they finance this desire is by selling off their old stuff.
- Manufacturers– Sometimes the manufacturer will want to get rid of some of their inventory, whether because the merchandise is last year’s model or they have an overstock. In any case, they sometimes look to consignment shops to allow them to lower inventory.
- Retail store closeouts– Same rationale as the manufacturers.
- Manufacturer representatives– The representatives often have a large number of samples from many different manufacturers. After they no longer need the samples they will typically get rid of them as there is little purpose in holding onto the samples.
4.3.1 Competition and Buying Patterns
Currently there are no true direct competitors in Eugene. There are two Oregon competitors that have very similar product offerings although one is a consignment shop and the other is a normal retailer. The normal retailer (they buy new and used equipment and sell it to the public) is located in Portland and is doing well, and the similar style consignment shop is located in Bend, another outdoor friendly town, but with a much smaller population base (around 50,000 people instead of Eugene’s 130,000 people) and they are also doing well.

Nine Lives’ competition is present in Eugene in the form of new, retail outdoor stores, such as R.E.I. and McKenzie Outfitters. These retailers have a wider selection of goods, but have normal retail prices and no used merchandise.
Another form of competition is thrift stores that sell used clothing and equipment. The amount of decent used outdoor clothing and equipment floating around thrift stores is pretty small and it is hit and miss. In order to score the deals you have to regularly make the rounds at several thrift stores.
Although some outdoor enthusiasts, like so many other segments of the population, are fashion conscious, meaning the aesthetics of the item is truly important, many, if not a majority of outdoor enthusiasts are more concerned about performance then appearance. This may be explained because when you are in the woods there are not too many people watching you; Also, as long as the stuff holds up to abuse fashion does not really matter. Basically in outdoor clothing and gear, functionality or utility is suddenly more important then fashion. For these reasons people from many different economic levels will purchase used equipment as long as the element of functionality is met.
Strategy and Implementation Summary
Nine Lives will be heavily promoting the store early on to drive in both buyers as well as suppliers. Having a wide range of inventory is important and this can be best achieved through a two prong approach. The first is advertisements in local outdoor magazines/journals announcing the store and requesting people to bring in their extra clothing and gear to sell. The second approach will be by contacting outdoor manufacturers, retail outlets, and manufacturer representatives and alerting them to the option of selling their excess products at Nine Lives.
Nine Lives will be attempting to turn over inventory often to promote people coming in often to find some new bargains. This will be done through reasonable prices so customers feel that they are getting a good value.
5.1 Competitive Edge
Nine Lives competitive advantage is two-fold:
- A selection of used clothing and gear not replicated in the city. Although there are many different outdoor retailers in Eugene, there are none that sell used merchandise. Used merchandise can be up to 60% less expensive than the new counterpart, so there is definitely a draw to the product, particularly in a town where people enjoy their outdoor activities at the expense of making money.
- Superior, personalized customer service- although Nine Lives’ product is used clothing and gear, there is no reason to assume that the patrons of a used store deserve any less quality of customer service that you would expect from a top shelf retailer. Even consignment shop retailers have expectations of high service. At Nine Lives the customer will be treated with very personalized service. It is not unusual that consignment shops have regulars who visit often. With this in mind Nine Lives will have a database of customers and purchasing history so when they enter the store the sales person will have very personal information about the customer.
5.2 Sales Strategy
Nine Lives’ sales strategy will be based on solid retailing techniques of proper display and proper lighting. The store will be set up so that the floor space is divided up in thirds with the best sellers in the most accessible front third, and then the next best sellers in the second third, and so on. This will help highlight Nine Lives’s best offerings. In addition to this strategy for retail, the store will be well lit with natural lighting.
The clothing will be tagged with bar code price labels, providing inventory control as well as discouraging the modification of the prices by unethical customers.
Nine Lives will also be rotating their unsold stock every 90 days. This means that if an item is not sold within 90 days the owner will pick it up. Having forced inventory turnover provides an incentive for people to come in frequently in order to view the new items.
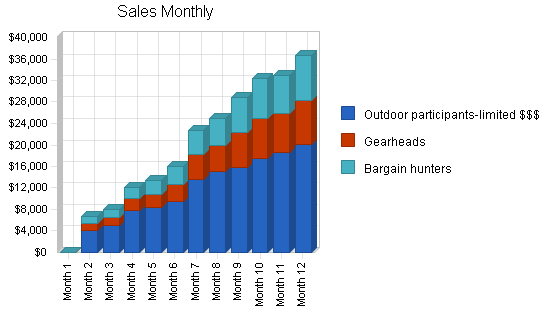
5.2.1 Sales Forecast
The first month will be used to get the store ready for business and there will be no sales activity. To prepare the store, display counters will be set up as will all of the racks. Dressing rooms will then be built. Month two will mark when the store is officially open, and business will be slow. During month two Nine Lives will begin to build up inventory. This will be done through advertising in the many different local outdoor magazines/ journals, as well as advertising at the University of Oregon generally, as well as through their Outdoor Program.
Month four will finally have a decent amount of sales activity and it should steadily improve from there.
| Sales Forecast | |||
| Year 1 | Year 2 | Year 3 | |
| Sales | |||
| Outdoor participants-limited $$$ | $135,152 | $185,214 | $210,412 |
| Gearheads | $50,048 | $63,541 | $68,547 |
| Bargain hunters | $49,570 | $62,545 | $65,122 |
| Total Sales | $234,770 | $311,300 | $344,081 |
| Direct Cost of Sales | Year 1 | Year 2 | Year 3 |
| Outdoor participants-limited $$$ | $67,576 | $92,607 | $105,206 |
| Gearheads | $25,024 | $31,771 | $34,274 |
| Bargain hunters | $24,785 | $31,273 | $32,561 |
| Subtotal Direct Cost of Sales | $117,385 | $155,650 | $172,041 |
5.3 Milestones
Nine Lives will have several milestones early on:
- Business plan completion. This will be done as a road map for the organization. While we do not need a business plan to raise capital, it will be an indispensable tool for the ongoing performance and improvement of the company.
- Completion of the store redesign and back office set up.
- Profitability.
- Year to date sales exceeding $100,000.
| Milestones | |||||
| Milestone | Start Date | End Date | Budget | Manager | Department |
| Business plan completion | 1/1/2001 | 2/1/2001 | $0 | Jim | Marketing |
| Completion of the store redesign and back office set up | 1/1/2001 | 2/1/2001 | $0 | Jim | Department |
| Profitability | 1/1/2001 | 6/30/2001 | $0 | everyone | Department |
| Y-T-D Sales exceed $100,000 | 1/1/2001 | 6/30/2001 | $0 | everyone | Department |
| Totals | $0 | ||||
Management Summary
Nine Lives is an Oregon corporation founded and owned by Jim Gearboy. Jim has a business degree from the University of Oregon. While pursuing his undergraduate degree, Jim had two different jobs. The first was as President of U of O’s Outdoor Program. For the program, Jim was their leader motivating the large number of members to pursue organizational goals. Additionally, Jim was responsible for the overall management of the organization. This experience was very valuable because it gave Jim some insight to, and experience in, running a company.
Jim, concurrently, was working at R.E.I. as a sales associate. Jim very much enjoyed this job as it allowed him to work with all of these toys that he enjoyed playing with, it was like being a kid in a candy store. Upon graduation, Jim became manager of the R.E.I. and suddenly his tasks went from sales and interacting with customers to managing the store which did not have much customer interaction. The management and training aspects were good skills to learn, but he longed to be closer to the customers.
These experiences gave Jim the confidence that he had the necessary skills sets to open his own store. He already knew that he had the passion for the outdoor industry and was confident that he would be thoroughly happy to work in the outdoor industry.
6.1 Personnel Plan
Jim will be working for Nine Lives full time as owner/general manager. By month two Nine Lives will bring on board one full-time sales associate. By month four Nine Lives will be in need of a second sales associate. The final employee will be another sales associate by month seven.
| Personnel Plan | |||
| Year 1 | Year 2 | Year 3 | |
| Jim | $24,000 | $30,000 | $36,000 |
| Sales associate | $15,840 | $17,500 | $18,000 |
| Sales associate | $12,960 | $17,500 | $18,000 |
| Sales associate | $8,640 | $17,500 | $18,000 |
| Total People | 4 | 4 | 4 |
| Total Payroll | $61,440 | $82,500 | $90,000 |
Financial Plan
The following sections will outline the important financial details.
7.1 Important Assumptions
The following table highlights some of the important financial assumptions.
| General Assumptions | |||
| Year 1 | Year 2 | Year 3 | |
| Plan Month | 1 | 2 | 3 |
| Current Interest Rate | 10.00% | 10.00% | 10.00% |
| Long-term Interest Rate | 10.00% | 10.00% | 10.00% |
| Tax Rate | 25.42% | 25.00% | 25.42% |
| Other | 0 | 0 | 0 |
7.2 Break-even Analysis
The Break-even Analysis indicates that monthly revenue will need to be $15,760 to break even.

| Break-even Analysis | |
| Monthly Revenue Break-even | $15,760 |
| Assumptions: | |
| Average Percent Variable Cost | 50% |
| Estimated Monthly Fixed Cost | $7,880 |
7.3 Projected Profit and Loss
The following table indicates the projected profit and loss.
| Pro Forma Profit and Loss | |||
| Year 1 | Year 2 | Year 3 | |
| Sales | $234,770 | $311,300 | $344,081 |
| Direct Cost of Sales | $117,385 | $155,650 | $172,041 |
| Other | $0 | $0 | $0 |
| Total Cost of Sales | $117,385 | $155,650 | $172,041 |
| Gross Margin | $117,385 | $155,650 | $172,041 |
| Gross Margin % | 50.00% | 50.00% | 50.00% |
| Expenses | |||
| Payroll | $61,440 | $82,500 | $90,000 |
| Sales and Marketing and Other Expenses | $2,400 | $2,400 | $2,400 |
| Depreciation | $1,200 | $1,200 | $1,300 |
| Rent | $18,000 | $1,800 | $1,800 |
| Rent | $804 | $804 | $804 |
| Leased Equipment | $0 | $0 | $0 |
| Utilities | $1,500 | $1,500 | $1,500 |
| Payroll Taxes | $9,216 | $12,375 | $13,500 |
| Other | $0 | $0 | $0 |
| Total Operating Expenses | $94,560 | $102,579 | $111,304 |
| Profit Before Interest and Taxes | $22,825 | $53,071 | $60,737 |
| EBITDA | $24,025 | $54,271 | $62,037 |
| Interest Expense | $0 | $0 | $0 |
| Taxes Incurred | $5,492 | $13,268 | $15,437 |
| Net Profit | $17,333 | $39,803 | $45,299 |
| Net Profit/Sales | 7.38% | 12.79% | 13.17% |
7.4 Projected Cash Flow
The following chart and table indicates projected cash flow.

| Pro Forma Cash Flow | |||
| Year 1 | Year 2 | Year 3 | |
| Cash Received | |||
| Cash from Operations | |||
| Cash Sales | $234,770 | $311,300 | $344,081 |
| Subtotal Cash from Operations | $234,770 | $311,300 | $344,081 |
| Additional Cash Received | |||
| Sales Tax, VAT, HST/GST Received | $0 | $0 | $0 |
| New Current Borrowing | $0 | $0 | $0 |
| New Other Liabilities (interest-free) | $0 | $0 | $0 |
| New Long-term Liabilities | $0 | $0 | $0 |
| Sales of Other Current Assets | $0 | $0 | $0 |
| Sales of Long-term Assets | $0 | $0 | $0 |
| New Investment Received | $0 | $0 | $0 |
| Subtotal Cash Received | $234,770 | $311,300 | $344,081 |
| Expenditures | Year 1 | Year 2 | Year 3 |
| Expenditures from Operations | |||
| Cash Spending | $61,440 | $82,500 | $90,000 |
| Bill Payments | $150,306 | $203,071 | $208,991 |
| Subtotal Spent on Operations | $211,746 | $285,571 | $298,991 |
| Additional Cash Spent | |||
| Sales Tax, VAT, HST/GST Paid Out | $0 | $0 | $0 |
| Principal Repayment of Current Borrowing | $0 | $0 | $0 |
| Other Liabilities Principal Repayment | $0 | $0 | $0 |
| Long-term Liabilities Principal Repayment | $0 | $0 | $0 |
| Purchase Other Current Assets | $0 | $0 | $0 |
| Purchase Long-term Assets | $0 | $0 | $0 |
| Dividends | $0 | $0 | $0 |
| Subtotal Cash Spent | $211,746 | $285,571 | $298,991 |
| Net Cash Flow | $23,024 | $25,729 | $45,090 |
| Cash Balance | $37,174 | $62,903 | $107,993 |
7.5 Projected Balance Sheet
The following table indicates the projected balance sheet.
| Pro Forma Balance Sheet | |||
| Year 1 | Year 2 | Year 3 | |
| Assets | |||
| Current Assets | |||
| Cash | $37,174 | $62,903 | $107,993 |
| Inventory | $20,181 | $26,760 | $29,578 |
| Other Current Assets | $0 | $0 | $0 |
| Total Current Assets | $57,355 | $89,663 | $137,571 |
| Long-term Assets | |||
| Long-term Assets | $3,700 | $3,700 | $3,700 |
| Accumulated Depreciation | $1,200 | $2,400 | $3,700 |
| Total Long-term Assets | $2,500 | $1,300 | $0 |
| Total Assets | $59,855 | $90,963 | $137,571 |
| Liabilities and Capital | Year 1 | Year 2 | Year 3 |
| Current Liabilities | |||
| Accounts Payable | $24,672 | $15,976 | $17,285 |
| Current Borrowing | $0 | $0 | $0 |
| Other Current Liabilities | $0 | $0 | $0 |
| Subtotal Current Liabilities | $24,672 | $15,976 | $17,285 |
| Long-term Liabilities | $0 | $0 | $0 |
| Total Liabilities | $24,672 | $15,976 | $17,285 |
| Paid-in Capital | $20,000 | $20,000 | $20,000 |
| Retained Earnings | ($2,150) | $15,183 | $54,987 |
| Earnings | $17,333 | $39,803 | $45,299 |
| Total Capital | $35,183 | $74,987 | $120,286 |
| Total Liabilities and Capital | $59,855 | $90,963 | $137,571 |
| Net Worth | $35,183 | $74,987 | $120,286 |
7.6 Business Ratios
Business ratios for the years of this plan are shown below. Industry profile ratios based on the Standard Industrial Classification (SIC) code 5932, Used Merchandise Stores, are shown for comparison.
| Ratio Analysis | ||||
| Year 1 | Year 2 | Year 3 | Industry Profile | |
| Sales Growth | 0.00% | 32.60% | 10.53% | 6.20% |
| Percent of Total Assets | ||||
| Inventory | 33.72% | 29.42% | 21.50% | 40.70% |
| Other Current Assets | 0.00% | 0.00% | 0.00% | 23.80% |
| Total Current Assets | 95.82% | 98.57% | 100.00% | 80.80% |
| Long-term Assets | 4.18% | 1.43% | 0.00% | 19.20% |
| Total Assets | 100.00% | 100.00% | 100.00% | 100.00% |
| Current Liabilities | 41.22% | 17.56% | 12.56% | 47.60% |
| Long-term Liabilities | 0.00% | 0.00% | 0.00% | 12.00% |
| Total Liabilities | 41.22% | 17.56% | 12.56% | 59.60% |
| Net Worth | 58.78% | 82.44% | 87.44% | 40.40% |
| Percent of Sales | ||||
| Sales | 100.00% | 100.00% | 100.00% | 100.00% |
| Gross Margin | 50.00% | 50.00% | 50.00% | 31.00% |
| Selling, General & Administrative Expenses | 43.09% | 37.50% | 37.00% | 17.10% |
| Advertising Expenses | 1.02% | 0.77% | 0.70% | 1.80% |
| Profit Before Interest and Taxes | 9.72% | 17.05% | 17.65% | 1.40% |
| Main Ratios | ||||
| Current | 2.32 | 5.61 | 7.96 | 2.11 |
| Quick | 1.51 | 3.94 | 6.25 | 0.80 |
| Total Debt to Total Assets | 41.22% | 17.56% | 12.56% | 59.60% |
| Pre-tax Return on Net Worth | 64.87% | 70.77% | 50.49% | 3.40% |
| Pre-tax Return on Assets | 38.13% | 58.34% | 44.15% | 8.40% |
| Additional Ratios | Year 1 | Year 2 | Year 3 | |
| Net Profit Margin | 7.38% | 12.79% | 13.17% | n.a |
| Return on Equity | 49.27% | 53.08% | 37.66% | n.a |
| Activity Ratios | ||||
| Inventory Turnover | 10.91 | 6.63 | 6.11 | n.a |
| Accounts Payable Turnover | 7.09 | 12.17 | 12.17 | n.a |
| Payment Days | 27 | 38 | 29 | n.a |
| Total Asset Turnover | 3.92 | 3.42 | 2.50 | n.a |
| Debt Ratios | ||||
| Debt to Net Worth | 0.70 | 0.21 | 0.14 | n.a |
| Current Liab. to Liab. | 1.00 | 1.00 | 1.00 | n.a |
| Liquidity Ratios | ||||
| Net Working Capital | $32,683 | $73,687 | $120,286 | n.a |
| Interest Coverage | 0.00 | 0.00 | 0.00 | n.a |
| Additional Ratios | ||||
| Assets to Sales | 0.25 | 0.29 | 0.40 | n.a |
| Current Debt/Total Assets | 41% | 18% | 13% | n.a |
| Acid Test | 1.51 | 3.94 | 6.25 | n.a |
| Sales/Net Worth | 6.67 | 4.15 | 2.86 | n.a |
| Dividend Payout | 0.00 | 0.00 | 0.00 | n.a |
Appendix
| Sales Forecast | |||||||||||||
| Month 1 | Month 2 | Month 3 | Month 4 | Month 5 | Month 6 | Month 7 | Month 8 | Month 9 | Month 10 | Month 11 | Month 12 | ||
| Sales | |||||||||||||
| Outdoor participants-limited $$$ | 0% | $0 | $4,125 | $4,987 | $7,845 | $8,325 | $9,458 | $13,545 | $14,995 | $15,855 | $17,458 | $18,545 | $20,014 |
| Gearheads | 0% | $0 | $1,325 | $1,514 | $2,125 | $2,514 | $3,250 | $4,654 | $5,002 | $6,511 | $7,545 | $7,254 | $8,354 |
| Bargain hunters | 0% | $0 | $1,300 | $1,499 | $2,147 | $2,503 | $3,215 | $4,512 | $5,000 | $6,474 | $7,454 | $7,141 | $8,325 |
| Total Sales | $0 | $6,750 | $8,000 | $12,117 | $13,342 | $15,923 | $22,711 | $24,997 | $28,840 | $32,457 | $32,940 | $36,693 | |
| Direct Cost of Sales | Month 1 | Month 2 | Month 3 | Month 4 | Month 5 | Month 6 | Month 7 | Month 8 | Month 9 | Month 10 | Month 11 | Month 12 | |
| Outdoor participants-limited $$$ | $0 | $2,063 | $2,494 | $3,923 | $4,163 | $4,729 | $6,773 | $7,498 | $7,928 | $8,729 | $9,273 | $10,007 | |
| Gearheads | $0 | $663 | $757 | $1,063 | $1,257 | $1,625 | $2,327 | $2,501 | $3,256 | $3,773 | $3,627 | $4,177 | |
| Bargain hunters | $0 | $650 | $750 | $1,074 | $1,252 | $1,608 | $2,256 | $2,500 | $3,237 | $3,727 | $3,571 | $4,163 | |
| Subtotal Direct Cost of Sales | $0 | $3,375 | $4,000 | $6,059 | $6,671 | $7,962 | $11,356 | $12,499 | $14,420 | $16,229 | $16,470 | $18,347 | |
| Personnel Plan | |||||||||||||
| Month 1 | Month 2 | Month 3 | Month 4 | Month 5 | Month 6 | Month 7 | Month 8 | Month 9 | Month 10 | Month 11 | Month 12 | ||
| Jim | 0% | $2,000 | $2,000 | $2,000 | $2,000 | $2,000 | $2,000 | $2,000 | $2,000 | $2,000 | $2,000 | $2,000 | $2,000 |
| Sales associate | 0% | $0 | $1,440 | $1,440 | $1,440 | $1,440 | $1,440 | $1,440 | $1,440 | $1,440 | $1,440 | $1,440 | $1,440 |
| Sales associate | 0% | $0 | $0 | $0 | $1,440 | $1,440 | $1,440 | $1,440 | $1,440 | $1,440 | $1,440 | $1,440 | $1,440 |
| Sales associate | 0% | $0 | $0 | $0 | $0 | $0 | $0 | $1,440 | $1,440 | $1,440 | $1,440 | $1,440 | $1,440 |
| Total People | 1 | 2 | 2 | 3 | 3 | 3 | 4 | 4 | 4 | 4 | 4 | 4 | |
| Total Payroll | $2,000 | $3,440 | $3,440 | $4,880 | $4,880 | $4,880 | $6,320 | $6,320 | $6,320 | $6,320 | $6,320 | $6,320 | |
| General Assumptions | |||||||||||||
| Month 1 | Month 2 | Month 3 | Month 4 | Month 5 | Month 6 | Month 7 | Month 8 | Month 9 | Month 10 | Month 11 | Month 12 | ||
| Plan Month | 1 | 2 | 3 | 4 | 5 | 6 | 7 | 8 | 9 | 10 | 11 | 12 | |
| Current Interest Rate | 10.00% | 10.00% | 10.00% | 10.00% | 10.00% | 10.00% | 10.00% | 10.00% | 10.00% | 10.00% | 10.00% | 10.00% | |
| Long-term Interest Rate | 10.00% | 10.00% | 10.00% | 10.00% | 10.00% | 10.00% | 10.00% | 10.00% | 10.00% | 10.00% | 10.00% | 10.00% | |
| Tax Rate | 30.00% | 25.00% | 25.00% | 25.00% | 25.00% | 25.00% | 25.00% | 25.00% | 25.00% | 25.00% | 25.00% | 25.00% | |
| Other | 0 | 0 | 0 | 0 | 0 | 0 | 0 | 0 | 0 | 0 | 0 | 0 | |
| Pro Forma Profit and Loss | |||||||||||||
| Month 1 | Month 2 | Month 3 | Month 4 | Month 5 | Month 6 | Month 7 | Month 8 | Month 9 | Month 10 | Month 11 | Month 12 | ||
| Sales | $0 | $6,750 | $8,000 | $12,117 | $13,342 | $15,923 | $22,711 | $24,997 | $28,840 | $32,457 | $32,940 | $36,693 | |
| Direct Cost of Sales | $0 | $3,375 | $4,000 | $6,059 | $6,671 | $7,962 | $11,356 | $12,499 | $14,420 | $16,229 | $16,470 | $18,347 | |
| Other | $0 | $0 | $0 | $0 | $0 | $0 | $0 | $0 | $0 | $0 | $0 | $0 | |
| Total Cost of Sales | $0 | $3,375 | $4,000 | $6,059 | $6,671 | $7,962 | $11,356 | $12,499 | $14,420 | $16,229 | $16,470 | $18,347 | |
| Gross Margin | $0 | $3,375 | $4,000 | $6,059 | $6,671 | $7,962 | $11,356 | $12,499 | $14,420 | $16,229 | $16,470 | $18,347 | |
| Gross Margin % | 0.00% | 50.00% | 50.00% | 50.00% | 50.00% | 50.00% | 50.00% | 50.00% | 50.00% | 50.00% | 50.00% | 50.00% | |
| Expenses | |||||||||||||
| Payroll | $2,000 | $3,440 | $3,440 | $4,880 | $4,880 | $4,880 | $6,320 | $6,320 | $6,320 | $6,320 | $6,320 | $6,320 | |
| Sales and Marketing and Other Expenses | $200 | $200 | $200 | $200 | $200 | $200 | $200 | $200 | $200 | $200 | $200 | $200 | |
| Depreciation | $100 | $100 | $100 | $100 | $100 | $100 | $100 | $100 | $100 | $100 | $100 | $100 | |
| Rent | $1,500 | $1,500 | $1,500 | $1,500 | $1,500 | $1,500 | $1,500 | $1,500 | $1,500 | $1,500 | $1,500 | $1,500 | |
| Rent | $67 | $67 | $67 | $67 | $67 | $67 | $67 | $67 | $67 | $67 | $67 | $67 | |
| Leased Equipment | $0 | $0 | $0 | $0 | $0 | $0 | $0 | $0 | $0 | $0 | $0 | $0 | |
| Utilities | $125 | $125 | $125 | $125 | $125 | $125 | $125 | $125 | $125 | $125 | $125 | $125 | |
| Payroll Taxes | 15% | $300 | $516 | $516 | $732 | $732 | $732 | $948 | $948 | $948 | $948 | $948 | $948 |
| Other | $0 | $0 | $0 | $0 | $0 | $0 | $0 | $0 | $0 | $0 | $0 | $0 | |
| Total Operating Expenses | $4,292 | $5,948 | $5,948 | $7,604 | $7,604 | $7,604 | $9,260 | $9,260 | $9,260 | $9,260 | $9,260 | $9,260 | |
| Profit Before Interest and Taxes | ($4,292) | ($2,573) | ($1,948) | ($1,546) | ($933) | $358 | $2,096 | $3,239 | $5,160 | $6,969 | $7,210 | $9,087 | |
| EBITDA | ($4,192) | ($2,473) | ($1,848) | ($1,446) | ($833) | $458 | $2,196 | $3,339 | $5,260 | $7,069 | $7,310 | $9,187 | |
| Interest Expense | $0 | $0 | $0 | $0 | $0 | $0 | $0 | $0 | $0 | $0 | $0 | $0 | |
| Taxes Incurred | ($1,288) | ($643) | ($487) | ($386) | ($233) | $89 | $524 | $810 | $1,290 | $1,742 | $1,803 | $2,272 | |
| Net Profit | ($3,004) | ($1,930) | ($1,461) | ($1,159) | ($700) | $268 | $1,572 | $2,429 | $3,870 | $5,226 | $5,408 | $6,815 | |
| Net Profit/Sales | 0.00% | -28.59% | -18.26% | -9.57% | -5.24% | 1.68% | 6.92% | 9.72% | 13.42% | 16.10% | 16.42% | 18.57% | |
| Pro Forma Cash Flow | |||||||||||||
| Month 1 | Month 2 | Month 3 | Month 4 | Month 5 | Month 6 | Month 7 | Month 8 | Month 9 | Month 10 | Month 11 | Month 12 | ||
| Cash Received | |||||||||||||
| Cash from Operations | |||||||||||||
| Cash Sales | $0 | $6,750 | $8,000 | $12,117 | $13,342 | $15,923 | $22,711 | $24,997 | $28,840 | $32,457 | $32,940 | $36,693 | |
| Subtotal Cash from Operations | $0 | $6,750 | $8,000 | $12,117 | $13,342 | $15,923 | $22,711 | $24,997 | $28,840 | $32,457 | $32,940 | $36,693 | |
| Additional Cash Received | |||||||||||||
| Sales Tax, VAT, HST/GST Received | 0.00% | $0 | $0 | $0 | $0 | $0 | $0 | $0 | $0 | $0 | $0 | $0 | $0 |
| New Current Borrowing | $0 | $0 | $0 | $0 | $0 | $0 | $0 | $0 | $0 | $0 | $0 | $0 | |
| New Other Liabilities (interest-free) | $0 | $0 | $0 | $0 | $0 | $0 | $0 | $0 | $0 | $0 | $0 | $0 | |
| New Long-term Liabilities | $0 | $0 | $0 | $0 | $0 | $0 | $0 | $0 | $0 | $0 | $0 | $0 | |
| Sales of Other Current Assets | $0 | $0 | $0 | $0 | $0 | $0 | $0 | $0 | $0 | $0 | $0 | $0 | |
| Sales of Long-term Assets | $0 | $0 | $0 | $0 | $0 | $0 | $0 | $0 | $0 | $0 | $0 | $0 | |
| New Investment Received | $0 | $0 | $0 | $0 | $0 | $0 | $0 | $0 | $0 | $0 | $0 | $0 | |
| Subtotal Cash Received | $0 | $6,750 | $8,000 | $12,117 | $13,342 | $15,923 | $22,711 | $24,997 | $28,840 | $32,457 | $32,940 | $36,693 | |
| Expenditures | Month 1 | Month 2 | Month 3 | Month 4 | Month 5 | Month 6 | Month 7 | Month 8 | Month 9 | Month 10 | Month 11 | Month 12 | |
| Expenditures from Operations | |||||||||||||
| Cash Spending | $2,000 | $3,440 | $3,440 | $4,880 | $4,880 | $4,880 | $6,320 | $6,320 | $6,320 | $6,320 | $6,320 | $6,320 | |
| Bill Payments | $30 | $1,169 | $8,777 | $6,740 | $10,533 | $9,814 | $12,306 | $18,418 | $17,514 | $20,735 | $22,753 | $21,516 | |
| Subtotal Spent on Operations | $2,030 | $4,609 | $12,217 | $11,620 | $15,413 | $14,694 | $18,626 | $24,738 | $23,834 | $27,055 | $29,073 | $27,836 | |
| Additional Cash Spent | |||||||||||||
| Sales Tax, VAT, HST/GST Paid Out | $0 | $0 | $0 | $0 | $0 | $0 | $0 | $0 | $0 | $0 | $0 | $0 | |
| Principal Repayment of Current Borrowing | $0 | $0 | $0 | $0 | $0 | $0 | $0 | $0 | $0 | $0 | $0 | $0 | |
| Other Liabilities Principal Repayment | $0 | $0 | $0 | $0 | $0 | $0 | $0 | $0 | $0 | $0 | $0 | $0 | |
| Long-term Liabilities Principal Repayment | $0 | $0 | $0 | $0 | $0 | $0 | $0 | $0 | $0 | $0 | $0 | $0 | |
| Purchase Other Current Assets | $0 | $0 | $0 | $0 | $0 | $0 | $0 | $0 | $0 | $0 | $0 | $0 | |
| Purchase Long-term Assets | $0 | $0 | $0 | $0 | $0 | $0 | $0 | $0 | $0 | $0 | $0 | $0 | |
| Dividends | $0 | $0 | $0 | $0 | $0 | $0 | $0 | $0 | $0 | $0 | $0 | $0 | |
| Subtotal Cash Spent | $2,030 | $4,609 | $12,217 | $11,620 | $15,413 | $14,694 | $18,626 | $24,738 | $23,834 | $27,055 | $29,073 | $27,836 | |
| Net Cash Flow | ($2,030) | $2,141 | ($4,217) | $497 | ($2,071) | $1,229 | $4,085 | $259 | $5,006 | $5,402 | $3,867 | $8,857 | |
| Cash Balance | $12,120 | $14,261 | $10,043 | $10,540 | $8,469 | $9,698 | $13,782 | $14,041 | $19,047 | $24,450 | $28,317 | $37,174 | |
| Pro Forma Balance Sheet | |||||||||||||
| Month 1 | Month 2 | Month 3 | Month 4 | Month 5 | Month 6 | Month 7 | Month 8 | Month 9 | Month 10 | Month 11 | Month 12 | ||
| Assets | Starting Balances | ||||||||||||
| Current Assets | |||||||||||||
| Cash | $14,150 | $12,120 | $14,261 | $10,043 | $10,540 | $8,469 | $9,698 | $13,782 | $14,041 | $19,047 | $24,450 | $28,317 | $37,174 |
| Inventory | $0 | $0 | $3,713 | $4,400 | $6,664 | $7,338 | $8,758 | $12,491 | $13,748 | $15,862 | $17,851 | $18,117 | $20,181 |
| Other Current Assets | $0 | $0 | $0 | $0 | $0 | $0 | $0 | $0 | $0 | $0 | $0 | $0 | $0 |
| Total Current Assets | $14,150 | $12,120 | $17,973 | $14,443 | $17,204 | $15,807 | $18,455 | $26,273 | $27,790 | $34,909 | $42,301 | $46,434 | $57,355 |
| Long-term Assets | |||||||||||||
| Long-term Assets | $3,700 | $3,700 | $3,700 | $3,700 | $3,700 | $3,700 | $3,700 | $3,700 | $3,700 | $3,700 | $3,700 | $3,700 | $3,700 |
| Accumulated Depreciation | $0 | $100 | $200 | $300 | $400 | $500 | $600 | $700 | $800 | $900 | $1,000 | $1,100 | $1,200 |
| Total Long-term Assets | $3,700 | $3,600 | $3,500 | $3,400 | $3,300 | $3,200 | $3,100 | $3,000 | $2,900 | $2,800 | $2,700 | $2,600 | $2,500 |
| Total Assets | $17,850 | $15,720 | $21,473 | $17,843 | $20,504 | $19,007 | $21,555 | $29,273 | $30,690 | $37,709 | $45,001 | $49,034 | $59,855 |
| Liabilities and Capital | Month 1 | Month 2 | Month 3 | Month 4 | Month 5 | Month 6 | Month 7 | Month 8 | Month 9 | Month 10 | Month 11 | Month 12 | |
| Current Liabilities | |||||||||||||
| Accounts Payable | $0 | $874 | $8,557 | $6,388 | $10,208 | $9,411 | $11,691 | $17,838 | $16,825 | $19,975 | $22,040 | $20,666 | $24,672 |
| Current Borrowing | $0 | $0 | $0 | $0 | $0 | $0 | $0 | $0 | $0 | $0 | $0 | $0 | $0 |
| Other Current Liabilities | $0 | $0 | $0 | $0 | $0 | $0 | $0 | $0 | $0 | $0 | $0 | $0 | $0 |
| Subtotal Current Liabilities | $0 | $874 | $8,557 | $6,388 | $10,208 | $9,411 | $11,691 | $17,838 | $16,825 | $19,975 | $22,040 | $20,666 | $24,672 |
| Long-term Liabilities | $0 | $0 | $0 | $0 | $0 | $0 | $0 | $0 | $0 | $0 | $0 | $0 | $0 |
| Total Liabilities | $0 | $874 | $8,557 | $6,388 | $10,208 | $9,411 | $11,691 | $17,838 | $16,825 | $19,975 | $22,040 | $20,666 | $24,672 |
| Paid-in Capital | $20,000 | $20,000 | $20,000 | $20,000 | $20,000 | $20,000 | $20,000 | $20,000 | $20,000 | $20,000 | $20,000 | $20,000 | $20,000 |
| Retained Earnings | ($2,150) | ($2,150) | ($2,150) | ($2,150) | ($2,150) | ($2,150) | ($2,150) | ($2,150) | ($2,150) | ($2,150) | ($2,150) | ($2,150) | ($2,150) |
| Earnings | $0 | ($3,004) | ($4,934) | ($6,395) | ($7,554) | ($8,254) | ($7,986) | ($6,414) | ($3,985) | ($115) | $5,111 | $10,518 | $17,333 |
| Total Capital | $17,850 | $14,846 | $12,916 | $11,455 | $10,296 | $9,596 | $9,864 | $11,436 | $13,865 | $17,735 | $22,961 | $28,368 | $35,183 |
| Total Liabilities and Capital | $17,850 | $15,720 | $21,473 | $17,843 | $20,504 | $19,007 | $21,555 | $29,273 | $30,690 | $37,709 | $45,001 | $49,034 | $59,855 |
| Net Worth | $17,850 | $14,846 | $12,916 | $11,455 | $10,296 | $9,596 | $9,864 | $11,436 | $13,865 | $17,735 | $22,961 | $28,368 | $35,183 |


