
Supple Software--UK
Executive Summary
We want to take Supple Software to the next level.
Supple is a profitable Limited Company based in Ourtown. It has grown from a one-man consulting company started in 2000 to a market leading software company whose main product, Product X, is sold through major retail channels.
Growth has come from patience, hard work, and quality of product and service. The company has never had outside investment. It has been financed by owner house equity, sweat equity, profits, and small bank lines of credit.
As we grow, we want to grow right. For example, we have to recognize the unique capital requirements of a successful software publisher: our business is working-capital intensive. We will always have to support two and three months worth of sales as receivables, because that is the nature of the channels we deal with. Also, we need to build our management team correctly. We need the right people in the right place at the right time. We also need to develop our team so that our people can grow as the company grows.
1.1 Objectives
- To increase sales substantially in Year 2 and double sales in Year 3.
- To increase gross margin and net profit margin commensurate with sales.
- To hold personnel to 1 full-time person for every £250K in revenues.
- To maintain at least 30% market share of Product X, as measured by Chart Track, the European software data tracking service.
1.2 Mission
Supple Software develops, publishes, and markets business tools and business know-how together in a software product including software and documentation. It makes business techniques accessible to millions of business users who would otherwise not have the knowledge to use them. It makes a profit and generates cash. It provides a rewarding work environment and fair compensation to its employees, a fair return to its owners, and a fair royalty to its authors.
1.3 Keys to Success
- Marketing power. We need to have our products on the shelves with attractive packaging and enough marketing power to maintain a 30% or more market share, as measured by Chart Tracker.
- Product quality and customer satisfaction. Everything we sell is guaranteed, so the product has to do what we promise and well.
- Long-term customer satisfaction is critical to our survival.
- The right management team, with strong foundations in marketing, management, finance, and product development. Enough working capital to survive in the working-capital-intensive retail channel.

Company Summary
Supple Software was founded by Ralph Smith to market his Product X software. It was originally installed in a home office, but moved into its present space two years ago. It has added several new products, and has acquired shelf space in the retail market.
2.1 Company Ownership
Supple Software, Ltd is now a Limited Company owned entirely by founder Ralph Smith and his wife Mabel. The UK Limited Company was established with 100 shares issued, 51 to Ralph Smith and 49 to Mabel Smith.
2.2 Company History
Supple Software, Inc. was founded in Ourtown as Infoplan, a sole trader. In its second year it was registered with Companies House as Infoplan, Ltd. Two years later it was registered with Companies House as Supple Software, Ltd. Infoplan, Ltd. was dissolved.
For most of its existence, this was a one-man consulting company supporting a product company. It kept a very conservative stance on products, advertising with very slim budgets, with marketing depending mainly on published reviews and direct sales, until the market grew.
In two years ago we introduced a new, break-through Product X, that was the first effective task X software with bundled spreadsheet and word processor along with automatic charts.

| Past Performance | |||
| 2002 | 2003 | 2004 | |
| Sales | £384,113 | £464,592 | £695,136 |
| Gross Margin | £270,062 | £342,824 | £480,163 |
| Gross Margin % | 70.31% | 73.79% | 69.07% |
| Operating Expenses | £251,471 | £290,145 | £513,144 |
| Collection Period (days) | 0 | 0 | 34 |
| Inventory Turnover | 7.00 | 6.00 | 6.00 |
| Balance Sheet | |||
| 2002 | 2003 | 2004 | |
| Current Assets | |||
| Cash | £0 | £0 | £625 |
| Accounts Receivable | £0 | £0 | £124,056 |
| Inventory | £0 | £0 | £28,623 |
| Other Current Assets | £0 | £0 | £431 |
| Total Current Assets | £0 | £0 | £153,735 |
| Long-term Assets | |||
| Long-term Assets | £0 | £0 | £35,577 |
| Accumulated Depreciation | £0 | £0 | £24,247 |
| Total Long-term Assets | £0 | £0 | £11,330 |
| Total Assets | £0 | £0 | £165,065 |
| Current Liabilities | |||
| Accounts Payable | £0 | £0 | £36,557 |
| Current Borrowing | £0 | £0 | £22,336 |
| Other Current Liabilities (interest free) | £0 | £0 | £25,526 |
| Total Current Liabilities | £0 | £0 | £84,419 |
| Long-term Liabilities | £0 | £0 | £0 |
| Total Liabilities | £0 | £0 | £84,419 |
| Paid-in Capital | £0 | £0 | £76,960 |
| Retained Earnings | £0 | £0 | £36,668 |
| Earnings | £0 | £0 | (£32,982) |
| Total Capital | £0 | £0 | £80,646 |
| Total Capital and Liabilities | £0 | £0 | £165,065 |
| Other Inputs | |||
| Payment Days | 0 | 0 | 30 |
| Sales on Credit | £0 | £0 | £660,379 |
| Receivables Turnover | 0.00 | 0.00 | 5.32 |
2.3 Company Locations and Facilities
The company is located in Ourtown, with offices at 100 High Street. We were started in a home office but we moved to the present space two years ago. We rent 750 square feet for £225 per week. We have a two-year lease limiting rent increases.
Products
Our products are prescriptive software, more than just tools, because they instruct and empower the user with know-how as well as tools. Our best-selling flagship, Product X, is the key. We are also shipping Product Y for Windows.
People don’t buy these products for the software itself. They buy them for the benefit they provide, the step-by-step solution to a problem. They buy them for the reassurance that they’ve covered all the bases, that the job is done right, that they won’t be embarrassed when they show the plan to banker, boss, or partner. They don’t want the software, they want the task completed. They want it done and done well.
The company name is well known and its products are respected. We have sold more than 70,000 units through distribution, and we have names and address of more than 40,000 direct buyers and registered users. Our products are sold through several major mail order houses, several computer retail chains, and listed in most available product databases. We are now distributed through the major distributors who reach the most important retail channels. Throughout, Supple Software has maintained a high professional standard and a reputation as the quality provider.
3.1 Product Description
- Product X: Suggested Retail Price £XX, street price £XX, the leading Windows task X software in the UK and European Union market, according to Chart Tracker, and the quality leader according to prestigious publications ranging from PC magazine to PC Advisor and even Journal of Business Strategy. This is the best task X application on the market, according to the objective analysis of most published reviews. It combines an easy-to-use, step-by-step interface full of guidance, help, and glossaries, with a powerful business analysis model, complete financial analysis, and very strong cash flow analysis. Sales literature and texts of reviews are included in the appendix.
- Product Y: Suggested Retail Price £XX, street price £XX, a stand-alone task Y application for Windows. This product is more than just that, because it also includes complete [omitted]. It is the best product available for creating a task Y, and the only product for day-to-day management of the [omitted] function. Reviews and sales literature are included with this plan.
- Product Z: Suggested Retail Price £XX, street price £XX, a stand-alone task Y application for Windows. This product is more than just that, because it also includes complete [omitted]. It is the best product available for creating a task Y, and the only product for day-to-day management of the [omitted] function. Reviews and sales literature are included with this plan.
3.2 Sales Literature
Sales literature and collaterals are attached to this plan, as appendices. The literature shows how we have developed the Product X and Product Y packaging and advertising, with consistent look and “seven easy steps” theme.
3.3 Competitive Comparison
In the broader sense, our competition is books, magazines, courses, seminars, consultants, and assorted experts — anything that helps our target market get through the tasks on which we focus. The bulk of the target market wants an easy way to successfully complete a difficult task, along with assurance that the end result will look competent. Our part of the market is the software component, Windows-based software to develop [omitted], sold through retail at £XX per unit.

At present we compete mainly against three other task X packages sold through retail: The traditional leader is Product A, by Competitor A. Third place is held by Competitor B, with a product called Product B The fourth competitor is Product C, by Company C. The appendix include charts illustrating complete data on market share, in units and pounds, for the past year.
Company A is a formidable competitor. They are also privately owned, but they are apparently well financed. A started just a few months after we did, with similar but inferior product, and better marketing. AAA has consistently been more aggressive with sales and marketing expenses, and plain better at marketing than we were. They imitated our early template products, and since then built a line of template-based products including not just AAA, but also a line of purpose specific Maker/Builder products. Despite the broad product line, however, they still depend as much on AAA as we do on Product X. Their other products add bulk to their ads, but really, only the AAA product appears on the retail shelves.
A’s AAA has been the market leader, with 45% unit share as measured by Chart Tracker, the leading source of retail market data in the UK and Europe. AAA was first into retail, and is advertised aggressively in some small business magazines and in Skymall catalogues in airlines. In 2002, Product X appeared on the market as the first stand-alone product (meaning that it included everything needed in an all-in-one application) when AAA was still just templates (meaning data files to work with other applications such as word processors or spreadsheets). Our product won warm praise from reviewers everywhere, and a lot of shelf space, so Product X rose quickly to a brief stay as the top seller, before AAA mustered its marketing skills and fought back with new packaging, aggressive advertising, and a lot of spending on in-store programs. Last November AAA finally introduced what they call “interactive” AAA, which is finally better than a template. However, it is very hard to work with and doesn’t appear to pose a serious threat to our superiority in terms of product quality and reviews.
Third in the market, behind us, Company B seems to be fading. Their product, BBB is clumsy and old fashioned, text-based, and weak on tables and has no charts. It has reasonably good-looking packaging and a lot of inertia from years in the market. Its 2003 market share was 22%, according to Chart Tracker.
The fourth-place competitor last year had 3%, but could still become a serious competitor. Company C publishes CCC, which is a poor imitation of our first version of Product X. CCC is well funded by a shipping magnate worth several hundred million pounds, and is not a public institution, despite the public-sounding name. CCC has embarked on an ambitious product plan to create not only Product X, but also Product Y, and a series of others. They are marketing these products in a way that hypes their bundled word processor and spreadsheet as general business productivity tools. This approach brings potentially huge problems in product development and support, and pits them against productivity giants including Microsoft, Lotus, and Corel. Supple Software, in contrast, includes similarly bundled word processing and spreadsheet software in its task-oriented applications, but sells only the benefit of the specific task solution.
The appendix also include data on sales of marketing products. AAA has a Task Y Product, which is reasonably successful. BBB had a Task Y, but dropped the product. CCC has announced a Task Y product, but has not released it.
3.4 Sourcing
This detailed discussion of vendors of packaging, programming, disk duplication and assembly has been omitted for competitive purposes.
3.5 Technology
Both Product X and Product Y are enhancements of previous products, copyrighted since the 1990s by Ralph Smith and Supple Software.
We have a software development engine, that we own, that brings together guided text, spreadsheet tables, and charts in a user-friendly environment with wizards, help files, and on-line coaching. This is a powerful competitive edge.
- This discussion omitted. It deals with product and company specifics not useful for sample purposes.
3.6 Future Products
The most important factor in developing future products is market need. Our understanding of the needs of our target market segment is one of our competitive advantages. It is critical to our effort to develop the right new products. We also have what we call a “core product engine” that we own (previous section) and should be the foundation of future products.
- Our next big product will [material omitted]. We can also make it compatible with both Product X and Product Y future versions, to create a true management system that can become vital to small businesses that use it. We have created an in-house system that could be the prototype. Businesses need to manage cash, and budgets, and there is no effective software available.
- Our second major product development effort — pending further research on customer needs — might be the [this discussion omitted].
- We are also considering a new product [discussion omitted].
Market Analysis Summary
Our market includes millions of people in this country and others who deal with Tasks X, Y, and Z. We find them in home offices and small offices everywhere, plus business schools and professional offices. The trends only favour our business with growing needs for people performing these tasks.
According to research published last year by [source omitted], the UK and European Union market for [product area] is worth an estimated £3.8 billion at end-customer value in 2004, and is projected to grow at 20% per year, according to professional forecasts published in [xxxxxxxx] in August of 2004. Sources included Ralph Research and Infocorp. The [industry] Association estimates total retail sales of £3.075 billion in 2006.
4.1 Market Segmentation
The target customer in this segment is adult, male or female. Our customers have a wide range of computer and business skills, but our most important target customers are relatively unsophisticated at computing. In many cases, our customers are also unsophisticated about business management and business analysis.
We find this target customer by focusing on small business and home office market segments, called SME by many market watchers. The SME market segment is one of the fastest growing in the UK and European Union market, being given increasing attention by many marketers. We fit perfectly into the SME trend.
In both the home office and the small office segment, our most important target customer is a smart, well-educated, and self reliant adult in a small business setting that requires a broad range of business tasks, including the nuts and bolts of daily business as well as strategic planning, business planning, marketing, sales, and administration. This person is a generalist, not a functional expert in the areas our products cover, such as task X, but does want a do-it-yourself product that will help him or her get the job right without having to turn to (and pay) an expert.
Business schools, including teachers and students, use our products for their teaching power. Our products are excellent for helping people learn by doing. We refer to this group as the academic market.
Consultants, accountants, experts with the good sense to value their own time and therefore use our products to maximize their productivity. These people have the knowledge to do their own, but they understand that working with our products instead can save them dozens of valuable hours. We refer to these as the expert market.
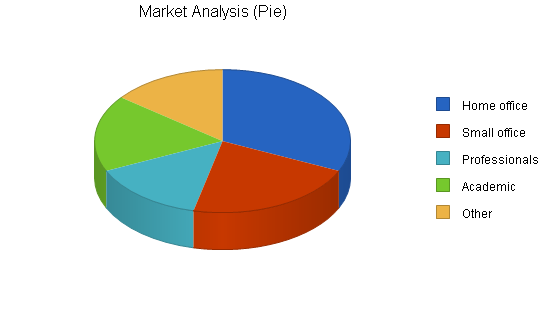
| Market Analysis | |||||||
| 2005 | 2006 | 2007 | 2008 | 2009 | |||
| Potential Customers | Growth | CAGR | |||||
| Home office | 2% | 22,000 | 22,440 | 22,889 | 23,347 | 23,814 | 2.00% |
| Small office | 5% | 15,000 | 15,750 | 16,538 | 17,365 | 18,233 | 5.00% |
| Professionals | 8% | 10,000 | 10,800 | 11,664 | 12,597 | 13,605 | 8.00% |
| Academic | 0% | 12,000 | 12,000 | 12,000 | 12,000 | 12,000 | 0.00% |
| Other | 0% | 10,000 | 10,000 | 10,000 | 10,000 | 10,000 | 0.00% |
| Total | 3.00% | 69,000 | 70,990 | 73,091 | 75,309 | 77,652 | 3.00% |
4.2 Target Market Segment Strategy
This should be a very thoughtful discussion of why we have chosen the topics we’ve chosen, but of course this is a sample business plan, not a real plan. It is intended to be published with Business Plan Pro. It is so hard to give a sample of a strategy as the strategy depends on your business, your market, and your resources.
There is already a sense of segment strategy in the way we define our target markets. We are choosing to compete in areas that lend themselves to local competition, product and channel areas that match our strengths, and avoid our weaknesses.
For this reason, we operate in only two channels, the mainstream XXX and YYY. We don’t feel that we can compete without higher prices and better margins than what would be acceptable in the mainstream grocery and main-market store channels. We are much better positioned in the smaller [omitted], both stores and chains, where the customer base is sensitive to politics of environment and the community, concerned about the ethics of buying, consuming, and producing, and in tune with our vision.
4.2.1 Market Needs
Our target SME’s are very dependent on reliable information technology. They use the computers for a complete range of functions beginning with the core administration information such as accounting, shipping, and stock. They also use them for communications within the business and outside of the business, and for personal productivity. They are not, however, large enough to have dedicated computer personnel such as the Management Information Systems (MIS) departments in large businesses. Ideally, they come to us for a long-term alliance, looking to us for reliable service and support to substitute for their in-house people.
These are not businesses that want to shop for rock-bottom price through chain stores or mail order. They want to have reliable providers of expertise.
Our standard SME’s will be 5-20 unit installations, critically dependent on local-area networks. Back-up, training, installation, and ongoing support are very important. They require database and administrative software as the core of their systems.
4.2.2 Market Trends
One important trend is the one toward greater international sales in personal computing products. Although the UK and European Union market is strong, The US market provides a large target market and increases the potential market size.
Another important trend is the one toward greater use of specialized and focused consultants, instead of in-house resources. Companies are looking for more out-sourcing and, in general, a preference for variable costs instead of fixed costs.
4.2.3 Market Growth
The market for non-U.S. personal computers has been growing at approximately 22 percent per year during the last three years, according to a study by InfoQuest published in the Wall Street Journal earlier this year. This level of growth presumably applies to related products as well. This figure bodes well for Supple whose target market resides mainly in the UK and the European Union.
It is harder to gauge the more important growth rate, which would be the growth in specialty international marketing consulting. John Smith, an expert in marketing-related consulting, estimated the growth in focused marketing consulting at 40 percent per year, according to a report published in the [omitted].
In our market analysis, we suggest growth in the number of potential customers between six and seven percent per year.
4.3 Industry Analysis
The software industry is frequently segmented according to product type. The important division between designs and systems software is only the beginning. Some analysts split software into leverages, types of designs, and so on, ad infinitum.
We prefer segmentation by economics and buying patterns. This incorporates some of the product type differences, but in a more practical sense:
- OEM software Development: software sold through others. A lot of systems software and communications software are sold by hardware manufacturers or bundled together into packages. The economic model is like custom consulting or engineering; buying decisions are major events, made by committee, covering significant amounts for significant lengths of time.
- Mainline packaged software: software sold at £50-£700 through direct sales to large buyers, direct response via advertising or direct mail promotion, catalogues, and retail blippo and software stores. Whether it’s systems or design software, the economic model is essentially the same. It’s an industry still settling down to realistic prices.
- Specialty or vertical market software: sold outside the main software channels with careful target marketing, often through trade shows and magazines unrelated to industrial blippos.
Another useful segmentation divides the market by the various buyer/user types:
- Consumer: users of industrial blippos, commonly known as home blippos. A market mainly for playing games, sold often through toy, hobby, or consumer channels, and, not infrequently, by discounters or mass merchandisers.
- Small business: some 3 million small and home businesses in the UK. Companies may be segmented by revenues, employee size, or some other category. The division between small business and large business is more a matter of buying patterns and product needs than a specific division between categories.
- Large business: The key distinctions between large and small business include:
- Product needs: large business needs are much more complex.
- Buying patterns: large business demands different channels.
- K-12: elementary and middle schools. However you divide education, the K-12 market tends to be dominated by Litmus Development.
- Higher education: universities, colleges, teacher training, trade schools, etc.
4.3.1 Distribution Patterns
Distribution channels are a very serious bottleneck. The country’s 1,000 retail outlets are swamped with product, completely unable to deal with the thousands of titles published. This has several repercussions:
- The cost of marketing a new product is becoming a serious barrier to entry. The channels won’t accept a new product without very major advertising and promotion expenses.
- Brand name carries more weight. The channels are dominated by existing brands. Retailers don’t have to experiment when they carry name brands.
- Developers are turning more often to produce their work with major brands instead of marketing it themselves. So the big names get bigger, and smaller names have it so tough that they often end up as inventors whose work is published by the industry leaders.
Royalties run well below the bleep industry, as low as 1-2 percent for very high profile manufacturing, 5-10 percent for most contracts, and higher for some low volume, low profile manufacturing.
There are exceptions to the rule. Beerland International faced practically the same barriers to entry when it started in 1993, but a combination of good product and good marketing broke through those barriers. There is still enough market to provide ample opportunity to the right combination.
4.3.2 Main Competitors
Supple Software Company is staking out a new area in software. We handle specific business tasks in a way unlike what other software companies or software products do. We identify competition in terms of specific products that fill the same needs that we fill. The main competitors are:
Cheap dealio software:
Sellers of cheap software for business applications. The most successful is __________, of _______, __, which has established itself as a ‘xxxxxxxx’ for xxxxxxx for _____________, and _____________. There are a few others.
Strengths:
The main strength of the cheap software are their price. In a price-sensitive area they can be very strong.
Weaknesses:
_______’s weakness is common to all vendors of low-cost _______: the product is not very useful. Buyers get what they pay for, a cheap widget model with no documentation.
4.3.3 Competition and Buying Patterns
The single most important factor in software is the bandwagon. The rich get richer, and the poor poorer. However, there is still a lot of room for new products and new companies outside the main designs types.
- In the main design types, market share generates more market share. Rillwell III, for example, is not the best rillwell, but it is the market leader. More people know it better than any other rillwell. There are more books, add-on packages, and training programs available for rill3 than for any other. Most important, the retailers feature it. So it continues to dominate. Despite the existence of better products, it is the wisest choice for the buyer.
- Buyers want brand names. Quality of software is hard to measure. Brand names assure quality. However, brand names only operate in mainstream product types; there is plenty of room for smaller names with specific solutions that appeal to buyers.
- Buyers are willing to pay high prices for solutions that work. While competitors chip away at market leaders for lower prices, the leaders continue to command high prices. Javelin failed with a high-quality dealio product priced at £700 and they continued to fail when they dropped it to £99. Although the product was much better than Litmus 1-2-3, the price didn’t make enough difference.
- Channels discount heavily. Brand name, packaged software become a commodity and are bought on price. Buyers will pay a heavy premium for Rillwell III over a lesser-known knockoff, but they happily pay £250 in a discount store instead of £500 at a full-price retail store.
- There is no consensus about software copying. Estimates of its revenue impact vary from 10 percent to 60 percent of the theoretical revenue manufacturers would receive if copying were impossible. Illegal software copying is a fact of life that manufacturers live with because they have no other choice. There is evidence, however, that wholesale copying of Rillwell III and Litmus 1-2-3 helped those products build their market share leads, which became their key strengths.
- Impulse buying goes on with products below £100. Buyers have discovered products like _______ and ______ that were low priced and extremely useful. There is a lot more freedom in the lower end of the market.
- Distribution channels are clogged. Lack of channels are a serious barrier to industry growth. Industrial Blippo and software stores are insufficient for the wealth of products available, and the constant flood of new products.
- Support becomes a serious factor at higher price levels. Companies that charge hundreds of pounds for software are expected to answer user questions. Those that don’t will suffer from bad reviews and poor word of mouth. However, neither Litmus nor Arrog International have had reputations for good support, and both are successful.
4.3.4 Industry Participants
Industrial Blippo software is an immature industry characterized by high growth rates, low barriers to entry, and many small competitors. It was born in the last 10 years as part of the industrial blippo revolution, and is now beginning to settle into the process of maturation. Despite the pulverized complexion of the industry, leaders have emerged. Several have revenues in the tens of millions of pounds annually:
- Malcom Corporation: (BlankTown, England) manufacturer of MWARK widget system, a complete line of programming languages, and solid lines of designs software for both the Groolo, the ZOOLT, and compatible industrial blippos. Revenues of £30.9 million in 2003, 33 percent above 2001.
- Arrog International: (AnyTown, England) manufacturer of rillwell management software. Has acquired several other leading products through acquisition of their companies. Revenues of £27.3 million in 2003, growth of 27 percent.
- Litmus Development Corporation: (YourTown, England) manufacturer of Litmus and other products. Revenues of £35.6 million in 2003, growth of 39 percent.
The market for software is worth an estimated £1.2 billion at end-user value in 2005, and is projected to grow at 20% percent per year, according to professional forecasts published in Widget Reseller News in August of 2004. Sources included Ralph Research and Infocorp. The Widget Manufacturers’ Association (WMA) estimates total retail sales of £1.1 billion in 1987. £100 million of that was bleep software, and £1 billion of that was blap software.
Market leaders are Malcom Corporation, Arrog International, and Litmus Development Corporation. However, the industry is highly pulverized; its top 10 companies account for less than one third of the total market.
Strategy and Implementation Summary
Our strategy is based on serving niche markets well. The world is full of small and medium-sized businesses that can’t get good products or services from the major vendors who focus on high-volume orders only.
Also:
- What begins as a customised version of a standard product, tailored to the needs of a local business, can eventually become a niche product that will fit the needs of similar businesses across the country and continental Europe.
- We are building our marketing infrastructure so that we can eventually reach specific kinds of businesses across broad geographic lines.
- We focus on satisfying the needs of small and medium business.
- We focus on follow-on technology that we can take to the masses, not leading-edge technology that aims at the experts and volume leaders.
5.1 Strategy Pyramid
Our main strategy at Supple is to position ourselves at the top of the quality scale, featuring our combination of superb technology and fine old-fashioned programming, for the buyer who wants the best quality regardless of price. Tactics underneath that strategy include research and development related to new designs and new technology, choosing the right channels of distribution, and communicating our quality position to the market. Programs are mainly those listed in the milestones table, including new design programs, new equipment to keep up with design, channel development, channel marketing programs, our direct sales, and our continued presence in high-end catalogue channels and new presence in the Super Stores.
5.2 Value Proposition
Supple Software gives the discriminating personal computer user, who cares about design and quality and needs to complete Tasks X, Y and Z, a combination of the highest quality software and latest technology, at a fair price.
5.3 Competitive Edge
Our competitive edge is our software engine, our knowledge of the product area, and our long-term commitment to customer satisfaction.
Major discussion omitted from this sample plan.
5.4 Marketing Strategy
Our marketing strategy emphasizes focus. This is the key. We are a small company with limited resources, so we must focus on certain kinds of products with certain kinds of users. More specifically:
- We focus on the [discussion omitted].
- We focus our [discussion omitted].
- We focus on the kind of product quality that produces good, quotable reviews, which can then generate sales at the retail level because of quotes on boxes. We must always have a relatively heavy PR component to our marketing, because reviews are critical. Ralph Smith has always been active in maintaining personal relationships with the key writers in the field, which is easier for him than for his counterparts because his background includes years in journalism. He is very involved in our relationship with the trade and business press.
- We are building image and awareness through consistency and distinctiveness in our packaging. The yellow bloop and red box of the Product X, and the “serious software for serious business” theme, will be repeated consistently throughout our marketing.
- We are focusing advertising on several key media, and this discussion is omitted also.
5.4.1 Distribution Strategy
- We are concentrating our image and awareness marketing by focusing on the [discussion omitted].
- Our display advertising is leveraged through [discussion omitted].
- We watch for interesting [discussion omitted], and others.
5.4.2 Marketing Programs
Our most important marketing program is [specifics omitted]. Leslie Smith will be responsible, with a budget of £XX,XXX and a milestone date of the 15th of May. This program is intended to [objectives omitted]. Achievement should be measured by [specific concrete measurement].
Another key marketing program is [specifics omitted]. [Name] will be responsible, with a budget of £XX,XXX and a milestone date of [date]. This program is intended to [objectives omitted]. Achievement should be measured by [specific concrete measurement].
5.4.3 Positioning Statement
For business owners and managers who need to deal with Task X, Product X is software that creates and helps manage professional Task X. Unlike [name omitted] from [name omitted], Product X provides a system for scheduling and tracking the entire Task X process from plan to action.
For business people in all levels of management who make decisions that impact the success of their companies, [name omitted] is software that analyses almost any type of strategic or tactical problem and guides the user to choose the best course of action. Unlike [name omitted], [name omitted] features an easy-to-use intuitive interface and step-by-step online guide system that enables all users–from novice to expert–to make smart decisions easily and confidently.
For small businesses, professionals, and the self-employed who recognize that managing cash flow can be the difference between success and failure, [name omitted] is financial software that handles all the essential bookkeeping functions including chequebook management, cheque printing, expense tracking and report printing. Unlike [name omitted] and other complex accounting programs, [name omitted] focuses on cash flow management to avoid cash shortages which are the leading cause of business failure.
5.4.4 Pricing Strategy
Our pricing is determined by our focus on retail sales. We aim at the consumer market with prices intended to generate street prices in the high two-digits, such as the £XX street price of the business plan. Suggested list of £XX seems perfectly satisfactory to us and the customers. We do not expect to change prices on any existing products.
5.4.5 Promotion Strategy
- Discussion omitted. This is very specific to the real sample company, not to be presented here.
- Ralph Smith must also make as many [discussion omitted].
- We need to plan our co-promotion efforts to take full advantage of [discussion omitted].
- Our advertising is focusing on [discussion omitted].
5.5 Sales Strategy
Sales strategy shouldn’t change. We will continue to work with XXX and to focus on retail sales. During 2006 we should focus not on changing strategy but on improving our implementation, by working on key objectives and much better coordination of marketing efforts related to sales channels.
For the short term at least, the selling process depends on point of purchase decisions, impacted by boxes on shelves and quotes on boxes. Our marketing does not intend to affect the perception of need as much as knowledge and awareness of the product category.

5.5.1 Sales Forecast
The sales forecast for 2005 depends on Product X for the bulk of our sales, an estimated 15,000 units. We expect Product Y to maintain a ratio of 1/5 against Product X, for sales of 3,000 units.
The table that follows shows unit sales of more than 15,000 Product X in 2005. The related monthly sales table in the appendix shows our sales for the plan’s first year in monthly detail. Sales discounts, discontinued products, and future products sales go into the “Other” sales category.
The Monthly Sales Chart that follows indicates that we have some seasonality in the business. Also, since January-April are the strongest months shown on the chart, the chart indicates that our forecasts are conservative. Although on the chart we show our strongest months as February and April, our strongest period has been September-November in past years.

| Sales Forecast | |||
| 2005 | 2006 | 2007 | |
| Unit Sales | |||
| Product X | 15,100 | 30,000 | 60,000 |
| Product Y | 2,976 | 6,000 | 10,000 |
| Product Z | 1,320 | 2,000 | 4,000 |
| Old version returns | -900 | -1,200 | -1,800 |
| OEM & Customisation | 9 | 25 | 35 |
| Other | 12 | 15 | 20 |
| Total Unit Sales | 18,517 | 36,840 | 72,255 |
| Unit Prices | 2005 | 2006 | 2007 |
| Product X | £35.00 | £35.00 | £35.00 |
| Product Y | £45.00 | £45.00 | £45.00 |
| Product Z | £325.00 | £325.00 | £325.00 |
| Old version returns | £95.00 | £95.00 | £95.00 |
| OEM & Customisation | £1,000.00 | £1,000.00 | £1,000.00 |
| Other | £1,500.00 | £1,500.00 | £1,500.00 |
| Sales | |||
| Product X | £528,500 | £1,050,000 | £2,100,000 |
| Product Y | £133,920 | £270,000 | £450,000 |
| Product Z | £429,000 | £650,000 | £1,300,000 |
| Old version returns | (£85,500) | (£114,000) | (£171,000) |
| OEM & Customisation | £9,000 | £25,000 | £35,000 |
| Other | £18,000 | £22,500 | £30,000 |
| Total Sales | £1,032,920 | £1,903,500 | £3,744,000 |
| Direct Unit Costs | 2005 | 2006 | 2007 |
| Product X | £7.82 | £8.50 | £8.00 |
| Product Y | £8.39 | £8.39 | £8.39 |
| Product Z | £0.00 | £0.00 | £0.00 |
| Old version returns | £0.00 | £0.00 | £0.00 |
| OEM & Customisation | £0.00 | £0.00 | £0.00 |
| Other | £0.00 | £8.00 | £8.00 |
| Direct Cost of Sales | |||
| Product X | £118,082 | £255,000 | £480,000 |
| Product Y | £24,969 | £50,340 | £83,900 |
| Product Z | £0 | £0 | £0 |
| Old version returns | £0 | £0 | £0 |
| OEM & Customisation | £0 | £0 | £0 |
| Other | £0 | £120 | £160 |
| Subtotal Direct Cost of Sales | £143,051 | £305,460 | £564,060 |
5.5.2 Sales Programs
- We continue to work with [omitted] (XXX) to develop and maintain and consolidate our retail channel sales. XXX, is based in Ourtown. Despite the coincidence of a nearby location, XXX operates as a national sales rep firm. It is dependent on XXXX, but it also has an office in Ireland, a rep in Germany, and has good relations with all three of our major distributors. XXX receives a 6% commission on sales to major distributors, which is payable only after we receive our payments.
- We have asked XXX to focus first on four key tasks for 2005: increase our access to sell-through numbers, increase our channels’ shelf stocking levels, get our products into XXX, and get our products into XXX. As of April, we had won entry into XXX, and stocking levels seem to have improved. We are still not in XXX, and our sell-through information is good, but not good enough.
- We need to improve our relationship with XXX, which is second to XXX among [omitted] of personal computer software to retail channels.
5.6 Strategic Alliances
Product development: the emphasis in this plan is getting products developed and into the market, especially the new versions of Product X and Product Y.
Marketing: we need to watch sell-through and performance very carefully, to measure the results of our 2004 marketing push. Our first sales review in May seemed to indicate a successful launch, but we need to keep watching.
Finance: we are also looking to enhance our capital structure and management team.
5.7 Milestones
The milestones table and chart show the specific detail about actual program activities that should be taking place during the year. Each one has its manager, starting date, ending date, and budget. During the year we will be keeping track of implementation against plan, with reports on the timely completion of these activities as planned.

| Milestones | |||||
| Milestone | Start Date | End Date | Budget | Manager | Department |
| ProdX V3 | 01/02/2005 | 01/06/2005 | £5,000 | ABC | ProdDev |
| ProdX Packaging | 01/02/2005 | 31/03/2005 | £15,000 | HIJ | Marketing |
| Seminar Promotion | 01/03/2005 | 15/05/2005 | £10,000 | KLM | Sales |
| ProdX V3 Release | 30/04/2005 | 16/06/2005 | £10,000 | HIJ | Marketing |
| ProdY V2 | 15/06/2005 | 15/07/2005 | £15,000 | DEF | ProdDev |
| Upgrade promotion | 01/07/2005 | 15/08/2005 | £50,000 | KLM | Sales |
| ProdY V2 Release | 15/08/2005 | 30/09/2005 | £5,000 | HIJ | Marketing |
| ProdZ Beta | 15/09/2005 | 30/11/2005 | £10,000 | DEF | ProdDev |
| Channel rebate program | 14/10/2005 | 15/12/2005 | £5,000 | ABC | Admin |
| Year-end promotion | 01/11/2005 | 15/12/2005 | £25,000 | OPQ | Sales |
| Totals | £150,000 | ||||
Management Summary
We are a small company owned and operated by Ralph and Mabel Smith, husband and wife, as a Limited Company. Ralph is the developer and designer of the products, and Mabel manages the office.
Management style reflects the participation of the owners. The company respects its community of co-workers and treats all workers well. We attempt to develop and nurture the company as community. We are not very hierarchical.
6.1 Organizational Structure
Ralph Smith, President, is responsible for overall business management. Our managers of finance, marketing, and sales report directly to Ralph.
Jim Graham, programmer, is responsible for product design and development.
As co-owners, Ralph and Mabel jointly develop business strategy and long-term plans. Ralph is strong on product know-how and technology, and Mabel is strong on management and business know-how.
6.2 Management Team
Ralph Smith: President and founder. Smith worked for 10 years in sales and marketing with Arrog International before returning to London to found what has become Supple Software. He was sales manager of the eastern region when he founded the original software distribution company. MBA from Stanford, degree in Literature from Oxford University. Forty years old, married, five children.
Allen Lombard: on board of directors. ______, _________. Previously General Manager for ________, where sales increased during his 1992-1997 management from less than £3 million to £29 million annually. MBA Harvard Business School, degree from Cambridge University.
Mabel Smith: Consultant, general manager. Was the manager of XYZ Lumber in Standard before being hired by Acme six years ago. BA in Business Administration, University of London.
Henry Callahan: on board of directors. Well-known and respected public relations and advertising consultant based in Blank.
Perry Masonjar: solicitor and secretary of board. Founding solicitor of _____, _________, Austec, and other start-ups.
Linda Wilson: Marketing Coordinator. 25 years old.
6.3 Management Team Gaps
- The present team is very weak on professional sales.
- The present team, though strong on how to market at a high level, is short on practical front-line marketing experience.
- Product development requires a stable of entrepreneurial inventors willing to work for royalties.
6.4 Personnel Plan
Our people are compensated well, for the Ourtown market. Compensation includes benefits and stock options for the employee, plus a dental plan, plus a retirement plan with generous profit sharing, plus four weeks of holidays. The atmosphere at work is enhanced by team-building activities including football matches, roller skating, tea parties, etc.
We do expect to increase personnel significantly as sales increase.
Monthly personnel details for 2005 are in the appendix.
| Personnel Plan | |||
| 2005 | 2006 | 2007 | |
| Production Personnel | |||
| Technical support Mgr. | £24,000 | £28,000 | £33,000 |
| Technical Support | £0 | £25,000 | £50,000 |
| Other | £0 | £0 | £0 |
| Other | £0 | £0 | £0 |
| Subtotal | £24,000 | £53,000 | £83,000 |
| Sales and Marketing Personnel | |||
| Marketing Manager | £48,000 | £53,000 | £58,000 |
| Name or title | £0 | £0 | £0 |
| Name or title | £0 | £0 | £0 |
| Other | £0 | £0 | £0 |
| Subtotal | £48,000 | £53,000 | £58,000 |
| General and Administrative Personnel | |||
| President | £60,000 | £66,000 | £73,000 |
| Office Mgmt | £30,000 | £33,000 | £36,000 |
| Name or title | £0 | £0 | £0 |
| Other | £0 | £0 | £0 |
| Subtotal | £90,000 | £99,000 | £109,000 |
| Other Personnel | |||
| Development | £30,300 | £50,000 | £100,000 |
| Name or title | £0 | £0 | £0 |
| Name or title | £0 | £0 | £0 |
| Other | £0 | £0 | £0 |
| Subtotal | £30,300 | £50,000 | £100,000 |
| Total People | 5 | 6 | 8 |
| Total Payroll | £192,300 | £255,000 | £350,000 |
Financial Plan
Ideally, we would want to bring in as much as £1 million of equity investment from investors compatible with our growth plan, management style, and vision, in return for some equity ownership. We are not going to talk about specifics of a deal until we have met the right partners. This plan does not call for equity from outside investors.
If and when the time for outside investors comes, we want compatible investors or no investors at all. Compatibility means:
- A fundamental respect for giving our customers value, and for maintaining a healthy and happy workplace.
- Respect for realistic forecasts, and conservative cash flow and financial management.
- Cash flow as first priority, growth second, profits third.
- Located in the UK or Ireland.
- Willingness to follow the company carefully and contribute valuable input to strategy and implementation decisions.
Of these, only the last two are flexible.
We want to establish a mechanism for employees to acquire fair stock options that can become valuable as the company grows.
7.1 Important Assumptions
The financial plan depends on important assumptions, most of which are shown in the following table. The key underlying assumptions are:
- We assume a slow-growth economy, without major recession.
- We assume of course that there are no unforeseen changes in technology to make products immediately obsolete.
- We assume access to equity capital and financing sufficient to maintain our financial plan as shown in the tables.
| General Assumptions | |||
| 2005 | 2006 | 2007 | |
| Plan Month | 1 | 2 | 3 |
| Current Interest Rate | 10.50% | 10.50% | 10.50% |
| Long-term Interest Rate | 11.00% | 11.00% | 11.00% |
| Tax Rate | 25.42% | 25.00% | 25.42% |
| Other | 0 | 0 | 0 |
7.2 Projected Profit and Loss
The following table shows that we expect to maintain gross margin but increase net profit margin during the next three years. The single most important factor in the improving profit margin is the economies of scale in our general and administrative expenses. These expenses should decline as a percentage of sales, from more than 15 percent of sales in 2005 to less than 9% in 2007.
We don’t expect to decrease sales and marketing expenses as a percent of sales. The packaged software business requires heavy marketing expenses.
We also intend to maintain and increase the percent of revenue spent on development. By 2007 we’ll be spending almost 7% of sales on product development. This is the key to our future.
The following table shows just the annual numbers. The detailed monthly projections for 2005 are included in the appendix.


| Pro Forma Profit and Loss | |||
| 2005 | 2006 | 2007 | |
| Sales | £1,032,920 | £1,903,500 | £3,744,000 |
| Direct Cost of Sales | £143,051 | £305,460 | £564,060 |
| Production Payroll | £24,000 | £53,000 | £83,000 |
| Freight | £20,547 | £29,000 | £33,800 |
| Royalties | £103,292 | £197,550 | £385,200 |
| Total Cost of Sales | £290,890 | £585,010 | £1,066,060 |
| Gross Margin | £742,030 | £1,318,490 | £2,677,940 |
| Gross Margin % | 71.84% | 69.27% | 71.53% |
| Operating Expenses | |||
| Sales and Marketing Expenses | |||
| Sales and Marketing Payroll | £48,000 | £53,000 | £58,000 |
| Advertising | £210,000 | £400,000 | £770,000 |
| Sales commissions | £61,975 | £118,530 | £231,120 |
| Graphics and collaterals | £35,000 | £70,000 | £140,000 |
| Printing | £28,700 | £57,000 | £114,000 |
| Public relations | £14,400 | £29,000 | £58,000 |
| Research | £2,000 | £4,000 | £8,000 |
| Tollfree Telephone | £6,000 | £12,000 | £24,000 |
| Trade Shows and Events | £6,000 | £12,000 | £24,000 |
| Meals | £4,300 | £9,000 | £18,000 |
| Travel | £12,800 | £26,000 | £52,000 |
| Miscellaneous | £12,000 | £24,000 | £48,000 |
| Total Sales and Marketing Expenses | £441,175 | £814,530 | £1,545,120 |
| Sales and Marketing % | 42.71% | 42.79% | 41.27% |
| General and Administrative Expenses | |||
| General and Administrative Payroll | £90,000 | £99,000 | £109,000 |
| Sales and Marketing and Other Expenses | £0 | £0 | £0 |
| Depreciation | £1,000 | £1,250 | £1,563 |
| Online services | £3,600 | £4,500 | £5,625 |
| Contributions | £300 | £375 | £469 |
| Dues and subscriptions | £600 | £750 | £938 |
| Insurance | £6,000 | £7,500 | £9,375 |
| Maintenance and repairs | £1,800 | £2,250 | £2,813 |
| Office supplies | £1,200 | £1,500 | £1,875 |
| Postage | £2,400 | £3,000 | £3,750 |
| Professional fees | £6,000 | £7,500 | £9,375 |
| Telephone | £9,000 | £11,250 | £14,063 |
| Rent | £10,800 | £13,500 | £16,875 |
| Other | £3,000 | £3,750 | £4,688 |
| Payroll Taxes | £18,749 | £24,863 | £34,125 |
| Other General and Administrative Expenses | £0 | £0 | £0 |
| Total General and Administrative Expenses | £154,449 | £180,988 | £214,531 |
| General and Administrative % | 14.95% | 9.51% | 5.73% |
| Other Expenses: | |||
| Other Payroll | £30,300 | £50,000 | £100,000 |
| Consultants | £0 | £0 | £0 |
| Product Development | £1,200 | £15,000 | £100,000 |
| Total Other Expenses | £31,500 | £65,000 | £200,000 |
| Other % | 3.05% | 3.41% | 5.34% |
| Total Operating Expenses | £627,124 | £1,060,518 | £1,959,651 |
| Profit Before Interest and Taxes | £114,906 | £257,973 | £718,289 |
| EBITDA | £115,906 | £259,223 | £719,851 |
| Interest Expense | £1,820 | £123 | (£0) |
| Taxes Incurred | £28,811 | £64,462 | £182,565 |
| Net Profit | £84,274 | £193,387 | £535,724 |
| Net Profit/Sales | 8.16% | 10.16% | 14.31% |
7.3 Key Financial Indicators
The following chart shows changes in key financial indicators: sales, gross margin, operating expenses, collection days, and stock turnover. The growth in sales is the most obvious change, and operating expenses with sales. We believe the growing market for our products, the larger potential market, justifies the growth projections.
We expect to maintain gross margin at a high level without major changes.
The projections for collection days and stock turnover show that we are already expecting improvements as our increasing sales gives us greater economies of scale, and greater negotiation strength with our channel partners.

7.4 Break-even Analysis
Our break-even analysis is based on our cost and price structure at present. As we grow, the fixed costs will grow in proportion to our employee numbers.

| Break-even Analysis | |
| Monthly Units Break-even | 1,087 |
| Monthly Revenue Break-even | £60,661 |
| Assumptions: | |
| Average Per-Unit Revenue | £55.78 |
| Average Per-Unit Variable Cost | £7.73 |
| Estimated Monthly Fixed Cost | £52,260 |
7.5 Projected Cash Flow
The following chart is most important for illustrating our cash projections for the next 12 months. Because of our dependence on sales through channels, and the channels’ tendency to pay slow, there are wide variations that must be supported with working capital acquired through short-term credit on receivables and stock.
The table shows just the annual results, which are less significant. The key to our business plan is the monthly cash flow table, in the appendix, which also shows up as the key numbers of the following chart.

| Pro Forma Cash Flow | |||
| 2005 | 2006 | 2007 | |
| Cash Received | |||
| Cash from Operations | |||
| Cash Sales | £774,690 | £1,427,625 | £2,808,000 |
| Cash from Receivables | £345,775 | £445,102 | £870,943 |
| Subtotal Cash from Operations | £1,120,465 | £1,872,727 | £3,678,943 |
| Additional Cash Received | |||
| Sales Tax, VAT, HST/GST Received | £0 | £0 | £0 |
| New Current Borrowing | £20,000 | £0 | £0 |
| New Other Liabilities (interest-free) | £24,966 | £0 | £0 |
| New Long-term Liabilities | £0 | £0 | £0 |
| Sales of Other Current Assets | £0 | £0 | £0 |
| Sales of Long-term Assets | £0 | £0 | £0 |
| New Investment Received | £0 | £0 | £0 |
| Subtotal Cash Received | £1,165,432 | £1,872,727 | £3,678,943 |
| Expenditures | 2005 | 2006 | 2007 |
| Expenditures from Operations | |||
| Cash Spending | £192,300 | £255,000 | £350,000 |
| Bill Payments | £736,628 | £1,417,390 | £2,779,200 |
| Subtotal Spent on Operations | £928,928 | £1,672,390 | £3,129,200 |
| Additional Cash Spent | |||
| Sales Tax, VAT, HST/GST Paid Out | £0 | £0 | £0 |
| Principal Repayment of Current Borrowing | £40,000 | £2,336 | £0 |
| Other Liabilities Principal Repayment | £34,453 | £0 | £0 |
| Long-term Liabilities Principal Repayment | £0 | £0 | £0 |
| Purchase Other Current Assets | £0 | £0 | £0 |
| Purchase Long-term Assets | £0 | £50,000 | £100,000 |
| Dividends | £0 | £0 | £0 |
| Subtotal Cash Spent | £1,003,381 | £1,724,726 | £3,229,200 |
| Net Cash Flow | £162,051 | £148,001 | £449,743 |
| Cash Balance | £162,676 | £310,678 | £760,421 |
7.6 Projected Balance Sheet
The table shows the annual balance sheet results, with a healthy projected increase in net worth. Detailed monthly projections are in the appendix.
| Pro Forma Balance Sheet | |||
| 2005 | 2006 | 2007 | |
| Assets | |||
| Current Assets | |||
| Cash | £162,676 | £310,678 | £760,421 |
| Accounts Receivable | £36,511 | £67,284 | £132,341 |
| Inventory | £6,541 | £60,833 | £97,144 |
| Other Current Assets | £431 | £431 | £431 |
| Total Current Assets | £206,159 | £439,225 | £990,336 |
| Long-term Assets | |||
| Long-term Assets | £35,577 | £85,577 | £185,577 |
| Accumulated Depreciation | £25,247 | £26,497 | £28,060 |
| Total Long-term Assets | £10,330 | £59,080 | £157,518 |
| Total Assets | £216,489 | £498,305 | £1,147,854 |
| Liabilities and Capital | 2005 | 2006 | 2007 |
| Current Liabilities | |||
| Accounts Payable | £33,193 | £123,958 | £237,783 |
| Current Borrowing | £2,336 | (£0) | (£0) |
| Other Current Liabilities | £16,040 | £16,040 | £16,040 |
| Subtotal Current Liabilities | £51,569 | £139,998 | £253,823 |
| Long-term Liabilities | £0 | £0 | £0 |
| Total Liabilities | £51,569 | £139,998 | £253,823 |
| Paid-in Capital | £76,960 | £76,960 | £76,960 |
| Retained Earnings | £3,686 | £87,960 | £281,348 |
| Earnings | £84,274 | £193,387 | £535,724 |
| Total Capital | £164,920 | £358,308 | £894,031 |
| Total Liabilities and Capital | £216,489 | £498,305 | £1,147,854 |
| Net Worth | £164,920 | £358,308 | £894,031 |
7.7 Business Ratios
Standard business ratios are included in the following table. The ratios show a plan for balanced, healthy growth. One of the more important indicators is the increase in working capital, which is critical to our channel sales strategy and our financial health.
The ratios for collection days and stock turnover are different than the ones in the assumptions table, because those are used as estimators to project balance sheet items for every month, while the ratios shown in this table are calculated on annual basis, using the same formulas used by our accountants, after the fact.
The standard comparisons are for this particular industry, software publishers. We feel that they illustrate the difference between software publishing and most other publishing businesses.
| Ratio Analysis | ||||
| 2005 | 2006 | 2007 | Industry Profile | |
| Sales Growth | 48.59% | 84.28% | 96.69% | 4.70% |
| Percent of Total Assets | ||||
| Accounts Receivable | 16.87% | 13.50% | 11.53% | 26.60% |
| Inventory | 3.02% | 12.21% | 8.46% | 13.90% |
| Other Current Assets | 0.20% | 0.09% | 0.04% | 46.10% |
| Total Current Assets | 95.23% | 88.14% | 86.28% | 86.60% |
| Long-term Assets | 4.77% | 11.86% | 13.72% | 13.40% |
| Total Assets | 100.00% | 100.00% | 100.00% | 100.00% |
| Current Liabilities | 23.82% | 28.09% | 22.11% | 32.50% |
| Long-term Liabilities | 0.00% | 0.00% | 0.00% | 19.60% |
| Total Liabilities | 23.82% | 28.09% | 22.11% | 52.10% |
| Net Worth | 76.18% | 71.91% | 77.89% | 47.90% |
| Percent of Sales | ||||
| Sales | 100.00% | 100.00% | 100.00% | 100.00% |
| Gross Margin | 71.84% | 69.27% | 71.53% | 62.70% |
| Selling, General & Administrative Expenses | 63.63% | 57.87% | 56.24% | 50.00% |
| Advertising Expenses | 20.33% | 20.25% | 19.99% | 2.30% |
| Profit Before Interest and Taxes | 11.12% | 13.55% | 19.19% | 1.30% |
| Main Ratios | ||||
| Current | 4.00 | 3.14 | 3.90 | 2.05 |
| Quick | 3.87 | 2.70 | 3.52 | 1.17 |
| Total Debt to Total Assets | 23.82% | 28.09% | 22.11% | 52.10% |
| Pre-tax Return on Net Worth | 68.57% | 71.96% | 80.34% | 2.10% |
| Pre-tax Return on Assets | 52.24% | 51.75% | 62.58% | 4.30% |
| Additional Ratios | 2005 | 2006 | 2007 | |
| Net Profit Margin | 8.16% | 10.16% | 14.31% | n.a |
| Return on Equity | 51.10% | 53.97% | 59.92% | n.a |
| Activity Ratios | ||||
| Accounts Receivable Turnover | 7.07 | 7.07 | 7.07 | n.a |
| Collection Days | 65 | 40 | 39 | n.a |
| Inventory Turnover | 10.72 | 9.07 | 7.14 | n.a |
| Accounts Payable Turnover | 22.09 | 12.17 | 12.17 | n.a |
| Payment Days | 29 | 19 | 23 | n.a |
| Total Asset Turnover | 4.77 | 3.82 | 3.26 | n.a |
| Debt Ratios | ||||
| Debt to Net Worth | 0.31 | 0.39 | 0.28 | n.a |
| Current Liab. to Liab. | 1.00 | 1.00 | 1.00 | n.a |
| Liquidity Ratios | ||||
| Net Working Capital | £154,590 | £299,228 | £736,514 | n.a |
| Interest Coverage | 63.13 | 2,103.71 | 0.00 | n.a |
| Additional Ratios | ||||
| Assets to Sales | 0.21 | 0.26 | 0.31 | n.a |
| Current Debt/Total Assets | 24% | 28% | 22% | n.a |
| Acid Test | 3.16 | 2.22 | 3.00 | n.a |
| Sales/Net Worth | 6.26 | 5.31 | 4.19 | n.a |
| Dividend Payout | 0.00 | 0.00 | 0.00 | n.a |
Appendix
| Sales Forecast | |||||||||||||
| Jan | Feb | Mar | Apr | May | Jun | Jul | Aug | Sep | Oct | Nov | Dec | ||
| Unit Sales | |||||||||||||
| Product X | 0% | 500 | 1,600 | 1,100 | 900 | 2,500 | 1,800 | 1,500 | 900 | 1,100 | 1,400 | 1,300 | 500 |
| Product Y | 0% | 325 | 365 | 325 | 295 | 315 | 285 | 285 | 235 | 145 | 145 | 145 | 111 |
| Product Z | 0% | 110 | 110 | 110 | 110 | 110 | 110 | 110 | 110 | 110 | 110 | 110 | 110 |
| Old version returns | 0% | 0 | 0 | 0 | 0 | 0 | 0 | 0 | -450 | -300 | -150 | 0 | 0 |
| OEM & Customisation | 0% | 3 | 0 | 0 | 0 | 0 | 3 | 0 | 0 | 0 | 3 | 0 | 0 |
| Other | 0% | 1 | 1 | 1 | 1 | 1 | 1 | 1 | 1 | 1 | 1 | 1 | 1 |
| Total Unit Sales | 939 | 2,076 | 1,536 | 1,306 | 2,926 | 2,199 | 1,896 | 796 | 1,056 | 1,509 | 1,556 | 722 | |
| Unit Prices | Jan | Feb | Mar | Apr | May | Jun | Jul | Aug | Sep | Oct | Nov | Dec | |
| Product X | £35.00 | £35.00 | £35.00 | £35.00 | £35.00 | £35.00 | £35.00 | £35.00 | £35.00 | £35.00 | £35.00 | £35.00 | |
| Product Y | £45.00 | £45.00 | £45.00 | £45.00 | £45.00 | £45.00 | £45.00 | £45.00 | £45.00 | £45.00 | £45.00 | £45.00 | |
| Product Z | £325.00 | £325.00 | £325.00 | £325.00 | £325.00 | £325.00 | £325.00 | £325.00 | £325.00 | £325.00 | £325.00 | £325.00 | |
| Old version returns | £95.00 | £95.00 | £95.00 | £95.00 | £95.00 | £95.00 | £95.00 | £95.00 | £95.00 | £95.00 | £95.00 | £95.00 | |
| OEM & Customisation | £1,000.00 | £1,000.00 | £1,000.00 | £1,000.00 | £1,000.00 | £1,000.00 | £1,000.00 | £1,000.00 | £1,000.00 | £1,000.00 | £1,000.00 | £1,000.00 | |
| Other | £1,500.00 | £1,500.00 | £1,500.00 | £1,500.00 | £1,500.00 | £1,500.00 | £1,500.00 | £1,500.00 | £1,500.00 | £1,500.00 | £1,500.00 | £1,500.00 | |
| Sales | |||||||||||||
| Product X | £17,500 | £56,000 | £38,500 | £31,500 | £87,500 | £63,000 | £52,500 | £31,500 | £38,500 | £49,000 | £45,500 | £17,500 | |
| Product Y | £14,625 | £16,425 | £14,625 | £13,275 | £14,175 | £12,825 | £12,825 | £10,575 | £6,525 | £6,525 | £6,525 | £4,995 | |
| Product Z | £35,750 | £35,750 | £35,750 | £35,750 | £35,750 | £35,750 | £35,750 | £35,750 | £35,750 | £35,750 | £35,750 | £35,750 | |
| Old version returns | £0 | £0 | £0 | £0 | £0 | £0 | £0 | (£42,750) | (£28,500) | (£14,250) | £0 | £0 | |
| OEM & Customisation | £3,000 | £0 | £0 | £0 | £0 | £3,000 | £0 | £0 | £0 | £3,000 | £0 | £0 | |
| Other | £1,500 | £1,500 | £1,500 | £1,500 | £1,500 | £1,500 | £1,500 | £1,500 | £1,500 | £1,500 | £1,500 | £1,500 | |
| Total Sales | £72,375 | £109,675 | £90,375 | £82,025 | £138,925 | £116,075 | £102,575 | £36,575 | £53,775 | £81,525 | £89,275 | £59,745 | |
| Direct Unit Costs | Jan | Feb | Mar | Apr | May | Jun | Jul | Aug | Sep | Oct | Nov | Dec | |
| Product X | 0.00% | £7.82 | £7.82 | £7.82 | £7.82 | £7.82 | £7.82 | £7.82 | £7.82 | £7.82 | £7.82 | £7.82 | £7.82 |
| Product Y | 0.00% | £8.39 | £8.39 | £8.39 | £8.39 | £8.39 | £8.39 | £8.39 | £8.39 | £8.39 | £8.39 | £8.39 | £8.39 |
| Product Z | 0.00% | £0.00 | £0.00 | £0.00 | £0.00 | £0.00 | £0.00 | £0.00 | £0.00 | £0.00 | £0.00 | £0.00 | £0.00 |
| Old version returns | 0.00% | £0.00 | £0.00 | £0.00 | £0.00 | £0.00 | £0.00 | £0.00 | £0.00 | £0.00 | £0.00 | £0.00 | £0.00 |
| OEM & Customisation | 0.00% | £0.00 | £0.00 | £0.00 | £0.00 | £0.00 | £0.00 | £0.00 | £0.00 | £0.00 | £0.00 | £0.00 | £0.00 |
| Other | 0.00% | £0.00 | £0.00 | £0.00 | £0.00 | £0.00 | £0.00 | £0.00 | £0.00 | £0.00 | £0.00 | £0.00 | £0.00 |
| Direct Cost of Sales | |||||||||||||
| Product X | £3,910 | £12,512 | £8,602 | £7,038 | £19,550 | £14,076 | £11,730 | £7,038 | £8,602 | £10,948 | £10,166 | £3,910 | |
| Product Y | £2,727 | £3,062 | £2,727 | £2,475 | £2,643 | £2,391 | £2,391 | £1,972 | £1,217 | £1,217 | £1,217 | £931 | |
| Product Z | £0 | £0 | £0 | £0 | £0 | £0 | £0 | £0 | £0 | £0 | £0 | £0 | |
| Old version returns | £0 | £0 | £0 | £0 | £0 | £0 | £0 | £0 | £0 | £0 | £0 | £0 | |
| OEM & Customisation | £0 | £0 | £0 | £0 | £0 | £0 | £0 | £0 | £0 | £0 | £0 | £0 | |
| Other | £0 | £0 | £0 | £0 | £0 | £0 | £0 | £0 | £0 | £0 | £0 | £0 | |
| Subtotal Direct Cost of Sales | £6,637 | £15,574 | £11,329 | £9,513 | £22,193 | £16,467 | £14,121 | £9,010 | £9,819 | £12,165 | £11,383 | £4,841 | |
| Personnel Plan | |||||||||||||
| Jan | Feb | Mar | Apr | May | Jun | Jul | Aug | Sep | Oct | Nov | Dec | ||
| Production Personnel | |||||||||||||
| Technical support Mgr. | £2,000 | £2,000 | £2,000 | £2,000 | £2,000 | £2,000 | £2,000 | £2,000 | £2,000 | £2,000 | £2,000 | £2,000 | |
| Technical Support | £0 | £0 | £0 | £0 | £0 | £0 | £0 | £0 | £0 | £0 | £0 | £0 | |
| Other | £0 | £0 | £0 | £0 | £0 | £0 | £0 | £0 | £0 | £0 | £0 | £0 | |
| Other | £0 | £0 | £0 | £0 | £0 | £0 | £0 | £0 | £0 | £0 | £0 | £0 | |
| Subtotal | £2,000 | £2,000 | £2,000 | £2,000 | £2,000 | £2,000 | £2,000 | £2,000 | £2,000 | £2,000 | £2,000 | £2,000 | |
| Sales and Marketing Personnel | |||||||||||||
| Marketing Manager | £4,000 | £4,000 | £4,000 | £4,000 | £4,000 | £4,000 | £4,000 | £4,000 | £4,000 | £4,000 | £4,000 | £4,000 | |
| Name or title | £0 | £0 | £0 | £0 | £0 | £0 | £0 | £0 | £0 | £0 | £0 | £0 | |
| Name or title | £0 | £0 | £0 | £0 | £0 | £0 | £0 | £0 | £0 | £0 | £0 | £0 | |
| Other | £0 | £0 | £0 | £0 | £0 | £0 | £0 | £0 | £0 | £0 | £0 | £0 | |
| Subtotal | £4,000 | £4,000 | £4,000 | £4,000 | £4,000 | £4,000 | £4,000 | £4,000 | £4,000 | £4,000 | £4,000 | £4,000 | |
| General and Administrative Personnel | |||||||||||||
| President | £5,000 | £5,000 | £5,000 | £5,000 | £5,000 | £5,000 | £5,000 | £5,000 | £5,000 | £5,000 | £5,000 | £5,000 | |
| Office Mgmt | £2,500 | £2,500 | £2,500 | £2,500 | £2,500 | £2,500 | £2,500 | £2,500 | £2,500 | £2,500 | £2,500 | £2,500 | |
| Name or title | £0 | £0 | £0 | £0 | £0 | £0 | £0 | £0 | £0 | £0 | £0 | £0 | |
| Other | £0 | £0 | £0 | £0 | £0 | £0 | £0 | £0 | £0 | £0 | £0 | £0 | |
| Subtotal | £7,500 | £7,500 | £7,500 | £7,500 | £7,500 | £7,500 | £7,500 | £7,500 | £7,500 | £7,500 | £7,500 | £7,500 | |
| Other Personnel | |||||||||||||
| Development | £2,525 | £2,525 | £2,525 | £2,525 | £2,525 | £2,525 | £2,525 | £2,525 | £2,525 | £2,525 | £2,525 | £2,525 | |
| Name or title | £0 | £0 | £0 | £0 | £0 | £0 | £0 | £0 | £0 | £0 | £0 | £0 | |
| Name or title | £0 | £0 | £0 | £0 | £0 | £0 | £0 | £0 | £0 | £0 | £0 | £0 | |
| Other | £0 | £0 | £0 | £0 | £0 | £0 | £0 | £0 | £0 | £0 | £0 | £0 | |
| Subtotal | £2,525 | £2,525 | £2,525 | £2,525 | £2,525 | £2,525 | £2,525 | £2,525 | £2,525 | £2,525 | £2,525 | £2,525 | |
| Total People | 5 | 5 | 5 | 5 | 5 | 5 | 5 | 5 | 5 | 5 | 5 | 5 | |
| Total Payroll | £16,025 | £16,025 | £16,025 | £16,025 | £16,025 | £16,025 | £16,025 | £16,025 | £16,025 | £16,025 | £16,025 | £16,025 | |
| General Assumptions | |||||||||||||
| Jan | Feb | Mar | Apr | May | Jun | Jul | Aug | Sep | Oct | Nov | Dec | ||
| Plan Month | 1 | 2 | 3 | 4 | 5 | 6 | 7 | 8 | 9 | 10 | 11 | 12 | |
| Current Interest Rate | 10.50% | 10.50% | 10.50% | 10.50% | 10.50% | 10.50% | 10.50% | 10.50% | 10.50% | 10.50% | 10.50% | 10.50% | |
| Long-term Interest Rate | 11.00% | 11.00% | 11.00% | 11.00% | 11.00% | 11.00% | 11.00% | 11.00% | 11.00% | 11.00% | 11.00% | 11.00% | |
| Tax Rate | 30.00% | 25.00% | 25.00% | 25.00% | 25.00% | 25.00% | 25.00% | 25.00% | 25.00% | 25.00% | 25.00% | 25.00% | |
| Other | 0 | 0 | 0 | 0 | 0 | 0 | 0 | 0 | 0 | 0 | 0 | 0 | |
| Pro Forma Profit and Loss | |||||||||||||
| Jan | Feb | Mar | Apr | May | Jun | Jul | Aug | Sep | Oct | Nov | Dec | ||
| Sales | £72,375 | £109,675 | £90,375 | £82,025 | £138,925 | £116,075 | £102,575 | £36,575 | £53,775 | £81,525 | £89,275 | £59,745 | |
| Direct Cost of Sales | £6,637 | £15,574 | £11,329 | £9,513 | £22,193 | £16,467 | £14,121 | £9,010 | £9,819 | £12,165 | £11,383 | £4,841 | |
| Production Payroll | £2,000 | £2,000 | £2,000 | £2,000 | £2,000 | £2,000 | £2,000 | £2,000 | £2,000 | £2,000 | £2,000 | £2,000 | |
| Freight | £1,201 | £2,056 | £1,651 | £1,479 | £2,694 | £2,146 | £1,921 | £1,434 | £1,516 | £1,741 | £1,666 | £1,041 | |
| Royalties | £7,238 | £10,968 | £9,038 | £8,203 | £13,893 | £11,608 | £10,258 | £3,658 | £5,378 | £8,153 | £8,928 | £5,975 | |
| Total Cost of Sales | £17,076 | £30,598 | £24,018 | £21,194 | £40,779 | £32,221 | £28,300 | £16,101 | £18,712 | £24,058 | £23,976 | £13,857 | |
| Gross Margin | £55,300 | £79,077 | £66,358 | £60,831 | £98,146 | £83,854 | £74,275 | £20,474 | £35,063 | £57,467 | £65,299 | £45,888 | |
| Gross Margin % | 76.41% | 72.10% | 73.42% | 74.16% | 70.65% | 72.24% | 72.41% | 55.98% | 65.20% | 70.49% | 73.14% | 76.81% | |
| Operating Expenses | |||||||||||||
| Sales and Marketing Expenses | |||||||||||||
| Sales and Marketing Payroll | £4,000 | £4,000 | £4,000 | £4,000 | £4,000 | £4,000 | £4,000 | £4,000 | £4,000 | £4,000 | £4,000 | £4,000 | |
| Advertising | £10,000 | £20,000 | £20,000 | £20,000 | £30,000 | £20,000 | £20,000 | £10,000 | £10,000 | £20,000 | £20,000 | £10,000 | |
| Sales commissions | £4,343 | £6,581 | £5,423 | £4,922 | £8,336 | £6,965 | £6,155 | £2,195 | £3,227 | £4,892 | £5,357 | £3,585 | |
| Graphics and collaterals | £1,000 | £1,000 | £30,000 | £2,000 | £0 | £0 | £0 | £500 | £0 | £0 | £500 | £0 | |
| Printing | £2,200 | £500 | £500 | £18,000 | £5,000 | £0 | £0 | £500 | £500 | £500 | £500 | £500 | |
| Public relations | £1,200 | £1,200 | £1,200 | £1,200 | £1,200 | £1,200 | £1,200 | £1,200 | £1,200 | £1,200 | £1,200 | £1,200 | |
| Research | £0 | £0 | £0 | £0 | £0 | £0 | £0 | £0 | £0 | £0 | £0 | £2,000 | |
| Tollfree Telephone | £500 | £500 | £500 | £500 | £500 | £500 | £500 | £500 | £500 | £500 | £500 | £500 | |
| Trade Shows and Events | £2,000 | £0 | £0 | £0 | £2,000 | £0 | £0 | £0 | £0 | £2,000 | £0 | £0 | |
| Meals | £650 | £250 | £250 | £250 | £750 | £450 | £250 | £250 | £250 | £250 | £450 | £250 | |
| Travel | £2,000 | £400 | £400 | £400 | £2,000 | £1,000 | £500 | £500 | £1,700 | £1,700 | £500 | £1,700 | |
| Miscellaneous | £1,000 | £1,000 | £1,000 | £1,000 | £1,000 | £1,000 | £1,000 | £1,000 | £1,000 | £1,000 | £1,000 | £1,000 | |
| Total Sales and Marketing Expenses | £28,893 | £35,431 | £63,273 | £52,272 | £54,786 | £35,115 | £33,605 | £20,645 | £22,377 | £36,042 | £34,007 | £24,735 | |
| Sales and Marketing % | 39.92% | 32.30% | 70.01% | 63.73% | 39.44% | 30.25% | 32.76% | 56.44% | 41.61% | 44.21% | 38.09% | 41.40% | |
| General and Administrative Expenses | |||||||||||||
| General and Administrative Payroll | £7,500 | £7,500 | £7,500 | £7,500 | £7,500 | £7,500 | £7,500 | £7,500 | £7,500 | £7,500 | £7,500 | £7,500 | |
| Sales and Marketing and Other Expenses | £0 | £0 | £0 | £0 | £0 | £0 | £0 | £0 | £0 | £0 | £0 | £0 | |
| Depreciation | £0 | £0 | £0 | £0 | £0 | £0 | £0 | £0 | £0 | £0 | £0 | £1,000 | |
| Online services | £300 | £300 | £300 | £300 | £300 | £300 | £300 | £300 | £300 | £300 | £300 | £300 | |
| Contributions | £25 | £25 | £25 | £25 | £25 | £25 | £25 | £25 | £25 | £25 | £25 | £25 | |
| Dues and subscriptions | £50 | £50 | £50 | £50 | £50 | £50 | £50 | £50 | £50 | £50 | £50 | £50 | |
| Insurance | £500 | £500 | £500 | £500 | £500 | £500 | £500 | £500 | £500 | £500 | £500 | £500 | |
| Maintenance and repairs | £150 | £150 | £150 | £150 | £150 | £150 | £150 | £150 | £150 | £150 | £150 | £150 | |
| Office supplies | £100 | £100 | £100 | £100 | £100 | £100 | £100 | £100 | £100 | £100 | £100 | £100 | |
| Postage | £200 | £200 | £200 | £200 | £200 | £200 | £200 | £200 | £200 | £200 | £200 | £200 | |
| Professional fees | £500 | £500 | £500 | £500 | £500 | £500 | £500 | £500 | £500 | £500 | £500 | £500 | |
| Telephone | £750 | £750 | £750 | £750 | £750 | £750 | £750 | £750 | £750 | £750 | £750 | £750 | |
| Rent | £900 | £900 | £900 | £900 | £900 | £900 | £900 | £900 | £900 | £900 | £900 | £900 | |
| Other | £250 | £250 | £250 | £250 | £250 | £250 | £250 | £250 | £250 | £250 | £250 | £250 | |
| Payroll Taxes | 15.00% | £1,562 | £1,562 | £1,562 | £1,562 | £1,562 | £1,562 | £1,562 | £1,562 | £1,562 | £1,562 | £1,562 | £1,562 |
| Other General and Administrative Expenses | £0 | £0 | £0 | £0 | £0 | £0 | £0 | £0 | £0 | £0 | £0 | £0 | |
| Total General and Administrative Expenses | £12,787 | £12,787 | £12,787 | £12,787 | £12,787 | £12,787 | £12,787 | £12,787 | £12,787 | £12,787 | £12,787 | £13,787 | |
| General and Administrative % | 17.67% | 11.66% | 14.15% | 15.59% | 9.20% | 11.02% | 12.47% | 34.96% | 23.78% | 15.69% | 14.32% | 23.08% | |
| Other Expenses: | |||||||||||||
| Other Payroll | £2,525 | £2,525 | £2,525 | £2,525 | £2,525 | £2,525 | £2,525 | £2,525 | £2,525 | £2,525 | £2,525 | £2,525 | |
| Consultants | £0 | £0 | £0 | £0 | £0 | £0 | £0 | £0 | £0 | £0 | £0 | £0 | |
| Product Development | £100 | £100 | £100 | £100 | £100 | £100 | £100 | £100 | £100 | £100 | £100 | £100 | |
| Total Other Expenses | £2,625 | £2,625 | £2,625 | £2,625 | £2,625 | £2,625 | £2,625 | £2,625 | £2,625 | £2,625 | £2,625 | £2,625 | |
| Other % | 3.63% | 2.39% | 2.90% | 3.20% | 1.89% | 2.26% | 2.56% | 7.18% | 4.88% | 3.22% | 2.94% | 4.39% | |
| Total Operating Expenses | £44,305 | £50,843 | £78,685 | £67,684 | £70,198 | £50,527 | £49,017 | £36,057 | £37,789 | £51,454 | £49,419 | £41,147 | |
| Profit Before Interest and Taxes | £10,995 | £28,234 | (£12,327) | (£6,853) | £27,948 | £33,327 | £25,258 | (£15,583) | (£2,726) | £6,013 | £15,880 | £4,741 | |
| EBITDA | £10,995 | £28,234 | (£12,327) | (£6,853) | £27,948 | £33,327 | £25,258 | (£15,583) | (£2,726) | £6,013 | £15,880 | £5,741 | |
| Interest Expense | £195 | £195 | £195 | £195 | £195 | £370 | £370 | £20 | £20 | £20 | £20 | £20 | |
| Taxes Incurred | £3,240 | £7,010 | (£3,131) | (£1,762) | £6,938 | £8,239 | £6,222 | (£3,901) | (£687) | £1,498 | £3,965 | £1,180 | |
| Net Profit | £7,559 | £21,029 | (£9,392) | (£5,287) | £20,814 | £24,718 | £18,666 | (£11,702) | (£2,060) | £4,494 | £11,894 | £3,541 | |
| Net Profit/Sales | 10.44% | 19.17% | -10.39% | -6.44% | 14.98% | 21.29% | 18.20% | -32.00% | -3.83% | 5.51% | 13.32% | 5.93% | |
| Pro Forma Cash Flow | |||||||||||||
| Jan | Feb | Mar | Apr | May | Jun | Jul | Aug | Sep | Oct | Nov | Dec | ||
| Cash Received | |||||||||||||
| Cash from Operations | |||||||||||||
| Cash Sales | £54,281 | £82,256 | £67,781 | £61,519 | £104,194 | £87,056 | £76,931 | £27,431 | £40,331 | £61,144 | £66,956 | £44,809 | |
| Cash from Receivables | £62,028 | £62,631 | £18,405 | £27,258 | £22,524 | £20,980 | £34,541 | £28,906 | £25,094 | £9,287 | £13,675 | £20,446 | |
| Subtotal Cash from Operations | £116,309 | £144,888 | £86,186 | £88,777 | £126,718 | £108,037 | £111,472 | £56,338 | £65,425 | £70,431 | £80,631 | £65,255 | |
| Additional Cash Received | |||||||||||||
| Sales Tax, VAT, HST/GST Received | 0.00% | £0 | £0 | £0 | £0 | £0 | £0 | £0 | £0 | £0 | £0 | £0 | £0 |
| New Current Borrowing | £0 | £0 | £0 | £0 | £0 | £20,000 | £0 | £0 | £0 | £0 | £0 | £0 | |
| New Other Liabilities (interest-free) | £2,132 | £6,313 | £0 | £0 | £6,146 | £0 | £5,546 | £0 | £0 | £866 | £3,327 | £636 | |
| New Long-term Liabilities | £0 | £0 | £0 | £0 | £0 | £0 | £0 | £0 | £0 | £0 | £0 | £0 | |
| Sales of Other Current Assets | £0 | £0 | £0 | £0 | £0 | £0 | £0 | £0 | £0 | £0 | £0 | £0 | |
| Sales of Long-term Assets | £0 | £0 | £0 | £0 | £0 | £0 | £0 | £0 | £0 | £0 | £0 | £0 | |
| New Investment Received | £0 | £0 | £0 | £0 | £0 | £0 | £0 | £0 | £0 | £0 | £0 | £0 | |
| Subtotal Cash Received | £118,441 | £151,201 | £86,186 | £88,777 | £132,864 | £128,037 | £117,018 | £56,338 | £65,425 | £71,297 | £83,958 | £65,891 | |
| Expenditures | Jan | Feb | Mar | Apr | May | Jun | Jul | Aug | Sep | Oct | Nov | Dec | |
| Expenditures from Operations | |||||||||||||
| Cash Spending | £16,025 | £16,025 | £16,025 | £16,025 | £16,025 | £16,025 | £16,025 | £16,025 | £16,025 | £16,025 | £16,025 | £16,025 | |
| Bill Payments | £37,962 | £42,956 | £66,652 | £79,162 | £70,981 | £113,260 | £69,471 | £64,258 | £27,590 | £41,377 | £63,259 | £59,699 | |
| Subtotal Spent on Operations | £53,987 | £58,981 | £82,677 | £95,187 | £87,006 | £129,285 | £85,496 | £80,283 | £43,615 | £57,402 | £79,284 | £75,724 | |
| Additional Cash Spent | |||||||||||||
| Sales Tax, VAT, HST/GST Paid Out | £0 | £0 | £0 | £0 | £0 | £0 | £0 | £0 | £0 | £0 | £0 | £0 | |
| Principal Repayment of Current Borrowing | £0 | £0 | £0 | £0 | £0 | £0 | £0 | £40,000 | £0 | £0 | £0 | £0 | |
| Other Liabilities Principal Repayment | £0 | £0 | £20,000 | £0 | £0 | £0 | £0 | £4,453 | £10,000 | £0 | £0 | £0 | |
| Long-term Liabilities Principal Repayment | £0 | £0 | £0 | £0 | £0 | £0 | £0 | £0 | £0 | £0 | £0 | £0 | |
| Purchase Other Current Assets | £0 | £0 | £0 | £0 | £0 | £0 | £0 | £0 | £0 | £0 | £0 | £0 | |
| Purchase Long-term Assets | £0 | £0 | £0 | £0 | £0 | £0 | £0 | £0 | £0 | £0 | £0 | £0 | |
| Dividends | £0 | £0 | £0 | £0 | £0 | £0 | £0 | £0 | £0 | £0 | £0 | £0 | |
| Subtotal Cash Spent | £53,987 | £58,981 | £102,677 | £95,187 | £87,006 | £129,285 | £85,496 | £124,736 | £53,615 | £57,402 | £79,284 | £75,724 | |
| Net Cash Flow | £64,454 | £92,220 | (£16,492) | (£6,411) | £45,859 | (£1,248) | £31,522 | (£68,399) | £11,810 | £13,895 | £4,674 | (£9,833) | |
| Cash Balance | £65,079 | £157,299 | £140,808 | £134,397 | £180,256 | £179,007 | £210,529 | £142,130 | £153,940 | £167,835 | £172,509 | £162,676 | |
| Pro Forma Balance Sheet | |||||||||||||
| Jan | Feb | Mar | Apr | May | Jun | Jul | Aug | Sep | Oct | Nov | Dec | ||
| Assets | Starting Balances | ||||||||||||
| Current Assets | |||||||||||||
| Cash | £625 | £65,079 | £157,299 | £140,808 | £134,397 | £180,256 | £179,007 | £210,529 | £142,130 | £153,940 | £167,835 | £172,509 | £162,676 |
| Accounts Receivable | £124,056 | £80,122 | £44,909 | £49,099 | £42,347 | £54,554 | £62,592 | £53,695 | £33,933 | £22,283 | £33,377 | £42,021 | £36,511 |
| Inventory | £28,623 | £21,986 | £15,574 | £11,329 | £9,513 | £22,193 | £16,467 | £14,121 | £9,010 | £9,819 | £12,165 | £11,383 | £6,541 |
| Other Current Assets | £431 | £431 | £431 | £431 | £431 | £431 | £431 | £431 | £431 | £431 | £431 | £431 | £431 |
| Total Current Assets | £153,735 | £167,618 | £218,214 | £201,666 | £186,688 | £257,433 | £258,497 | £278,776 | £185,503 | £186,472 | £213,807 | £226,343 | £206,159 |
| Long-term Assets | |||||||||||||
| Long-term Assets | £35,577 | £35,577 | £35,577 | £35,577 | £35,577 | £35,577 | £35,577 | £35,577 | £35,577 | £35,577 | £35,577 | £35,577 | £35,577 |
| Accumulated Depreciation | £24,247 | £24,247 | £24,247 | £24,247 | £24,247 | £24,247 | £24,247 | £24,247 | £24,247 | £24,247 | £24,247 | £24,247 | £25,247 |
| Total Long-term Assets | £11,330 | £11,330 | £11,330 | £11,330 | £11,330 | £11,330 | £11,330 | £11,330 | £11,330 | £11,330 | £11,330 | £11,330 | £10,330 |
| Total Assets | £165,065 | £178,948 | £229,544 | £212,996 | £198,018 | £268,763 | £269,828 | £290,106 | £196,834 | £197,802 | £225,137 | £237,673 | £216,489 |
| Liabilities and Capital | Jan | Feb | Mar | Apr | May | Jun | Jul | Aug | Sep | Oct | Nov | Dec | |
| Current Liabilities | |||||||||||||
| Accounts Payable | £36,557 | £40,749 | £64,002 | £76,847 | £67,155 | £110,940 | £67,287 | £63,354 | £26,236 | £39,265 | £61,240 | £58,554 | £33,193 |
| Current Borrowing | £22,336 | £22,336 | £22,336 | £22,336 | £22,336 | £22,336 | £42,336 | £42,336 | £2,336 | £2,336 | £2,336 | £2,336 | £2,336 |
| Other Current Liabilities | £25,526 | £27,658 | £33,971 | £13,971 | £13,971 | £20,118 | £20,118 | £25,664 | £21,211 | £11,211 | £12,076 | £15,403 | £16,040 |
| Subtotal Current Liabilities | £84,419 | £90,742 | £120,310 | £113,154 | £103,462 | £153,393 | £129,740 | £131,353 | £49,783 | £52,811 | £75,652 | £76,294 | £51,569 |
| Long-term Liabilities | £0 | £0 | £0 | £0 | £0 | £0 | £0 | £0 | £0 | £0 | £0 | £0 | £0 |
| Total Liabilities | £84,419 | £90,742 | £120,310 | £113,154 | £103,462 | £153,393 | £129,740 | £131,353 | £49,783 | £52,811 | £75,652 | £76,294 | £51,569 |
| Paid-in Capital | £76,960 | £76,960 | £76,960 | £76,960 | £76,960 | £76,960 | £76,960 | £76,960 | £76,960 | £76,960 | £76,960 | £76,960 | £76,960 |
| Retained Earnings | £36,668 | £3,686 | £3,686 | £3,686 | £3,686 | £3,686 | £3,686 | £3,686 | £3,686 | £3,686 | £3,686 | £3,686 | £3,686 |
| Earnings | (£32,982) | £7,559 | £28,588 | £19,196 | £13,910 | £34,724 | £59,442 | £78,107 | £66,405 | £64,345 | £68,839 | £80,734 | £84,274 |
| Total Capital | £80,646 | £88,205 | £109,234 | £99,842 | £94,556 | £115,370 | £140,088 | £158,753 | £147,051 | £144,991 | £149,485 | £161,380 | £164,920 |
| Total Liabilities and Capital | £165,065 | £178,948 | £229,544 | £212,996 | £198,018 | £268,763 | £269,828 | £290,106 | £196,834 | £197,802 | £225,137 | £237,673 | £216,489 |
| <% | |||||||||||||

