
Interstate Travel Center
Executive Summary
Interstate Travel Center is intended to be the major travel center in Dallas, Texas. It will consist of a convenience store, gas/diesel islands, restaurant, and amenities for the trucking business. Interstate Travel Center is a corporation owned and operated by Steve and Janet Smith.
The company’s management philosophy is based on responsibility and mutual respect. Interstate Travel Center has an environment and structure that encourages productivity and respect for customers and fellow employees.
Interstate Travel Center is organized into two main functional areas: convenience store-gas/diesel, and the restaurant, each will have its own on-site management. Steve and Janet Smith are the founders and co-presidents. They will head the operation, and will concentrate on product sourcing, sales, marketing, finance, and overall administration. Each area will have a manager responsible for daily operations who will report to the Smiths.
Standard & Poor’s estimates that the U.S. commercial freight transportation market had aggregate revenues of $436 billion three years ago. In other words, five cents of every dollar of U.S. gross domestic product that year was spent on transportation. With some $344 billion in revenues that same year, the trucking business claimed 79% of the U.S. commercial freight transportation market. This total was divided among two sectors: private carriage and for-hire.
The initial start-up costs will amount to $2.75 million, which will be used to purchase land, develop it, and construct a 6,000 square foot travel center, complete with gas/diesel islands, scales, and a restaurant. The initial capital injection will be $250,000. The remaining will be in the form of a $2.5 million loan.
1.1 Mission
The mission of Interstate Travel Center is to start a new public travel center which will service the truck fueling and shopping needs of NAFTA trade, the general traveling public, and local Dallas customers.
Company Summary
Interstate Travel Center is a start-up company whose management perceives a growing demand for commercial vehicle services within the Dallas area. The company’s management staff includes Steven Smith, who has extensive experience within the automotive repair industry, and Janet Smith, who has provided budgeting and bookkeeping services to small companies for twenty years, who will provide the logistical support for the business. It is Interstate Travel Center’s long-term goal to create multiple service centers within the southwest area to service the NAFTA commercial traffic and create a brand awareness that transcends state borders.
Location:
Interstate Travel Center will be located between I-45 and I-635 in Dallas, Texas. Access to the travel center will be through these major highways. The advantages of this site are listed below and should be evaluated accordingly when investments for site developments (or improvements) are being considered.
- Visibility of this site is considered good.
- Competition at and around this location is low.
- Quantity of competition is classified as limited.
- Accessibility to location is good.
- Traffic count potential (during rush hour traffic) at this location is considered good.
- House count at this location is very low.
- Demographics at this location are excellent.
- Growth of area around this site is fair.
2.1 Company Ownership
Interstate Travel Center is solely owned by Steven and Janet Smith. It is not anticipated that the company will seek additional shareholders for the foreseeable future.
2.2 Start-up Summary
Funding Requirements and Uses
The initial start-up costs will amount to $2.75 million. This will be used to purchase land, develop it, and construct a 6,000 sq./ft travel center, complete with gas/diesel islands, scales, and a restaurant. The initial capital injection will be $250,000. The remaining will be funds in the form of a $2.5 million loan. Figure 1 provides a breakdown of how the funding will be used and Figure 2 provides the Expenditure Outline for Phase I.
Figure 1. Use of Funds
| Working Capital | $250,000 |
| Inventories (Travel Ctr.) | $65,000 |
| Land | $200,000 |
| Land Development | $150,000 |
| Highway Improvements | $350,000 |
| Building | $500,000 |
| Pre-Paid Expenses | $250,000 |
| Gasoline Facility | $200,000 |
| Diesel Facility | $150,000 |
| Equipment (Travel Ctr.) | $100,000 |
| Equipment (Restaurant) | $200,000 |
| Contingency | $235,000 |
| Other fixed Assets | $50,000 |
| Scales | $50,000 |
| $2.75 million |
Figure 2. Phase I Expenditure Outline
| Land Development | $100,000 |
| Building (6,000 sq. ft.) | $500,000 |
| Gasoline Facility (includes all equipment) | $200,000 |
| Diesel Facility (includes all equipment) | $150,000 |
| Equipment: Store | $100,000 |
| Equipment: Restaurant | $200,000 |
| Highway Improvements* | $50,000 |
| Miscellaneous | $50,000 |
| Land Costs | $200,000 |
| TOTAL ALLOWABLE BUDGET FOR PHASE ONE | $1.55 million |
*Texas Department of Transportation – 50/50 split with state.

| Start-up | |
| Requirements | |
| Start-up Expenses | |
| Prepaid Expenses | $250,000 |
| Travel Center Equipment | $100,000 |
| Restaurant Equipment | $200,000 |
| Contingency Costs | $235,000 |
| Other | $0 |
| Total Start-up Expenses | $785,000 |
| Start-up Assets | |
| Cash Required | $250,000 |
| Start-up Inventory | $65,000 |
| Other Current Assets | $50,000 |
| Long-term Assets | $1,600,000 |
| Total Assets | $1,965,000 |
| Total Requirements | $2,750,000 |
| Start-up Funding | |
| Start-up Expenses to Fund | $785,000 |
| Start-up Assets to Fund | $1,965,000 |
| Total Funding Required | $2,750,000 |
| Assets | |
| Non-cash Assets from Start-up | $1,715,000 |
| Cash Requirements from Start-up | $250,000 |
| Additional Cash Raised | $0 |
| Cash Balance on Starting Date | $250,000 |
| Total Assets | $1,965,000 |
| Liabilities and Capital | |
| Liabilities | |
| Current Borrowing | $0 |
| Long-term Liabilities | $2,500,000 |
| Accounts Payable (Outstanding Bills) | $0 |
| Other Current Liabilities (interest-free) | $0 |
| Total Liabilities | $2,500,000 |
| Capital | |
| Planned Investment | |
| Steve Smith | $150,000 |
| Janet Smith | $100,000 |
| Other | $0 |
| Additional Investment Requirement | $0 |
| Total Planned Investment | $250,000 |
| Loss at Start-up (Start-up Expenses) | ($785,000) |
| Total Capital | ($535,000) |
| Total Capital and Liabilities | $1,965,000 |
| Total Funding | $2,750,000 |
Products and Services
Interstate Travel will be a travel center/truck stop offering an array of goods and services. The travel center will have a convenience store as well as gas/diesel fuel pumps. Amenities for NAFTA and other travelers, such as public restrooms, separate trucker entrances, showers, telephones, game room, trucker lounge/TV room, scales, and a parking lot, will also be included.
The suggested branding is for market impact. The branding recommendations made by the feasibility study are Chevron, Diamond Shamrock, Texaco, or a private brand.
The following sections relate the goods and services that are suggested for the travel center. These suggestions are based on our findings and the location classification. It must be stressed that the development of Interstate Travel’s travel centers will be completed in stages. This is in order to create maximum efficiency while still remaining within the spending boundaries.
3.1 Store
Suggested Goods and Services, Convenience Store:
- Two registers and checkout areas.
- 16-20 quantity walk-in cooler.
- 16-20 quantity fountain drink selections.
- Coffee offering based on customer mix.
- Heavy snack items.
- Travel grocery items.
- Extra-heavy oil and other offerings based on the customer mix.
- Public restrooms which will be both large and nice.
- Separate amenities for truckers, such as entrances and restrooms.
All sites that have been evaluated by Paragon/Solutions list the above retail goods and services, and we feel these will contribute the most to the success of the location. Any variance from these suggestions could have a direct affect on the success of this site.
3.2 Food
Suggested Goods and Services, Fast Food:
The following fast food offerings are suggested for this location based on our findings:
- National brand fast food: Phase III only
- Privately-owned full service restaurant (Interstate Travel): Phase I
Other Suggested Fast Food Amenities:
- Indoor seating for 64-69 patrons (develop and grow in phases).
- Drive-thru window (with car stack capabilities): Phase III.
- Order station (with car stack capabilities): Phase III.
- Interior menu board and order line.
- Phase III: Introduce additional fast food.
- Phase III: Increase to seating for 120 patrons.
3.3 Facility
Signage Recommendations
- High-rise highway sign (essential).
- Brand pole/Street family sign.
- Store name sign.
- Gas/Diesel price sign.
- Fast food sign.
- Building sign.
- Other: Highway billboards (North, South, East, and West of site, 20-25 miles).
- Other: Directional signage.
Suggested Goods and Services: Miscellaneous
- Auto parking: develop in phases.
- Truck parking: develop in phases.
- Air and water.
- Signage (per brand).
Parking Development Phases:

- Parking quantity Phase I: 50-75 spots.
- Parking quantity Phase II: 150-225 spots.
- Parking quantity Phase III: 250-425 spots.
- Parking quantity Phase IV: 400-425 spots.
- Parking quantity Phase V: Purchase more land.
3.4 Gas
Suggested Goods and Services, Gasoline Installation:
- Multiple Pump Dispensers at gas islands/Phase I.
- Quantity of MPDs: four/Phase I.
- Diesel offering at one or more gasoline islands both outside islands.
- TV monitors and credit card acceptance on MPDs.
Gasoline Canopy:
- 100% coverage/Phase I.
- Branded/Phase I.
Gasoline Configuration (layout style):
- Head-in/Drive-in (cars face building when fueling)/Phase I.
Gasoline Development Phases:
- Phase I: four gasoline MPDs.
- Phase II: four gasoline MPDs.
- Phase III: six gasoline MPDs.
- Phase IV: six gasoline MPDs.
3.5 Diesel
Suggested Goods and Services, Diesel Facility:
The following type of diesel facility is suggested for this location based on our findings compared to the site size, traffic flow and competition.
- Fueling lanes for large trucks/quantity: four (Phase I).
- Diesel pumps with slaves (clones), dual-sided fueling capabilities.
- Single fuel lanes for smaller vehicles/quantity: one (Phase III).
- High speed pumps at dual fueling lanes.
- Air, water, and window cleaning equipment at fueling islands.
- Un-branded diesel.
- Charge/pay systems associated with the trucking industry.
- Truck parking capabilities/quantity. 50-75 (Phase I only).
Diesel Development Phases:
- Diesel Phase I: four fueling lanes.
- Diesel Phase II: six fueling lanes.
- Diesel Phase III: eight fueling lanes.
- Diesel Phase IV: eight fueling lanes.
3.6 Future Products and Services
A motel and full service trailer/truck repair shop are planned for phase III of this project. Other lease spaces for services, such as shoeshines, haircuts, a medical center, and other kiosk centers, will be available in the critical third phase of development.
Market Analysis Summary
Truckers Dominate Freight Market
Based on value of service, trucking (excluding warehousing and logistics) accounted for 79%, or some $344 billion, of U.S. commercial freight revenues in 1998, but only 45% of total ton-miles. This is because products transported by truck tend to be lightweight manufactured goods that move short distances, rather than the heavy, long-haul, bulk commodities that travel by rail and barge.
Motor carriers specialize in higher-value freight that moves 750 miles or less, and for which delivery is required within three days. Some 36% of truck freight (measured by shipping cost) never crosses state lines. Examples of this type of freight are food and consumer staples delivered locally, and manufactured goods shipped between commercial establishments or delivered to consumers or retail outlets.
Truckers have the largest share of the freight market. Unlike railroads, pipelines, or water carriers, they don’t face geographic limits caused by physical constraints, and can offer door-to-door service. They also pay relatively little to use the nation’s highway system. Railroads, by contrast, must build, maintain, and police their rights-of-way.
The trucking industry consists of two broad segments: private and for-hire. In turn, for-hire truckers fall into two broad categories: truckload (TL) and less-than-truckload (LTL) carriers.
The accompanying Market Analysis chart and table reflect the total projected potential customers that Interstate Travel Center might acquire. The categories have been simplified to include all instate commercial trucks (both the TL and LTL segments) and all instate private vehicles as listed in the U.S. Department of Transportation’s 1997 Vehicle Inventory for the state of Texas. The listed number of private vehicles in Texas is approximately 17 million, however, only a small percentage of private vehicle owners will be inclined to prefer truck stops over gas stations. Therefore, instead of using the larger number, a percentage of the overall private vehicles based on the percentage of private vehicles that truck stops service is used. The third category contains all interstate and NAFTA-based commercial business that passes through Texas, and the final category reflects all out-of-state private vehicles, such as tourists. Again, the numbers in this final category reflects a percentage of out-of-state private vehicles that truck stops normally service.
The growth rates used in this table are based on figures available from the U.S. Department of Transportation. The growth rate for the out-of-state and NAFTA commercial vehicles is only approximate, as it is difficult to project what affects investments in the “Port-to-Plains” trade corridor will have on traffic that passes adjacent to the travel center.
Finally, it must be noted that although the Market Analysis table indicates that the largest market segment is instate private vehicles, the actual percentage will probably be significantly less. Experience has shown that the largest percentage of vehicles serviced by truck stops, such as Interstate Travel, is in the commercial truck segment.

| Market Analysis | |||||||
| Year 1 | Year 2 | Year 3 | Year 4 | Year 5 | |||
| Potential Customers | Growth | CAGR | |||||
| Instate Commercial Trucks | 4% | 500,102 | 517,606 | 535,722 | 554,472 | 573,879 | 3.50% |
| Out-of-state Commercial Trucks | 6% | 285,111 | 302,218 | 320,351 | 339,572 | 359,946 | 6.00% |
| Instate Private Vehicles | 3% | 1,286,952 | 1,325,561 | 1,365,328 | 1,406,288 | 1,448,477 | 3.00% |
| Out-of-state Private Vehicles | 4% | 458,154 | 476,480 | 495,539 | 515,361 | 535,975 | 4.00% |
| Total | 3.63% | 2,530,319 | 2,621,865 | 2,716,940 | 2,815,693 | 2,918,277 | 3.63% |
4.1 Market Segmentation
With some $344 billion in 1998 revenues, the trucking (or motor carrier) business claimed approximately 79% of the U.S. commercial freight transportation market. This total was divided among two sectors: private carriage and for-hire.
Figure 3. Commercial Freight Distribution
(In billions of dollars)
| Transportation | Billion $ | % of Total |
| Trucking, Total | $344 | 63.6% |
| Private, Interstate | $115 | 21.3% |
| Private, Local | $85 | 15.7% |
| Truckload | $65 | 12.0% |
| Local For-Hire | $40 | 7.4% |
| LTL, National | $9 | 1.7% |
| LTL, Regional | $11 | 2.0% |
| Package/Express (ground) | $19 | 3.5% |
| Railroad | $36 | 6.7% |
| Pipeline (oil & gas) | $26 | 4.8% |
| Air freight, Package Domestic | $17 | 3.1% |
| Air freight, Heavy Domestic | $6 | 1.1% |
| Water (Great Lakes/rivers) | $7 | 1.3% |
| Transportation Total* | $436 | 80.6% |
| Distribution | ||
| Warehousing | $70 | 12.9% |
| Logistics Administration | $35 | 6.5% |
| Distribution Total | $105 | 19.4% |
| Total | $541 | 100.0% |
*Excluding $5 billion in international cargo.
Sources: Standard & Poor’s, Data Resources, Inc., and Cass Information Systems.
Private Carriers
Although private carriers comprise the largest component of the motor carrier industry, financial information isn’t available for them. However, the industry is estimated to provide services valued at some $200 billion annually (or 58% of motor carrier revenues in 1998).
The Private Truck Council estimates that there are more than three million trucks operated by private fleets, and these transport 3.5 billion tons of freight annually.
For-Hire Carriers
The For-hire category generated $144 billion in 1998, or 42% of the industry total. Of that $144 billion, some $105 billion (73% of the sector’s business) came from truckload shipments, and $39 billion (27%) was from less-than-truckload and package/express delivery.
Truckload (TL): The national for-hire truckload segment had total revenues of $65 billion in 1998. The TL sector is largely privately owned, with the exception of the top ten publicly owned companies. (For this reason, we focus on the LTL sector in this survey.) Schneider National Carriers is the largest TL operator, with revenues of $2.8 billion in 1998, followed by J.B. Hunt Transport Services ($1.8 billion) and the Landstar family of truckload carriers ($1.3 billion). Of the 50,000 truckload carriers, perhaps 95% have annual revenues of less than $1 million.
Less-than-truckload (LTL): We estimate that the less-than-truckload market garnered $20 billion in 1998. Of this amount, the fast growing regional segment accounted for slightly more than the national market.
The largest national LTL carrier in 1998 was Roadway Express Inc., with $2.32 billion in LTL revenues in that year; the company’s total revenue of $2.55 billion includes TL freight. Yellow Freight System (a unit of Yellow Corporation) was close behind, with $2.25 billion (out of $2.46 billion total). Consolidated Freightways Corporation was third, with $1.95 billion in LTL revenues.
In the regional LTL market, Con-Way Transportation (a unit of CNF Transportation Inc.) was the largest player, with $1.5 billion in LTL revenue in 1998. Second place belonged to US Freightways, whose family of five carriers has generated some $1.4 billion in LTL revenue. American Freightways Corporation was third, with $928 million in LTL revenues.
4.1.1 Market Trends
Industry Trends
While a driver shortage continues to plague the truckload sector, the LTL carriers have adapted to changing market conditions in order to capitalize on growth opportunities. Intermodal shippers also stand to benefit from market trends. Finally, the evolution of e-commerce stands to intensify competition among all carriers.
E-commerce is Big Business
The Internet is rapidly changing how the consumer selects and purchases merchandise. Age-old relationships between vendors, distributors, retailers, and carriers are being torn apart. For many Internet users, the computer has displaced the telephone as a means of transmitting a purchase order, while catalog vendors who have put their wares on the Internet may now receive orders electronically, in addition to mail and phone orders. For the shipping industry, e-commerce is changing the way in which goods are ordered.
The estimated size and growth potential for e-commerce varies widely. Forrester Research, based in Cambridge, Massachusetts, has estimated e-commerce at the consumer level at $7.8 billion in 1998, and projects that it will rise to $18 billion in 1999, $33 billion in 2000, and $108 billion in 2003. According to Forrester, total worldwide e-commerce, including business-to-business transactions, was estimated at $43 billion in 1998, and projected to hit $127 billion in 1999.
The Direct Marketing Association has calculated that e-commerce generated just $5.9 billion in 1998 (or 0.2% of sales), and will climb to 2.5% of retail sales by 2004, representing a 50% annual compound growth rate during this period.
4.1.2 Market Growth
Dallas Support
According to information released by the Texas Department of Transportation (TxDOT), nearly $600 million in projects are already programmed over the next four years, and more than $1 billion in additional transportation projects are recommended for the Dallas region. The projects are on top of a $175 million increase in NAFTA transportation funding through 2003 that was part of the border initiative announced in April, 1999.
It is said that a Ports-To-Plains Trade Corridor could be in the future for Dallas, making it a major port of entry to Mexico. The corridor has been named a high priority corridor by the U.S. Congress, which has placed a greater emphasis on improving transportation in these regions. The major highway would have a direct route from the northern United States to two major port entries: Dallas and Eagles Pass.
4.2 Business Participants
Industry: Trucking Terminal Facilities
Figure 4, below, indicates the Market Statistics for trucking terminals. These are defined as establishments primarily engaged in the operation of route transshipment facilities used by highway-type property-carrying vehicles, including complexes which provide maintenance and service for motor vehicles.
Figure 4: Market Size Statistics-Terminal Facilities
| Estimated number of U.S. establishments | 1,386 |
| Number of people employed in this industry | 64,105 |
| Total annual sales in this industry | $181 million |
| Average employees per establishment | 52 |
| Average sales per establishment | $.8 million |
Industry: Gasoline Service Stations
Gasoline service stations primarily engage in selling gasoline and lubricating oils. These establishments frequently sell other merchandise, such as tires, batteries, and other automobile parts, or perform minor repair work. Gasoline stations, combined with other activities, such as grocery stores, convenience stores, or carwashes, are classified in Figure 5 below according to primary activity.
Figure 5: Market Size Statistics-Gasoline Service Stations
| Estimated number of U.S. establishments | 71,159 |
| Number of people employed in this industry | 471,041 |
| Total annual sales in this industry | $98,817 million |
| Number of employees per establishment | 7 |
| Average sales per establishment | $1.8 million |
Market Analysis by Specialty
Figure 6 provides a market analysis by specialty for the gasoline service stations segment.
Figure 6: Market Analysis by Specialty
| SIC Code | SIC Description | Number of Businesses | % of Total | Total Employees |
| 5541-0000 | Gasoline Service Stations | 50,544 | 71% | 286,062 |
| 5541-9901 | Filling Stations, Gasoline | 18,844 | 26.5% | 137,897 |
| 5541-9902 | Marine Service Station | 171 | 0.2% | 1,123 |
| 5541-9903 | Truck Stops | 1,600 | 2.2% | 45,959 |
| Total/Average | 71,159 | 100% | 471,041 |
Note: Not all establishments have a specialty.
Strategy and Implementation Summary
Interstate Travel Center’s strategy is to develop a major travel center in Dallas, Texas. The center will consist of a major convenience store, gas/diesel islands, restaurant, and amenities for the trucking business. Key components of the company’s initial strategy are summarized as follows:
- Advertising. Promote the new business through extensive advertising.
- Location. Provide a clean, safe and appealing location for travelers.
- Convenient center. Provide a convenient center with a full array of products and services for those that are traveling as well as for the citizens of Dallas and the surrounding communities.
- One-stop shop. Be the one-stop shop for travelers to and from Dallas.
- NAFTA trucking trade business. Cater to the NAFTA trucking trade business.
- Good return on investment. Maintain a profitable business with a good return on investment.
Interstate Travel Center will be developed in four phases. Phase development will enable the owner/operator to introduce viable, profitable goods and services without over-building. Over-building at this location would be easy to do because of the slower growth of the area associated with NAFTA, it would also mean certain failure if the owner/operator cannot secure resources for several years of financial staying power to support a negative cash flow. The timeline for the implementation of the various phases is contingent upon customer response and profitability and action is initiated at the discretion of the owners. It is assumed that the implementation of Phase II will occur sometime after the first three years of operation.
Phase I: Initial Development
- Diesel fueling lanes: four; dual-sided fueling.
- Gasoline MPDs: four dispensers.
- Travel Store: Approximately 3,000 square feet.
- Showers: Approximately four stalls.
- Truck Loungers.
- Game Room.
- Restaurant: Seating for 64-69 patrons.
- Truck Parking: room for approximately 100-150 trucks.
- Scales: Owner to purchase scales.
Phase II: Increased Goods and Services, Third Year of Operation
- Diesel fueling lanes: add two for a total of six lanes.
- Truck parking: add 100-150 spaces.
Phase III: Increased Goods and Services, Fifth Year of Operation
- Diesel fueling lanes: increase to eight dual-sided fueling.
- Gasoline MPDs: increase to six dispensers.
- Travel Store: Enlarge to 4,800 square feet.
- Showers: Add four for a total of eight stalls.
- Truck services: Add lease space for truck services such as tires, batteries, oil and lube.
Phase IV: Increased Goods and Services, Sixth Year of Operation
- Add fast food unit.
- Add additional restaurant seating for a total of 100 patrons.
- Motel: Add 48 room unit.
- Truck Parking: Add 100 spaces (Total 400-525).
- Truck Wash.
5.1 Branding
Gasoline/Diesel branding
The suggested branding is for market impact. A positive draw of highway customers is more likely on a branded unit than on a non-branded unit. Branding will draw those customers that might have otherwise traded in a larger area. Branding will help to draw local trucks and long-haul NAFTA trucks that need fuel between their designated stops.
It is highly recommended that the location be promoted for local and long-haul businesses, and for companies to fill their vehicles at the new travel center. Suggested promotions include special pricing and/or national charge accounts such as Comcheck.
Branding recommendations:
It is suggested that the new site be branded with one of the following options for national or regional recognition.
- Chevron
- Diamond Shamrock
- Texaco
- Private Brand
Branding advantages:
The primary advantage to branding is the dollar assistance offered by the oil companies. Most major companies have rebates and allowances that will assist in the total dollar investment by the retailer. Regionally, we are seeing oil companies upgrade their company-owned leased facilities. The brand suggested is in a strong growth pattern in many communities similar to this one. Additional advantages are listed below:
- It is best to be branded on a highway and/or commuter type location.
- In a transit location, it is best to be branded to draw credit card sales.
- Branded locations (on average) have a larger dollar sale per visit than do unbranded locations.
- Being branded will enable the owner to take advantage of the rebate dollars and advertising dollars available.
- Constructing the facility as a branded location will enable the owner to take advantage of the rebate programs, thus improving their return on investment (ROI).
- The rebate program will reduce the total investment over the next three to five years. This fact alone improves the risk factor and should carry a great deal of weight when being considered by local financing and/or banking services.
The owners have chosen Diamond Shamrock as their brand preference for their new business. Their selection was based on several factors, such as incentives, advertising allowances, company flexibility, and their acceptance of all major credit cards.
5.2 Marketing Strategy
A small traveler’s guide will be published to advertise the travel center and all it has to offer. Advertising will be disseminated through the use of local newspapers, and radio and television commercials. Other promotional items, such as billboards and local chamber of commerce propaganda will also be employed. Customer service will be the number one priority of this business. This will, in turn, generate repeat business.
5.3 Sales Strategy
The sales figures are based on projections of vehicles using the major highways adjacent to Interstate Travel Center. The yearly growth figures are based on conservative projections of increasing customer use as marketing and customer retention builds an established customer base. The growth rate for gas/diesel is five percent per year for the first three years. The restaurant growth rate is slightly higher, at seven percent per year. It it assumed that this venture will grow a stable customer base more quickly than the other ventures due to its more unique product experience. Finally, the growth rates for the travel store is set at four percent per year. This again reflects the belief that this venture will have the most difficulty in building service awareness and retention.
5.3.1 Sales Forecast
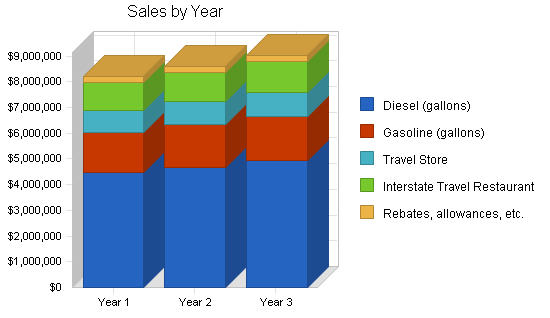
The following table and chart show our sales forecast.

| Sales Forecast | |||
| Year 1 | Year 2 | Year 3 | |
| Unit Sales | |||
| Diesel (gallons) | 2,550,000 | 2,677,500 | 2,811,375 |
| Gasoline (gallons) | 1,050,000 | 1,102,500 | 1,157,625 |
| Travel Store | 230,004 | 236,904 | 244,011 |
| Interstate Travel Restaurant | 81,276 | 86,965 | 93,052 |
| Rebates, allowances, etc. | 246,600 | 246,600 | 246,600 |
| Total Unit Sales | 4,157,880 | 4,350,469 | 4,552,663 |
| Unit Prices | Year 1 | Year 2 | Year 3 |
| Diesel (gallons) | $1.75 | $1.75 | $1.75 |
| Gasoline (gallons) | $1.50 | $1.50 | $1.50 |
| Travel Store | $3.75 | $3.75 | $3.75 |
| Interstate Travel Restaurant | $13.00 | $13.00 | $13.00 |
| Rebates, allowances, etc. | $1.00 | $1.00 | $1.00 |
| Sales | |||
| Diesel (gallons) | $4,462,500 | $4,685,625 | $4,919,906 |
| Gasoline (gallons) | $1,575,000 | $1,653,750 | $1,736,438 |
| Travel Store | $862,515 | $888,390 | $915,041 |
| Interstate Travel Restaurant | $1,056,588 | $1,130,545 | $1,209,676 |
| Rebates, allowances, etc. | $246,600 | $246,600 | $246,600 |
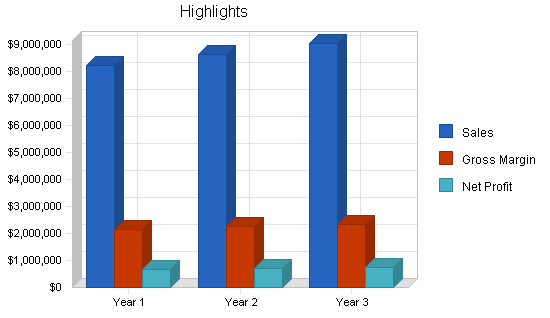
| Total Sales | $8,203,203 | $8,604,910 | $9,027,661 |
| Direct Unit Costs | Year 1 | Year 2 | Year 3 |
| Diesel (gallons) | $1.67 | $1.67 | $1.67 |
| Gasoline (gallons) | $1.40 | $1.40 | $1.40 |
| Travel Store | $0.75 | $0.75 | $0.75 |
| Interstate Travel Restaurant | $2.00 | $2.00 | $2.00 |
| Rebates, allowances, etc. | $0.00 | $0.00 | $0.00 |
| Direct Cost of Sales | |||
| Diesel (gallons) | $4,258,500 | $4,471,425 | $4,694,996 |
| Gasoline (gallons) | $1,470,000 | $1,543,500 | $1,620,675 |
| Travel Store | $172,503 | $177,678 | $183,008 |
| Interstate Travel Restaurant | $162,552 | $173,930 | $186,104 |
| Rebates, allowances, etc. | $0 | $0 | $0 |
| Subtotal Direct Cost of Sales | $6,063,555 | $6,366,533 | $6,684,784 |
Management Summary
Steven and Janet Smith will be the sole owners of Interstate Travel Center for the foreseeable future. It is planned that a management staff, consisting of a full-time manager and a part-time assistant manager, will be hired to handle the day-to-day operations of both the gas/diesel service and the restaurant sections of the travel center. As the company continues to grow, so too will management.
| Personnel Plan | |||
| Year 1 | Year 2 | Year 3 | |
| Steve Smith | $50,000 | $50,000 | $50,000 |
| Janet Smith | $50,000 | $50,000 | $50,000 |
| Convenience store/Gas station Manager | $31,200 | $31,200 | $31,200 |
| Restaurant Manager | $36,000 | $36,000 | $36,000 |
| Assist Manager – Cook | $28,800 | $28,800 | $28,800 |
| Cook 2 | $26,880 | $26,880 | $26,880 |
| Cook 3 | $26,880 | $26,880 | $26,880 |
| Cook 4 | $26,880 | $26,880 | $26,880 |
| Cook 5 | $26,880 | $26,880 | $26,880 |
| Cook 6 | $26,880 | $26,880 | $26,880 |
| Waitress/Waiter | $11,808 | $11,808 | $11,808 |
| Waitress/Waiter | $11,808 | $11,808 | $11,808 |
| Waitress/Waiter | $11,808 | $11,808 | $11,808 |
| Waitress/Waiter | $11,808 | $11,808 | $11,808 |
| Waitress/Waiter | $7,680 | $7,680 | $7,680 |
| Waitress/Waiter | $7,680 | $7,680 | $7,680 |
| Waitress/Waiter | $7,680 | $7,680 | $7,680 |
| Waitress/Waiter | $7,680 | $7,680 | $7,680 |
| Waitress/Waiter | $7,680 | $7,680 | $7,680 |
| Waitress/Waiter | $7,680 | $7,680 | $7,680 |
| Waitress/Waiter | $7,680 | $7,680 | $7,680 |
| Waitress/Waiter | $7,680 | $7,680 | $7,680 |
| Assist. Manager – Cashier | $9,000 | $9,000 | $9,000 |
| Cashier | $6,000 | $6,000 | $6,000 |
| Cashier | $6,000 | $6,000 | $6,000 |
| Cashier | $6,000 | $6,000 | $6,000 |
| Cashier | $6,000 | $6,000 | $6,000 |
| Maintenance | $9,600 | $9,600 | $9,600 |
| Total People | 0 | 0 | 0 |
| Total Payroll | $481,672 | $481,672 | $481,672 |
Financial Plan
The following topics outline the financials for Interstate Travel Center.
7.1 Important Assumptions
The chart indicating the projected cash account does not take into account the investment needed to initiate Phases II-IV. The General Assumptions table states some of the more important business assumptions for the company.
| General Assumptions | |||
| Year 1 | Year 2 | Year 3 | |
| Plan Month | 1 | 2 | 3 |
| Current Interest Rate | 10.00% | 10.00% | 10.00% |
| Long-term Interest Rate | 10.00% | 10.00% | 10.00% |
| Tax Rate | 25.42% | 25.00% | 25.42% |
| Other | 0 | 0 | 0 |
7.2 Projected Cash Flow
The following table and chart reveal the projected cash flow for Interstate Travel Center for fiscal years 2001, 2002, and 2003.

| Pro Forma Cash Flow | |||
| Year 1 | Year 2 | Year 3 | |
| Cash Received | |||
| Cash from Operations | |||
| Cash Sales | $8,203,203 | $8,604,910 | $9,027,661 |
| Subtotal Cash from Operations | $8,203,203 | $8,604,910 | $9,027,661 |
| Additional Cash Received | |||
| Sales Tax, VAT, HST/GST Received | $0 | $0 | $0 |
| New Current Borrowing | $0 | $0 | $0 |
| New Other Liabilities (interest-free) | $0 | $0 | $0 |
| New Long-term Liabilities | $0 | $0 | $0 |
| Sales of Other Current Assets | $0 | $0 | $0 |
| Sales of Long-term Assets | $0 | $0 | $0 |
| New Investment Received | $0 | $0 | $0 |
| Subtotal Cash Received | $8,203,203 | $8,604,910 | $9,027,661 |
| Expenditures | Year 1 | Year 2 | Year 3 |
| Expenditures from Operations | |||
| Cash Spending | $481,672 | $481,672 | $481,672 |
| Bill Payments | $6,956,862 | $7,367,638 | $7,785,173 |
| Subtotal Spent on Operations | $7,438,534 | $7,849,310 | $8,266,845 |
| Additional Cash Spent | |||
| Sales Tax, VAT, HST/GST Paid Out | $0 | $0 | $0 |
| Principal Repayment of Current Borrowing | $0 | $0 | $0 |
| Other Liabilities Principal Repayment | $0 | $0 | $0 |
| Long-term Liabilities Principal Repayment | $275,000 | $275,000 | $275,000 |
| Purchase Other Current Assets | $0 | $0 | $0 |
| Purchase Long-term Assets | $0 | $0 | $0 |
| Dividends | $0 | $0 | $0 |
| Subtotal Cash Spent | $7,713,534 | $8,124,310 | $8,541,845 |
| Net Cash Flow | $489,669 | $480,600 | $485,816 |
| Cash Balance | $739,669 | $1,220,269 | $1,706,085 |
7.3 Break-even Analysis
The break-even chart and table below describe how much money will need to be made to be profitable each month.

| Break-even Analysis | |
| Monthly Units Break-even | 165,099 |
| Monthly Revenue Break-even | $325,729 |
| Assumptions: | |
| Average Per-Unit Revenue | $1.97 |
| Average Per-Unit Variable Cost | $1.46 |
| Estimated Monthly Fixed Cost | $84,960 |
7.4 Projected Profit and Loss
The chart and table below projects the yearly profit and loss for the company. For a monthly breakdown, please see the appendix following the plan.

| Pro Forma Profit and Loss | |||
| Year 1 | Year 2 | Year 3 | |
| Sales | $8,203,203 | $8,604,910 | $9,027,661 |
| Direct Cost of Sales | $6,063,555 | $6,366,533 | $6,684,784 |
| Other | $0 | $0 | $0 |
| Total Cost of Sales | $6,063,555 | $6,366,533 | $6,684,784 |
| Gross Margin | $2,139,648 | $2,238,377 | $2,342,878 |
| Gross Margin % | 26.08% | 26.01% | 25.95% |
| Expenses | |||
| Payroll | $481,672 | $481,672 | $481,672 |
| Sales and Marketing and Other Expenses | $220,800 | $278,800 | $378,800 |
| Depreciation | $30,000 | $30,000 | $30,000 |
| Leased Equipment | $49,800 | $49,800 | $49,800 |
| Utilities | $49,200 | $49,200 | $49,200 |
| Insurance | $91,800 | $91,800 | $91,800 |
| Rent | $24,000 | $30,000 | $34,000 |
| Payroll Taxes | $72,251 | $72,251 | $72,251 |
| Other | $0 | $0 | $0 |
| Total Operating Expenses | $1,019,523 | $1,083,523 | $1,187,523 |
| Profit Before Interest and Taxes | $1,120,125 | $1,154,854 | $1,155,355 |
| EBITDA | $1,150,125 | $1,184,854 | $1,185,355 |
| Interest Expense | $235,104 | $208,750 | $181,250 |
| Taxes Incurred | $224,890 | $236,526 | $247,585 |
| Net Profit | $660,131 | $709,578 | $726,520 |
| Net Profit/Sales | 8.05% | 8.25% | 8.05% |
7.5 Projected Balance Sheet
The following table shows our projected Balance Sheet for the next three years. We anticipate a steadily increasing Net Worth.
| Pro Forma Balance Sheet | |||
| Year 1 | Year 2 | Year 3 | |
| Assets | |||
| Current Assets | |||
| Cash | $739,669 | $1,220,269 | $1,706,085 |
| Inventory | $555,826 | $583,599 | $612,772 |
| Other Current Assets | $50,000 | $50,000 | $50,000 |
| Total Current Assets | $1,345,495 | $1,853,868 | $2,368,857 |
| Long-term Assets | |||
| Long-term Assets | $1,600,000 | $1,600,000 | $1,600,000 |
| Accumulated Depreciation | $30,000 | $60,000 | $90,000 |
| Total Long-term Assets | $1,570,000 | $1,540,000 | $1,510,000 |
| Total Assets | $2,915,495 | $3,393,868 | $3,878,857 |
| Liabilities and Capital | Year 1 | Year 2 | Year 3 |
| Current Liabilities | |||
| Accounts Payable | $565,364 | $609,159 | $642,628 |
| Current Borrowing | $0 | $0 | $0 |
| Other Current Liabilities | $0 | $0 | $0 |
| Subtotal Current Liabilities | $565,364 | $609,159 | $642,628 |
| Long-term Liabilities | $2,225,000 | $1,950,000 | $1,675,000 |
| Total Liabilities | $2,790,364 | $2,559,159 | $2,317,628 |
| Paid-in Capital | $250,000 | $250,000 | $250,000 |
| Retained Earnings | ($785,000) | ($124,869) | $584,709 |
| Earnings | $660,131 | $709,578 | $726,520 |
| Total Capital | $125,131 | $834,709 | $1,561,229 |
| Total Liabilities and Capital | $2,915,495 | $3,393,868 | $3,878,857 |
| Net Worth | $125,131 | $834,709 | $1,561,229 |
7.6 Business Ratios
The table below outlines industry profile statistics for the gas and service station industry, as determined by the Standard Industry Classification (SIC) Index code 5541, Gasoline Service Stations. These statistics show a comparison of the industry standards and key ratios for this plan.
| Ratio Analysis | ||||
| Year 1 | Year 2 | Year 3 | Industry Profile | |
| Sales Growth | 0.00% | 4.90% | 4.91% | 10.80% |
| Percent of Total Assets | ||||
| Inventory | 19.06% | 17.20% | 15.80% | 13.30% |
| Other Current Assets | 1.71% | 1.47% | 1.29% | 25.60% |
| Total Current Assets | 46.15% | 54.62% | 61.07% | 49.50% |
| Long-term Assets | 53.85% | 45.38% | 38.93% | 50.50% |
| Total Assets | 100.00% | 100.00% | 100.00% | 100.00% |
| Current Liabilities | 19.39% | 17.95% | 16.57% | 31.60% |
| Long-term Liabilities | 76.32% | 57.46% | 43.18% | 23.10% |
| Total Liabilities | 95.71% | 75.41% | 59.75% | 54.70% |
| Net Worth | 4.29% | 24.59% | 40.25% | 45.30% |
| Percent of Sales | ||||
| Sales | 100.00% | 100.00% | 100.00% | 100.00% |
| Gross Margin | 26.08% | 26.01% | 25.95% | 16.50% |
| Selling, General & Administrative Expenses | 17.99% | 17.77% | 17.86% | 10.40% |
| Advertising Expenses | 2.34% | 2.32% | 2.77% | 0.20% |
| Profit Before Interest and Taxes | 13.65% | 13.42% | 12.80% | 0.50% |
| Main Ratios | ||||
| Current | 2.38 | 3.04 | 3.69 | 1.55 |
| Quick | 1.40 | 2.09 | 2.73 | 0.91 |
| Total Debt to Total Assets | 95.71% | 75.41% | 59.75% | 54.70% |
| Pre-tax Return on Net Worth | 707.28% | 113.35% | 62.39% | 2.50% |
| Pre-tax Return on Assets | 30.36% | 27.88% | 25.11% | 5.50% |
| Additional Ratios | Year 1 | Year 2 | Year 3 | |
| Net Profit Margin | 8.05% | 8.25% | 8.05% | n.a |
| Return on Equity | 527.55% | 85.01% | 46.54% | n.a |
| Activity Ratios | ||||
| Inventory Turnover | 10.91 | 11.17 | 11.18 | n.a |
| Accounts Payable Turnover | 13.31 | 12.17 | 12.17 | n.a |
| Payment Days | 27 | 29 | 29 | n.a |
| Total Asset Turnover | 2.81 | 2.54 | 2.33 | n.a |
| Debt Ratios | ||||
| Debt to Net Worth | 22.30 | 3.07 | 1.48 | n.a |
| Current Liab. to Liab. | 0.20 | 0.24 | 0.28 | n.a |
| Liquidity Ratios | ||||
| Net Working Capital | $780,131 | $1,244,709 | $1,726,229 | n.a |
| Interest Coverage | 4.76 | 5.53 | 6.37 | n.a |
| Additional Ratios | ||||
| Assets to Sales | 0.36 | 0.39 | 0.43 | n.a |
| Current Debt/Total Assets | 19% | 18% | 17% | n.a |
| Acid Test | 1.40 | 2.09 | 2.73 | n.a |
| Sales/Net Worth | 65.56 | 10.31 | 5.78 | n.a |
| Dividend Payout | 0.00 | 0.00 | 0.00 | n.a |
Appendix
| Sales Forecast | |||||||||||||
| Month 1 | Month 2 | Month 3 | Month 4 | Month 5 | Month 6 | Month 7 | Month 8 | Month 9 | Month 10 | Month 11 | Month 12 | ||
| Unit Sales | |||||||||||||
| Diesel (gallons) | 0% | 212,500 | 212,500 | 212,500 | 212,500 | 212,500 | 212,500 | 212,500 | 212,500 | 212,500 | 212,500 | 212,500 | 212,500 |
| Gasoline (gallons) | 41% | 87,500 | 87,500 | 87,500 | 87,500 | 87,500 | 87,500 | 87,500 | 87,500 | 87,500 | 87,500 | 87,500 | 87,500 |
| Travel Store | 9% | 19,167 | 19,167 | 19,167 | 19,167 | 19,167 | 19,167 | 19,167 | 19,167 | 19,167 | 19,167 | 19,167 | 19,167 |
| Interstate Travel Restaurant | 3% | 6,773 | 6,773 | 6,773 | 6,773 | 6,773 | 6,773 | 6,773 | 6,773 | 6,773 | 6,773 | 6,773 | 6,773 |
| Rebates, allowances, etc. | 10% | 20,550 | 20,550 | 20,550 | 20,550 | 20,550 | 20,550 | 20,550 | 20,550 | 20,550 | 20,550 | 20,550 | 20,550 |
| Total Unit Sales | 346,490 | 346,490 | 346,490 | 346,490 | 346,490 | 346,490 | 346,490 | 346,490 | 346,490 | 346,490 | 346,490 | 346,490 | |
| Unit Prices | Month 1 | Month 2 | Month 3 | Month 4 | Month 5 | Month 6 | Month 7 | Month 8 | Month 9 | Month 10 | Month 11 | Month 12 | |
| Diesel (gallons) | $1.75 | $1.75 | $1.75 | $1.75 | $1.75 | $1.75 | $1.75 | $1.75 | $1.75 | $1.75 | $1.75 | $1.75 | |
| Gasoline (gallons) | $1.50 | $1.50 | $1.50 | $1.50 | $1.50 | $1.50 | $1.50 | $1.50 | $1.50 | $1.50 | $1.50 | $1.50 | |
| Travel Store | $3.75 | $3.75 | $3.75 | $3.75 | $3.75 | $3.75 | $3.75 | $3.75 | $3.75 | $3.75 | $3.75 | $3.75 | |
| Interstate Travel Restaurant | $13.00 | $13.00 | $13.00 | $13.00 | $13.00 | $13.00 | $13.00 | $13.00 | $13.00 | $13.00 | $13.00 | $13.00 | |
| Rebates, allowances, etc. | $1.00 | $1.00 | $1.00 | $1.00 | $1.00 | $1.00 | $1.00 | $1.00 | $1.00 | $1.00 | $1.00 | $1.00 | |
| Sales | |||||||||||||
| Diesel (gallons) | $371,875 | $371,875 | $371,875 | $371,875 | $371,875 | $371,875 | $371,875 | $371,875 | $371,875 | $371,875 | $371,875 | $371,875 | |
| Gasoline (gallons) | $131,250 | $131,250 | $131,250 | $131,250 | $131,250 | $131,250 | $131,250 | $131,250 | $131,250 | $131,250 | $131,250 | $131,250 | |
| Travel Store | $71,876 | $71,876 | $71,876 | $71,876 | $71,876 | $71,876 | $71,876 | $71,876 | $71,876 | $71,876 | $71,876 | $71,876 | |
| Interstate Travel Restaurant | $88,049 | $88,049 | $88,049 | $88,049 | $88,049 | $88,049 | $88,049 | $88,049 | $88,049 | $88,049 | $88,049 | $88,049 | |
| Rebates, allowances, etc. | $20,550 | $20,550 | $20,550 | $20,550 | $20,550 | $20,550 | $20,550 | $20,550 | $20,550 | $20,550 | $20,550 | $20,550 | |
| Total Sales | $683,600 | $683,600 | $683,600 | $683,600 | $683,600 | $683,600 | $683,600 | $683,600 | $683,600 | $683,600 | $683,600 | $683,600 | |
| Direct Unit Costs | Month 1 | Month 2 | Month 3 | Month 4 | Month 5 | Month 6 | Month 7 | Month 8 | Month 9 | Month 10 | Month 11 | Month 12 | |
| Diesel (gallons) | 8.00% | $1.67 | $1.67 | $1.67 | $1.67 | $1.67 | $1.67 | $1.67 | $1.67 | $1.67 | $1.67 | $1.67 | $1.67 |
| Gasoline (gallons) | 0.00% | $1.40 | $1.40 | $1.40 | $1.40 | $1.40 | $1.40 | $1.40 | $1.40 | $1.40 | $1.40 | $1.40 | $1.40 |
| Travel Store | 0.00% | $0.75 | $0.75 | $0.75 | $0.75 | $0.75 | $0.75 | $0.75 | $0.75 | $0.75 | $0.75 | $0.75 | $0.75 |
| Interstate Travel Restaurant | 0.00% | $2.00 | $2.00 | $2.00 | $2.00 | $2.00 | $2.00 | $2.00 | $2.00 | $2.00 | $2.00 | $2.00 | $2.00 |
| Rebates, allowances, etc. | 0.00% | $0.00 | $0.00 | $0.00 | $0.00 | $0.00 | $0.00 | $0.00 | $0.00 | $0.00 | $0.00 | $0.00 | $0.00 |
| Direct Cost of Sales | |||||||||||||
| Diesel (gallons) | $354,875 | $354,875 | $354,875 | $354,875 | $354,875 | $354,875 | $354,875 | $354,875 | $354,875 | $354,875 | $354,875 | $354,875 | |
| Gasoline (gallons) | $122,500 | $122,500 | $122,500 | $122,500 | $122,500 | $122,500 | $122,500 | $122,500 | $122,500 | $122,500 | $122,500 | $122,500 | |
| Travel Store | $14,375 | $14,375 | $14,375 | $14,375 | $14,375 | $14,375 | $14,375 | $14,375 | $14,375 | $14,375 | $14,375 | $14,375 | |
| Interstate Travel Restaurant | $13,546 | $13,546 | $13,546 | $13,546 | $13,546 | $13,546 | $13,546 | $13,546 | $13,546 | $13,546 | $13,546 | $13,546 | |
| Rebates, allowances, etc. | $0 | $0 | $0 | $0 | $0 | $0 | $0 | $0 | $0 | $0 | $0 | $0 | |
| Subtotal Direct Cost of Sales | $505,296 | $505,296 | $505,296 | $505,296 | $505,296 | $505,296 | $505,296 | $505,296 | $505,296 | $505,296 | $505,296 | $505,296 | |
| Personnel Plan | |||||||||||||
| Month 1 | Month 2 | Month 3 | Month 4 | Month 5 | Month 6 | Month 7 | Month 8 | Month 9 | Month 10 | Month 11 | Month 12 | ||
| Steve Smith | 0% | $4,167 | $4,167 | $4,167 | $4,167 | $4,167 | $4,167 | $4,167 | $4,167 | $4,167 | $4,167 | $4,167 | $4,167 |
| Janet Smith | 0% | $4,167 | $4,167 | $4,167 | $4,167 | $4,167 | $4,167 | $4,167 | $4,167 | $4,167 | $4,167 | $4,167 | $4,167 |
| Convenience store/Gas station Manager | 0% | $2,600 | $2,600 | $2,600 | $2,600 | $2,600 | $2,600 | $2,600 | $2,600 | $2,600 | $2,600 | $2,600 | $2,600 |
| Restaurant Manager | 0% | $3,000 | $3,000 | $3,000 | $3,000 | $3,000 | $3,000 | $3,000 | $3,000 | $3,000 | $3,000 | $3,000 | $3,000 |
| Assist Manager – Cook | 0% | $2,400 | $2,400 | $2,400 | $2,400 | $2,400 | $2,400 | $2,400 | $2,400 | $2,400 | $2,400 | $2,400 | $2,400 |
| Cook 2 | 0% | $2,240 | $2,240 | $2,240 | $2,240 | $2,240 | $2,240 | $2,240 | $2,240 | $2,240 | $2,240 | $2,240 | $2,240 |
| Cook 3 | 0% | $2,240 | $2,240 | $2,240 | $2,240 | $2,240 | $2,240 | $2,240 | $2,240 | $2,240 | $2,240 | $2,240 | $2,240 |
| Cook 4 | 0% | $2,240 | $2,240 | $2,240 | $2,240 | $2,240 | $2,240 | $2,240 | $2,240 | $2,240 | $2,240 | $2,240 | $2,240 |
| Cook 5 | 0% | $2,240 | $2,240 | $2,240 | $2,240 | $2,240 | $2,240 | $2,240 | $2,240 | $2,240 | $2,240 | $2,240 | $2,240 |
| Cook 6 | 0% | $2,240 | $2,240 | $2,240 | $2,240 | $2,240 | $2,240 | $2,240 | $2,240 | $2,240 | $2,240 | $2,240 | $2,240 |
| Waitress/Waiter | 0% | $984 | $984 | $984 | $984 | $984 | $984 | $984 | $984 | $984 | $984 | $984 | $984 |
| Waitress/Waiter | 0% | $984 | $984 | $984 | $984 | $984 | $984 | $984 | $984 | $984 | $984 | $984 | $984 |
| Waitress/Waiter | 0% | $984 | $984 | $984 | $984 | $984 | $984 | $984 | $984 | $984 | $984 | $984 | $984 |
| Waitress/Waiter | 0% | $984 | $984 | $984 | $984 | $984 | $984 | $984 | $984 | $984 | $984 | $984 | $984 |
| Waitress/Waiter | 0% | $640 | $640 | $640 | $640 | $640 | $640 | $640 | $640 | $640 | $640 | $640 | $640 |
| Waitress/Waiter | 0% | $640 | $640 | $640 | $640 | $640 | $640 | $640 | $640 | $640 | $640 | $640 | $640 |
| Waitress/Waiter | 0% | $640 | $640 | $640 | $640 | $640 | $640 | $640 | $640 | $640 | $640 | $640 | $640 |
| Waitress/Waiter | 0% | $640 | $640 | $640 | $640 | $640 | $640 | $640 | $640 | $640 | $640 | $640 | $640 |
| Waitress/Waiter | 0% | $640 | $640 | $640 | $640 | $640 | $640 | $640 | $640 | $640 | $640 | $640 | $640 |
| Waitress/Waiter | 0% | $640 | $640 | $640 | $640 | $640 | $640 | $640 | $640 | $640 | $640 | $640 | $640 |
| Waitress/Waiter | 0% | $640 | $640 | $640 | $640 | $640 | $640 | $640 | $640 | $640 | $640 | $640 | $640 |
| Waitress/Waiter | 0% | $640 | $640 | $640 | $640 | $640 | $640 | $640 | $640 | $640 | $640 | $640 | $640 |
| Assist. Manager – Cashier | 0% | $750 | $750 | $750 | $750 | $750 | $750 | $750 | $750 | $750 | $750 | $750 | $750 |
| Cashier | 0% | $500 | $500 | $500 | $500 | $500 | $500 | $500 | $500 | $500 | $500 | $500 | $500 |
| Cashier | 0% | $500 | $500 | $500 | $500 | $500 | $500 | $500 | $500 | $500 | $500 | $500 | $500 |
| Cashier | 0% | $500 | $500 | $500 | $500 | $500 | $500 | $500 | $500 | $500 | $500 | $500 | $500 |
| Cashier | 0% | $500 | $500 | $500 | $500 | $500 | $500 | $500 | $500 | $500 | $500 | $500 | $500 |
| Maintenance | 0% | $800 | $800 | $800 | $800 | $800 | $800 | $800 | $800 | $800 | $800 | $800 | $800 |
| Total People | 0 | 0 | 0 | 0 | 0 | 0 | 0 | 0 | 0 | 0 | 0 | 0 | |
| Total Payroll | $40,139 | $40,139 | $40,139 | $40,139 | $40,139 | $40,139 | $40,139 | $40,139 | $40,139 | $40,139 | $40,139 | $40,139 | |
| General Assumptions | |||||||||||||
| Month 1 | Month 2 | Month 3 | Month 4 | Month 5 | Month 6 | Month 7 | Month 8 | Month 9 | Month 10 | Month 11 | Month 12 | ||
| Plan Month | 1 | 2 | 3 | 4 | 5 | 6 | 7 | 8 | 9 | 10 | 11 | 12 | |
| Current Interest Rate | 10.00% | 10.00% | 10.00% | 10.00% | 10.00% | 10.00% | 10.00% | 10.00% | 10.00% | 10.00% | 10.00% | 10.00% | |
| Long-term Interest Rate | 10.00% | 10.00% | 10.00% | 10.00% | 10.00% | 10.00% | 10.00% | 10.00% | 10.00% | 10.00% | 10.00% | 10.00% | |
| Tax Rate | 30.00% | 25.00% | 25.00% | 25.00% | 25.00% | 25.00% | 25.00% | 25.00% | 25.00% | 25.00% | 25.00% | 25.00% | |
| Other | 0 | 0 | 0 | 0 | 0 | 0 | 0 | 0 | 0 | 0 | 0 | 0 | |
| Pro Forma Profit and Loss | |||||||||||||
| Month 1 | Month 2 | Month 3 | Month 4 | Month 5 | Month 6 | Month 7 | Month 8 | Month 9 | Month 10 | Month 11 | Month 12 | ||
| Sales | $683,600 | $683,600 | $683,600 | $683,600 | $683,600 | $683,600 | $683,600 | $683,600 | $683,600 | $683,600 | $683,600 | $683,600 | |
| Direct Cost of Sales | $505,296 | $505,296 | $505,296 | $505,296 | $505,296 | $505,296 | $505,296 | $505,296 | $505,296 | $505,296 | $505,296 | $505,296 | |
| Other | $0 | $0 | $0 | $0 | $0 | $0 | $0 | $0 | $0 | $0 | $0 | $0 | |
| Total Cost of Sales | $505,296 | $505,296 | $505,296 | $505,296 | $505,296 | $505,296 | $505,296 | $505,296 | $505,296 | $505,296 | $505,296 | $505,296 | |
| Gross Margin | $178,304 | $178,304 | $178,304 | $178,304 | $178,304 | $178,304 | $178,304 | $178,304 | $178,304 | $178,304 | $178,304 | $178,304 | |
| Gross Margin % | 26.08% | 26.08% | 26.08% | 26.08% | 26.08% | 26.08% | 26.08% | 26.08% | 26.08% | 26.08% | 26.08% | 26.08% | |
| Expenses | |||||||||||||
| Payroll | $40,139 | $40,139 | $40,139 | $40,139 | $40,139 | $40,139 | $40,139 | $40,139 | $40,139 | $40,139 | $40,139 | $40,139 | |
| Sales and Marketing and Other Expenses | $18,400 | $18,400 | $18,400 | $18,400 | $18,400 | $18,400 | $18,400 | $18,400 | $18,400 | $18,400 | $18,400 | $18,400 | |
| Depreciation | $2,500 | $2,500 | $2,500 | $2,500 | $2,500 | $2,500 | $2,500 | $2,500 | $2,500 | $2,500 | $2,500 | $2,500 | |
| Leased Equipment | $4,150 | $4,150 | $4,150 | $4,150 | $4,150 | $4,150 | $4,150 | $4,150 | $4,150 | $4,150 | $4,150 | $4,150 | |
| Utilities | $4,100 | $4,100 | $4,100 | $4,100 | $4,100 | $4,100 | $4,100 | $4,100 | $4,100 | $4,100 | $4,100 | $4,100 | |
| Insurance | $7,650 | $7,650 | $7,650 | $7,650 | $7,650 | $7,650 | $7,650 | $7,650 | $7,650 | $7,650 | $7,650 | $7,650 | |
| Rent | $2,000 | $2,000 | $2,000 | $2,000 | $2,000 | $2,000 | $2,000 | $2,000 | $2,000 | $2,000 | $2,000 | $2,000 | |
| Payroll Taxes | 15% | $6,021 | $6,021 | $6,021 | $6,021 | $6,021 | $6,021 | $6,021 | $6,021 | $6,021 | $6,021 | $6,021 | $6,021 |
| Other | $0 | $0 | $0 | $0 | $0 | $0 | $0 | $0 | $0 | $0 | $0 | $0 | |
| Total Operating Expenses | $84,960 | $84,960 | $84,960 | $84,960 | $84,960 | $84,960 | $84,960 | $84,960 | $84,960 | $84,960 | $84,960 | $84,960 | |
| Profit Before Interest and Taxes | $93,344 | $93,344 | $93,344 | $93,344 | $93,344 | $93,344 | $93,344 | $93,344 | $93,344 | $93,344 | $93,344 | $93,344 | |
| EBITDA | $95,844 | $95,844 | $95,844 | $95,844 | $95,844 | $95,844 | $95,844 | $95,844 | $95,844 | $95,844 | $95,844 | $95,844 | |
| Interest Expense | $20,642 | $20,451 | $20,260 | $20,069 | $19,878 | $19,688 | $19,497 | $19,306 | $19,115 | $18,924 | $18,733 | $18,542 | |
| Taxes Incurred | $21,810 | $18,223 | $18,271 | $18,319 | $18,366 | $18,414 | $18,462 | $18,510 | $18,557 | $18,605 | $18,653 | $18,701 | |
| Net Profit | $50,891 | $54,669 | $54,813 | $54,956 | $55,099 | $55,242 | $55,385 | $55,529 | $55,672 | $55,815 | $55,958 | $56,102 | |
| Net Profit/Sales | 7.44% | 8.00% | 8.02% | 8.04% | 8.06% | 8.08% | 8.10% | 8.12% | 8.14% | 8.16% | 8.19% | 8.21% | |
| Pro Forma Cash Flow | |||||||||||||
| Month 1 | Month 2 | Month 3 | Month 4 | Month 5 | Month 6 | Month 7 | Month 8 | Month 9 | Month 10 | Month 11 | Month 12 | ||
| Cash Received | |||||||||||||
| Cash from Operations | |||||||||||||
| Cash Sales | $683,600 | $683,600 | $683,600 | $683,600 | $683,600 | $683,600 | $683,600 | $683,600 | $683,600 | $683,600 | $683,600 | $683,600 | |
| Subtotal Cash from Operations | $683,600 | $683,600 | $683,600 | $683,600 | $683,600 | $683,600 | $683,600 | $683,600 | $683,600 | $683,600 | $683,600 | $683,600 | |
| Additional Cash Received | |||||||||||||
| Sales Tax, VAT, HST/GST Received | 0.00% | $0 | $0 | $0 | $0 | $0 | $0 | $0 | $0 | $0 | $0 | $0 | $0 |
| New Current Borrowing | $0 | $0 | $0 | $0 | $0 | $0 | $0 | $0 | $0 | $0 | $0 | $0 | |
| New Other Liabilities (interest-free) | $0 | $0 | $0 | $0 | $0 | $0 | $0 | $0 | $0 | $0 | $0 | $0 | |
| New Long-term Liabilities | $0 | $0 | $0 | $0 | $0 | $0 | $0 | $0 | $0 | $0 | $0 | $0 | |
| Sales of Other Current Assets | $0 | $0 | $0 | $0 | $0 | $0 | $0 | $0 | $0 | $0 | $0 | $0 | |
| Sales of Long-term Assets | $0 | $0 | $0 | $0 | $0 | $0 | $0 | $0 | $0 | $0 | $0 | $0 | |
| New Investment Received | $0 | $0 | $0 | $0 | $0 | $0 | $0 | $0 | $0 | $0 | $0 | $0 | |
| Subtotal Cash Received | $683,600 | $683,600 | $683,600 | $683,600 | $683,600 | $683,600 | $683,600 | $683,600 | $683,600 | $683,600 | $683,600 | $683,600 | |
| Expenditures | Month 1 | Month 2 | Month 3 | Month 4 | Month 5 | Month 6 | Month 7 | Month 8 | Month 9 | Month 10 | Month 11 | Month 12 | |
| Expenditures from Operations | |||||||||||||
| Cash Spending | $40,139 | $40,139 | $40,139 | $40,139 | $40,139 | $40,139 | $40,139 | $40,139 | $40,139 | $40,139 | $40,139 | $40,139 | |
| Bill Payments | $36,030 | $1,064,409 | $586,287 | $586,144 | $586,000 | $585,857 | $585,714 | $585,571 | $585,427 | $585,284 | $585,141 | $584,998 | |
| Subtotal Spent on Operations | $76,169 | $1,104,548 | $626,426 | $626,283 | $626,140 | $625,996 | $625,853 | $625,710 | $625,567 | $625,424 | $625,280 | $625,137 | |
| Additional Cash Spent | |||||||||||||
| Sales Tax, VAT, HST/GST Paid Out | $0 | $0 | $0 | $0 | $0 | $0 | $0 | $0 | $0 | $0 | $0 | $0 | |
| Principal Repayment of Current Borrowing | $0 | $0 | $0 | $0 | $0 | $0 | $0 | $0 | $0 | $0 | $0 | $0 | |
| Other Liabilities Principal Repayment | $0 | $0 | $0 | $0 | $0 | $0 | $0 | $0 | $0 | $0 | $0 | $0 | |
| Long-term Liabilities Principal Repayment | $22,917 | $22,917 | $22,917 | $22,917 | $22,917 | $22,917 | $22,917 | $22,917 | $22,917 | $22,917 | $22,917 | $22,917 | |
| Purchase Other Current Assets | $0 | $0 | $0 | $0 | $0 | $0 | $0 | $0 | $0 | $0 | $0 | $0 | |
| Purchase Long-term Assets | $0 | $0 | $0 | $0 | $0 | $0 | $0 | $0 | $0 | $0 | $0 | $0 | |
| Dividends | $0 | $0 | $0 | $0 | $0 | $0 | $0 | $0 | $0 | $0 | $0 | $0 | |
| Subtotal Cash Spent | $99,086 | $1,127,465 | $649,343 | $649,200 | $649,056 | $648,913 | $648,770 | $648,627 | $648,483 | $648,340 | $648,197 | $648,054 | |
| Net Cash Flow | $584,514 | ($443,865) | $34,257 | $34,401 | $34,544 | $34,687 | $34,830 | $34,974 | $35,117 | $35,260 | $35,403 | $35,546 | |
| Cash Balance | $834,514 | $390,650 | $424,907 | $459,308 | $493,852 | $528,539 | $563,369 | $598,343 | $633,459 | $668,719 | $704,123 | $739,669 | |
| Pro Forma Balance Sheet | |||||||||||||
| Month 1 | Month 2 | Month 3 | Month 4 | Month 5 | Month 6 | Month 7 | Month 8 | Month 9 | Month 10 | Month 11 | Month 12 | ||
| Assets | Starting Balances | ||||||||||||
| Current Assets | |||||||||||||
| Cash | $250,000 | $834,514 | $390,650 | $424,907 | $459,308 | $493,852 | $528,539 | $563,369 | $598,343 | $633,459 | $668,719 | $704,123 | $739,669 |
| Inventory | $65,000 | $555,826 | $555,826 | $555,826 | $555,826 | $555,826 | $555,826 | $555,826 | $555,826 | $555,826 | $555,826 | $555,826 | $555,826 |
| Other Current Assets | $50,000 | $50,000 | $50,000 | $50,000 | $50,000 | $50,000 | $50,000 | $50,000 | $50,000 | $50,000 | $50,000 | $50,000 | $50,000 |
| Total Current Assets | $365,000 | $1,440,340 | $996,476 | $1,030,733 | $1,065,134 | $1,099,677 | $1,134,365 | $1,169,195 | $1,204,168 | $1,239,285 | $1,274,545 | $1,309,948 | $1,345,495 |
| Long-term Assets | |||||||||||||
| Long-term Assets | $1,600,000 | $1,600,000 | $1,600,000 | $1,600,000 | $1,600,000 | $1,600,000 | $1,600,000 | $1,600,000 | $1,600,000 | $1,600,000 | $1,600,000 | $1,600,000 | $1,600,000 |
| Accumulated Depreciation | $0 | $2,500 | $5,000 | $7,500 | $10,000 | $12,500 | $15,000 | $17,500 | $20,000 | $22,500 | $25,000 | $27,500 | $30,000 |
| Total Long-term Assets | $1,600,000 | $1,597,500 | $1,595,000 | $1,592,500 | $1,590,000 | $1,587,500 | $1,585,000 | $1,582,500 | $1,580,000 | $1,577,500 | $1,575,000 | $1,572,500 | $1,570,000 |
| Total Assets | $1,965,000 | $3,037,840 | $2,591,476 | $2,623,233 | $2,655,134 | $2,687,177 | $2,719,365 | $2,751,695 | $2,784,168 | $2,816,785 | $2,849,545 | $2,882,448 | $2,915,495 |
| Liabilities and Capital | Month 1 | Month 2 | Month 3 | Month 4 | Month 5 | Month 6 | Month 7 | Month 8 | Month 9 | Month 10 | Month 11 | Month 12 | |
| Current Liabilities | |||||||||||||
| Accounts Payable | $0 | $1,044,866 | $566,749 | $566,610 | $566,472 | $566,333 | $566,195 | $566,056 | $565,918 | $565,779 | $565,641 | $565,502 | $565,364 |
| Current Borrowing | $0 | $0 | $0 | $0 | $0 | $0 | $0 | $0 | $0 | $0 | $0 | $0 | $0 |
| Other Current Liabilities | $0 | $0 | $0 | $0 | $0 | $0 | $0 | $0 | $0 | $0 | $0 | $0 | $0 |
| Subtotal Current Liabilities | $0 | $1,044,866 | $566,749 | $566,610 | $566,472 | $566,333 | $566,195 | $566,056 | $565,918 | $565,779 | $565,641 | $565,502 | $565,364 |
| Long-term Liabilities | $2,500,000 | $2,477,083 | $2,454,167 | $2,431,250 | $2,408,333 | $2,385,417 | $2,362,500 | $2,339,583 | $2,316,667 | $2,293,750 | $2,270,833 | $2,247,917 | $2,225,000 |
| Total Liabilities | $2,500,000 | $3,521,949 | $3,020,915 | $2,997,860 | $2,974,805 | $2,951,750 | $2,928,695 | $2,905,640 | $2,882,585 | $2,859,529 | $2,836,474 | $2,813,419 | $2,790,364 |
| Paid-in Capital | $250,000 | $250,000 | $250,000 | $250,000 | $250,000 | $250,000 | $250,000 | $250,000 | $250,000 | $250,000 | $250,000 | $250,000 | $250,000 |
| Retained Earnings | ($785,000) | ($785,000) | ($785,000) | ($785,000) | ($785,000) | ($785,000) | ($785,000) | ($785,000) | ($785,000) | ($785,000) | ($785,000) | ($785,000) | ($785,000) |
| Earnings | $0 | $50,891 | $105,560 | $160,373 | $215,329 | $270,428 | $325,670 | $381,055 | $436,584 | $492,256 | $548,071 | $604,029 | $660,131 |
| Total Capital | ($535,000) | ($484,109) | ($429,440) | ($374,627) | ($319,671) | ($264,572) | ($209,330) | ($153,945) | ($98,416) | ($42,744) | $13,071 | $69,029 | $125,131 |
| Total Liabilities and Capital | $1,965,000 | $3,037,840 | $2,591,476 | $2,623,233 | $2,655,134 | $2,687,177 | $2,719,365 | $2,751,695 | $2,784,168 | $2,816,785 | $2,849,545 | $2,882,448 | $2,915,495 |
| Net Worth | ($535,000) | ($484,109) | ($429,440) | ($374,627) | ($319,671) | ($264,572) | ($209,330) | ($153,945) | ($98,416) | ($42,744) | $13,071 | $69,029 | $125,131 |


