
Panache Travel Group
Executive Summary
Panache Travel Group (PTG) is a company which specializes in small, escorted luxury tour packages for discriminating clients. It will operate from two bases to better serve customers across the country: one in Salt Lake City, Utah; the other in New York, New York. The founders and employees of Panache Travel Group are experienced travelers and travel professionals who are knowledgeable, capable and passionate about the services Panache Travel Group will promote and offer.
Within the growing travel industry, PTG will focus on the niche market of luxury travel. Its primary clients are individuals, couples and affinity groups of high-net-worth who travel for leisure at least once per year. Seeking the ultimate travel experience, the target clients demand the finest quality activities and accommodations accompanied by a superior level of service. PTG will have a competitive advantage over others in this market by providing smaller, more exclusive package tours enabling the clients of these intimate groups to receive personal attention from the travel hosts. PTG will cultivate this niche with one-to-one contact with potential clients; personal contact with sophisticated travel agencies whose primary clientele targets our market; broad out-reach programs through various media; special events; and an inter-active, full-service website. We have all aspects of travel technology available to us through Panache Services. The founders and personnel of PTG have experience of their own with travel, luxury retailing, personal services to high-net-worth individuals, history of travel destinations and local languages.
To broaden market share and increase brand recognition, the luxury tour packages initially will be offered at slightly below market rate. As a result, short-term operating profit margins are projected to be in low to mid range. When PTG has established a loyal core clientele and increased brand recognition, allowing the company to increase the price of the tour packages to the market rate, operating profit margin is anticipated to rise.

1.1 Objectives
1. Achieve hefty sales in Year 1, followed by astounding increases in Year 2 and Year 3, with corresponding increases in profitability.
2. Develop the Panache Travel Group brand to facilitate customer retention, maintain mind-share of Panache resellers and increase pricing power.
3. Establish and maintain strategic alliances with service providers nationally, internationally, and with travel professionals to create additional PTG sales channels.
4. Produce the highest levels of client satisfaction in the industry.
1.2 Mission
The mission of Panache Travel Group is to provide unique, luxury tours and travel experiences, for a niche market of discriminating clients, which results in their satisfaction, evidenced by repeat bookings as well as favorable word-of-mouth comments. PTG seeks to distinguish itself as a specialist in the field of luxury travel and to be recognized for offering exceptional service and anticipating the needs and desires of its clients. An efficiently run operation, handled by smart individuals, will enable not only those who receive service, but those who give it, to enjoy the experience and the product, and for everyone to be pleased with the professional, first-class service of PTG.
1.3 Keys to Success
- Segment and target luxury travelers within the larger travel market.
- Position and promote Panache Travel Group as specialists in the luxury travel segment of the travel industry.
- Communicate the unique aspects and quality of PTG offerings through personal interaction, media and other branding activities.
- Develop repeat business from a base of loyal, satisfied customers.
Company Summary
Panache Travel Group (PTG) will be the parent company of Panache Journeys and Panache Services.
- Panache Journeys is a luxury tour company which specializes in providing the ultimate in fully-arranged, small, private tours (escorted).
- Panache Services is a general, full-services travel provider able to meet the basic needs of both the corporate as well as the leisure travel markets. These services include arranging air, land transportation, cruise and hotel bookings, as well as consulting and custom travel arrangements. Panache Services specializes in FITs, or Free and Independent Tours (unescorted).
2.1 Company Ownership
Panache Travel Group will form as a private, Limited Liability Corporation (LLC) organized in the State of Utah by its principal founders (see below). Alternative legal corporate structures may be used once principal investors have been located and investment funding has been secured. Company stock will be apportioned as follows:
- 55% Panache Travel Group founders’ ownership:
- George Raymond 25%;
- Dominque Pascal 15%;
- Alica Marques 15%
- 25% Investor(s) ownership.
- 20% Future employees’ pool ownership.
2.2 Start-up Summary
The initial start-up capital requirement for Panache Travel Group will be used to:
- Purchase the assets and liabilities of Panache European Journeys and Barkley Roberts Travel.
- Finance start-up costs and payroll expenses for the first 12-months of operation, i.e.
- Legal fees related to new filings in the state of Utah.
- Expenses related to rent, office supplies, insurance, utilities, etc.
- Salaries for key managers and personnel.
- Miscellaneous costs involved in formulation and execution of strategic plan.
Initial venture capital or individual investment, to be obtained by mid-Year 1.

| Start-up | |
| Requirements | |
| Start-up Expenses | |
| Legal | $500 |
| Stationery etc. | $600 |
| Brochures | $0 |
| Consultants | $0 |
| Insurance | $0 |
| Rent | $0 |
| Research and Development | $0 |
| Expensed Equipment | $0 |
| Other | $0 |
| Total Start-up Expenses | $1,100 |
| Start-up Assets | |
| Cash Required | $100,000 |
| Other Current Assets | $0 |
| Long-term Assets | $0 |
| Total Assets | $100,000 |
| Total Requirements | $101,100 |
| Start-up Funding | |
| Start-up Expenses to Fund | $1,100 |
| Start-up Assets to Fund | $100,000 |
| Total Funding Required | $101,100 |
| Assets | |
| Non-cash Assets from Start-up | $0 |
| Cash Requirements from Start-up | $100,000 |
| Additional Cash Raised | $0 |
| Cash Balance on Starting Date | $100,000 |
| Total Assets | $100,000 |
| Liabilities and Capital | |
| Liabilities | |
| Current Borrowing | $1,100 |
| Long-term Liabilities | $0 |
| Accounts Payable (Outstanding Bills) | $0 |
| Other Current Liabilities (interest-free) | $0 |
| Total Liabilities | $1,100 |
| Capital | |
| Planned Investment | |
| Investor 1 | $100,000 |
| Investor 2 | $0 |
| Other | $0 |
| Additional Investment Requirement | $0 |
| Total Planned Investment | $100,000 |
| Loss at Start-up (Start-up Expenses) | ($1,100) |
| Total Capital | $98,900 |
| Total Capital and Liabilities | $100,000 |
| Total Funding | $101,100 |
2.3 Company Locations and Facilities
Panache Travel Group has two locations from which it will conduct business:
- The main office address is 129 Market Street, Suite 600, Salt Lake City, Utah 84103. This is a commercial building that can accommodate walk-in customers.
- The East Coast office address is 150 Broadway, Suite 1200, New York, New York 10019.
The offices in both locations are fully-equipped and staffed.
Services
The mission of Panache Travel Group is service and luxury for discerning travelers. An observation well-known in the travel and hospitality industry is that achieving a reputation for excellence relies on word of mouth. We want the Panache brand to be synonymous with service and luxury. When the conversation turns to travel, we want our clients to say, “I travel with Panache!”
For the current year, 2001, Panache Journeys has planned and described twelve escorted tours:
- French Portfolio (French Riviera/ Provence)
- Historic France (Paris/ Loire Valley/ Normandy)
- Cosmopolitan Europe (Amsterdam/ Paris/ London)
- Timeless Italy (Italian Riviera/ Tuscany)
- Italian Glory (Rome/ Florence/ Venice)
- Portuguese Discovery (Estoril Coast/ Lisbon/ Algarve)
- Escape to Morocco (Fez/ Casablanca/ Marrakesh)
- Alpine Luxury (Austria/ Germany)
- Heart of Europe (Germany/ Czech Republic/ Austria)
- Orient Express (Venice/ Paris/ London)
- Panache Explorer-Burma
- Panache Explorer-Iran
To handle the myriad details involved, we will rely on the technology afforded by Panache Services, the World Wide Web and the focused attention of our founders and staff who will make all plans and arrangements.
3.1 Service Description
Panache Journeys provides luxury escorted travel packages. Pre-trip services include assistance with arranging airfare, trip insurance, passports, as well as making suggestions regarding packing, etc. Carefully planned itineraries, superior accommodations, lodgings, food and entertainment opportunities are communicated before the trip. Contacts are lined-up, should medical, diplomatic or financial emergencies arise. To familiarize clients with the locales they’ll be visiting, a fine guidebook will be mailed to each client several weeks before the beginning of each Journey.

Well-known luxury hotels engaged for these journeys include, to name just a few: The Splendido, in Portofino; The Carlton, in Cannes; The Ritz in London; and The Gritti Palace in Venice. Arrangements for notable dining experiences of equal caliber have been made in Michelin two-and-three-star restaurants.
Local subject experts have been engaged to impart their invaluable knowledge and perspective to our clients. For example, the services of Professore Marco di Navo, native Venetian, author of Venice, retired professor of art history, University of Padova, and a former head of the Venetian Tour Guide association have been reserved to give everyone new eyes with which to see the glories of Venice.
Of equal importance to everything mentioned above are the Panache hosts who accompany each Journey. Each is excellent and is prepared to give the utmost personal attention to clients on the road. Each host has a broad background of knowledge, experience and the all-important quality of a sense of humor. Each host understands the luxury field is unique unto itself; each client is unique, and the care, feeding and transporting of this demanding clientele requires him to be ever-ready to serve.
The goal of everyone at Panache Journeys is not only to meet the travel needs of its clients: it is to anticipate them. We want our service to be exceptional, not simply friendly. Panache Services provides complementary travel services for Panache Journeys clients, as well as corporate and general leisure travelers. In addition, unescorted FITs, or Free and Independent Tours, are happily arranged for clients for whom a Panache Journey is not quite right.
3.2 Competitive Comparison
Panache Journeys has addressed these issues by positioning itself as a luxury travel company, offering exceptionally small groups (none larger than ten) and delivering an exceptionally high level of service. It understands that these aspects are highly valued, cannot be discounted, reduced or otherwise cheapened. Panache Journeys has not identified a direct competitor in this particular niche of the luxury travel market when aspects of service, group size, quality of accommodations and quantity of personal attention are included. Other luxury tour operators will be discussed under a separate topic in the market analysis and analyzed with a comparison of strengths and weaknesses.
3.3 Sales Literature
A handsome, full-color brochure describes the Panache Journeys, which includes prices and terms. They were printed by The Printing of Salt Lake City and will be mailed to potential customers upon request. Additional brochures will be used in direct mail campaigns and as sales promotional material. Panache Travel Group will maintain, and regularly add to, its database of previous customers/contacts/potential clients information. Notes, additions and revisions will be made on a continuous basis. The website of PTG at www.panachetravelgroup.com gives information about Panache, its hosts, journeys offered with dates, prices, terms and booking information. An e-mail address is given for a Panache Journeys representative to respond to inquiries from prospective travelers. The site is adequate for the 2001 season, but will be thoroughly redesigned and developed for the 2002 season. Money has been allocated in the 2002 marketing budget for this project by an expert, outside firm.
3.4 Fulfillment
The key fulfillment and delivery will be provided by the acquisition of both Panache European Journeys and Barkley Roberts Travel. The core value of these companies is professional expertise, achieved through the combination of travel experience, hard work and educational background.
Panache European Journeys established relationships with providers of travel-related products and services. Extensive market research enabled them to identify and create working relationships with numerous service providers around the world. Panache European Journeys identified opportunities to capture markets with great growth potential. They continually sought and evaluated new sources. Panache European Journeys took advantage of trade shows, travel industry personnel and publications and other sources of industry-related information as it monitored the quality of its offering. They have a history of three successful years providing tours, virtually identical, to those which will be offered by Panache Travel Group.
Barkley Roberts Travel is a full service travel agency. It is a member of the Airline Reporting Corporation (ARC), International Airlines Travel Agent Network (IATAN), Association of Travel Agencies (ASTA), along with many other groups and trade associations. It is also a member of www.vacation.com that is one of the largest consortium for obtaining additional commission and discounts prices on airline, hotel room, rental car and cruise line bookings. In addition, Barkley Roberts Travel has a large client base of both corporate and leisure clients, many of whom travelled with Panache European Journeys. Barkley Roberts Travel is staffed with two full-time certified travel professionals.
The bi-coastal offices staffed with the knowledgeable founders and personnel of PTG will facilitate attracting clients both to and within the luxury travel market though one-on-one meetings with potential clients, personal contact with sophisticated travel agencies which target up-scale consumers, and broad out-reach programs including travel conferences and media and special events.
3.5 Technology
Panache Travel Group will rely on the Computerized Reservation System (CRS) of Barkley Roberts Travel. Barkley Roberts Travel is currently under contract to WorldSpan, a leader in the CRS world. The CRS enables travel agents to identify what the customer is looking for and to make that information available quickly. It increases the speed and efficiency with which PTG can communicate with suppliers. In addition, the CRS simplifies customer data storage and retrieval. PTG will make use of the latest computer technology and the Internet for market research, communications, data storage and sales. PTG will also create working agreements with other travel agencies in the Salt Lake City and New York areas that will enhance its technological abilities and its financial profitability.
3.6 Future Services
Panache Travel Group will increase the geographical areas of the world in which it offers tours. In addition, as the luxury travel market expands, PTG may develop business in additional segments of the luxury travel market, i.e. tours with an architectural, music festival, golf or local festival emphasis. PTG is researching the market to identify potential opportunities for future sales. The long-term goal of PTG is to establish itself as an internationally recognized provider of top-of-the-line luxury travel. This goal does not prohibit PTG from participating in additional areas of the travel industry. It does, however, provide a corporate focus and a differentiated offering.
Market Analysis Summary
Panache Travel Group will focus its initial efforts in obtaining clients in the United States interested in the luxury travel market. Travel and tourism is the nation’s largest services export industry. U.S. resident travelers spent $81.4 billion on travel to foreign countries in 1999. The travel & tourism industry is expected to account for 5.1% of the U.S. Gross Domestic Production (GNP) in 2000. The World Economic Forecast Association (WEFA) forecasts travel & tourism to grow by 4.1% a year between 2000 and 2005 in terms of real spending.
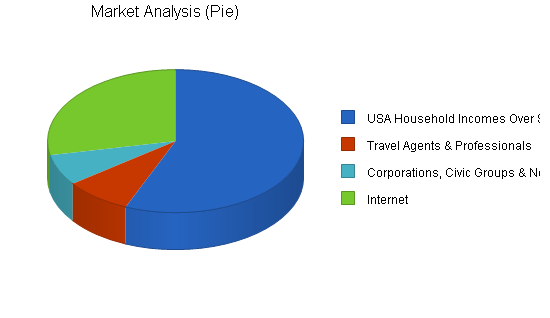
4.1 Market Segmentation
The target customers of Panache Travel Group are couples and individuals, with median household incomes in excess of $100,000 between the ages of 40-70 years of age. These people are interested in adventure, history, gastronomy, travel culture and unique travel experiences. Target groups are as follows:
- Householders with incomes of $100,000 and over.
- Travel agents and professionals with an established client base, particularly in the luxury market.
- Corporations, civic groups and nonprofit organizations, interested in incentives, retreats, field trips and fund raisers.
- Internet users seeking sites related to luxury travel.
| Market Analysis | |||||||
| Year 1 | Year 2 | Year 3 | Year 4 | Year 5 | |||
| Potential Customers | Growth | CAGR | |||||
| USA Household Incomes Over $100K | 6% | 2,000,000 | 2,120,000 | 2,247,200 | 2,382,032 | 2,524,954 | 6.00% |
| Travel Agents & Professionals | 4% | 300,000 | 312,000 | 324,480 | 337,459 | 350,957 | 4.00% |
| Corporations, Civic Groups & Non-profit Organizations | 4% | 250,000 | 260,000 | 270,400 | 281,216 | 292,465 | 4.00% |
| Internet | 5% | 1,000,000 | 1,050,000 | 1,102,500 | 1,157,625 | 1,215,506 | 5.00% |
| Total | 5.42% | 3,550,000 | 3,742,000 | 3,944,580 | 4,158,332 | 4,383,882 | 5.42% |
4.2 Target Market Segment Strategy
Panache Travel Group is located in Salt Lake City and the New York City area. It will target and develop relationships with satisfied clients who have traveled with the PTG with the idea of capitalizing on their satisfaction by encouraging favorable word-of-mouth comments to their friends and acquaintances. It will place a great emphasis on targeting key travel agents/professionals, i.e. Virtuosi agents, who have established, luxury client bases. Luxury trade shows, informational meetings, and contact of clients from elite agencies will also be used to identify markets and clients.
4.2.1 Market Growth
The travel industry is growing. Reasons for this growth include a healthy domestic economy and the devaluation of currency in other parts of the world which has made travel less expensive for U.S. residents. Leisure travel has increased each year since 1990 and luxury travel, which is growing at an estimate 5% annually, is one of the fastest growing segments of the travel industry. Additionally, there has been a dramatic increase in corporate participation in the luxury travel market in the form of incentives and retreats.
4.2.2 Market Needs
Many potential customers have questions related to numerous aspects of foreign travel. Experience travelers and travel professionals have invaluable knowledge about destinations, accommodations, prices and the myriad questions that arise. General customers look to the travel professional to provide them with sound advice on these matters.
However, luxury travelers look to and depend on the travel professional to an even greater extent for an even greater number of things. Simply stated, they want someone to help them with everything: “Please take care of it all!” Panache Travel Group is confident in its ability to do just that. PTG saves the client time and money through their knowledge and travel experience, and ensures that clients are worry-free and completely satisfied.
4.3 Service Business Analysis
The U.S. travel and tourism industry is the nation’s third largest retail industry, and according to the U.S. Department of Commerce, indicators suggest it will be the leading industry in 2001. Revenues from travel have increased approximately 100% in the last decade. U.S. travel agencies produce over $100 billion in revenues each year.
The travel market is separated into two categories: business and leisure. Each contributes about 45% to total revenues. The remaining 10% of the revenue is generated from combined business/leisure trips. The market is further separated into domestic and international travel. Leisure travelers are classified according to the type of trip taken, income and/or age.
The leisure travelers are divided into the following groups (not being mutually exclusive):
- Those focused on adventure, special-interest, rest and relaxation, honeymoons and/or sightseeing.
- High-income.
- Budget-conscious.
- Families, students, groups with mutual affinity and seniors.
Lifestyle, age, and disposable income influence the decision to travel and the type of travel. Luxury travelers make purchase decisions based upon their desire to combine many interests with vacation time. Panache Travel Group will emphasize high-income travelers particularly interested in special-interest, rest and relaxation, honeymoons and sightseeing trips who may be families, groups with a mutual interest and/or seniors. When combined they form a very significant, lucrative market from which to draw potential clients.
4.3.1 Competition and Buying Patterns
There are many activities and types of travel available to people contemplating a luxury vacation. Moreover, potential customers do not have to vacation: they may elect to spend the discretionary portion of their budget in any number of ways, or invest the money they would otherwise have spent on a vacation.
However, if they are disposed to a luxury vacation, direct competition for Panache Services can come from virtually any agency. That being said, however, these same agencies can be direct sales agents of Panache Journeys. They are valued and are to be sought out. The average luxury traveler engages in one grand travel vacation every twelve months.
4.3.2 Main Competitors
As mentioned above there are competitors for Panache Services, but the market of potential clients is truly vast. On the other hand, Panache Journeys has found a very nice niche with limited direct competition.
Several luxury tour companies compete directly with Panache Journeys for the luxury travel dollar. Three competitors are listed below with their strengths and weakness:
- Abercrombie & Kent: Based in Oak Brook, Illinois, is the most well-known and largest luxury tour company in the world. They have been providing luxury travel packages for over 40 years. They have the advantage of an established reputation, economies of scale, and strategic alliances. However, their packages are over-priced, and their group size is larger than 24 people per trip as opposed to 10, the maximum for Panache Journeys.
- Travacoa: Based in Newport Beach, California, is the second leading luxury tour operator in the United States. Again they have advantages of size and length of operation. However, their tours lack imagination, have large group size, 24, and we have been told by our clients who have experienced both Travacoa and Abercrombie & Kent, that Panache Journeys was by far their best traveling experience. They cited hotels, meals, group size, and guides among their reasons for preferring the Panache Journeys traveling experience.
- Butterfield & Robinson: Based in Toronto, Canada, is an excellent travel company specializing in walking and biking tours throughout the world. They offer a superior product to an up-scale clientele. We, quite frankly, have adapted some of their business practices. But our target group does not want to walk from place to place.
4.3.3 Business Participants
The travel industry is similar to other industries inasmuch as it has large national chains, small home-based businesses, consolidators on the Internet, etc. Membership numbers in some of the travel-related associations give some indication of the number of participants in this market. The American Society of Travel Agents (ASTA) reports 25,000 members in 135 countries, most of whom are small businesses. The Association of Retail Travel Agencies (ARTA) has another 3,000 members. In addition, many agencies are not affiliated with these associations but rather with one or more of the approximately 35 other travel industry organizations in the country.
Strategy and Implementation Summary
In order to reach its goal of becoming one of the premiere luxury tour operators and travel planners, Panache Travel Group will adopt the following strategy:
- Establish the reputation of PTG as a differentiated, specialty provider of luxury travel. This will be accomplished through a diverse marketing communications program directed at the target market of PTG utilizing various media.
- Provide unparalleled service to clients in order to gain repeat business and referrals. This will include providing superior service in all phases of the Panache experience, including timely follow-through.
- Aggressively promote the Panache brand of luxury travel and, in particular, small group travel through Panache Journeys which will be promoted as “the ultimate in luxurious small group travel.”
5.1 Value Proposition
The value proposition of Panache Travel Group comes from the personal knowledge and love of travel of its founders and employees. They are confident of their ability to meet the needs of their customers because they share the enthusiasm of the clients for the travel experience they offer. Their confidence and ability translates into confidence for the client. It is basis for developing a long-term, trusting relationship.
5.2 Competitive Edge
The competitive edge of Panache Travel Group is its focus, passion, experience, and in its superior product with Panache Journeys. PTG provides a differentiated offering with creative management and commitment.
5.3 Sales Strategy
Panache Travel Group will sell the benefits of the services it promotes and the luxury tours it offers. PTG will provide clients with all the arrangements which they can foresee, as well as many they would not have contemplated. Our concern is not to maximize profits on any individual sale, but to satisfy the client. We are confident that doing so will reduce costs and increase profits in the long run. It is less expensive to maintain a relationship than it is to create a new one. At PTG, we believe in the value of the travel we sell and we are confident that we can satisfy the seasoned traveler and the newcomer as well. Sales projections are detailed in the Yearly Sales chart accompanying the Sales Forecast topic and table.
5.3.1 Sales Programs
Sales programs will include sales awards for the highest grossing sales representative and customer service awards for those employees who best exemplify Panache Travel Group’s commitment to clients. On-site sales, telephone sales, on-line sales, off-site sales and third-party sales will all be closely correlated with marketing promotions. Aspects of the sales processes, which may include training, cold-calling, leads, productivity, order-fulfillment, measurable and attainable goal-setting and follow-up efforts, will all be evaluated and clearly described.
5.3.2 Sales Forecast
Detailed projections are located in the sales chart and table below. Panache Travel Group expects sales to double in the first three years of operation. We believe this is a conservative estimate, given the nature of the vast market of potential clients and the market niche of Panache Journeys.


| Sales Forecast | |||
| Year 1 | Year 2 | Year 3 | |
| Sales | |||
| Journeys | $310,000 | $900,000 | $2,700,000 |
| Services | $190,000 | $600,000 | $1,800,000 |
| Total Sales | $500,000 | $1,500,000 | $4,500,000 |
| Direct Cost of Sales | Year 1 | Year 2 | Year 3 |
| Journeys | $202,800 | $688,500 | $2,025,000 |
| Services | $144,000 | $534,000 | $1,584,000 |
| Subtotal Direct Cost of Sales | $346,800 | $1,222,500 | $3,609,000 |
5.4 Marketing Strategy
Panache Travel Group adheres to the theory that the goal of business is to create and keep customers. Its marketing strategy will reflect this goal as it builds its reputation to clients throughout the United States.
5.4.1 Marketing Programs
Direct marketing methods may include the following:
- Advertising Specialties. Items, specifically, cotton T-shirts printed with Panache Journeys & (destination), to be given to Panache Travel Group clients.
- E-Mail Mailings. Regular or infrequent mailings to lists with updated information and special offers.
- Direct Mail. Brochures, newsletters.
- Sampling: Occasionally a discounted journey may be offered as a “trade-in-kind” to a visible and vocal trend-setter who is otherwise unable to afford a Panache Journey. Clear expectations would be established for what we would receive in exchange.
Informal Marketing/Networking. Activities such as joining organizations, public speaking, or attending conferences will be explored. For example, an invitation has been extended to one of the founders of PTG for membership in the “DOM professionals,” club a charitable organization for women engaged in the sale and or promotion of passenger transportation and travel in New York City. Its membership is a who’s who of the industry and is a valuable networking organization.
Customer-Based Marketing may include the following:
- Emphasizing repeat sales by clients who have taken one Panache Journey.
- Exploring add-on sales to increase the total revenue per client through the sale of extra products or services, such as additional, unescorted, trip planned through Panache Services which might follow a Panache Journey or a domestic trip, business or leisure.
- Add-on sales facilitated by links to our website.
- Strategic Partnerships may include cooperative advertising, distribution agreements and bundling.
- Special Offers and Promotions may include increased commissions or limited-time-only offers to PTG representatives or travel agents for seasonal promotions.
5.4.2 Positioning Statement
Our aim is directed at individuals, corporations, civics groups and charitable organizations who wish to participate in luxury travel, and towards travel agents who want to sell the finest small group luxury tours on the market.
5.4.3 Pricing Strategy
Much of the pricing of Panache Travel Group is determined by market standards. It will attempt to maintain modest margins on Panache Services and slightly higher margins on Panache Journeys. PTG will make every effort to maintain a competitive pricing policy and keep the price of Panache Journeys slightly below the price of other luxury tours for the first three years. However, as Panache Journeys builds its reputation as a premier small group luxury tour operator, it expects to earn the ability to charge comparable rates to other luxury tour companies.
5.4.4 Promotion Strategy
The image we are promoting:
“Panache:
from Late Latin (pinnaculum): small feather;
from Old Italian (pennachio): ornamental tuft of feathers, often on a helmet; a tassel;
from Middle French (pennache): flamboyantly or stylish confident manner.”
—Oxford English Dictionary
This is the meaning of PANACHE, and this is the message we want to promote!
We seek to project our company’s name, and subtleties of its meaning, to the luxury traveler!
The luxury traveler travels with Panache — therefore he/she has panache!
We aim to convey the myriad benefits the luxury client will receive by traveling with Panache!
A Panache client will have an experience evoked by these phrases:
- Top-of-the-line, top-drawer care-free leisure.
- Worry-free and problem-free, all-details-handled without hassle.
- Personally tailored, friendly expert guidance, seamless operations, attention to details.
- Pampered and “spoiled”, luxurious and permeated with stylish confidence.
- Irreplaceable memories, not astronomically priced.
Therefore, we have addressed the Five F’s a customer wants:
Function. Our service meets their concrete needs and desires.
Finances. Our prices are somewhat under market-rate.
Freedom. We make purchase very convenient, thereby freeing the client’s time and mind.
Feelings. We provide a service that makes the clients feel pleased with themselves for their acumen in selecting such a superior product.
Future. The service creates great satisfaction. The client’s only longing is for another Journey!
The brochures are sleekly elegant. The logo printed on business cards and stationery is sophisticated and unusual: acid green and black dramatically create attention and the elegance of the Romanesque Panache script is eye-catching. Our sales representatives and Panache hosts are experienced, knowledgeable, cosmopolitan, polished and poised. Our website reinforces these images and messages.
How our image and services will be promoted:
During the first year, Panache Travel Group will continue a relationship begun with the Guild of Ballet West, a professional, nonprofit ballet company located in Salt Lake City, in affiliation with the San Francisco Ballet Company, with a membership of 354. Two journeys will be offered as the grand prize for their annual fund-raising extravaganza given by the Guild in April 28, 2001. This will create buzz and publicity for Panache Journeys, build interest for others to join the prize-winners to travel together, and give back to the community in which PTG is based.
An East-coast based promotion will be participation in the fund-raising auction of educational, public television station WLIW, Channel 21, based on Long Island, New York. The auction will take place June 1-3, 2001. One journey will be auctioned. We will create a 30-second spot with WLIW’s production team. The spot will be aired ten times; print acknowledgement will be made in a Newsday newspaper ad; we’ll receive promotion on WLIW’s auction website and link access to our website; and we have an on-air guest auctioneer opportunity and live interview about Panache Journeys. WLIW has a viewership in New York, New Jersey and Connecticut of more than 1.9 million households weekly and we will be publicized before this vast audience.
PTG will continue calling on travel agencies, in person and by telephone, especially in areas identified as having high levels of income. A select, edited list has been prepared for us by a high-profiled, much-loved and respected, travel professional in New York City. Her stamp-of-approval, gained at the Las Vegas Luxury Travel Expo held in December 2000, has opened many doors. PTG will collaborate with up-scale travel agencies in joint promotions. For example, we will co-sponsor a select mailing in Pittsburgh to high-net-worth individuals who have been identified as interested in luxury travel.
PTG will co-host a kick-off cocktail party with an important agency as they launch their new website. One hundred top local CEO’s, clients of this agency, will be invited.
PTG is working with a Virginia agency and an important museum curator and lecturer to customize an itinerary emphasizing architectural aspects of European cities for interested museum members. PTG may develop an affiliation with the Great Books Program of the University of Chicago, initially in Westchester County, New York. Members have expressed an interest in having PTG tailor travel itineraries highlighting points of specific literary interest. An offer has been made to link our website with that of the Great Books program as well.
PTG will participate in national and regional trade shows. The next one on the calendar is the 2001 Alliance of Westchester Travel Agencies (AWTA) to be held in Tarrytown, New York, April 2, 2001. It draws more than 400 owners, corporate managers and travel agents from Westchester and Rockland counties in New York, Connecticut and other surrounding areas.
Two nationally important trade shows held annually are the Luxury Travel Expo (LTE) in Las Vegas and the Incentive Travel Marketing Expo (ITME) in Chicago. Both are worthwhile. We will attend and exhibit.
Our website will be a very important avenue for reaching prospective clients not reached in other ways. Casually speaking, “It’s a way to put more feet on the street!” It is also an ideal location to introduce tie-in products and services. For example, if we were to believe that a particular Tumi piece of luggage was ideal, we might seek an affiliation with them and create a link on our website. Additionally, if we created a reading list, we might profitably seek a tie-in with one of the on-line book sellers such as Amazon.com.
Another marketing program contemplated is the publication of a chatty newsletter, perhaps distributed quarterly. Its purpose would be to increase customer contact and serve as a vehicle for exemplifying our dedicated, personal attention. We could also highlight new Journeys, interesting travel tidbits, etc., etc. through this means.
Personal selling will also occur utilizing the extended networks of everyone affiliated with Panache Travel Group.
5.5 Strategic Alliances
Strategic alliances for promotions will be developed with travel agents, corporations, civic groups and non-profit organizations. Some of these alliances have been established by Panache Journeys and will continue and be expanded by Panache Travel Group.
Management Summary
The initial management team depends on the founders of Panache Travel Group and the current employees of Barkley Roberts Travel. George Raymond will act as General Manager. As PTG grows, a board of directors will be formed and additional employees will be added in support, sales, field and marketing.
6.1 Organizational Structure
Panache Travel Group will begin operations with 4 full-time positions and employ independent contractors where necessary for sales and field operations. It will use the service of the certified public accounting firm of Terry Price & Wunderli for payroll, taxes, and accounting. The positions are as follows.
General Manager, LC Partner and President: George Raymond
Marketing Director, LC Partner and Vice President: Dominque Pascal
Travel Director, LC Partner and Vice President: Alica Marques
Office Manager and 2nd Travel Agent: Suzy Brown
6.2 Management Team
General Manager and Development Director
George Raymond, 47, B.A. History, M.A. Comparative Literature, University of California, PhD.Comparative Literature, University of Utah. Seven years as Adjunct Professor of French and Comparative Literature at the University of Utah. A life-long world traveler and sophisticated bon vivant who speaks French fluently and can make himself understood in myriad other languages. So well-traveled there isn’t a silver/gold/platinum metal precious enough to indicate the millions of frequent-flyer air miles he has flown around the world.
Marketing and Sales Director
Dominque Pascal 48, B.S. History, English, Yale University. Twenty-five years of experience with Morgan Stanley & Co., Inc., Junior League of Westchester, and personal family offices of financiers Willam Dupont Jr., and marketing director of Deluxe World Tours. Mother of an 3 adult sons, an accomplished cook and an avid reader, she has lived in New York for over thirty years and led many lives.
Travel Director
Alica Marques, 39. Twenty years experience in the travel business, including two years as managing partner of Barkley Roberts Travel. With extensive travel experience she has first-hand knowledge of many locations. An expert on CRS and other travel-related computer applications, Alica has many contacts in the industry, knowledge of critical daily operations, and speaks Spanish.
Office Manager and Travel Agent
Suzy Brown, 26. Five years experience in travel, including her work as the current office manager of Barkley Roberts Travel. Not only familiar with the CRS system, she is a wizard with TRAMS, a back-office accounting program designed specifically for the travel business.
6.3 Personnel Plan
The personnel plan of Panache Travel Group depicts anticipated head count for the start-up year. The following table provides more detailed information. PTG anticipates the need to increase personnel in the first 2-3 years, but will need to significantly increase independent contractors for sales reps and tour guides, who will be paid on a commission basis.
*Positions marked with an asterisk, in addition to their base salaries, also receive commission from sales and hosting tours. The cost of paying these commissions is built into the cost of the sale.
| Personnel Plan | |||
| Year 1 | Year 2 | Year 3 | |
| President and Development Dir. * | $14,000 | $25,000 | $40,000 |
| Marketing & Advertising Dir. * | $14,000 | $20,000 | $35,000 |
| Office Manager * | $14,000 | $20,000 | $35,000 |
| Accounting | $3,500 | $9,000 | $12,000 |
| Travel Dir. * | $7,000 | $13,000 | $14,000 |
| Travel Agent | $0 | $0 | $0 |
| Sales Reps. | $0 | $0 | $0 |
| Tour Guides | $0 | $0 | $0 |
| Additional Office Support | $0 | $0 | $13,000 |
| Total People | 10 | 14 | 20 |
| Total Payroll | $52,500 | $87,000 | $149,000 |
Financial Plan
The financial plan of Panache Travel Group is detailed in the following sections. Preliminary estimates suggest that PTG will experience rapid growth and will increase in gross margin and sales volume. This is partly due to the vast market, but will be facilitated by increased marketing. Income estimates are based, in part, on anticipated revenues from accounts and clients that are secured by PTG prior to its acquisition of both Barkley Roberts Travel and Panache European Journeys. PTG will need sufficient cash to allow for a possible negative cash flow during start-up. It will also need investment to acquire the assets and liabilities of Barkley Roberts Travel and Panache European Journeys. Thus, the overall financial plan presents a conservative, but realistic, depiction of the financial position of PTG.
7.1 Important Assumptions
Panache Travel Group assumes the following:
- Market growth projections for the travel industry and for luxury travel are accurate.
- National economic conditions, which are favorable to the travel industry, will not experience significant decline in the next three years.
- International conditions will remain favorable for service providers and PTG will be able to maintain those relationships.
| General Assumptions | |||
| Year 1 | Year 2 | Year 3 | |
| Plan Month | 1 | 2 | 3 |
| Current Interest Rate | 10.00% | 10.00% | 10.00% |
| Long-term Interest Rate | 10.00% | 10.00% | 10.00% |
| Tax Rate | 25.42% | 25.00% | 25.42% |
| Other | 0 | 0 | 0 |
7.2 Key Financial Indicators
The following chart indicates key financial indicators for the first three years for Panache Travel Group. Growth is expected in sales and a proportional increase in operating expenses during expansion.

7.3 Projected Profit and Loss
The profit picture of Panache Travel Group improves as operations move into the second year. PTG anticipates improving its profitability dramatically by 2003. The annual estimates are included in the table below.


| Pro Forma Profit and Loss | |||
| Year 1 | Year 2 | Year 3 | |
| Sales | $500,000 | $1,500,000 | $4,500,000 |
| Direct Cost of Sales | $346,800 | $1,222,500 | $3,609,000 |
| Other | $0 | $0 | $0 |
| Total Cost of Sales | $346,800 | $1,222,500 | $3,609,000 |
| Gross Margin | $153,200 | $277,500 | $891,000 |
| Gross Margin % | 30.64% | 18.50% | 19.80% |
| Expenses | |||
| Payroll | $52,500 | $87,000 | $149,000 |
| Sales and Marketing and Other Expenses | $11,700 | $38,600 | $76,000 |
| Depreciation | $0 | $0 | $0 |
| Leased Equipment | $0 | $0 | $0 |
| Utilities | $875 | $1,574 | $1,653 |
| Insurance | $700 | $1,200 | $1,200 |
| Rent | $2,100 | $3,600 | $3,600 |
| Payroll Taxes | $2,625 | $4,350 | $7,450 |
| Other | $0 | $0 | $0 |
| Total Operating Expenses | $70,500 | $136,324 | $238,903 |
| Profit Before Interest and Taxes | $82,700 | $141,176 | $652,097 |
| EBITDA | $82,700 | $141,176 | $652,097 |
| Interest Expense | $110 | $110 | $110 |
| Taxes Incurred | $20,647 | $35,267 | $165,713 |
| Net Profit | $61,943 | $105,800 | $486,274 |
| Net Profit/Sales | 12.39% | 7.05% | 10.81% |
7.4 Projected Cash Flow
Cash flow projections are critical to our success. The monthly cash flow for 2001 is shown in the illustration, with one bar representing the cash flow per month and the other representing the monthly balance. The annual cash flow figures are included here in the following table.

| Pro Forma Cash Flow | |||
| Year 1 | Year 2 | Year 3 | |
| Cash Received | |||
| Cash from Operations | |||
| Cash Sales | $500,000 | $1,500,000 | $4,500,000 |
| Subtotal Cash from Operations | $500,000 | $1,500,000 | $4,500,000 |
| Additional Cash Received | |||
| Sales Tax, VAT, HST/GST Received | $0 | $0 | $0 |
| New Current Borrowing | $0 | $0 | $0 |
| New Other Liabilities (interest-free) | $0 | $0 | $0 |
| New Long-term Liabilities | $0 | $0 | $0 |
| Sales of Other Current Assets | $0 | $0 | $0 |
| Sales of Long-term Assets | $0 | $0 | $0 |
| New Investment Received | $0 | $0 | $0 |
| Subtotal Cash Received | $500,000 | $1,500,000 | $4,500,000 |
| Expenditures | Year 1 | Year 2 | Year 3 |
| Expenditures from Operations | |||
| Cash Spending | $52,500 | $87,000 | $149,000 |
| Bill Payments | $343,452 | $1,241,864 | $3,654,519 |
| Subtotal Spent on Operations | $395,952 | $1,328,864 | $3,803,519 |
| Additional Cash Spent | |||
| Sales Tax, VAT, HST/GST Paid Out | $0 | $0 | $0 |
| Principal Repayment of Current Borrowing | $0 | $0 | $0 |
| Other Liabilities Principal Repayment | $0 | $0 | $0 |
| Long-term Liabilities Principal Repayment | $0 | $0 | $0 |
| Purchase Other Current Assets | $0 | $0 | $0 |
| Purchase Long-term Assets | $0 | $0 | $0 |
| Dividends | $0 | $0 | $0 |
| Subtotal Cash Spent | $395,952 | $1,328,864 | $3,803,519 |
| Net Cash Flow | $104,048 | $171,136 | $696,481 |
| Cash Balance | $204,048 | $375,184 | $1,071,665 |
7.5 Projected Balance Sheet
The balance sheet indicates sustained and planned growth. Net worth improves considerably in years two and three and will provide Panache Travel Group with a strong financial position.
| Pro Forma Balance Sheet | |||
| Year 1 | Year 2 | Year 3 | |
| Assets | |||
| Current Assets | |||
| Cash | $204,048 | $375,184 | $1,071,665 |
| Other Current Assets | $0 | $0 | $0 |
| Total Current Assets | $204,048 | $375,184 | $1,071,665 |
| Long-term Assets | |||
| Long-term Assets | $0 | $0 | $0 |
| Accumulated Depreciation | $0 | $0 | $0 |
| Total Long-term Assets | $0 | $0 | $0 |
| Total Assets | $204,048 | $375,184 | $1,071,665 |
| Liabilities and Capital | Year 1 | Year 2 | Year 3 |
| Current Liabilities | |||
| Accounts Payable | $42,105 | $107,441 | $317,649 |
| Current Borrowing | $1,100 | $1,100 | $1,100 |
| Other Current Liabilities | $0 | $0 | $0 |
| Subtotal Current Liabilities | $43,205 | $108,541 | $318,749 |
| Long-term Liabilities | $0 | $0 | $0 |
| Total Liabilities | $43,205 | $108,541 | $318,749 |
| Paid-in Capital | $100,000 | $100,000 | $100,000 |
| Retained Earnings | ($1,100) | $60,843 | $166,642 |
| Earnings | $61,943 | $105,800 | $486,274 |
| Total Capital | $160,843 | $266,642 | $752,916 |
| Total Liabilities and Capital | $204,048 | $375,184 | $1,071,665 |
| Net Worth | $160,843 | $266,642 | $752,916 |
7.6 Business Ratios
The following table shows the projected business ratios. Panache Travel Group expects to maintain healthy ratios for profitability, risk and return. Industry Profile ratios are also shown, based on Standard Industry Classification (SIC) code 4724, Travel Agencies.
| Ratio Analysis | ||||
| Year 1 | Year 2 | Year 3 | Industry Profile | |
| Sales Growth | 0.00% | 200.00% | 200.00% | 4.00% |
| Percent of Total Assets | ||||
| Other Current Assets | 0.00% | 0.00% | 0.00% | 38.10% |
| Total Current Assets | 100.00% | 100.00% | 100.00% | 64.00% |
| Long-term Assets | 0.00% | 0.00% | 0.00% | 36.00% |
| Total Assets | 100.00% | 100.00% | 100.00% | 100.00% |
| Current Liabilities | 21.17% | 28.93% | 29.74% | 39.60% |
| Long-term Liabilities | 0.00% | 0.00% | 0.00% | 16.30% |
| Total Liabilities | 21.17% | 28.93% | 29.74% | 55.90% |
| Net Worth | 78.83% | 71.07% | 70.26% | 44.10% |
| Percent of Sales | ||||
| Sales | 100.00% | 100.00% | 100.00% | 100.00% |
| Gross Margin | 30.64% | 18.50% | 19.80% | 38.30% |
| Selling, General & Administrative Expenses | 18.25% | 11.45% | 8.93% | 27.50% |
| Advertising Expenses | 1.40% | 1.67% | 1.11% | 0.40% |
| Profit Before Interest and Taxes | 16.54% | 9.41% | 14.49% | 1.30% |
| Main Ratios | ||||
| Current | 4.72 | 3.46 | 3.36 | 1.44 |
| Quick | 4.72 | 3.46 | 3.36 | 1.13 |
| Total Debt to Total Assets | 21.17% | 28.93% | 29.74% | 55.90% |
| Pre-tax Return on Net Worth | 51.35% | 52.90% | 86.59% | 3.20% |
| Pre-tax Return on Assets | 40.48% | 37.60% | 60.84% | 7.20% |
| Additional Ratios | Year 1 | Year 2 | Year 3 | |
| Net Profit Margin | 12.39% | 7.05% | 10.81% | n.a |
| Return on Equity | 38.51% | 39.68% | 64.59% | n.a |
| Activity Ratios | ||||
| Accounts Payable Turnover | 9.16 | 12.17 | 12.17 | n.a |
| Payment Days | 27 | 21 | 20 | n.a |
| Total Asset Turnover | 2.45 | 4.00 | 4.20 | n.a |
| Debt Ratios | ||||
| Debt to Net Worth | 0.27 | 0.41 | 0.42 | n.a |
| Current Liab. to Liab. | 1.00 | 1.00 | 1.00 | n.a |
| Liquidity Ratios | ||||
| Net Working Capital | $160,843 | $266,642 | $752,916 | n.a |
| Interest Coverage | 751.82 | 1,283.42 | 5,928.15 | n.a |
| Additional Ratios | ||||
| Assets to Sales | 0.41 | 0.25 | 0.24 | n.a |
| Current Debt/Total Assets | 21% | 29% | 30% | n.a |
| Acid Test | 4.72 | 3.46 | 3.36 | n.a |
| Sales/Net Worth | 3.11 | 5.63 | 5.98 | n.a |
| Dividend Payout | 0.00 | 0.00 | 0.00 | n.a |
Appendix
| Sales Forecast | |||||||||||||
| Month 1 | Month 2 | Month 3 | Month 4 | Month 5 | Month 6 | Month 7 | Month 8 | Month 9 | Month 10 | Month 11 | Month 12 | ||
| Sales | |||||||||||||
| Journeys | 0% | $0 | $0 | $0 | $0 | $0 | $50,000 | $50,000 | $50,000 | $50,000 | $50,000 | $30,000 | $30,000 |
| Services | 0% | $0 | $0 | $0 | $0 | $0 | $30,000 | $30,000 | $30,000 | $30,000 | $30,000 | $20,000 | $20,000 |
| Total Sales | $0 | $0 | $0 | $0 | $0 | $80,000 | $80,000 | $80,000 | $80,000 | $80,000 | $50,000 | $50,000 | |
| Direct Cost of Sales | Month 1 | Month 2 | Month 3 | Month 4 | Month 5 | Month 6 | Month 7 | Month 8 | Month 9 | Month 10 | Month 11 | Month 12 | |
| Journeys | $0 | $0 | $0 | $0 | $0 | $0 | $39,000 | $39,000 | $39,000 | $39,000 | $23,400 | $23,400 | |
| Services | $0 | $0 | $0 | $0 | $0 | $0 | $27,000 | $27,000 | $27,000 | $27,000 | $18,000 | $18,000 | |
| Subtotal Direct Cost of Sales | $0 | $0 | $0 | $0 | $0 | $0 | $66,000 | $66,000 | $66,000 | $66,000 | $41,400 | $41,400 | |
| Personnel Plan | |||||||||||||
| Month 1 | Month 2 | Month 3 | Month 4 | Month 5 | Month 6 | Month 7 | Month 8 | Month 9 | Month 10 | Month 11 | Month 12 | ||
| President and Development Dir. * | 0% | $0 | $0 | $0 | $0 | $0 | $2,000 | $2,000 | $2,000 | $2,000 | $2,000 | $2,000 | $2,000 |
| Marketing & Advertising Dir. * | 0% | $0 | $0 | $0 | $0 | $0 | $2,000 | $2,000 | $2,000 | $2,000 | $2,000 | $2,000 | $2,000 |
| Office Manager * | 0% | $0 | $0 | $0 | $0 | $0 | $2,000 | $2,000 | $2,000 | $2,000 | $2,000 | $2,000 | $2,000 |
| Accounting | 0% | $0 | $0 | $0 | $0 | $0 | $500 | $500 | $500 | $500 | $500 | $500 | $500 |
| Travel Dir. * | 0% | $0 | $0 | $0 | $0 | $0 | $1,000 | $1,000 | $1,000 | $1,000 | $1,000 | $1,000 | $1,000 |
| Travel Agent | 0% | $0 | $0 | $0 | $0 | $0 | $0 | $0 | $0 | $0 | $0 | $0 | $0 |
| Sales Reps. | 0% | $0 | $0 | $0 | $0 | $0 | $0 | $0 | $0 | $0 | $0 | $0 | $0 |
| Tour Guides | 0% | $0 | $0 | $0 | $0 | $0 | $0 | $0 | $0 | $0 | $0 | $0 | $0 |
| Additional Office Support | 0% | $0 | $0 | $0 | $0 | $0 | $0 | $0 | $0 | $0 | $0 | $0 | $0 |
| Total People | 10 | 10 | 10 | 10 | 12 | 14 | 14 | 14 | 12 | 10 | 10 | 10 | |
| Total Payroll | $0 | $0 | $0 | $0 | $0 | $7,500 | $7,500 | $7,500 | $7,500 | $7,500 | $7,500 | $7,500 | |
| General Assumptions | |||||||||||||
| Month 1 | Month 2 | Month 3 | Month 4 | Month 5 | Month 6 | Month 7 | Month 8 | Month 9 | Month 10 | Month 11 | Month 12 | ||
| Plan Month | 1 | 2 | 3 | 4 | 5 | 6 | 7 | 8 | 9 | 10 | 11 | 12 | |
| Current Interest Rate | 10.00% | 10.00% | 10.00% | 10.00% | 10.00% | 10.00% | 10.00% | 10.00% | 10.00% | 10.00% | 10.00% | 10.00% | |
| Long-term Interest Rate | 10.00% | 10.00% | 10.00% | 10.00% | 10.00% | 10.00% | 10.00% | 10.00% | 10.00% | 10.00% | 10.00% | 10.00% | |
| Tax Rate | 30.00% | 25.00% | 25.00% | 25.00% | 25.00% | 25.00% | 25.00% | 25.00% | 25.00% | 25.00% | 25.00% | 25.00% | |
| Other | 0 | 0 | 0 | 0 | 0 | 0 | 0 | 0 | 0 | 0 | 0 | 0 | |
| Pro Forma Profit and Loss | |||||||||||||
| Month 1 | Month 2 | Month 3 | Month 4 | Month 5 | Month 6 | Month 7 | Month 8 | Month 9 | Month 10 | Month 11 | Month 12 | ||
| Sales | $0 | $0 | $0 | $0 | $0 | $80,000 | $80,000 | $80,000 | $80,000 | $80,000 | $50,000 | $50,000 | |
| Direct Cost of Sales | $0 | $0 | $0 | $0 | $0 | $0 | $66,000 | $66,000 | $66,000 | $66,000 | $41,400 | $41,400 | |
| Other | $0 | $0 | $0 | $0 | $0 | $0 | $0 | $0 | $0 | $0 | $0 | $0 | |
| Total Cost of Sales | $0 | $0 | $0 | $0 | $0 | $0 | $66,000 | $66,000 | $66,000 | $66,000 | $41,400 | $41,400 | |
| Gross Margin | $0 | $0 | $0 | $0 | $0 | $80,000 | $14,000 | $14,000 | $14,000 | $14,000 | $8,600 | $8,600 | |
| Gross Margin % | 0.00% | 0.00% | 0.00% | 0.00% | 0.00% | 100.00% | 17.50% | 17.50% | 17.50% | 17.50% | 17.20% | 17.20% | |
| Expenses | |||||||||||||
| Payroll | $0 | $0 | $0 | $0 | $0 | $7,500 | $7,500 | $7,500 | $7,500 | $7,500 | $7,500 | $7,500 | |
| Sales and Marketing and Other Expenses | $0 | $0 | $0 | $0 | $0 | $2,100 | $1,600 | $1,600 | $1,600 | $1,600 | $1,600 | $1,600 | |
| Depreciation | $0 | $0 | $0 | $0 | $0 | $0 | $0 | $0 | $0 | $0 | $0 | $0 | |
| Leased Equipment | $0 | $0 | $0 | $0 | $0 | $0 | $0 | $0 | $0 | $0 | $0 | $0 | |
| Utilities | $0 | $0 | $0 | $0 | $0 | $125 | $125 | $125 | $125 | $125 | $125 | $125 | |
| Insurance | $0 | $0 | $0 | $0 | $0 | $100 | $100 | $100 | $100 | $100 | $100 | $100 | |
| Rent | $0 | $0 | $0 | $0 | $0 | $300 | $300 | $300 | $300 | $300 | $300 | $300 | |
| Payroll Taxes | 5% | $0 | $0 | $0 | $0 | $0 | $375 | $375 | $375 | $375 | $375 | $375 | $375 |
| Other | $0 | $0 | $0 | $0 | $0 | $0 | $0 | $0 | $0 | $0 | $0 | $0 | |
| Total Operating Expenses | $0 | $0 | $0 | $0 | $0 | $10,500 | $10,000 | $10,000 | $10,000 | $10,000 | $10,000 | $10,000 | |
| Profit Before Interest and Taxes | $0 | $0 | $0 | $0 | $0 | $69,500 | $4,000 | $4,000 | $4,000 | $4,000 | ($1,400) | ($1,400) | |
| EBITDA | $0 | $0 | $0 | $0 | $0 | $69,500 | $4,000 | $4,000 | $4,000 | $4,000 | ($1,400) | ($1,400) | |
| Interest Expense | $9 | $9 | $9 | $9 | $9 | $9 | $9 | $9 | $9 | $9 | $9 | $9 | |
| Taxes Incurred | ($3) | ($2) | ($2) | ($2) | ($2) | $17,373 | $998 | $998 | $998 | $998 | ($352) | ($352) | |
| Net Profit | ($6) | ($7) | ($7) | ($7) | ($7) | $52,118 | $2,993 | $2,993 | $2,993 | $2,993 | ($1,057) | ($1,057) | |
| Net Profit/Sales | 0.00% | 0.00% | 0.00% | 0.00% | 0.00% | 65.15% | 3.74% | 3.74% | 3.74% | 3.74% | -2.11% | -2.11% | |
| Pro Forma Cash Flow | |||||||||||||
| Month 1 | Month 2 | Month 3 | Month 4 | Month 5 | Month 6 | Month 7 | Month 8 | Month 9 | Month 10 | Month 11 | Month 12 | ||
| Cash Received | |||||||||||||
| Cash from Operations | |||||||||||||
| Cash Sales | $0 | $0 | $0 | $0 | $0 | $80,000 | $80,000 | $80,000 | $80,000 | $80,000 | $50,000 | $50,000 | |
| Subtotal Cash from Operations | $0 | $0 | $0 | $0 | $0 | $80,000 | $80,000 | $80,000 | $80,000 | $80,000 | $50,000 | $50,000 | |
| Additional Cash Received | |||||||||||||
| Sales Tax, VAT, HST/GST Received | 0.00% | $0 | $0 | $0 | $0 | $0 | $0 | $0 | $0 | $0 | $0 | $0 | $0 |
| New Current Borrowing | $0 | $0 | $0 | $0 | $0 | $0 | $0 | $0 | $0 | $0 | $0 | $0 | |
| New Other Liabilities (interest-free) | $0 | $0 | $0 | $0 | $0 | $0 | $0 | $0 | $0 | $0 | $0 | $0 | |
| New Long-term Liabilities | $0 | $0 | $0 | $0 | $0 | $0 | $0 | $0 | $0 | $0 | $0 | $0 | |
| Sales of Other Current Assets | $0 | $0 | $0 | $0 | $0 | $0 | $0 | $0 | $0 | $0 | $0 | $0 | |
| Sales of Long-term Assets | $0 | $0 | $0 | $0 | $0 | $0 | $0 | $0 | $0 | $0 | $0 | $0 | |
| New Investment Received | $0 | $0 | $0 | $0 | $0 | $0 | $0 | $0 | $0 | $0 | $0 | $0 | |
| Subtotal Cash Received | $0 | $0 | $0 | $0 | $0 | $80,000 | $80,000 | $80,000 | $80,000 | $80,000 | $50,000 | $50,000 | |
| Expenditures | Month 1 | Month 2 | Month 3 | Month 4 | Month 5 | Month 6 | Month 7 | Month 8 | Month 9 | Month 10 | Month 11 | Month 12 | |
| Expenditures from Operations | |||||||||||||
| Cash Spending | $0 | $0 | $0 | $0 | $0 | $7,500 | $7,500 | $7,500 | $7,500 | $7,500 | $7,500 | $7,500 | |
| Bill Payments | $0 | $6 | $7 | $7 | $7 | $686 | $22,019 | $69,507 | $69,507 | $69,507 | $68,642 | $43,557 | |
| Subtotal Spent on Operations | $0 | $6 | $7 | $7 | $7 | $8,186 | $29,519 | $77,007 | $77,007 | $77,007 | $76,142 | $51,057 | |
| Additional Cash Spent | |||||||||||||
| Sales Tax, VAT, HST/GST Paid Out | $0 | $0 | $0 | $0 | $0 | $0 | $0 | $0 | $0 | $0 | $0 | $0 | |
| Principal Repayment of Current Borrowing | $0 | $0 | $0 | $0 | $0 | $0 | $0 | $0 | $0 | $0 | $0 | $0 | |
| Other Liabilities Principal Repayment | $0 | $0 | $0 | $0 | $0 | $0 | $0 | $0 | $0 | $0 | $0 | $0 | |
| Long-term Liabilities Principal Repayment | $0 | $0 | $0 | $0 | $0 | $0 | $0 | $0 | $0 | $0 | $0 | $0 | |
| Purchase Other Current Assets | $0 | $0 | $0 | $0 | $0 | $0 | $0 | $0 | $0 | $0 | $0 | $0 | |
| Purchase Long-term Assets | $0 | $0 | $0 | $0 | $0 | $0 | $0 | $0 | $0 | $0 | $0 | $0 | |
| Dividends | $0 | $0 | $0 | $0 | $0 | $0 | $0 | $0 | $0 | $0 | $0 | $0 | |
| Subtotal Cash Spent | $0 | $6 | $7 | $7 | $7 | $8,186 | $29,519 | $77,007 | $77,007 | $77,007 | $76,142 | $51,057 | |
| Net Cash Flow | ($0) | ($6) | ($7) | ($7) | ($7) | $71,814 | $50,481 | $2,993 | $2,993 | $2,993 | ($26,142) | ($1,057) | |
| Cash Balance | $100,000 | $99,993 | $99,986 | $99,980 | $99,973 | $171,787 | $222,267 | $225,260 | $228,254 | $231,247 | $205,105 | $204,048 | |
| Pro Forma Balance Sheet | |||||||||||||
| Month 1 | Month 2 | Month 3 | Month 4 | Month 5 | Month 6 | Month 7 | Month 8 | Month 9 | Month 10 | Month 11 | Month 12 | ||
| Assets | Starting Balances | ||||||||||||
| Current Assets | |||||||||||||
| Cash | $100,000 | $100,000 | $99,993 | $99,986 | $99,980 | $99,973 | $171,787 | $222,267 | $225,260 | $228,254 | $231,247 | $205,105 | $204,048 |
| Other Current Assets | $0 | $0 | $0 | $0 | $0 | $0 | $0 | $0 | $0 | $0 | $0 | $0 | $0 |
| Total Current Assets | $100,000 | $100,000 | $99,993 | $99,986 | $99,980 | $99,973 | $171,787 | $222,267 | $225,260 | $228,254 | $231,247 | $205,105 | $204,048 |
| Long-term Assets | |||||||||||||
| Long-term Assets | $0 | $0 | $0 | $0 | $0 | $0 | $0 | $0 | $0 | $0 | $0 | $0 | $0 |
| Accumulated Depreciation | $0 | $0 | $0 | $0 | $0 | $0 | $0 | $0 | $0 | $0 | $0 | $0 | $0 |
| Total Long-term Assets | $0 | $0 | $0 | $0 | $0 | $0 | $0 | $0 | $0 | $0 | $0 | $0 | $0 |
| Total Assets | $100,000 | $100,000 | $99,993 | $99,986 | $99,980 | $99,973 | $171,787 | $222,267 | $225,260 | $228,254 | $231,247 | $205,105 | $204,048 |
| Liabilities and Capital | Month 1 | Month 2 | Month 3 | Month 4 | Month 5 | Month 6 | Month 7 | Month 8 | Month 9 | Month 10 | Month 11 | Month 12 | |
| Current Liabilities | |||||||||||||
| Accounts Payable | $0 | $6 | $7 | $7 | $7 | $7 | $19,702 | $67,190 | $67,190 | $67,190 | $67,190 | $42,105 | $42,105 |
| Current Borrowing | $1,100 | $1,100 | $1,100 | $1,100 | $1,100 | $1,100 | $1,100 | $1,100 | $1,100 | $1,100 | $1,100 | $1,100 | $1,100 |
| Other Current Liabilities | $0 | $0 | $0 | $0 | $0 | $0 | $0 | $0 | $0 | $0 | $0 | $0 | $0 |
| Subtotal Current Liabilities | $1,100 | $1,106 | $1,107 | $1,107 | $1,107 | $1,107 | $20,802 | $68,290 | $68,290 | $68,290 | $68,290 | $43,205 | $43,205 |
| Long-term Liabilities | $0 | $0 | $0 | $0 | $0 | $0 | $0 | $0 | $0 | $0 | $0 | $0 | $0 |
| Total Liabilities | $1,100 | $1,106 | $1,107 | $1,107 | $1,107 | $1,107 | $20,802 | $68,290 | $68,290 | $68,290 | $68,290 | $43,205 | $43,205 |
| Paid-in Capital | $100,000 | $100,000 | $100,000 | $100,000 | $100,000 | $100,000 | $100,000 | $100,000 | $100,000 | $100,000 | $100,000 | $100,000 | $100,000 |
| Retained Earnings | ($1,100) | ($1,100) | ($1,100) | ($1,100) | ($1,100) | ($1,100) | ($1,100) | ($1,100) | ($1,100) | ($1,100) | ($1,100) | ($1,100) | ($1,100) |
| Earnings | $0 | ($6) | ($13) | ($20) | ($27) | ($34) | $52,084 | $55,077 | $58,070 | $61,064 | $64,057 | $63,000 | $61,943 |
| Total Capital | $98,900 | $98,894 | $98,887 | $98,880 | $98,873 | $98,866 | $150,984 | $153,977 | $156,970 | $159,964 | $162,957 | $161,900 | $160,843 |
| Total Liabilities and Capital | $100,000 | $100,000 | $99,993 | $99,986 | $99,980 | $99,973 | $171,787 | $222,267 | $225,260 | $228,254 | $231,247 | $205,105 | $204,048 |
| Net Worth | $98,900 | $98,894 | $98,887 | $98,880 | $98,873 | $98,866 | $150,984 | $153,977 | $156,970 | $159,964 | $162,957 | $161,900 | $160,843 |


