
Adventure Excursions Unlimited
Executive Summary
Adventure Excursions Unlimited (AEU) was formed to provide hard-adventure sport/travel packages with upscale accommodations, gourmet food, and celebrity service providers to wealthy clients. AEU hard adventures include helicopter-skiing, kayaking, white-water rafting, and mountain biking. The founders of AEU are Jordan Stephan (MBA/JD), Jillyn Certo (MBA), and Loren Harlo (MBA). In addition to their MBA status, they are passionate about the activities AEU will offer.
An opportunity exists for two reasons:
- Tourism is a growing industry (4% annually), and within the industry adventure travel is growing at 10%.
- There are few providers of hard-adventure travel to upscale clients.
Virtually all companies that provide “hard” adventure activities appeal to a lower income client. Companies that appeal to a wealthier clientele generally provide “soft” adventure packages. Hard-adventure activities involve difficult physical requirements. They carry a higher level of risk than do “soft” activities. Soft adventure activities may involve some physical exertion, however they involve a low level of risk and can be engaged in by non-athletic people.
The company’s target customers are high income (min. $75,000 for single person), health-conscious individuals interested in popular hard-adventure sports. These are lawyers, bankers, executives, doctors, etc. The major purchasers are located in urban areas within major United States cities. Our customers are more likely to be married. 51% are men and 49% are women.
In addition, more niche markets are evolving. Initially, it will be difficult to compete with experienced providers, especially market leaders. However, AEU’s target market is an exploitable niche and our service is differentiated. AEU’s target market members will have similar activity interests, more disposable income and less sensitivity to price.
AEU will price its services at the top of the market. We will provide a luxury service with prestige value. Our prices will be out of reach for the majority of adventure travelers. Service will be priced based upon luxury competitor prices and the value added of our offering. Providers that offer luxury services similar to ours do so at similar prices. We are competitively priced in the luxury market. Because we appeal to a smaller market, volume will be limited. However, we will be able to capture a higher gross profit margin.
1.1 Objectives
Adventure Excursions Unlimited’s objectives for the first three years of operation include:
- To create a service-based company whose #1 mission is exceeding customers’ expectations.
- Capturing 25% market share of the high-end hard-adventure travel space.
- To develop a sustainable, profitable business.
- To achieve a 35% return rate of customers within the first three years.
1.2 Mission
Adventure Excursions Unlimited’s mission is to provide customers with the highest quality outdoor adventure. We exist to attract and maintain customers. When we adhere to this maxim, everything else will fall into place.
Company Summary
Adventure Excursions Unlimited, located in Eugene, OR will offer hard-adventure trips to the upper end of the travel market. AEU will be concentrating on three activities, mountain biking, heli-skiing, and white-water adventures. AEU has chosen these three activities to allow the company to not be restricted by seasons, we will have trips occurring through the year. While AEU’s office is located in Eugene, it will be leading trips throughout the United States, and the world.
AEU expects the first several months will be used to plan trips and train trip leaders. By the end of year one the trips should be in full swing and AEU will be building a solid customer base.
2.1 Company Ownership
Adventure Excursions Unlimited will be a privately held Oregon Corporation. Jordan Stephan, Jillyn Certo, and Loren Harlo will all hold equal number shares of AEU stock.
2.2 Start-up Summary
Adventure Excursions Unlimited’s start-up costs include all the equipment needed for an office, as well as the equipment needed for the mountain bike trips and white-water adventures. Other costs will be marketing fees, website development, insurance and a deposit for the office lease.
The office equipment will consist of four computer systems, DSL router, printer, CD-RW, CPU to be used as an internal server, phones, copier, fax machine and installation of DSL and two phone lines.
The equipment needed for the mountain bike trip will be a fleet of 15 bicycles, a self contained kitchen, shower and toilet system, and bicycle tools.
The equipment for the white-water adventures will include inflatable rafts (and other requisite related equipment), self contained kitchen set up, portable shower and toilet facilities, and lots of dry bags.
The marketing costs are for the brochures and advertisements. AEU will also incur costs in the development of our website. Lastly, insurance will be a large start-up expense.

| Start-up Funding | |
| Start-up Expenses to Fund | $2,400 |
| Start-up Assets to Fund | $57,600 |
| Total Funding Required | $60,000 |
| Assets | |
| Non-cash Assets from Start-up | $13,000 |
| Cash Requirements from Start-up | $44,600 |
| Additional Cash Raised | $0 |
| Cash Balance on Starting Date | $44,600 |
| Total Assets | $57,600 |
| Liabilities and Capital | |
| Liabilities | |
| Current Borrowing | $0 |
| Long-term Liabilities | $0 |
| Accounts Payable (Outstanding Bills) | $0 |
| Other Current Liabilities (interest-free) | $0 |
| Total Liabilities | $0 |
| Capital | |
| Planned Investment | |
| Jordan Stephan | $20,000 |
| Jillyn Certo | $20,000 |
| Loren Harlo | $20,000 |
| Additional Investment Requirement | $0 |
| Total Planned Investment | $60,000 |
| Loss at Start-up (Start-up Expenses) | ($2,400) |
| Total Capital | $57,600 |
| Total Capital and Liabilities | $57,600 |
| Total Funding | $60,000 |
| Start-up | |
| Requirements | |
| Start-up Expenses | |
| Legal | $0 |
| Stationery etc. | $50 |
| Brochures | $100 |
| Consultants | $0 |
| Insurance | $500 |
| Rent | $450 |
| Research and Development | $400 |
| Website Development | $500 |
| Office Equipment | $400 |
| Expensed Equipment | $0 |
| Other | $0 |
| Total Start-up Expenses | $2,400 |
| Start-up Assets | |
| Cash Required | $44,600 |
| Other Current Assets | $0 |
| Long-term Assets | $13,000 |
| Total Assets | $57,600 |
| Total Requirements | $60,000 |
Services
AEU will position itself as a niche service provider within the hard-adventure market. It will offer high-quality travel packages for extreme sporting trips. To begin AEU will offer six trips: helicopter-skiing trips to Canada, India, and New Zealand, white-water rafting trips to New Zealand and Costa Rica, and a mountain biking trip along the Great Divide from Montana to New Mexico.
The target market will be made up of young professionals who work and play hard. These people can afford to play expensively, and are willing to buy time in the form of our services. AEU will serve the hard-adventure niche market as a top quality, full-service provider. AEU defines quality by the unique aspects of the services offered. Those aspects include booking group or custom trips, assistance with passports, providing top-of-the-line equipment and supplies, and a superior service offering with access to better terrain, luxury accommodations, entertainment, celebrity exposure, and gourmet food.
The tours to be offered are as follows:
- Mountain Biking: This event will take place on the Great Divide trail from Montana to New Mexico and is designed for the serious biker that appreciates a few of life’s comforts along the trail. Showers and gourmet meals will be provided, along with entertainment. All excursions will maintain a staff to client ratio of 1:2.
A comprehensive map system has been created by Adventure Cycling and is currently available for purchase. The map clearly indicates the route, places to camp, stores for food and laundromats. Leadership training for the guides will be developed in-house using some outside material. There are many similar organizations that will be good sources of information.
The products needed for this trip are for the most part already manufactured. One item that needs to be designed and built is a privacy compartment for the solar shower. This will be designed by Jordan and manufactured in-house. A cookbook collection of simple recipes, including some personal favorites, will also be assembled. Professional cooks will be provided, and flown in if necessary.

- Heli-skiing: Helicopter skiing has become a popular alternative to resort skiing. It offers uncrowded access to the best terrain. For those who like to get off the beaten path heli-skiing is for them. AEU has planned annual and custom trips to three destinations. Everything will be taken care of for the customer. Transportation, lodging, transfers and skiing is included in the package. Although our trips are planned at peak ski seasons, mother nature cannot be predicted. In the event that the weather is too treacherous to ski the trip will be postponed. An in–house travel consultant will accompany each group and take care of all check-in and transfer issues.
AEU will not send clients to places we ourselves would not go. All service providers will be top-notch professionals with accomplished backgrounds. They will be medically trained, and evaluated for knowledge and ability to ensure safety and high-quality service. If they fail, at any time, to meet our rigid standards of quality, they will not be used. If quality falls, another provider will replace them. These activities take place outside of the United States and therefore we will hire local guides to accompany our professional guides and service providers.
- White-water Sports: New Zealand and Costa Rica were chosen for these ten day long hard-adventure excursions. There can be a maximum of ten people per group. Annual trips will be planned to each location, but for large enough private groups, custom trips can be planed. As with the heli-skiing trips, local guides will be used in addition to our own. The abroad trips will be a cooperative effort in-house, as well as local guides in the host countries. The choice to seek outside consulting for the trips abroad is due to each countries different legal and regulatory climate. The potential subcontractors and guides are individuals currently in the industry in their respective countries.
Market Analysis Summary
Travel industry is an upward growth industry. There are several reasons for this increase. First, a relative healthy domestic economy over the last several years and the devaluation of currency in other regions has made travel less expensive for U.S. residents. Pleasure travel has increased by 3.2% in 1999 and is predicted to grow 2.0% in 2000. Second, the healthy economy has increased business, which in turn boosted domestic business travel 4.8% in 1999 with an estimated increase of 3.6% in 2000.
Adventure travel is a growing segment of the travel industry. One theory of the recent increase in extreme sports has to do with the strong competitive nature of younger Americans. Statistics show that 8,000 U.S. companies (that offer adventure packages) generated $7 billion in 1999. There also has been a 66% increase in executive participation between 1996 and 2000 (or an increase of 2,000 participants)(La Franco, Robert. Forbes, Feb 9, 1998 v161 n3 p168(3)).
Some quick facts:
- Adventure travelers: More than 50% of the U.S. adult traveling population, or 147 million people, have taken an adventure trip in their lifetime (98 million in the past five years). Thirty-one million adults have engaged in hard-adventure activities like white-water rafting, scuba diving and mountain biking. An additional 25 million engaged in both a hard- and soft-adventure activity. Six-percent of those who participated in adventure trips spent more than $2,500.
- Activities most commonly participated in during adventure vacations: camping (85%), hiking (74%), skiing (51%), snorkeling or scuba diving (30%), sailing (26%), kayaking or white-water rafting (24%), and biking trips (24%).
- Biking vacations: Twenty-seven million travelers with customers that tend to be young and affluent. Ages 18-34 and one-fourth are from household’s w/annual income of $75,000 or above.
4.1 Market Segmentation
AEU’s target customers are high income (min. $75,000 for single person), health-conscious individuals interested in popular hard-adventure sports such as skiing, white-water sports and mountain biking. The major purchasers are located in urban areas within these United States cities.
Customer Location (within the United States):
- California
- Florida
- New York
- Texas
- Illinois
- Nevada
- Hawaii
- New Jersey
- Pennsylvania
- Georgia
Hard-adventure travelers are more likely to be men. Therefore, AEU’s primary target market for hard-adventure sports is men between the ages of 18-34. However an increasing number of hard-adventure travelers are women (some statistics suggest that women comprise 49% of the hard-adventure market). Men, on average, spend more than women on their adventure travels.
Customers will be reached through traditional marketing communication methods. Information has been located relating to specific profiles of both hard- and soft-adventure travelers, where they live, work, what they do, etc. Research suggests that many of our target customers, and travelers in general, are Internet savvy. As such, the Internet will serve as an appropriate and effective medium of communication. Many adventure travelers purchase over the Internet or buy through travel agents. Purchase decisions are influenced by the amount of disposable income held, family issues, and the economy of a given year.
AEU will be targeting two specific groups:
- High-income health-conscious individuals.
- Young, active “trustafarians.”
The common elements between these two groups are money and a love for adventures. Group one has a lot of money from income that they earn. Group two has a lot of disposable income because the money was given to them, typically by members of their family. The second group, the trustafarians, is a very small group relative to the first group.

| Market Analysis | |||||||
| Year 1 | Year 2 | Year 3 | Year 4 | Year 5 | |||
| Potential Customers | Growth | CAGR | |||||
| High-income Health-conscious Individuals | 12% | 1,300,000 | 1,456,000 | 1,630,720 | 1,826,406 | 2,045,575 | 12.00% |
| Young, Active Trustafarians | 5% | 500,000 | 525,000 | 551,250 | 578,813 | 607,754 | 5.00% |
| Other | 0% | 0 | 0 | 0 | 0 | 0 | 0.00% |
| Total | 10.19% | 1,800,000 | 1,981,000 | 2,181,970 | 2,405,219 | 2,653,329 | 10.19% |
4.2 Target Market Segment Strategy
AEU will promote/position itself as a differentiated provider of luxury hard-adventure travel, and will price accordingly within the chosen service niche.
AEU is targeting this special population for several reasons:
- This segment, up until now, has been underserved.
- This market segment traditionally spends a fair amount of money on adventure trips.
- This target segment seems to be willing to pay a premium for a top-shelf adventure excursion.
Methods of communication will include direct mail, magazine advertising, personal selling and WWW presence. Continuous magazine advertising will be costly. Initially the use of direct mail, and personal selling will be employed. These methods of communication will be tailored to reach our target segment.
4.3 Service Business Analysis
As operations progress, AEU will continue to measure our progress relative to competitors and to the growth of the market(s) in which we operate. Though the primary target market has been defined, there may be new possibilities to serve additional segments. As the product is defined, and the strategy differentiation is defined based on competitive strengths, AEU will be better able to determine whether adjustments in positioning are necessary. Access to important information concerning the market, competitors, etc., is available. However it is not free. For the purposes of this project, we feel it is unnecessary to incur additional expense.
The marketing strategy will be to develop long-term relationships with customers. We will keep a database from which to obtain important demographic and psychographic information. As the business becomes profitable, plans will be implemented to expand. There is virtually no limit to the number and variety of trips AEU can provide. Trips can take place on every continent and in most countries. The goal is to establish AEU as an international provider of top-of-the-line hard-adventure travel.
4.3.1 Competition and Buying Patterns
Strengths and weaknesses of the competitors:
The competitors in this market are of two primary types. First there is the adventure provider who specializes in a single type of hard-adventure activity such as white-water rafting. They typically serve clients who purchase trips for less than $2,000 (and closer to the mean purchase price of around $900). Their strength is their expertise in a given sport. Their weakness is that they provide an undifferentiated product in a competitive market. In addition, they do not have the resources, ability or desire to target and/or accommodate a customer demanding more accommodation and a more luxury/adventure-oriented service.
Companies that offer higher-priced, more luxurious packages generally provide a “soft” adventure. The activities are more along the lines of sightseeing and low-risk alternatives. The advantages these companies have include established reputations, extensive knowledge of the industry, and key personnel and management. Some have been in operation for more than twenty years. They are familiar with local service providers and have established strategic relationships.
Disadvantages to us:
- It will be difficult to price ourselves competitively when we first enter the market.
- Many of AEU’s activities are seasonal. Recurring revenue will depend upon successful trips in various regions of the world. For example, ski trips will end in April in North America. AEU will then have to move ski operations to places like Las Lenas, Argentina.
- The weather for a given year is hard to predict. Poor conditions will threaten the success of trips. Unforeseen occurrences such as inadequate snowfall could effect the viability of activities such as skiing and white-water sports.
Closely related competitors:
Abercrombie & Kent: A well-established, international travel provider. Their focus is mainly on “soft” adventure packages such as safaris, river tours (e.g. Amazon), trekking, sightseeing, etc. However they do offer a “Connoisseur” line of packages. These are generally priced starting from $4,000-7,000. Some of their packages include white-water activities and hiking, however most are touring packages.
Competing or substitute products:
There are many activities and types of travel available to people contemplating a vacation. Theme parks, motorhome trips, and cruises are just a few. Substitutes could include less expensive, self-planned trips, trips geared towards soft-travel, adventure trips involving hunting or fishing as primary activities, or exclusive adventure trips such as personal submarine tours of the Titanic or a trip around the world in a Leer Jet. Many activities that take place outside and involve some level of risk could be seen as hard-adventure competition.
Another alternative is to do nothing. Consumers do not have to vacation. They may opt to spend the money they would have otherwise spent on a vacation on something else.
Strategy and Implementation Summary
Adventure Excursions Unlimited will be going after the upper-end of the hard-adventure market. This market up until now has been underserved, there are hard-adventure tour companies, but none that are catering to the high-end spectrum. With the adventuring traveling industry steadily increasing, AEU sees a unique opportunity.
AEU’s main objective in its marketing and sales activity is to make the impression on prospective customers that AEU offers a higher level of service relative to any other provider of hard-adventure tours. This will be communicated through all of the different media that we use. If AEU can make the impression that our trips are truly different and superior, then our research indicates that there will be steady demand.
Once AEU has clients signed up and participating on our trips, it will rely on superior customer attention and service to impress and retain clients for future trips. Developing long-term relationships will be the key to steady growth.
5.1 Competitive Edge
The competitive edge in our services is the access we provide to popular “hard” adventure sports without the budget constraint of typical travelers. That is, most travelers are looking to spend less than “hard” adventure sports without the budget constraint of typical travelers. The majority of providers cater to these people. Adventure Excursions Unlimited intends to use the same service providers but provide more exclusive trips. Accommodations will be primarily in small luxury hotels and resorts. Meals will be exceptional, more like gourmet cuisine. In addition, the adventure activities will be better than average because the clients have more money. They won’t get stuck with people they don’t like; they will get access to the best terrain, sections of rivers, etc. AEU’s activities are very popular. AEU’s target market has no problem spending $4,000 per week on heli-skiing. Moreover, they generally make this type of activity an annual event.
5.2 Sales Strategy
The sales strategy is to create long-term relationships with customers through superior service. The intent is to initially target the primary customer group. This group has been defined as persons who have purchased, or are likely to purchase, a “hard-adventure” vacation for over $2,500.
The trips planned are designed with the wealthy adventure traveler in mind. Later marketing efforts may include trips geared towards corporate clients, Eco-tourism or hard-adventure trips for people who want to spend less money. Target customers will be identified through standard research methods. There are a number of publications available that contain profiles of Adventure travelers.
Methods by which we will contact customers will depend on results of marketing/sales research. We will likely use trade or special interest magazines, direct mail, Web-based communication, and personal selling. In addition printed materials will be made available to customers through travel agencies that cater to the adventure target market. Initially, service will be introduced regionally, and possibly nationally. Sales will be extended into the global market within a few years of operation.
Our services are seasonal. Recurring revenue will be dependent upon successful trips involving a variety of activities offered year-round. We hope to promote out of season services through frequent customer contact and our own publication, most likely a magazine of some sort. We will review up-and-coming trips, offer highlights of past trips and try to do other creative articles, giveaways, customer profiles, etc.
Most sales will occur at the retail level. The sales that occur between customers and travel agencies will be discounted appropriately, approximately 15%. Transactions will occur as the result of customer contact in response to communication efforts. In addition, AEU will engage in personal selling.
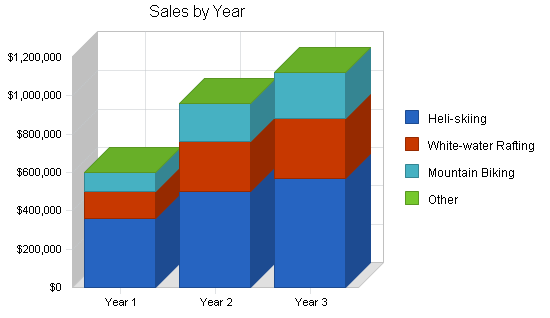
5.2.1 Sales Forecast
The following charts and table shows AEU’s expected sales forecast.

| Sales Forecast | |||
| Year 1 | Year 2 | Year 3 | |
| Sales | |||
| Heli-skiing | $360,000 | $500,000 | $570,000 |
| White-water Rafting | $140,000 | $260,000 | $310,000 |
| Mountain Biking | $100,000 | $200,000 | $240,000 |
| Other | $0 | $0 | $0 |
| Total Sales | $600,000 | $960,000 | $1,120,000 |
| Direct Cost of Sales | Year 1 | Year 2 | Year 3 |
| Heli-skiing | $0 | $0 | $0 |
| White-water Rafting | $40,000 | $70,000 | $78,000 |
| Mountain Biking | $28,000 | $50,000 | $64,000 |
| Other | $0 | $0 | $0 |
| Subtotal Direct Cost of Sales | $68,000 | $120,000 | $142,000 |
5.3 Milestones
Adventure Excursions Unlimited will have several milestones early on:
- Business plan completion. This will serve as a roadmap for the organization. While AEU does not need a business plan to raise capital, it will be an indispensable tool for the ongoing performance and improvement of the company.
- Set up the office. This will be the main/only office located in Eugene, OR.
- Develop the training program. This program will be used to train the leaders of our trips.
- Completion of first trip.
- Completion of twentieth trip.

| Milestones | |||||
| Milestone | Start Date | End Date | Budget | Manager | Department |
| Business Plan Completion | 1/1/2001 | 1/21/2001 | $0 | Jordan | Marketing |
| Office Set-up | 1/1/2001 | 2/1/2001 | $0 | Jillyn | Department |
| Develop Leadership Training Program | 2/1/2001 | 3/1/2001 | $0 | Jordan | Department |
| Completion of First Trip | 4/1/2001 | 5/1/2001 | $0 | Loren | Department |
| Completion of 20th Trip | 4/1/2002 | 5/1/2002 | $0 | Loren | Department |
| Totals | $0 | ||||
Management Summary
The three founders of AEU are Jordan Stephan, Jillyn Certo, and Loren Harlo. They will occupy management roles within AEU, as well as being the specialist in at least one type of hard-adventure activity and being responsible for the management and operation of key functional areas.
Jordan Stephan, VP, Corporate Council, Business Development, and Mountain Biking Activity Supervisor: Jordan received his Bachelor of Arts in philosophy from Washington and Jefferson College in Washington, PA. While there, he was president of the Washington and Jefferson Cycling Club and Team for two years. He completed his Master of Business Management/Doctor of Jurisprudence, joint degree program at Willamette University where he has served as the secretary of the Environmental Law Society, and chairperson for the Willamette University Public Interest Law Project (WUPILP). As chairperson, Jordan supervised twenty-five staff members and raised $14,000. Jordan has also managed a bicycle shop for two years. Following graduate school, Jordan worked for Counterclaim.com where Jordan did business development, organizational development, and other management activities. He is responsible for all logistics on the mountain bike trips.
Jordan’s expertise in mountain bike trip logistics comes from years of cycle touring. Jordan has cycled across the country and around the Upper Peninsula of Michigan and Vermont. Jordan has also done a great deal of backpacking, backcountry hiking and snowshoeing. He has served as a consultant on many long-distance bicycle tours in the United States and abroad. In addition to his role as logistical planner, Jordan will be responsible for part-manufacturing for the mountain bike trips as he has manufacturing expertise from several years of design and improvement experience with outdoor gear.
Jordan’s extra curricular activities are based upon his love for the outdoors. He has been a competitive cyclist and runner for the last five years. He competes in cycling road races, endurance mountain bike races, and road/trail running races up to half-marathons. His current favorite activity is the duathlon or run/bike/run events. He would like to combine his experience and education with his love for the outdoors. The AEU business concept is a reflection of this desire.
Jillyn Certo, VP, Human Resource Manager/Corporate Trainer, and Ski-trip Coordinator: Jillyn graduated with two Bachelor of Science Degrees, one in corporate and industrial fitness and the other in occupational safety, from Oregon State University in 1991. Jillyn completed her MBA work at Atkinson Graduate School of Management in 1998. She has six years experience in the field of safety. After Atkinson Jillyn worked at Nike as a human resource specialist. Her interests include scuba diving and downhill skiing. Jillyn has competed in track & field as well as in horse shows and barrel racing. Along with her interest in sports, Jillyn has a variety of experience with business and pleasure travel. Jillyn will supervise the training of our leaders.
Loren Harlo, Marketing Manager and White-water Adventure Coordinator: Loren is twenty-seven years old. He received his Bachelor degree in psychology from Western College and graduated Magna cum Laude. He will complete his Master of Business Administration degree (with an emphasis in marketing) in 1998. Following graduate school, Loren worked for Burley Cooperative as a marketing manager. Loren has been active in athletics for twenty-years. He played football at the grade school, high school and college level, as well as basketball, track and field, and competition karate. He is an avid outdoorsman with a passion for water sports, skiing, hiking, hunting and fishing. He has recently taken up kayaking. Loren gained self-employment and management experience as an independent contractor for the Union Pacific Railroad. He has also managed and operated a small restaurant. He has always planned to own his own business and realized, while working independently, that he needed the knowledge of business management that an MBA program could provide.
Though the founding members intend to take an active role in the operation of AEU, additional management will be sought out. AEU is open to assistance from experienced managers associated with venture capital providers.
6.1 Personnel Plan
The following table shows the personnel plan for AEU.
| Personnel Plan | |||
| Year 1 | Year 2 | Year 3 | |
| Jordan Stephan | $30,000 | $30,000 | $30,000 |
| Jillyn Certo | $30,000 | $30,000 | $30,000 |
| Loren Harlo | $30,000 | $30,000 | $30,000 |
| Mountain Bike Trip Personnel | $70,000 | $150,000 | $170,000 |
| Heli-skiing Personnel | $120,000 | $170,000 | $200,000 |
| White-water Adventure Personnel | $70,000 | $125,000 | $155,000 |
| Secretary | $18,000 | $0 | $0 |
| Total People | 4 | 19 | 19 |
| Total Payroll | $368,000 | $535,000 | $615,000 |
Financial Plan
The following subtopics will provide more financial information.
7.1 Projected Cash Flow
The following chart and table indicates projected cash flow.

| Pro Forma Cash Flow | |||
| Year 1 | Year 2 | Year 3 | |
| Cash Received | |||
| Cash from Operations | |||
| Cash Sales | $600,000 | $960,000 | $1,120,000 |
| Subtotal Cash from Operations | $600,000 | $960,000 | $1,120,000 |
| Additional Cash Received | |||
| Sales Tax, VAT, HST/GST Received | $0 | $0 | $0 |
| New Current Borrowing | $0 | $0 | $0 |
| New Other Liabilities (interest-free) | $0 | $0 | $0 |
| New Long-term Liabilities | $0 | $0 | $0 |
| Sales of Other Current Assets | $0 | $0 | $0 |
| Sales of Long-term Assets | $0 | $0 | $0 |
| New Investment Received | $0 | $0 | $0 |
| Subtotal Cash Received | $600,000 | $960,000 | $1,120,000 |
| Expenditures | Year 1 | Year 2 | Year 3 |
| Expenditures from Operations | |||
| Cash Spending | $368,000 | $535,000 | $615,000 |
| Bill Payments | $168,145 | $245,468 | $305,745 |
| Subtotal Spent on Operations | $536,145 | $780,468 | $920,745 |
| Additional Cash Spent | |||
| Sales Tax, VAT, HST/GST Paid Out | $0 | $0 | $0 |
| Principal Repayment of Current Borrowing | $0 | $0 | $0 |
| Other Liabilities Principal Repayment | $0 | $0 | $0 |
| Long-term Liabilities Principal Repayment | $0 | $0 | $0 |
| Purchase Other Current Assets | $0 | $0 | $0 |
| Purchase Long-term Assets | $0 | $0 | $0 |
| Dividends | $0 | $0 | $0 |
| Subtotal Cash Spent | $536,145 | $780,468 | $920,745 |
| Net Cash Flow | $63,855 | $179,532 | $199,255 |
| Cash Balance | $108,455 | $287,987 | $487,243 |
7.2 Important Assumptions
See the following table for general assumptions.
| General Assumptions | |||
| Year 1 | Year 2 | Year 3 | |
| Plan Month | 1 | 2 | 3 |
| Current Interest Rate | 10.00% | 10.00% | 10.00% |
| Long-term Interest Rate | 10.00% | 10.00% | 10.00% |
| Tax Rate | 25.42% | 25.00% | 25.42% |
| Other | 0 | 0 | 0 |
7.3 Break-even Analysis
This Break-even Analysis table and chart, below, project the figures for monthly sales break even.

| Break-even Analysis | |
| Monthly Revenue Break-even | $43,114 |
| Assumptions: | |
| Average Percent Variable Cost | 11% |
| Estimated Monthly Fixed Cost | $38,228 |
7.4 Projected Profit and Loss
The following table indicates the projected profit and loss.


| Pro Forma Profit and Loss | |||
| Year 1 | Year 2 | Year 3 | |
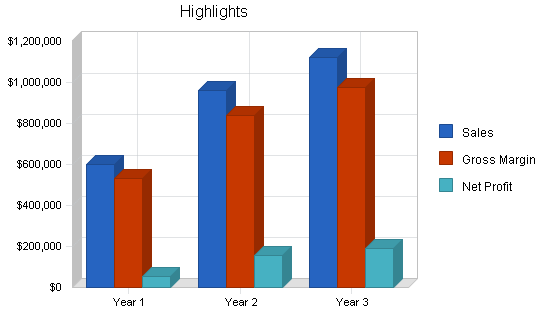
| Sales | $600,000 | $960,000 | $1,120,000 |
| Direct Cost of Sales | $68,000 | $120,000 | $142,000 |
| Other | $0 | $0 | $0 |
| Total Cost of Sales | $68,000 | $120,000 | $142,000 |
| Gross Margin | $532,000 | $840,000 | $978,000 |
| Gross Margin % | 88.67% | 87.50% | 87.32% |
| Expenses | |||
| Payroll | $368,000 | $535,000 | $615,000 |
| Sales and Marketing and Other Expenses | $21,000 | $0 | $0 |
| Depreciation | $4,332 | $4,332 | $4,332 |
| Leased Equipment | $0 | $0 | $0 |
| Utilities | $0 | $0 | $0 |
| Insurance | $4,800 | $4,800 | $4,800 |
| Rent | $5,400 | $5,400 | $5,400 |
| Payroll Taxes | $55,200 | $80,250 | $92,250 |
| Other | $0 | $0 | $0 |
| Total Operating Expenses | $458,732 | $629,782 | $721,782 |
| Profit Before Interest and Taxes | $73,268 | $210,218 | $256,218 |
| EBITDA | $77,600 | $214,550 | $260,550 |
| Interest Expense | $0 | $0 | $0 |
| Taxes Incurred | $17,825 | $52,555 | $65,122 |
| Net Profit | $55,443 | $157,664 | $191,096 |
| Net Profit/Sales | 9.24% | 16.42% | 17.06% |
7.5 Projected Balance Sheet
The following table will indicate the projected balance sheet.
| Pro Forma Balance Sheet | |||
| Year 1 | Year 2 | Year 3 | |
| Assets | |||
| Current Assets | |||
| Cash | $108,455 | $287,987 | $487,243 |
| Other Current Assets | $0 | $0 | $0 |
| Total Current Assets | $108,455 | $287,987 | $487,243 |
| Long-term Assets | |||
| Long-term Assets | $13,000 | $13,000 | $13,000 |
| Accumulated Depreciation | $4,332 | $8,664 | $12,996 |
| Total Long-term Assets | $8,668 | $4,336 | $4 |
| Total Assets | $117,123 | $292,323 | $487,247 |
| Liabilities and Capital | Year 1 | Year 2 | Year 3 |
| Current Liabilities | |||
| Accounts Payable | $4,080 | $21,617 | $25,444 |
| Current Borrowing | $0 | $0 | $0 |
| Other Current Liabilities | $0 | $0 | $0 |
| Subtotal Current Liabilities | $4,080 | $21,617 | $25,444 |
| Long-term Liabilities | $0 | $0 | $0 |
| Total Liabilities | $4,080 | $21,617 | $25,444 |
| Paid-in Capital | $60,000 | $60,000 | $60,000 |
| Retained Earnings | ($2,400) | $53,043 | $210,706 |
| Earnings | $55,443 | $157,664 | $191,096 |
| Total Capital | $113,043 | $270,706 | $461,802 |
| Total Liabilities and Capital | $117,123 | $292,323 | $487,247 |
| Net Worth | $113,043 | $270,706 | $461,802 |
7.6 Business Ratios
Business ratios for the years of this plan are shown below. Industry profile ratios based on the Standard Industrial Classification (SIC) code 4725, Tour Operators, are shown for comparison.
| Ratio Analysis | ||||
| Year 1 | Year 2 | Year 3 | Industry Profile | |
| Sales Growth | 0.00% | 60.00% | 16.67% | 4.00% |
| Percent of Total Assets | ||||
| Other Current Assets | 0.00% | 0.00% | 0.00% | 42.80% |
| Total Current Assets | 92.60% | 98.52% | 100.00% | 65.80% |
| Long-term Assets | 7.40% | 1.48% | 0.00% | 34.20% |
| Total Assets | 100.00% | 100.00% | 100.00% | 100.00% |
| Current Liabilities | 3.48% | 7.39% | 5.22% | 33.10% |
| Long-term Liabilities | 0.00% | 0.00% | 0.00% | 16.40% |
| Total Liabilities | 3.48% | 7.39% | 5.22% | 49.50% |
| Net Worth | 96.52% | 92.61% | 94.78% | 50.50% |
| Percent of Sales | ||||
| Sales | 100.00% | 100.00% | 100.00% | 100.00% |
| Gross Margin | 88.67% | 87.50% | 87.32% | 40.10% |
| Selling, General & Administrative Expenses | 79.51% | 71.08% | 70.16% | 30.80% |
| Advertising Expenses | 0.00% | 0.00% | 0.00% | 0.80% |
| Profit Before Interest and Taxes | 12.21% | 21.90% | 22.88% | 1.20% |
| Main Ratios | ||||
| Current | 26.58 | 13.32 | 19.15 | 1.66 |
| Quick | 26.58 | 13.32 | 19.15 | 1.29 |
| Total Debt to Total Assets | 3.48% | 7.39% | 5.22% | 49.50% |
| Pre-tax Return on Net Worth | 64.81% | 77.66% | 55.48% | 2.70% |
| Pre-tax Return on Assets | 62.56% | 71.91% | 52.58% | 5.30% |
| Additional Ratios | Year 1 | Year 2 | Year 3 | |
| Net Profit Margin | 9.24% | 16.42% | 17.06% | n.a |
| Return on Equity | 49.05% | 58.24% | 41.38% | n.a |
| Activity Ratios | ||||
| Accounts Payable Turnover | 42.21 | 12.17 | 12.17 | n.a |
| Payment Days | 33 | 18 | 28 | n.a |
| Total Asset Turnover | 5.12 | 3.28 | 2.30 | n.a |
| Debt Ratios | ||||
| Debt to Net Worth | 0.04 | 0.08 | 0.06 | n.a |
| Current Liab. to Liab. | 1.00 | 1.00 | 1.00 | n.a |
| Liquidity Ratios | ||||
| Net Working Capital | $104,375 | $266,370 | $461,798 | n.a |
| Interest Coverage | 0.00 | 0.00 | 0.00 | n.a |
| Additional Ratios | ||||
| Assets to Sales | 0.20 | 0.30 | 0.44 | n.a |
| Current Debt/Total Assets | 3% | 7% | 5% | n.a |
| Acid Test | 26.58 | 13.32 | 19.15 | n.a |
| Sales/Net Worth | 5.31 | 3.55 | 2.43 | n.a |
| Dividend Payout | 0.00 | 0.00 | 0.00 | n.a |
Appendix
| Sales Forecast | |||||||||||||
| Month 1 | Month 2 | Month 3 | Month 4 | Month 5 | Month 6 | Month 7 | Month 8 | Month 9 | Month 10 | Month 11 | Month 12 | ||
| Sales | |||||||||||||
| Heli-skiing | 0% | $0 | $0 | $0 | $0 | $0 | $120,000 | $0 | $0 | $120,000 | $120,000 | $0 | $0 |
| White-water Rafting | 0% | $0 | $0 | $0 | $0 | $0 | $0 | $0 | $70,000 | $0 | $70,000 | $0 | $0 |
| Mountain Biking | 0% | $0 | $0 | $0 | $0 | $0 | $0 | $50,000 | $50,000 | $0 | $0 | $0 | $0 |
| Other | 0% | $0 | $0 | $0 | $0 | $0 | $0 | $0 | $0 | $0 | $0 | $0 | $0 |
| Total Sales | $0 | $0 | $0 | $0 | $0 | $120,000 | $50,000 | $120,000 | $120,000 | $190,000 | $0 | $0 | |
| Direct Cost of Sales | Month 1 | Month 2 | Month 3 | Month 4 | Month 5 | Month 6 | Month 7 | Month 8 | Month 9 | Month 10 | Month 11 | Month 12 | |
| Heli-skiing | $0 | $0 | $0 | $0 | $0 | $0 | $0 | $0 | $0 | $0 | $0 | $0 | |
| White-water Rafting | $0 | $0 | $0 | $0 | $0 | $0 | $0 | $20,000 | $0 | $20,000 | $0 | $0 | |
| Mountain Biking | $0 | $0 | $0 | $0 | $0 | $0 | $14,000 | $14,000 | $0 | $0 | $0 | $0 | |
| Other | $0 | $0 | $0 | $0 | $0 | $0 | $0 | $0 | $0 | $0 | $0 | $0 | |
| Subtotal Direct Cost of Sales | $0 | $0 | $0 | $0 | $0 | $0 | $14,000 | $34,000 | $0 | $20,000 | $0 | $0 | |
| Personnel Plan | |||||||||||||
| Month 1 | Month 2 | Month 3 | Month 4 | Month 5 | Month 6 | Month 7 | Month 8 | Month 9 | Month 10 | Month 11 | Month 12 | ||
| Jordan Stephan | 0% | $2,500 | $2,500 | $2,500 | $2,500 | $2,500 | $2,500 | $2,500 | $2,500 | $2,500 | $2,500 | $2,500 | $2,500 |
| Jillyn Certo | 0% | $2,500 | $2,500 | $2,500 | $2,500 | $2,500 | $2,500 | $2,500 | $2,500 | $2,500 | $2,500 | $2,500 | $2,500 |
| Loren Harlo | 0% | $2,500 | $2,500 | $2,500 | $2,500 | $2,500 | $2,500 | $2,500 | $2,500 | $2,500 | $2,500 | $2,500 | $2,500 |
| Mountain Bike Trip Personnel | 0% | $0 | $0 | $0 | $0 | $0 | $0 | $35,000 | $35,000 | $0 | $0 | $0 | $0 |
| Heli-skiing Personnel | 0% | $0 | $0 | $0 | $0 | $0 | $40,000 | $0 | $0 | $40,000 | $40,000 | $0 | $0 |
| White-water Adventure Personnel | 0% | $0 | $0 | $0 | $0 | $0 | $0 | $0 | $35,000 | $0 | $35,000 | $0 | $0 |
| Secretary | 0% | $0 | $0 | $0 | $2,000 | $2,000 | $2,000 | $2,000 | $2,000 | $2,000 | $2,000 | $2,000 | $2,000 |
| Total People | 3 | 3 | 3 | 4 | 4 | 9 | 9 | 14 | 9 | 14 | 4 | 4 | |
| Total Payroll | $7,500 | $7,500 | $7,500 | $9,500 | $9,500 | $49,500 | $44,500 | $79,500 | $49,500 | $84,500 | $9,500 | $9,500 | |
| General Assumptions | |||||||||||||
| Month 1 | Month 2 | Month 3 | Month 4 | Month 5 | Month 6 | Month 7 | Month 8 | Month 9 | Month 10 | Month 11 | Month 12 | ||
| Plan Month | 1 | 2 | 3 | 4 | 5 | 6 | 7 | 8 | 9 | 10 | 11 | 12 | |
| Current Interest Rate | 10.00% | 10.00% | 10.00% | 10.00% | 10.00% | 10.00% | 10.00% | 10.00% | 10.00% | 10.00% | 10.00% | 10.00% | |
| Long-term Interest Rate | 10.00% | 10.00% | 10.00% | 10.00% | 10.00% | 10.00% | 10.00% | 10.00% | 10.00% | 10.00% | 10.00% | 10.00% | |
| Tax Rate | 30.00% | 25.00% | 25.00% | 25.00% | 25.00% | 25.00% | 25.00% | 25.00% | 25.00% | 25.00% | 25.00% | 25.00% | |
| Other | 0 | 0 | 0 | 0 | 0 | 0 | 0 | 0 | 0 | 0 | 0 | 0 | |
| Pro Forma Profit and Loss | |||||||||||||
| Month 1 | Month 2 | Month 3 | Month 4 | Month 5 | Month 6 | Month 7 | Month 8 | Month 9 | Month 10 | Month 11 | Month 12 | ||
| Sales | $0 | $0 | $0 | $0 | $0 | $120,000 | $50,000 | $120,000 | $120,000 | $190,000 | $0 | $0 | |
| Direct Cost of Sales | $0 | $0 | $0 | $0 | $0 | $0 | $14,000 | $34,000 | $0 | $20,000 | $0 | $0 | |
| Other | $0 | $0 | $0 | $0 | $0 | $0 | $0 | $0 | $0 | $0 | $0 | $0 | |
| Total Cost of Sales | $0 | $0 | $0 | $0 | $0 | $0 | $14,000 | $34,000 | $0 | $20,000 | $0 | $0 | |
| Gross Margin | $0 | $0 | $0 | $0 | $0 | $120,000 | $36,000 | $86,000 | $120,000 | $170,000 | $0 | $0 | |
| Gross Margin % | 0.00% | 0.00% | 0.00% | 0.00% | 0.00% | 100.00% | 72.00% | 71.67% | 100.00% | 89.47% | 0.00% | 0.00% | |
| Expenses | |||||||||||||
| Payroll | $7,500 | $7,500 | $7,500 | $9,500 | $9,500 | $49,500 | $44,500 | $79,500 | $49,500 | $84,500 | $9,500 | $9,500 | |
| Sales and Marketing and Other Expenses | $0 | $0 | $0 | $0 | $0 | $5,000 | $1,500 | $3,000 | $5,000 | $6,500 | $0 | $0 | |
| Depreciation | $361 | $361 | $361 | $361 | $361 | $361 | $361 | $361 | $361 | $361 | $361 | $361 | |
| Leased Equipment | $0 | $0 | $0 | $0 | $0 | $0 | $0 | $0 | $0 | $0 | $0 | $0 | |
| Utilities | $0 | $0 | $0 | $0 | $0 | $0 | $0 | $0 | $0 | $0 | $0 | $0 | |
| Insurance | $400 | $400 | $400 | $400 | $400 | $400 | $400 | $400 | $400 | $400 | $400 | $400 | |
| Rent | $450 | $450 | $450 | $450 | $450 | $450 | $450 | $450 | $450 | $450 | $450 | $450 | |
| Payroll Taxes | 15% | $1,125 | $1,125 | $1,125 | $1,425 | $1,425 | $7,425 | $6,675 | $11,925 | $7,425 | $12,675 | $1,425 | $1,425 |
| Other | $0 | $0 | $0 | $0 | $0 | $0 | $0 | $0 | $0 | $0 | $0 | $0 | |
| Total Operating Expenses | $9,836 | $9,836 | $9,836 | $12,136 | $12,136 | $63,136 | $53,886 | $95,636 | $63,136 | $104,886 | $12,136 | $12,136 | |
| Profit Before Interest and Taxes | ($9,836) | ($9,836) | ($9,836) | ($12,136) | ($12,136) | $56,864 | ($17,886) | ($9,636) | $56,864 | $65,114 | ($12,136) | ($12,136) | |
| EBITDA | ($9,475) | ($9,475) | ($9,475) | ($11,775) | ($11,775) | $57,225 | ($17,525) | ($9,275) | $57,225 | $65,475 | ($11,775) | ($11,775) | |
| Interest Expense | $0 | $0 | $0 | $0 | $0 | $0 | $0 | $0 | $0 | $0 | $0 | $0 | |
| Taxes Incurred | ($2,951) | ($2,459) | ($2,459) | ($3,034) | ($3,034) | $14,216 | ($4,472) | ($2,409) | $14,216 | $16,279 | ($3,034) | ($3,034) | |
| Net Profit | ($6,885) | ($7,377) | ($7,377) | ($9,102) | ($9,102) | $42,648 | ($13,415) | ($7,227) | $42,648 | $48,836 | ($9,102) | ($9,102) | |
| Net Profit/Sales | 0.00% | 0.00% | 0.00% | 0.00% | 0.00% | 35.54% | -26.83% | -6.02% | 35.54% | 25.70% | 0.00% | 0.00% | |
| Pro Forma Cash Flow | |||||||||||||
| Month 1 | Month 2 | Month 3 | Month 4 | Month 5 | Month 6 | Month 7 | Month 8 | Month 9 | Month 10 | Month 11 | Month 12 | ||
| Cash Received | |||||||||||||
| Cash from Operations | |||||||||||||
| Cash Sales | $0 | $0 | $0 | $0 | $0 | $120,000 | $50,000 | $120,000 | $120,000 | $190,000 | $0 | $0 | |
| Subtotal Cash from Operations | $0 | $0 | $0 | $0 | $0 | $120,000 | $50,000 | $120,000 | $120,000 | $190,000 | $0 | $0 | |
| Additional Cash Received | |||||||||||||
| Sales Tax, VAT, HST/GST Received | 0.00% | $0 | $0 | $0 | $0 | $0 | $0 | $0 | $0 | $0 | $0 | $0 | $0 |
| New Current Borrowing | $0 | $0 | $0 | $0 | $0 | $0 | $0 | $0 | $0 | $0 | $0 | $0 | |
| New Other Liabilities (interest-free) | $0 | $0 | $0 | $0 | $0 | $0 | $0 | $0 | $0 | $0 | $0 | $0 | |
| New Long-term Liabilities | $0 | $0 | $0 | $0 | $0 | $0 | $0 | $0 | $0 | $0 | $0 | $0 | |
| Sales of Other Current Assets | $0 | $0 | $0 | $0 | $0 | $0 | $0 | $0 | $0 | $0 | $0 | $0 | |
| Sales of Long-term Assets | $0 | $0 | $0 | $0 | $0 | $0 | $0 | $0 | $0 | $0 | $0 | $0 | |
| New Investment Received | $0 | $0 | $0 | $0 | $0 | $0 | $0 | $0 | $0 | $0 | $0 | $0 | |
| Subtotal Cash Received | $0 | $0 | $0 | $0 | $0 | $120,000 | $50,000 | $120,000 | $120,000 | $190,000 | $0 | $0 | |
| Expenditures | Month 1 | Month 2 | Month 3 | Month 4 | Month 5 | Month 6 | Month 7 | Month 8 | Month 9 | Month 10 | Month 11 | Month 12 | |
| Expenditures from Operations | |||||||||||||
| Cash Spending | $7,500 | $7,500 | $7,500 | $9,500 | $9,500 | $49,500 | $44,500 | $79,500 | $49,500 | $84,500 | $9,500 | $9,500 | |
| Bill Payments | ($976) | ($1,427) | ($952) | ($1,227) | ($1,493) | $183 | $27,193 | $19,514 | $46,704 | $28,451 | $53,668 | ($1,493) | |
| Subtotal Spent on Operations | $6,524 | $6,073 | $6,548 | $8,273 | $8,007 | $49,683 | $71,693 | $99,014 | $96,204 | $112,951 | $63,168 | $8,007 | |
| Additional Cash Spent | |||||||||||||
| Sales Tax, VAT, HST/GST Paid Out | $0 | $0 | $0 | $0 | $0 | $0 | $0 | $0 | $0 | $0 | $0 | $0 | |
| Principal Repayment of Current Borrowing | $0 | $0 | $0 | $0 | $0 | $0 | $0 | $0 | $0 | $0 | $0 | $0 | |
| Other Liabilities Principal Repayment | $0 | $0 | $0 | $0 | $0 | $0 | $0 | $0 | $0 | $0 | $0 | $0 | |
| Long-term Liabilities Principal Repayment | $0 | $0 | $0 | $0 | $0 | $0 | $0 | $0 | $0 | $0 | $0 | $0 | |
| Purchase Other Current Assets | $0 | $0 | $0 | $0 | $0 | $0 | $0 | $0 | $0 | $0 | $0 | $0 | |
| Purchase Long-term Assets | $0 | $0 | $0 | $0 | $0 | $0 | $0 | $0 | $0 | $0 | $0 | $0 | |
| Dividends | $0 | $0 | $0 | $0 | $0 | $0 | $0 | $0 | $0 | $0 | $0 | $0 | |
| Subtotal Cash Spent | $6,524 | $6,073 | $6,548 | $8,273 | $8,007 | $49,683 | $71,693 | $99,014 | $96,204 | $112,951 | $63,168 | $8,007 | |
| Net Cash Flow | ($6,524) | ($6,073) | ($6,548) | ($8,273) | ($8,007) | $70,317 | ($21,693) | $20,986 | $23,797 | $77,049 | ($63,168) | ($8,007) | |
| Cash Balance | $38,076 | $32,003 | $25,455 | $17,182 | $9,175 | $79,492 | $57,799 | $78,785 | $102,581 | $179,630 | $116,462 | $108,455 | |
| Pro Forma Balance Sheet | |||||||||||||
| Month 1 | Month 2 | Month 3 | Month 4 | Month 5 | Month 6 | Month 7 | Month 8 | Month 9 | Month 10 | Month 11 | Month 12 | ||
| Assets | Starting Balances | ||||||||||||
| Current Assets | |||||||||||||
| Cash | $44,600 | $38,076 | $32,003 | $25,455 | $17,182 | $9,175 | $79,492 | $57,799 | $78,785 | $102,581 | $179,630 | $116,462 | $108,455 |
| Other Current Assets | $0 | $0 | $0 | $0 | $0 | $0 | $0 | $0 | $0 | $0 | $0 | $0 | $0 |
| Total Current Assets | $44,600 | $38,076 | $32,003 | $25,455 | $17,182 | $9,175 | $79,492 | $57,799 | $78,785 | $102,581 | $179,630 | $116,462 | $108,455 |
| Long-term Assets | |||||||||||||
| Long-term Assets | $13,000 | $13,000 | $13,000 | $13,000 | $13,000 | $13,000 | $13,000 | $13,000 | $13,000 | $13,000 | $13,000 | $13,000 | $13,000 |
| Accumulated Depreciation | $0 | $361 | $722 | $1,083 | $1,444 | $1,805 | $2,166 | $2,527 | $2,888 | $3,249 | $3,610 | $3,971 | $4,332 |
| Total Long-term Assets | $13,000 | $12,639 | $12,278 | $11,917 | $11,556 | $11,195 | $10,834 | $10,473 | $10,112 | $9,751 | $9,390 | $9,029 | $8,668 |
| Total Assets | $57,600 | $50,715 | $44,281 | $37,372 | $28,738 | $20,370 | $90,326 | $68,272 | $88,897 | $112,332 | $189,020 | $125,491 | $117,123 |
| Liabilities and Capital | Month 1 | Month 2 | Month 3 | Month 4 | Month 5 | Month 6 | Month 7 | Month 8 | Month 9 | Month 10 | Month 11 | Month 12 | |
| Current Liabilities | |||||||||||||
| Accounts Payable | $0 | $0 | $943 | $1,411 | $1,879 | $2,613 | $29,921 | $21,281 | $49,134 | $29,921 | $57,773 | $3,346 | $4,080 |
| Current Borrowing | $0 | $0 | $0 | $0 | $0 | $0 | $0 | $0 | $0 | $0 | $0 | $0 | $0 |
| Other Current Liabilities | $0 | $0 | $0 | $0 | $0 | $0 | $0 | $0 | $0 | $0 | $0 | $0 | $0 |
| Subtotal Current Liabilities | $0 | $0 | $943 | $1,411 | $1,879 | $2,613 | $29,921 | $21,281 | $49,134 | $29,921 | $57,773 | $3,346 | $4,080 |
| Long-term Liabilities | $0 | $0 | $0 | $0 | $0 | $0 | $0 | $0 | $0 | $0 | $0 | $0 | $0 |
| Total Liabilities | $0 | $0 | $943 | $1,411 | $1,879 | $2,613 | $29,921 | $21,281 | $49,134 | $29,921 | $57,773 | $3,346 | $4,080 |
| Paid-in Capital | $60,000 | $60,000 | $60,000 | $60,000 | $60,000 | $60,000 | $60,000 | $60,000 | $60,000 | $60,000 | $60,000 | $60,000 | $60,000 |
| Retained Earnings | ($2,400) | ($2,400) | ($2,400) | ($2,400) | ($2,400) | ($2,400) | ($2,400) | ($2,400) | ($2,400) | ($2,400) | ($2,400) | ($2,400) | ($2,400) |
| Earnings | $0 | ($6,885) | ($14,262) | ($21,639) | ($30,741) | ($39,843) | $2,805 | ($10,610) | ($17,837) | $24,811 | $73,647 | $64,545 | $55,443 |
| Total Capital | $57,600 | $50,715 | $43,338 | $35,961 | $26,859 | $17,757 | $60,405 | $46,990 | $39,763 | $82,411 | $131,247 | $122,145 | $113,043 |
| Total Liabilities and Capital | $57,600 | $50,715 | $44,281 | $37,372 | $28,738 | $20,370 | $90,326 | $68,272 | $88,897 | $112,332 | $189,020 | $125,491 | $117,123 |
| Net Worth | $57,600 | $50,715 | $43,338 | $35,961 | $26,859 | $17,757 | $60,405 | $46,990 | $39,763 | $82,411 | $131,247 | $122,145 | $113,043 |


