
Spanish Resources
Executive Summary
The Internet is changing the World. Before our eyes, the World Wide Web is systematically transforming industry after industry. To an increasing extent, a company does not exist if it is not present on the Internet.
Spanish Resources plans to exploit this trend. The tourism industry is in the early stages of being transformed by the Internet. Spanish Resources will passionately focus on the Mexican tourism segments of this industry. The company will bring Mexican resorts and tourist destinations onto the World Wide Web. By creating websites for our clients, we will establish them on the Web at a key moment in the transformation of the tourism industry.
The company will use its marketing resources to define a new niche in the Mexican tourism market. This niche focus will include website design and overall Web strategy for resort operators and other tourist destinations in Mexico. We will then define ourselves as the leader in this niche.
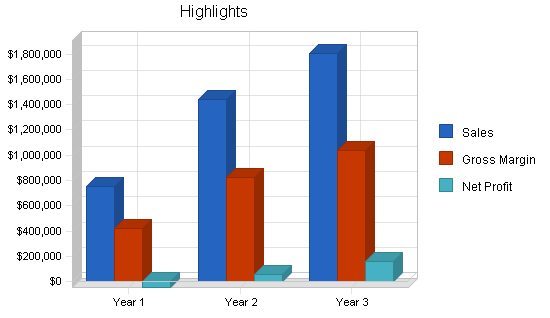
Spanish Resources expects revenue of $751,350 in the first year, $1,441,500 in the second year and $1,807,550 in the third year. Profits for the same time periods will increase steadily.
We expect employee headcount to grow from four to eleven over the first year and to hold steady there after. The company expects paid-in capital of $300,000 to provide more then adequate working capital for the duration of the plan.
The company will provide a turn-key solution to its clients. However, we will rely on multiple outside vendors to supply website implementation and hosting. The company will provide all other aspects of the service.
1.1 Objectives
Our most important objectives are:
- Three major referenceable accounts in the first six months.
- An annual revenue of $1,441,500 in the second year.
- In the first year, at least fifteen mentions of the company in tourism industry magazines and newsletters.
1.2 Mission
Spanish Resources will remove the language and technology barriers to travel destination operators in Mexico through the use of the Internet in order to reach perspective english-speaking tourists.
We will provide a dynamic and fun work environment with stable, long-term job opportunities that will include exotic travel for some employees and incentive bonuses for all key personnel.
Company Summary
Spanish Resources will be incorporated in the state of Connecticut as a general corporation (Subchapter C).
The company will provide website development services to tourism destinations in Mexico. Although the company has no operating history, the founders, Carolyn and Jerry, have extensive experience in the competencies required for the company to succeed. The company will have a more than adequate amount, with $300,000 investment.
2.1 Start-up Summary
There are three features of the start-up expenses that are worth noting.
First, the research and development expense involves the founders traveling to appropriate destinations to gather first-hand information about the market and market conditions.
Second, the company is investing heavily in sales collateral because of the need to project a strong quality image from the company’s inception.
Third, the company is assuming the need for only a single base of operations.

| Start-up | |
| Requirements | |
| Start-up Expenses | |
| Legal | $5,000 |
| Stationery etc. | $1,000 |
| Brochures | $7,500 |
| Consultants | $20,000 |
| Insurance | $2,000 |
| Rent | $1,500 |
| Research and development | $20,000 |
| Expensed equipment | $500 |
| Other | $5,000 |
| Total Start-up Expenses | $62,500 |
| Start-up Assets | |
| Cash Required | $367,500 |
| Other Current Assets | $0 |
| Long-term Assets | $20,000 |
| Total Assets | $387,500 |
| Total Requirements | $450,000 |
| Start-up Funding | |
| Start-up Expenses to Fund | $62,500 |
| Start-up Assets to Fund | $387,500 |
| Total Funding Required | $450,000 |
| Assets | |
| Non-cash Assets from Start-up | $20,000 |
| Cash Requirements from Start-up | $367,500 |
| Additional Cash Raised | $0 |
| Cash Balance on Starting Date | $367,500 |
| Total Assets | $387,500 |
| Liabilities and Capital | |
| Liabilities | |
| Current Borrowing | $100,000 |
| Long-term Liabilities | $0 |
| Accounts Payable (Outstanding Bills) | $50,000 |
| Other Current Liabilities (interest-free) | $0 |
| Total Liabilities | $150,000 |
| Capital | |
| Planned Investment | |
| Founders | $300,000 |
| Other | $0 |
| Additional Investment Requirement | $0 |
| Total Planned Investment | $300,000 |
| Loss at Start-up (Start-up Expenses) | ($62,500) |
| Total Capital | $237,500 |
| Total Capital and Liabilities | $387,500 |
| Total Funding | $450,000 |
Services
The company will offer two basic services: creating a basic website, and creating an in-depth website.
The company’s core competencies are an understanding of cultural and linguistic issues and the infrastructure of the World Wide Web. The company intends to partner with firms that are proficient in website implementation, rather than building such an operation internally.
In order to provide a high level of service, the company will have operations in both Stamford, Connecticut and in Mexico. The Stamford operation will serve as headquarters and the point of contact for partner Web design firms. The Mexican operation will support direct sales, after sales support and account management.
3.1 Service Description
The company offers two basic categories of service.
The basic service, which is sold to small resorts and travel destination, provides a simple website. This website will typically include photographs, location and contact details for the destination. In addition, the website will be submitted to all of the Web search engines and be provided to travel- oriented websites.
The basic website is designed to inform Web users about the existence of resorts and travel destinations. This basic level of service is provided for people whose primary goal is establishing a presence on the Web. This service will cost $2,000 to $3,000 dollars.
The in-depth website is designed for large resorts. This site provides everything included in the basic website and adds more depth and interactivity. This form of website will provide more detailed description and images of the resort and its facilities.
In addition, the website will allow users to make bookings, ask for promotional literature to be mailed to them and make other requests directly of the resort operators. The in-depth website goes beyond a presence on the Web, by using the Web to establish the initial relationship with potential guests. We will make the in-depth website available to smaller resorts and other destinations if requested. This service cost $8,500.
We intend to provide ongoing services to basic and in-depth website customers that will include updates and expansions of their site, as well as brokerage for Web hosting services. We expect ongoing services to account for approximately the same dollar amounts as the initial contracts.
3.2 Fulfillment
Fulfillment for the company relies on both internal resources and our Web designer partners. The company will establish relations with at least two Web design firms.
The company will handle the direct relationships with the clients including all linguistic and cultural issues as well as a collection of imagery, identification of key resort facilities, and a high-level design concept for the website.
The Web design firm will be responsible for converting imagery to computer form, typesetting of text, and other technical website implementation issues. For basic website work, the Web design firm will be paid from $1,000 to $1,500 and for in-depth website work, they will be paid from $3,000-$3,500 dollars.
Market Analysis Summary
The tourism market in Mexico is enormous. In 1998, according to The Bank of Mexico, 19.8 million international tourists traveled to Mexico and spent over six billion dollars.
350 major hotels and thousands of smaller travel destinations serviced these tourists. Increasingly tourists are researching and booking travel using the Internet.
There are 20 travel websites already and this number is projected to increase by 100% by the end of 2001.
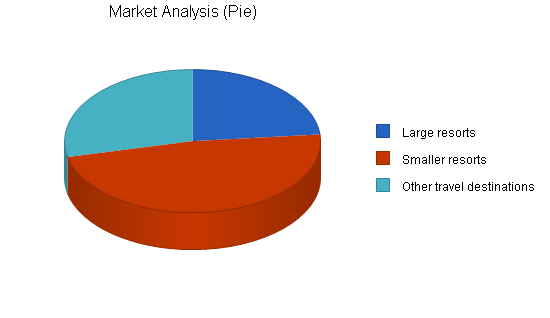
The company plans to target the large resorts that don’t yet have a website and expand into the thousands of smaller destinations as the business develops.
The company will approach this market primarily through advertising. Our advertising will serve two different functions.
First, we will use testimonials from reference accounts to expose the benefits of our services to tourism operators.

Second, we will use advertising through trade publications and direct mail to establish a brand that the Mexican tourism industry will associate with high-quality professional services.
4.1 Market Segmentation
We broadly divide our market between resort hotels and other travel destinations. Within resort hotels we segment between 1, 2, 3, 4, and 5 star hotels.
Within other travel destinations we include apartments, bed and breakfast, suits, villas, condos, trailer parks, and bungalows.
Within the category of resort hotels, we define large resorts as being 4 or 5 star hotels.
We define smaller resorts as 3 or 4 star hotels. Please note this analysis counts 4 star hotels twice.
In addition, we have excluded 1 and 2 star hotels entirely. Furthermore the company believes these estimates are conservative because they exclude the major beach resort areas such as Acapulco, Puerto Vayarta, Cancun, Zihuatenejo, Ixtapa, etc.
| Market Analysis | |||||||
| Year 1 | Year 2 | Year 3 | Year 4 | Year 5 | |||
| Potential Customers | Growth | CAGR | |||||
| Large resorts | 10% | 557 | 613 | 674 | 741 | 815 | 9.98% |
| Smaller resorts | 10% | 1,136 | 1,250 | 1,375 | 1,513 | 1,664 | 10.01% |
| Other travel destinations | 10% | 678 | 746 | 821 | 903 | 993 | 10.01% |
| Total | 10.00% | 2,371 | 2,609 | 2,870 | 3,157 | 3,472 | 10.00% |
4.2 Target Market Segment Strategy
The company’s market strategy is to focus on resort hotels and tourist travel destinations in Mexico that meet two important criteria.
First, we are targeting the segments of the market that can afford Web-based promotion.
Second, we are targeting those segments of the market that can benefit from a presence on the World Wide Web.
The company has gathered market data from the official Mexican tourism website. To be conservative, we gathered data that excludes the major beach resort areas.
Many of the major beach resorts already have websites. Although we intend to target those areas as well, for purposes of this analysis, we have left them out of the numerical totals. If they were included, these resorts would approximately double the number of large resorts. Smaller resorts and other travel destinations would also be affected, but by a smaller amount.
Although there are many more 1 and 2 star hotels then any other category, the company decided to exclude them because their segment can neither afford nor benefit from a presence on the World Wide Web.
We decided to include 4 star hotels in both large and small resort segments because we predict that 4 star operators will divide themselves between large and small service offerings.
It is also important to note that many of the 4 and 5 star hotels are controled by resort chains, where as the smaller hotels tend to be individually owned.
Furthermore, 5 star hotels often have affiliations with other travel destinations such as golf courses. Also note that the predicted 10% growth rate was estimated by the company, not by the tourism board.
Strategy and Implementation Summary
The company will focus on the Mexican tourism market. By using the company’s services, our clients will either establish, or improve, their presence on the World Wide Web. By using this Web presence, they will be able to reach ten of millions of consumers who use the Web regularly.
Our marketing strategy is based on testimonial and reference advertising. We will use trade publications and direct advertising to establish our brand as the high quality source for Web design and infrastructure services in the Mexican tourism industry.
Our strategy involves creating a niche for Web services in our industry and then positioning ourselves as the leader in this new niche.
Our sales strategy will begin by supporting marketing’s need for reference accounts.
Subsequently sales will focus in two areas. First, the sales force will work leads generated by advertising and word of mouth to establish new customer accounts. Second, the sales force will work with existing customers to renew and improve their website.
5.1 Competitive Edge
There are four principal things that will differentiate Spanish Resources from the competition.
First, the company will have a blend of both Mexican cultural understanding, and World Wide Web infrastructure.
Second, the company will build a strong brand through advertising and promotion.
Third, the company intends to define its business activities as a new niche blending website design with Mexican tourism.
Fourth, the company will use its position as an early entrant in this new niche to create opportunities for a word of mouth reputation based on quality and a high level of service.
Taken together, these four differentiators represent a proven World Wide Web competitive strategy.
As Web markets move from the early stages of experimentation into more mainstream usage, an opportunity is created to aggressively define a new service niche targeted specifically on the peculiar needs of a specialized market.
The company’s research indicates that several resorts are experimenting with websites. As tourism booking move online, this market is a natural target for such a strategy.
5.2 Sales Strategy
The company’s sales strategy has two distinct phases.
In the first phase the company will identify direct sales opportunities in Mexican regions that have a high concentration of resorts. The direct sales force will approach these sales opportunities in one-on-one meetings.
The primary goals in this first phase are locating accounts that appear to be good candidates for advertising references (for example a famous Acapulco resort), improving the quality of the sales presentation and refining sales technique. Meeting revenue targets are secondary consideration in the first phase.
In the second phase, the company expects to generate sales leads from advertising promotion and word of mouth. This should make the direct sales force more efficient, and therefore capable of making revenue targets the primary sales goal. Furthermore, the sales force will be operating on a steadily increasing client base from whom new orders can be taken.
The company expects the first phase to take approximately six months and the second phase to begin thereafter.
The company’s compensation plan for salespeople is based on a combination of base salary and sales commissions.
5.2.1 Sales Forecast
The sales forecast is based on several assumptions.
First, that the potential market is very large, in particular there is significant pent-up demand for an Internet presence among travel destination operators.
Second, that initial sales will come from sales calls on potential clients.
Third, that establishing reference accounts are the most important early sales targets.
Fourth, that advertising and promotion, in the presence of referenceable accounts, will generate most of the sales leads starting in the third quarter of operation and extending into the steady state.
The principal limiter of sales volume is the company’s capacity. We expect advertising to generate more sales leads then the company can fulfill.
Therefore, we have projected approximately 25% year-on-year sales growth based roughly on the growth and size of operation. Furthermore, we anticipate the ability to be selective about clientele due to the excess demand for the company’s services.
| Sales Forecast | |||
| Year 1 | Year 2 | Year 3 | |
| Unit Sales | |||
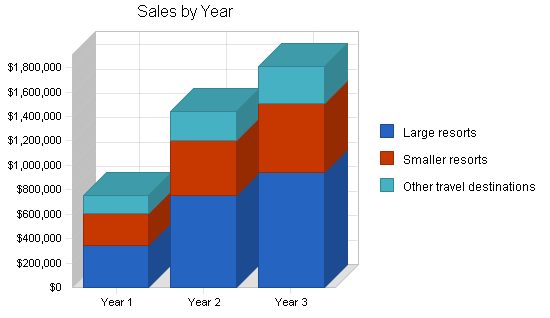
| Large resorts | 41 | 90 | 113 |
| Smaller resorts | 89 | 150 | 188 |
| Other travel destinations | 71 | 120 | 150 |
| Total Unit Sales | 201 | 360 | 451 |
| Unit Prices | Year 1 | Year 2 | Year 3 |
| Large resorts | $8,350.00 | $8,350.00 | $8,350.00 |
| Smaller resorts | $3,000.00 | $3,000.00 | $3,000.00 |
| Other travel destinations | $2,000.00 | $2,000.00 | $2,000.00 |
| Sales | |||
| Large resorts | $342,350 | $751,500 | $943,550 |
| Smaller resorts | $267,000 | $450,000 | $564,000 |
| Other travel destinations | $142,000 | $240,000 | $300,000 |
| Total Sales | $751,350 | $1,441,500 | $1,807,550 |
| Direct Unit Costs | Year 1 | Year 2 | Year 3 |
| Large resorts | $3,000.00 | $3,000.00 | $3,000.00 |
| Smaller resorts | $1,500.00 | $1,500.00 | $1,500.00 |
| Other travel destinations | $1,000.00 | $1,000.00 | $1,000.00 |
| Direct Cost of Sales | |||
| Large resorts | $123,000 | $270,000 | $339,000 |
| Smaller resorts | $133,500 | $225,000 | $282,000 |
| Other travel destinations | $71,000 | $120,000 | $150,000 |
| Subtotal Direct Cost of Sales | $327,500 | $615,000 | $771,000 |
Management Summary
At the end of the first year of operation, the company will have eleven employees. Of these, two of whom will be founders and two of whom will be managers (yet to be hired). The plan also includes three account managers, a bookkeeper, and three administrative assistants.
Carolyn’s general responsibilities will be: overseeing client relationships, supervising all cultural and linguistic issues, and insuring that the final design meets the customer’s expectations.
Carolyn will also provide overall management for the company by supervising the sales and marketing manager and the production manager (yet to be hired).
Carolyn was born in Mexico City and grew up completely bilingual and bicultural. She has an undergrad degree from the University of Notre Dame and a masters in Spanish and education from the University of Connecticut. She has had the wonderful opportunity of working as director of human resources for Palo Alto Software, Inc.. In that role Carolyn has gained experience hiring, training and managing people.
Jerry’s overall responsibilities will include: finance, legal, accounting, and general business guidance. Jerry will also negotiate and oversee the partnering relationships with Web design firms.
Jerry has been a founder or cofounder of six businesses including Spanish Resources. One of his companies, Intertrust Technologies Corp, is publicly traded on the NASDAQ exchange. He has thirteen years experience in all areas of general business including technology, management, finance, legal and general administrative functions.
The sales and marketing manager will report to Carolyn and be responsible for overseeing both the account managers in sales and the company’s marketing efforts.
The marketing activities will involve extensive contact with the press, as well as overseeing outside contractors for the development of sales collateral and other materials. The sales and marketing manager will also be responsible for developing corporate identity materials.
The account managers serve a dual role: they provide the direct sales force as well as a point of customer care after the sale. The first account manager will be located in Mexico to provide the cultural familiarity necessary to make sales. The account managers report to the sales and marketing manager.
The production manager will oversee the day to day flow of information between customers, Spanish Resources, and the outside Web design firms. The production manger will insure that the high-level design is carried out, that production schedules are met, and that standards of quality are maintained. The production manager reports to Carolyn.
6.1 Personnel Plan
The initial team consists of the founders, Carolyn and Jerry, an office assistant and an account manager.
Carolyn and Jerry will be production, sales and marketing management for the initial team. After the reference accounts are established, the team will be expanded to include a half-time bookkeeper, a second account manger, and both the sales and marketing manager and the production manager.
As sales ramp up, the bookkeeper will move to full time, and an additional account manager will be added as well as assistants for both the sales and marketing manager and the production manager.
| Personnel Plan | |||
| Year 1 | Year 2 | Year 3 | |
| Carolyn | $24,000 | $28,000 | $30,000 |
| Jerry | $12,000 | $26,000 | $28,000 |
| Office assistant | $18,000 | $20,000 | $22,000 |
| Bookkeeper | $13,500 | $26,000 | $32,000 |
| Account manager | $16,500 | $27,000 | $30,000 |
| Account manager | $22,500 | $26,500 | $29,000 |
| Account manager | $4,500 | $24,000 | $2,700 |
| Production manager | $12,750 | $33,000 | $36,000 |
| Production assistant | $4,500 | $20,000 | $22,000 |
| Sales and marketing manager | $18,000 | $36,000 | $39,000 |
| Sales and marketing assistant | $4,500 | $20,000 | $22,000 |
| Total People | 11 | 17 | 18 |
| Total Payroll | $150,750 | $286,500 | $292,700 |
Financial Plan
The company plans to raise $300,000 in paid-in capital.
As the following tables indicate, this will provide a substantial working capital reserve. This reserve can be used either to finance unexpected short falls in sales or to exploit new market opportunities as the plan unfolds.
Each of the tables contains additional explanatory materials related to the details of our plan.
7.1 Important Assumptions
In addition to general assumption in the table below, the company has made additional assumption about the state of the ecomony, the tourism industry, and the Internet.
The company assumes the economy remains strong, and in particular that the tourism industry continues to experience moderate growth.
The company assumes that the Internet will continue to expand into mainstream of everyday life and particularly that the Internet is increasingly important to the tourism industry.
The company assumes that significant and increasing demand exists for the company’s services.
| General Assumptions | |||
| Year 1 | Year 2 | Year 3 | |
| Plan Month | 1 | 2 | 3 |
| Current Interest Rate | 12.00% | 12.00% | 12.00% |
| Long-term Interest Rate | 10.00% | 10.00% | 10.00% |
| Tax Rate | 25.42% | 25.00% | 25.42% |
| Other | 0 | 0 | 0 |
7.2 Break-even Analysis
Note that break-even is expected in the second year of operations.

| Break-even Analysis | |
| Monthly Units Break-even | 18 |
| Monthly Revenue Break-even | $67,711 |
| Assumptions: | |
| Average Per-Unit Revenue | $3,738.06 |
| Average Per-Unit Variable Cost | $1,629.35 |
| Estimated Monthly Fixed Cost | $38,197 |
7.3 Projected Profit and Loss
There are several features of the company’s Profit and Loss statement that merit explanation.
First, note the 90% increase in sales between year one and year two and the 25% increase between year two and year three.
The dramatic difference is explained by examining fourth quarter sales numbers in year one. If the fourth quarter numbers in year one were extended for an entire year, the sales growth between that year and year two would be approximately 25%.
Second, the dramatic growth in overall marketing budget (60% from year one to year two) is explained by the company’s strategy of using advertising generated sales leads as the most important source of new clients.
Third, it is worth noting that the increase in profit from year two to year three is much greater then the corresponding increase in sales. This is due to the need to both hire and train personnel ahead of increased sales expected in year three and the need to spend heavily in marketing in year two to achieve those sales.
Fourth, the lack of an advertising and promotion budget for the first quarter in year one is due to the company’s strategy of using reference account in company’s advertisements. The first reference accounts will be established in the first quarter of year one with advertising based on those accounts starting in the second quarter.


| Pro Forma Profit and Loss | |||
| Year 1 | Year 2 | Year 3 | |
| Sales | $751,350 | $1,441,500 | $1,807,550 |
| Direct Cost of Sales | $327,500 | $615,000 | $771,000 |
| Other | $0 | $0 | $0 |
| Total Cost of Sales | $327,500 | $615,000 | $771,000 |
| Gross Margin | $423,850 | $826,500 | $1,036,550 |
| Gross Margin % | 56.41% | 57.34% | 57.35% |
| Expenses | |||
| Payroll | $150,750 | $286,500 | $292,700 |
| Sales and Marketing and Other Expenses | $250,200 | $406,000 | $470,000 |
| Depreciation | $0 | $0 | $0 |
| Leased Equipment | $0 | $0 | $0 |
| Utilities | $15,000 | $0 | $0 |
| Insurance | $1,800 | $0 | $0 |
| Rent | $18,000 | $0 | $0 |
| Payroll Taxes | $22,613 | $42,975 | $43,905 |
| Other | $0 | $0 | $0 |
| Total Operating Expenses | $458,363 | $735,475 | $806,605 |
| Profit Before Interest and Taxes | ($34,513) | $91,025 | $229,945 |
| EBITDA | ($34,513) | $91,025 | $229,945 |
| Interest Expense | $12,000 | $12,000 | $12,000 |
| Taxes Incurred | $0 | $19,756 | $55,394 |
| Net Profit | ($46,513) | $59,269 | $162,551 |
| Net Profit/Sales | -6.19% | 4.11% | 8.99% |
7.4 Projected Cash Flow
Note that the company uses a significantly portion of its working capital to manage cash requirements.
Also note that accounts receivable vs. accounts payable is well within manageable limits relative to the company’s monthly cash flow.

| Pro Forma Cash Flow | |||
| Year 1 | Year 2 | Year 3 | |
| Cash Received | |||
| Cash from Operations | |||
| Cash Sales | $300,540 | $576,600 | $723,020 |
| Cash from Receivables | $337,412 | $760,739 | $1,029,284 |
| Subtotal Cash from Operations | $637,952 | $1,337,339 | $1,752,304 |
| Additional Cash Received | |||
| Sales Tax, VAT, HST/GST Received | $0 | $0 | $0 |
| New Current Borrowing | $0 | $0 | $0 |
| New Other Liabilities (interest-free) | $0 | $0 | $0 |
| New Long-term Liabilities | $0 | $0 | $0 |
| Sales of Other Current Assets | $0 | $0 | $0 |
| Sales of Long-term Assets | $0 | $0 | $0 |
| New Investment Received | $0 | $0 | $0 |
| Subtotal Cash Received | $637,952 | $1,337,339 | $1,752,304 |
| Expenditures | Year 1 | Year 2 | Year 3 |
| Expenditures from Operations | |||
| Cash Spending | $150,750 | $286,500 | $292,700 |
| Bill Payments | $625,144 | $1,077,639 | $1,331,212 |
| Subtotal Spent on Operations | $775,894 | $1,364,139 | $1,623,912 |
| Additional Cash Spent | |||
| Sales Tax, VAT, HST/GST Paid Out | $0 | $0 | $0 |
| Principal Repayment of Current Borrowing | $0 | $0 | $0 |
| Other Liabilities Principal Repayment | $0 | $0 | $0 |
| Long-term Liabilities Principal Repayment | $0 | $0 | $0 |
| Purchase Other Current Assets | $0 | $0 | $0 |
| Purchase Long-term Assets | $0 | $0 | $0 |
| Dividends | $0 | $0 | $0 |
| Subtotal Cash Spent | $775,894 | $1,364,139 | $1,623,912 |
| Net Cash Flow | ($137,942) | ($26,801) | $128,392 |
| Cash Balance | $229,558 | $202,757 | $331,149 |
7.5 Projected Balance Sheet
Due to the $300,000 of paid-in capital and the company’s turn to profitability in the second year, the company’s balance sheet is robust.
| Pro Forma Balance Sheet | |||
| Year 1 | Year 2 | Year 3 | |
| Assets | |||
| Current Assets | |||
| Cash | $229,558 | $202,757 | $331,149 |
| Accounts Receivable | $113,398 | $217,559 | $272,806 |
| Other Current Assets | $0 | $0 | $0 |
| Total Current Assets | $342,956 | $420,316 | $603,955 |
| Long-term Assets | |||
| Long-term Assets | $20,000 | $20,000 | $20,000 |
| Accumulated Depreciation | $0 | $0 | $0 |
| Total Long-term Assets | $20,000 | $20,000 | $20,000 |
| Total Assets | $362,956 | $440,316 | $623,955 |
| Liabilities and Capital | Year 1 | Year 2 | Year 3 |
| Current Liabilities | |||
| Accounts Payable | $71,968 | $90,060 | $111,148 |
| Current Borrowing | $100,000 | $100,000 | $100,000 |
| Other Current Liabilities | $0 | $0 | $0 |
| Subtotal Current Liabilities | $171,968 | $190,060 | $211,148 |
| Long-term Liabilities | $0 | $0 | $0 |
| Total Liabilities | $171,968 | $190,060 | $211,148 |
| Paid-in Capital | $300,000 | $300,000 | $300,000 |
| Retained Earnings | ($62,500) | ($109,013) | ($49,744) |
| Earnings | ($46,513) | $59,269 | $162,551 |
| Total Capital | $190,988 | $250,256 | $412,807 |
| Total Liabilities and Capital | $362,956 | $440,316 | $623,955 |
| Net Worth | $190,988 | $250,256 | $412,807 |
7.6 Business Ratios
The following table outlines some of the more important ratios from the Administrative Management and General Management industry. The final column, Industry Profile, details specific ratios based on the industry as it is classified by the Standard Industry Classification (SIC) code, 8742.
| Ratio Analysis | ||||
| Year 1 | Year 2 | Year 3 | Industry Profile | |
| Sales Growth | 0.00% | 91.85% | 25.39% | 6.98% |
| Percent of Total Assets | ||||
| Accounts Receivable | 31.24% | 49.41% | 43.72% | 26.80% |
| Other Current Assets | 0.00% | 0.00% | 0.00% | 43.95% |
| Total Current Assets | 94.49% | 95.46% | 96.79% | 75.76% |
| Long-term Assets | 5.51% | 4.54% | 3.21% | 24.24% |
| Total Assets | 100.00% | 100.00% | 100.00% | 100.00% |
| Current Liabilities | 47.38% | 43.16% | 33.84% | 31.78% |
| Long-term Liabilities | 0.00% | 0.00% | 0.00% | 17.26% |
| Total Liabilities | 47.38% | 43.16% | 33.84% | 49.04% |
| Net Worth | 52.62% | 56.84% | 66.16% | 50.96% |
| Percent of Sales | ||||
| Sales | 100.00% | 100.00% | 100.00% | 100.00% |
| Gross Margin | 56.41% | 57.34% | 57.35% | 100.00% |
| Selling, General & Administrative Expenses | 62.60% | 53.22% | 48.30% | 85.31% |
| Advertising Expenses | 10.94% | 13.87% | 13.28% | 1.02% |
| Profit Before Interest and Taxes | -4.59% | 6.31% | 12.72% | 1.90% |
| Main Ratios | ||||
| Current | 1.99 | 2.21 | 2.86 | 1.88 |
| Quick | 1.99 | 2.21 | 2.86 | 1.48 |
| Total Debt to Total Assets | 47.38% | 43.16% | 33.84% | 55.78% |
| Pre-tax Return on Net Worth | -24.35% | 31.58% | 52.80% | 3.41% |
| Pre-tax Return on Assets | -12.81% | 17.95% | 34.93% | 7.72% |
| Additional Ratios | Year 1 | Year 2 | Year 3 | |
| Net Profit Margin | -6.19% | 4.11% | 8.99% | n.a |
| Return on Equity | -24.35% | 23.68% | 39.38% | n.a |
| Activity Ratios | ||||
| Accounts Receivable Turnover | 3.98 | 3.98 | 3.98 | n.a |
| Collection Days | 56 | 70 | 83 | n.a |
| Accounts Payable Turnover | 8.99 | 12.17 | 12.17 | n.a |
| Payment Days | 29 | 27 | 27 | n.a |
| Total Asset Turnover | 2.07 | 3.27 | 2.90 | n.a |
| Debt Ratios | ||||
| Debt to Net Worth | 0.90 | 0.76 | 0.51 | n.a |
| Current Liab. to Liab. | 1.00 | 1.00 | 1.00 | n.a |
| Liquidity Ratios | ||||
| Net Working Capital | $170,988 | $230,256 | $392,807 | n.a |
| Interest Coverage | -2.88 | 7.59 | 19.16 | n.a |
| Additional Ratios | ||||
| Assets to Sales | 0.48 | 0.31 | 0.35 | n.a |
| Current Debt/Total Assets | 47% | 43% | 34% | n.a |
| Acid Test | 1.33 | 1.07 | 1.57 | n.a |
| Sales/Net Worth | 3.93 | 5.76 | 4.38 | n.a |
| Dividend Payout | 0.00 | 0.00 | 0.00 | n.a |
Appendix
| Sales Forecast | |||||||||||||
| Month 1 | Month 2 | Month 3 | Month 4 | Month 5 | Month 6 | Month 7 | Month 8 | Month 9 | Month 10 | Month 11 | Month 12 | ||
| Unit Sales | |||||||||||||
| Large resorts | 0% | 0 | 1 | 1 | 2 | 2 | 2 | 5 | 5 | 5 | 6 | 6 | 6 |
| Smaller resorts | 0% | 3 | 3 | 5 | 8 | 8 | 8 | 8 | 8 | 8 | 10 | 10 | 10 |
| Other travel destinations | 0% | 3 | 3 | 5 | 6 | 6 | 6 | 6 | 6 | 6 | 8 | 8 | 8 |
| Total Unit Sales | 6 | 7 | 11 | 16 | 16 | 16 | 19 | 19 | 19 | 24 | 24 | 24 | |
| Unit Prices | Month 1 | Month 2 | Month 3 | Month 4 | Month 5 | Month 6 | Month 7 | Month 8 | Month 9 | Month 10 | Month 11 | Month 12 | |
| Large resorts | $8,350.00 | $8,350.00 | $8,350.00 | $8,350.00 | $8,350.00 | $8,350.00 | $8,350.00 | $8,350.00 | $8,350.00 | $8,350.00 | $8,350.00 | $8,350.00 | |
| Smaller resorts | $3,000.00 | $3,000.00 | $3,000.00 | $3,000.00 | $3,000.00 | $3,000.00 | $3,000.00 | $3,000.00 | $3,000.00 | $3,000.00 | $3,000.00 | $3,000.00 | |
| Other travel destinations | $2,000.00 | $2,000.00 | $2,000.00 | $2,000.00 | $2,000.00 | $2,000.00 | $2,000.00 | $2,000.00 | $2,000.00 | $2,000.00 | $2,000.00 | $2,000.00 | |
| Sales | |||||||||||||
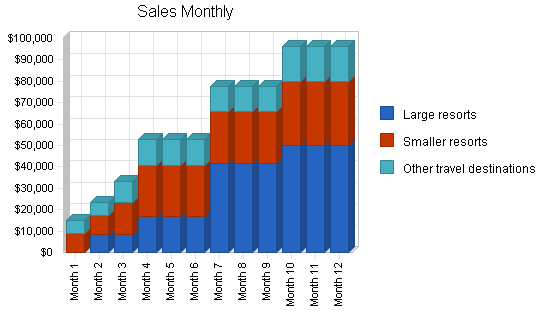
| Large resorts | $0 | $8,350 | $8,350 | $16,700 | $16,700 | $16,700 | $41,750 | $41,750 | $41,750 | $50,100 | $50,100 | $50,100 | |
| Smaller resorts | $9,000 | $9,000 | $15,000 | $24,000 | $24,000 | $24,000 | $24,000 | $24,000 | $24,000 | $30,000 | $30,000 | $30,000 | |
| Other travel destinations | $6,000 | $6,000 | $10,000 | $12,000 | $12,000 | $12,000 | $12,000 | $12,000 | $12,000 | $16,000 | $16,000 | $16,000 | |
| Total Sales | $15,000 | $23,350 | $33,350 | $52,700 | $52,700 | $52,700 | $77,750 | $77,750 | $77,750 | $96,100 | $96,100 | $96,100 | |
| Direct Unit Costs | Month 1 | Month 2 | Month 3 | Month 4 | Month 5 | Month 6 | Month 7 | Month 8 | Month 9 | Month 10 | Month 11 | Month 12 | |
| Large resorts | 0.00% | $3,000.00 | $3,000.00 | $3,000.00 | $3,000.00 | $3,000.00 | $3,000.00 | $3,000.00 | $3,000.00 | $3,000.00 | $3,000.00 | $3,000.00 | $3,000.00 |
| Smaller resorts | 0.00% | $1,500.00 | $1,500.00 | $1,500.00 | $1,500.00 | $1,500.00 | $1,500.00 | $1,500.00 | $1,500.00 | $1,500.00 | $1,500.00 | $1,500.00 | $1,500.00 |
| Other travel destinations | 0.00% | $1,000.00 | $1,000.00 | $1,000.00 | $1,000.00 | $1,000.00 | $1,000.00 | $1,000.00 | $1,000.00 | $1,000.00 | $1,000.00 | $1,000.00 | $1,000.00 |
| Direct Cost of Sales | |||||||||||||
| Large resorts | $0 | $3,000 | $3,000 | $6,000 | $6,000 | $6,000 | $15,000 | $15,000 | $15,000 | $18,000 | $18,000 | $18,000 | |
| Smaller resorts | $4,500 | $4,500 | $7,500 | $12,000 | $12,000 | $12,000 | $12,000 | $12,000 | $12,000 | $15,000 | $15,000 | $15,000 | |
| Other travel destinations | $3,000 | $3,000 | $5,000 | $6,000 | $6,000 | $6,000 | $6,000 | $6,000 | $6,000 | $8,000 | $8,000 | $8,000 | |
| Subtotal Direct Cost of Sales | $7,500 | $10,500 | $15,500 | $24,000 | $24,000 | $24,000 | $33,000 | $33,000 | $33,000 | $41,000 | $41,000 | $41,000 | |
| Personnel Plan | |||||||||||||
| Month 1 | Month 2 | Month 3 | Month 4 | Month 5 | Month 6 | Month 7 | Month 8 | Month 9 | Month 10 | Month 11 | Month 12 | ||
| Carolyn | 0% | $2,000 | $2,000 | $2,000 | $2,000 | $2,000 | $2,000 | $2,000 | $2,000 | $2,000 | $2,000 | $2,000 | $2,000 |
| Jerry | 0% | $1,000 | $1,000 | $1,000 | $1,000 | $1,000 | $1,000 | $1,000 | $1,000 | $1,000 | $1,000 | $1,000 | $1,000 |
| Office assistant | 0% | $1,500 | $1,500 | $1,500 | $1,500 | $1,500 | $1,500 | $1,500 | $1,500 | $1,500 | $1,500 | $1,500 | $1,500 |
| Bookkeeper | 0% | $0 | $0 | $0 | $0 | $0 | $0 | $1,500 | $1,500 | $1,500 | $3,000 | $3,000 | $3,000 |
| Account manager | 0% | $0 | $0 | $0 | $1,500 | $1,500 | $1,500 | $2,000 | $2,000 | $2,000 | $2,000 | $2,000 | $2,000 |
| Account manager | 0% | $1,500 | $1,500 | $1,500 | $2,000 | $2,000 | $2,000 | $2,000 | $2,000 | $2,000 | $2,000 | $2,000 | $2,000 |
| Account manager | 0% | $0 | $0 | $0 | $0 | $0 | $0 | $0 | $0 | $0 | $1,500 | $1,500 | $1,500 |
| Production manager | 0% | $0 | $0 | $0 | $0 | $0 | $0 | $1,250 | $1,250 | $1,250 | $3,000 | $3,000 | $3,000 |
| Production assistant | 0% | $0 | $0 | $0 | $0 | $0 | $0 | $0 | $0 | $0 | $1,500 | $1,500 | $1,500 |
| Sales and marketing manager | 0% | $0 | $0 | $0 | $0 | $0 | $0 | $3,000 | $3,000 | $3,000 | $3,000 | $3,000 | $3,000 |
| Sales and marketing assistant | 0% | $0 | $0 | $0 | $0 | $0 | $0 | $0 | $0 | $0 | $1,500 | $1,500 | $1,500 |
| Total People | 4 | 4 | 4 | 5 | 5 | 5 | 8 | 8 | 8 | 11 | 11 | 11 | |
| Total Payroll | $6,000 | $6,000 | $6,000 | $8,000 | $8,000 | $8,000 | $14,250 | $14,250 | $14,250 | $22,000 | $22,000 | $22,000 | |
| General Assumptions | |||||||||||||
| Month 1 | Month 2 | Month 3 | Month 4 | Month 5 | Month 6 | Month 7 | Month 8 | Month 9 | Month 10 | Month 11 | Month 12 | ||
| Plan Month | 1 | 2 | 3 | 4 | 5 | 6 | 7 | 8 | 9 | 10 | 11 | 12 | |
| Current Interest Rate | 12.00% | 12.00% | 12.00% | 12.00% | 12.00% | 12.00% | 12.00% | 12.00% | 12.00% | 12.00% | 12.00% | 12.00% | |
| Long-term Interest Rate | 10.00% | 10.00% | 10.00% | 10.00% | 10.00% | 10.00% | 10.00% | 10.00% | 10.00% | 10.00% | 10.00% | 10.00% | |
| Tax Rate | 30.00% | 25.00% | 25.00% | 25.00% | 25.00% | 25.00% | 25.00% | 25.00% | 25.00% | 25.00% | 25.00% | 25.00% | |
| Other | 0 | 0 | 0 | 0 | 0 | 0 | 0 | 0 | 0 | 0 | 0 | 0 | |
| Pro Forma Profit and Loss | |||||||||||||
| Month 1 | Month 2 | Month 3 | Month 4 | Month 5 | Month 6 | Month 7 | Month 8 | Month 9 | Month 10 | Month 11 | Month 12 | ||
| Sales | $15,000 | $23,350 | $33,350 | $52,700 | $52,700 | $52,700 | $77,750 | $77,750 | $77,750 | $96,100 | $96,100 | $96,100 | |
| Direct Cost of Sales | $7,500 | $10,500 | $15,500 | $24,000 | $24,000 | $24,000 | $33,000 | $33,000 | $33,000 | $41,000 | $41,000 | $41,000 | |
| Other | $0 | $0 | $0 | $0 | $0 | $0 | $0 | $0 | $0 | $0 | $0 | $0 | |
| Total Cost of Sales | $7,500 | $10,500 | $15,500 | $24,000 | $24,000 | $24,000 | $33,000 | $33,000 | $33,000 | $41,000 | $41,000 | $41,000 | |
| Gross Margin | $7,500 | $12,850 | $17,850 | $28,700 | $28,700 | $28,700 | $44,750 | $44,750 | $44,750 | $55,100 | $55,100 | $55,100 | |
| Gross Margin % | 50.00% | 55.03% | 53.52% | 54.46% | 54.46% | 54.46% | 57.56% | 57.56% | 57.56% | 57.34% | 57.34% | 57.34% | |
| Expenses | |||||||||||||
| Payroll | $6,000 | $6,000 | $6,000 | $8,000 | $8,000 | $8,000 | $14,250 | $14,250 | $14,250 | $22,000 | $22,000 | $22,000 | |
| Sales and Marketing and Other Expenses | $14,000 | $14,000 | $14,000 | $21,000 | $21,000 | $21,000 | $15,200 | $26,000 | $26,000 | $26,000 | $26,000 | $26,000 | |
| Depreciation | $0 | $0 | $0 | $0 | $0 | $0 | $0 | $0 | $0 | $0 | $0 | $0 | |
| Leased Equipment | $0 | $0 | $0 | $0 | $0 | $0 | $0 | $0 | $0 | $0 | $0 | $0 | |
| Utilities | $1,000 | $1,000 | $1,000 | $1,000 | $1,000 | $1,000 | $1,500 | $1,500 | $1,500 | $1,500 | $1,500 | $1,500 | |
| Insurance | $150 | $150 | $150 | $150 | $150 | $150 | $150 | $150 | $150 | $150 | $150 | $150 | |
| Rent | $1,500 | $1,500 | $1,500 | $1,500 | $1,500 | $1,500 | $1,500 | $1,500 | $1,500 | $1,500 | $1,500 | $1,500 | |
| Payroll Taxes | 15% | $900 | $900 | $900 | $1,200 | $1,200 | $1,200 | $2,138 | $2,138 | $2,138 | $3,300 | $3,300 | $3,300 |
| Other | $0 | $0 | $0 | $0 | $0 | $0 | $0 | $0 | $0 | $0 | $0 | $0 | |
| Total Operating Expenses | $23,550 | $23,550 | $23,550 | $32,850 | $32,850 | $32,850 | $34,738 | $45,538 | $45,538 | $54,450 | $54,450 | $54,450 | |
| Profit Before Interest and Taxes | ($16,050) | ($10,700) | ($5,700) | ($4,150) | ($4,150) | ($4,150) | $10,013 | ($788) | ($788) | $650 | $650 | $650 | |
| EBITDA | ($16,050) | ($10,700) | ($5,700) | ($4,150) | ($4,150) | ($4,150) | $10,013 | ($788) | ($788) | $650 | $650 | $650 | |
| Interest Expense | $1,000 | $1,000 | $1,000 | $1,000 | $1,000 | $1,000 | $1,000 | $1,000 | $1,000 | $1,000 | $1,000 | $1,000 | |
| Taxes Incurred | $0 | $0 | $0 | $0 | $0 | $0 | $0 | $0 | $0 | $0 | $0 | $0 | |
| Net Profit | ($17,050) | ($11,700) | ($6,700) | ($5,150) | ($5,150) | ($5,150) | $9,013 | ($1,788) | ($1,788) | ($350) | ($350) | ($350) | |
| Net Profit/Sales | -113.67% | -50.11% | -20.09% | -9.77% | -9.77% | -9.77% | 11.59% | -2.30% | -2.30% | -0.36% | -0.36% | -0.36% | |
| Pro Forma Cash Flow | |||||||||||||
| Month 1 | Month 2 | Month 3 | Month 4 | Month 5 | Month 6 | Month 7 | Month 8 | Month 9 | Month 10 | Month 11 | Month 12 | ||
| Cash Received | |||||||||||||
| Cash from Operations | |||||||||||||
| Cash Sales | $6,000 | $9,340 | $13,340 | $21,080 | $21,080 | $21,080 | $31,100 | $31,100 | $31,100 | $38,440 | $38,440 | $38,440 | |
| Cash from Receivables | $0 | $300 | $9,167 | $14,210 | $20,397 | $31,620 | $31,620 | $32,121 | $46,650 | $46,650 | $47,017 | $57,660 | |
| Subtotal Cash from Operations | $6,000 | $9,640 | $22,507 | $35,290 | $41,477 | $52,700 | $62,720 | $63,221 | $77,750 | $85,090 | $85,457 | $96,100 | |
| Additional Cash Received | |||||||||||||
| Sales Tax, VAT, HST/GST Received | 0.00% | $0 | $0 | $0 | $0 | $0 | $0 | $0 | $0 | $0 | $0 | $0 | $0 |
| New Current Borrowing | $0 | $0 | $0 | $0 | $0 | $0 | $0 | $0 | $0 | $0 | $0 | $0 | |
| New Other Liabilities (interest-free) | $0 | $0 | $0 | $0 | $0 | $0 | $0 | $0 | $0 | $0 | $0 | $0 | |
| New Long-term Liabilities | $0 | $0 | $0 | $0 | $0 | $0 | $0 | $0 | $0 | $0 | $0 | $0 | |
| Sales of Other Current Assets | $0 | $0 | $0 | $0 | $0 | $0 | $0 | $0 | $0 | $0 | $0 | $0 | |
| Sales of Long-term Assets | $0 | $0 | $0 | $0 | $0 | $0 | $0 | $0 | $0 | $0 | $0 | $0 | |
| New Investment Received | $0 | $0 | $0 | $0 | $0 | $0 | $0 | $0 | $0 | $0 | $0 | $0 | |
| Subtotal Cash Received | $6,000 | $9,640 | $22,507 | $35,290 | $41,477 | $52,700 | $62,720 | $63,221 | $77,750 | $85,090 | $85,457 | $96,100 | |
| Expenditures | Month 1 | Month 2 | Month 3 | Month 4 | Month 5 | Month 6 | Month 7 | Month 8 | Month 9 | Month 10 | Month 11 | Month 12 | |
| Expenditures from Operations | |||||||||||||
| Cash Spending | $6,000 | $6,000 | $6,000 | $8,000 | $8,000 | $8,000 | $14,250 | $14,250 | $14,250 | $22,000 | $22,000 | $22,000 | |
| Bill Payments | $50,868 | $26,150 | $29,217 | $34,577 | $49,850 | $49,850 | $50,005 | $54,848 | $65,288 | $65,593 | $74,450 | $74,450 | |
| Subtotal Spent on Operations | $56,868 | $32,150 | $35,217 | $42,577 | $57,850 | $57,850 | $64,255 | $69,098 | $79,538 | $87,593 | $96,450 | $96,450 | |
| Additional Cash Spent | |||||||||||||
| Sales Tax, VAT, HST/GST Paid Out | $0 | $0 | $0 | $0 | $0 | $0 | $0 | $0 | $0 | $0 | $0 | $0 | |
| Principal Repayment of Current Borrowing | $0 | $0 | $0 | $0 | $0 | $0 | $0 | $0 | $0 | $0 | $0 | $0 | |
| Other Liabilities Principal Repayment | $0 | $0 | $0 | $0 | $0 | $0 | $0 | $0 | $0 | $0 | $0 | $0 | |
| Long-term Liabilities Principal Repayment | $0 | $0 | $0 | $0 | $0 | $0 | $0 | $0 | $0 | $0 | $0 | $0 | |
| Purchase Other Current Assets | $0 | $0 | $0 | $0 | $0 | $0 | $0 | $0 | $0 | $0 | $0 | $0 | |
| Purchase Long-term Assets | $0 | $0 | $0 | $0 | $0 | $0 | $0 | $0 | $0 | $0 | $0 | $0 | |
| Dividends | $0 | $0 | $0 | $0 | $0 | $0 | $0 | $0 | $0 | $0 | $0 | $0 | |
| Subtotal Cash Spent | $56,868 | $32,150 | $35,217 | $42,577 | $57,850 | $57,850 | $64,255 | $69,098 | $79,538 | $87,593 | $96,450 | $96,450 | |
| Net Cash Flow | ($50,868) | ($22,510) | ($12,710) | ($7,287) | ($16,373) | ($5,150) | ($1,535) | ($5,877) | ($1,788) | ($2,503) | ($10,993) | ($350) | |
| Cash Balance | $316,632 | $294,122 | $281,412 | $274,125 | $257,752 | $252,602 | $251,068 | $245,191 | $243,404 | $240,901 | $229,908 | $229,558 | |
| Pro Forma Balance Sheet | |||||||||||||
| Month 1 | Month 2 | Month 3 | Month 4 | Month 5 | Month 6 | Month 7 | Month 8 | Month 9 | Month 10 | Month 11 | Month 12 | ||
| Assets | Starting Balances | ||||||||||||
| Current Assets | |||||||||||||
| Cash | $367,500 | $316,632 | $294,122 | $281,412 | $274,125 | $257,752 | $252,602 | $251,068 | $245,191 | $243,404 | $240,901 | $229,908 | $229,558 |
| Accounts Receivable | $0 | $9,000 | $22,710 | $33,553 | $50,963 | $62,186 | $62,186 | $77,216 | $91,745 | $91,745 | $102,755 | $113,398 | $113,398 |
| Other Current Assets | $0 | $0 | $0 | $0 | $0 | $0 | $0 | $0 | $0 | $0 | $0 | $0 | $0 |
| Total Current Assets | $367,500 | $325,632 | $316,832 | $314,965 | $325,088 | $319,938 | $314,788 | $328,284 | $336,936 | $335,149 | $343,656 | $343,306 | $342,956 |
| Long-term Assets | |||||||||||||
| Long-term Assets | $20,000 | $20,000 | $20,000 | $20,000 | $20,000 | $20,000 | $20,000 | $20,000 | $20,000 | $20,000 | $20,000 | $20,000 | $20,000 |
| Accumulated Depreciation | $0 | $0 | $0 | $0 | $0 | $0 | $0 | $0 | $0 | $0 | $0 | $0 | $0 |
| Total Long-term Assets | $20,000 | $20,000 | $20,000 | $20,000 | $20,000 | $20,000 | $20,000 | $20,000 | $20,000 | $20,000 | $20,000 | $20,000 | $20,000 |
| Total Assets | $387,500 | $345,632 | $336,832 | $334,965 | $345,088 | $339,938 | $334,788 | $348,284 | $356,936 | $355,149 | $363,656 | $363,306 | $362,956 |
| Liabilities and Capital | Month 1 | Month 2 | Month 3 | Month 4 | Month 5 | Month 6 | Month 7 | Month 8 | Month 9 | Month 10 | Month 11 | Month 12 | |
| Current Liabilities | |||||||||||||
| Accounts Payable | $50,000 | $25,182 | $28,082 | $32,915 | $48,188 | $48,188 | $48,188 | $52,671 | $63,111 | $63,111 | $71,968 | $71,968 | $71,968 |
| Current Borrowing | $100,000 | $100,000 | $100,000 | $100,000 | $100,000 | $100,000 | $100,000 | $100,000 | $100,000 | $100,000 | $100,000 | $100,000 | $100,000 |
| Other Current Liabilities | $0 | $0 | $0 | $0 | $0 | $0 | $0 | $0 | $0 | $0 | $0 | $0 | $0 |
| Subtotal Current Liabilities | $150,000 | $125,182 | $128,082 | $132,915 | $148,188 | $148,188 | $148,188 | $152,671 | $163,111 | $163,111 | $171,968 | $171,968 | $171,968 |
| Long-term Liabilities | $0 | $0 | $0 | $0 | $0 | $0 | $0 | $0 | $0 | $0 | $0 | $0 | $0 |
| Total Liabilities | $150,000 | $125,182 | $128,082 | $132,915 | $148,188 | $148,188 | $148,188 | $152,671 | $163,111 | $163,111 | $171,968 | $171,968 | $171,968 |
| Paid-in Capital | $300,000 | $300,000 | $300,000 | $300,000 | $300,000 | $300,000 | $300,000 | $300,000 | $300,000 | $300,000 | $300,000 | $300,000 | $300,000 |
| Retained Earnings | ($62,500) | ($62,500) | ($62,500) | ($62,500) | ($62,500) | ($62,500) | ($62,500) | ($62,500) | ($62,500) | ($62,500) | ($62,500) | ($62,500) | ($62,500) |
| Earnings | $0 | ($17,050) | ($28,750) | ($35,450) | ($40,600) | ($45,750) | ($50,900) | ($41,888) | ($43,675) | ($45,463) | ($45,813) | ($46,163) | ($46,513) |
| Total Capital | $237,500 | $220,450 | $208,750 | $202,050 | $196,900 | $191,750 | $186,600 | $195,613 | $193,825 | $192,038 | $191,688 | $191,338 | $190,988 |
| Total Liabilities and Capital | $387,500 | $345,632 | $336,832 | $334,965 | $345,088 | $339,938 | $334,788 | $348,284 | $356,936 | $355,149 | $363,656 | $363,306 | $362,956 |
| Net Worth | $237,500 | $220,450 | $208,750 | $202,050 | $196,900 | $191,750 | $186,600 | $195,613 | $193,825 | $192,038 | $191,688 | $191,338 | $190,988 |


