
Borrow My Tools
Executive Summary
Borrow My Tools is a start-up company serving the San Mateo, CA community with home improvement tools for lease or rental. The business has been formed as a California S Corporation with Josh Taylor as the primary shareholder. Borrow My Tools will offer customers a range of common home improvement tools with benchmarked levels of customer service.
The Market
San Mateo has two distinct market segments that are Borrow My Tools’ most attractive customers. The first segment is individuals who are undertaking a home improvement project on their house. While some of these customers know exactly what they need in terms of tools, many of them are coming to Borrow My Tools specifically for the expertise and guidance for the home improvement project. The individuals have 54,050 potential group members. The annual growth rate of this segment is 5%. The second segment of customers are handymen who have been hired to complete a project for a client. Because the cost of purchasing tools is so high and there are so many tools to lease available, handymen are attracted to Borrow My Tools because of their plentiful leasing and rental options. The handymen have 1,200 potential segment member and a 4% growth rate.
Services
Borrow My Tools leases and rents a variety of tools. The tools have been categorized into three large groups: wood, exterior, and assorted. All of the tools that Borrow My Tools leases or rents are of the highest quality and are in outstanding condition. Borrow My Tools has developed a strategic relationship with a premier leasing company to allow customers to lease tools from them. Leasing is advantageous in many ways: the customer always has the nicest/newest version to work with, precious capital is not tied up, lines of credit from banks are not effected by leases, and certain tax advantages are conferred to the lessee.
Competitive Edge
Josh, a veteran of both the contractor industry and the tool rental/leasing industry is taking his industry observations and carving out a niche in the industry by emphasizing two competitive edges that will greatly assist Borrow My Tools in gaining market share:
- Highest-quality product offerings: If customers are going to lease or rent tools they want to use the best products. Borrow My Tools’ procurement process only purchases the finest tools in the respective category, ensuring that customers will be thrilled with the selection. In addition to starting with the highest quality tools, the products are meticulously maintained so that they continue to appear as new.
- Benchmarked customer service: The function of Borrow My Tools sales assistants is to help the customer in any way possible. This includes determining which tool is best for the job, explaining the proper way to use the tool, as well as offering suggestion on how best to complete the job. Every sales agent is the customer’s personal expert. It is Borrow My Tools’ mission to ensure every customer has their expectations exceeded.
Borrow My Tools is an exciting new concept that recognizes the competitor’s customer service short comings and leverages Borrow My Tools’ phenomenal customer support to address the market niche that wants a positive experience and needs assistance with their lease or rental. By adhering to a comprehensive rental business plan strategy, Borrow My Tools will quickly gain market share and transform this start-up’s business into a profitable venture.
Mission
Borrow My Tools’ mission is to offer the finest selection of home improvement tools for the San Mateo Community. Borrow My Tools will support the tools with the finest customer service. All customers will have their expectations exceeded.
Keys to Success
- Maintain a sufficient inventory of high-quality tools, kept in excellent condition.
- Ensure all staff are extremely knowledgeable on all of the offered tools.
- Maintain strict inventory and accounting controls, reducing overhead while assuring availability at the same time.
Objectives
- To have 70% of the tools rented by month seven.
- Reach profitability by year two.
- Achieve self-sustaining revenue by year two.
Company Summary
Borrow My Tools is a CA registered S corporation. Registration took place in January of 2004. The main shareholder is Josh Taylor. Borrow My Tools offers a range of home improvement tools which may be rented for intervals of less than one month and leased for intervals of more than a month. Tools will serve both individuals interested in improving their home as well as handymen.
Start-up Summary
Borrow My Tools will incur a variety of expenses associate with the start up phase of the business. Some expenses will be equipment related, for inventory as well as for operations. Other expenses will be from service providers used to assist in the development of operations. The following is a partial list:
Service providers
- Attorney: Corporate formation.
- Accountant: PeachTree set up including inventory module.
Inventory equipment
Assorted range of all the tools that will be rented. For a current complete list of the available tools please view the Services section.
Computer system
- Three workstations with Microsoft Office licenses
- PeachTree Accounting with network access
- Two laser printers
- Broadband Internet connection
Retail space equipment
- Assorted shelving units
- Three desk-based work areas
- Assorted light fixtures
Repair area
Variety of tools for maintenance and repair of the tool inventory.
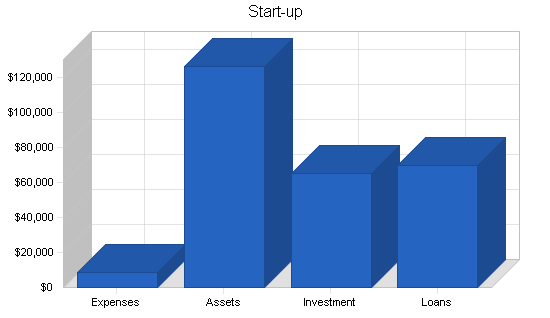
| Start-up Funding | |
| Start-up Expenses to Fund | $8,400 |
| Start-up Assets to Fund | $126,600 |
| Total Funding Required | $135,000 |
| Assets | |
| Non-cash Assets from Start-up | $60,000 |
| Cash Requirements from Start-up | $66,600 |
| Additional Cash Raised | $0 |
| Cash Balance on Starting Date | $66,600 |
| Total Assets | $126,600 |
| Liabilities and Capital | |
| Liabilities | |
| Current Borrowing | $0 |
| Long-term Liabilities | $70,000 |
| Accounts Payable (Outstanding Bills) | $0 |
| Other Current Liabilities (interest-free) | $0 |
| Total Liabilities | $70,000 |
| Capital | |
| Planned Investment | |
| Investor 1 | $65,000 |
| Other | $0 |
| Additional Investment Requirement | $0 |
| Total Planned Investment | $65,000 |
| Loss at Start-up (Start-up Expenses) | ($8,400) |
| Total Capital | $56,600 |
| Total Capital and Liabilities | $126,600 |
| Total Funding | $135,000 |
| Start-up | |
| Requirements | |
| Start-up Expenses | |
| Attorney | $3,000 |
| Accountant | $4,000 |
| Brochures | $500 |
| Insurance | $150 |
| Rent | $750 |
| Total Start-up Expenses | $8,400 |
| Start-up Assets | |
| Cash Required | $66,600 |
| Start-up Inventory | $0 |
| Other Current Assets | $0 |
| Long-term Assets | $60,000 |
| Total Assets | $126,600 |
| Total Requirements | $135,000 |
Company Ownership
Borrow My Tools is an S Corp owned primarily by Josh Taylor.
Services
Borrow My Tools offers the San Mateo community a wide range of tools that can be rented or leased depending on the length of time needed. Borrow My Tools will offer a bright, cheerful showroom. Customers will be greeted when they walk in and offered assistance. While Borrow My Tools rents tools, the real service is the attention that the customer receives. This takes the form of assistance in determining what tools are needed. The customer is then shown exactly how to use the tool and given plenty of tips to make them as proficient as possible.
The tools are available for rent if the borrowing period is less than one month and are available for lease for periods beyond one month. Tools that will be leased/rented are grouped into three broad categories:
Wood
- Radial arm saw
- Drum sander
- Sawzall
- Router
- Lathe
- Planer
Assorted
- Industrial cordless drill. This unit is rented with several battery packs
- Nail gun
- Air compressor. For use with the nail gun, paint sprayer, and pressure washer
Exterior products
- Pressure washer
- Paint sprayer. Also included is a roller attachment
- Roto tiller
While this selection may seem eclectic, it touches upon the most demanded tools within a specific genre. While many different rental facilities have a wider selection, Borrow My Tools believes that they can better serve their customers by reducing the selection of leases and rentals and offering a far more knowledgeable and helpful staff regarding the specific tool. As the selection of the tools increase, staff members knowledge and skill of each individual tool decreases exponentially.

Borrow My Tools provides each customer with an instruction manual for each tool which includes how best to use it, maintenance instructions, and ideal applications for the tool. While customers are likely to find this printed information useful, the knowledge communicated by the sales staff will be even more helpful.
For leasing customers, Borrow My Tools has developed a strategic relationship with a premier local leasing company that will assist with the financials aspect of leasing. Borrow My Tools is also able to work with another leasing company if their preferred vendor is not able to assist the customer. Several leases are available, some that that provide a $1 buyout for the customer at the end of the term. Others leases keep the buy out price higher, effectively reducing the money payments. Leasing equipment for many different people is a very useful option. Leasing provides the following benefits:
- Frees up working capital.
- Protects line-of-credit. Lease payments do not have an impact on bank credit line.
- Eliminates obsolescence. Provides up-to-date equipment.
- Gain tax advantages. Lease is tax deductible as a business expense.
- Lower monthly payments.
Market Analysis Summary
Borrow My Tools has identified two distinct customer segments that will be the most attractive. The first segment is individuals who will be performing home improvement work themselves. The second is the handyman who will be performing a job in a client’s house and need to use tools which he/she does not own. The Market Segmentation section provides additional detail about the market segment including useful demographic data. This section is also supported by a table with additional detail about the two markets.
Market Segmentation
Borrow My Tools has identified two segments of the market that are most attractive to the tool rental/lease business model: individuals and handymen.
Individuals: This market segment is homeowners who are interested in undertaking a home improvement project but do not have the equipment to compete the project. They may already possess the skills to complete the job or have the aptitude to learn with a Borrow My Tools’ sales assistant’s help.
- The individuals have typically owned the home for one to three years, or for more than ten years.
- Ages 30-45
- 76% have undergraduate schooling
- 59% perform other forms of home improvements around the house
- Only 16% will be coming to Borrow My Tools for their very first home improvement project
- 43% will be having one of their more experienced friends assisting them with the project on hand
Handymen: This is the market segment of service providers who perform a wide range of home improvement services for customers. The average handyman does not have all the tools needed to complete a job. There are so many different tools out there and the industrial quality ones cost so much that is often not cost effective for a handyman to own all of the tools that he may need. Borrow My Tools will serve the handyman market well with high quality, good condition industrial offerings.

| Market Analysis | |||||||
| Year 1 | Year 2 | Year 3 | Year 4 | Year 5 | |||
| Potential Customers | Growth | CAGR | |||||
| Individuals | 5% | 54,050 | 56,753 | 59,591 | 62,571 | 65,700 | 5.00% |
| Handyman | 4% | 1,200 | 1,248 | 1,298 | 1,350 | 1,404 | 4.00% |
| Total | 4.98% | 55,250 | 58,001 | 60,889 | 63,921 | 67,104 | 4.98% |
Target Market Segment Strategy
Borrow My Tools has selected these two customer segments because they will provide the most revenue to Borrow My Tools relative to other customer groups. Individuals will be a significant revenue driver since they are all home owners who are looking to make improvements in their home. The unexpected costs of home ownership create a great incentive to pursue improvement projects themselves as a means of saving money. As long as the individual has the time (often what weekends are for) and a sense of adventure, they can go to Borrow My Tools, rent or lease tools, receive instructions on how to use them and complete the home improvement project on their own, saving significant amounts of money.
Knowledgeable friends and neighbors are often at the disposal of our individuals segment and this is great for Borrow My Tools’ business because it creates incentives for individuals to undertake projects a bit out of their skill range, feeling the comfort that they will have the help of a neighbor/friend to guide them through the project. Often the neighbor will tell then to go and rent a specific tool and that they will show them how to use it.
Handymen are also a great target segment because they are more likely to undertake the leasing option relative to the individuals. While many handymen have a significant collection of tools, it is difficult for them to have every tool since there are just so many. From a capital expenditure standpoint it makes sense not to buy every conceivable tool, but to rent or lease tools on an as needed basis. The handymen typically already have the skills to operate the tools, they just are being conservative with their limited capital resources. They will rent or lease the tool when they have a job that requires it. Having a leasing option significantly decreases overhead.
Service Business Analysis
The tool/equipment rental/leasing industry is a large, disperse industry. Some companies only lease high-end expensive equipment, such as equipment that is in excess of $100K. For lower priced equipment you see leasing as well as rentals as an option. Most companies in this industry compete on selection. Their philosophy is the greater the selection, the more competitive they are. This tends to serve a specific type of customer, someone who knows exactly what they want or need. When a customer enters the retail space of one of these companies they are shown a long list of available equipment and are asked to make a choice.
Borrow My Tools has decided to compete on different terms. Selection is not of primarily importance, but customer service and support are. Through a careful selection of the most important or used tools, Borrow My Tools has chosen a good selection of popular tools that are supported with a knowledgeable staff.
The following Competition and Buying Patterns section details the specific competitors that Borrow My Tools faces in the San Mateo market and provides the pro and cons of the different competitors.
Competition and Buying Patterns
A-Z Rentals
A large, comprehensive rental company. Selection, not service is key here.
- Pros: Rents a wide range of tools and equipment including wood tools, machining tools, catering supplies, even pianos.
- Cons: The staff is not able to provide support for products.
The Tool Shed
A tool leasing company that leases a wide range of tools. The primary customers are contractors.
- Pros: Wide selection of high end tools, a lot of leasing options.
- Cons: Tool experts need only apply, this company does not hold the hands of beginners.
Strategy and Implementation Summary
Borrow My Tools will seek to leverage its competitive edges to quickly gain market share. Borrow My Tools has developed a marketing strategy that will generate visibility for the company regarding the various services that it offers. The sales campaign will have the goal of converting possible customers or one-time customers into dedicated, frequent users of Borrow My Tools’ services. The proper implementation of these strategies will be a key element in Borrow My Tools market penetration and growth into a profitable business.
Competitive Edge
Borrow My Tools will focus on two key elements which comprise the competitive edge, an advantage that will assist in fast growth in the market:
- High quality products: Borrow My Tools will only rent the highest-quality tools. For so many customers the decision of who to lease/rent from comes down to the tools that they have to use. Are the tools high end, industrial quality? What is the condition of the tools, have they been well maintained?
- Outstanding customer service: Borrow My Tools recognizes that in order to be competitive, it must support leases and rentals with the highest quality customer service. All sales agents are trained in the various tools. In fact, the training is supplementary to the existing knowledge of the tools. The sales agents are hired based on their existing knowledge. Another component of the customer service is the assistance the agents provide in terms of offering insight into “best practices” for the given job that the customer is looking to fulfill.
Marketing Strategy
Borrow My Tools will use a targeted marketing campaign as a way of developing visibility for the company. The marketing campaign will concentrate on the following consumer benefits:
- A wide range of leasing and rental options.
- A good selection of the most popular tools.
- All tools are top of the line, meticulously maintained.
- Borrow My Tools offers the highest level of customer service. Each customer’s hand will be held through the entire process ensuring that their needs are met. If a customer has never used a specific tool before, Borrow My Tools will show the customer exactly how to use it so that they have complete comfort in the operation of the tool.
Several different marketing methods will be used:
Newspaper Advertisements
Borrow My Tools will place newspaper advertisements in the local newspaper to raise awareness about the various services that it offers.
Yellow Pages
Borrow My Tools will also have a half page advertisement in the Yellow Pages. It expects a significant amount of business from the Yellow Pages. This is based on the philosophy that when a person is interested in a service they are not familiar with they will consult the Yellow Pages.
Sales Strategy
Borrow My Tools’ sales strategy is concerned with the need to convert one-time users into frequent customers. This is especially important because any person that has a home and an improvement project has many different projects. This also applies to the handymen whose full-time job is the completion of projects that require specific tools. If Borrow My Tools is able to impress the handymen then they will make Borrow My Tools their preferred vendor.
The assurance of increased sales, driven on repeat business is quite simple, ensure that customers always have their expectations exceeded. Additionally, a customer who is happy with a service provider is will tell friends about their positive experiences. A referral from a personal friend based on experience are often the strongest recommendations that can be offered.
Sales Forecast
The sales forecast will be tracked by the different tool categories that Borrow My Tools offers. The cost of goods sold will be based on the time it takes for the service department to review each pice of leased/rented equipment and bring it back to like new specifications for the next customer.
The sales forecast is a conservative prediction of sales. It is broken down by month for year one and tracks yearly totals for years two and three. Preceding the following table are graphical representations of the forecast by month as well as year.


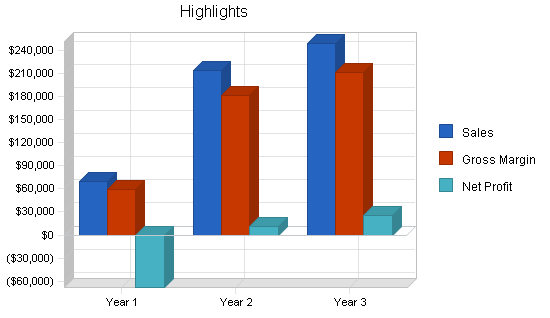
| Sales Forecast | |||
| Year 1 | Year 2 | Year 3 | |
| Sales | |||
| Wood | $26,550 | $81,080 | $94,400 |
| Assorted | $23,099 | $70,540 | $82,128 |
| Exterior | $20,178 | $61,621 | $71,744 |
| Total Sales | $69,827 | $213,240 | $248,272 |
| Direct Cost of Sales | Year 1 | Year 2 | Year 3 |
| Wood | $2,655 | $8,108 | $9,440 |
| Assorted | $3,927 | $11,992 | $13,962 |
| Exterior | $3,834 | $11,708 | $13,631 |
| Subtotal Direct Cost of Sales | $10,416 | $31,808 | $37,033 |
Milestones
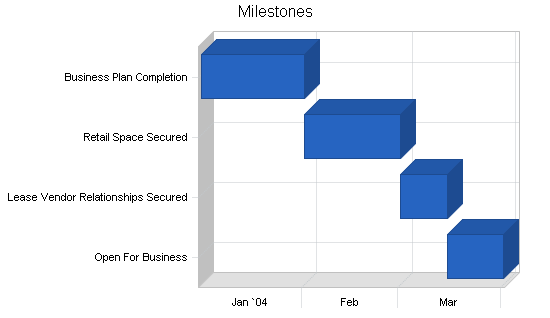
Borrow My Tools has identified several milestones that will assist the organization in reaching pre-identified goals. Milestones were chosen to be realistic, achievable, yet lofty. The following table details the specific milestones, what department is responsible and the time frame for accomplishment.
| Milestones | |||||
| Milestone | Start Date | End Date | Budget | Manager | Department |
| Business Plan Completion | 1/1/2004 | 2/1/2004 | $0 | Josh | Business Develpment |
| Retail Space Secured | 2/1/2004 | 3/1/2004 | $0 | Josh | Business Develpment |
| Lease Vendor Relationships Secured | 3/1/2004 | 3/15/2004 | $0 | Josh | Business Develpment |
| Open For Business | 3/15/2004 | 4/1/2004 | $0 | Josh | Operations |
| Totals | $0 | ||||
Web Plan Summary
A website will be developed to allow customers to view a lease/rental catalog at their convenience. The site will offer descriptions of the different tools as well as tips on proper use. When the tool selection changes the site will be updated.
Website Marketing Strategy
- Submission to search engines: The site will be submitted to various search engines so when someone enters a common keyword into the search engine, Borrow My Tools’ site comes up on the list of “hits.”
- The Web address will be printed on all forms of literature: This includes all invoices, advertisements, and other promotional material.
Development Requirements
Borrow My Tools has informally discussed the production of the website with a local teacher who does website programming as a side job.
Management Summary
Josh Taylor received his undergraduate degree in small business management from the University of California. Following his schooling, Josh worked for seven years for a contractor. Then he worked at a local tool rental facility and within two years he advanced to the manager’s position.
Personnel Plan
The following people/positions will be needed for Borrow My Tools:
- Josh: Will play the manager position, but will also be doing a little bit of everything.
- Sales: There will be a total of three sales assistants.
- Accounting/bookkeeper: This is a part-time position.
- Service technicians: There will be two technicians who are responsible for the maintenance and preparation of the various tools.
| Personnel Plan | |||
| Year 1 | Year 2 | Year 3 | |
| Josh | $20,000 | $24,000 | $30,000 |
| Sales | $14,400 | $19,200 | $19,200 |
| Sales | $11,200 | $19,200 | $19,200 |
| Bookkeeper | $9,000 | $12,000 | $12,000 |
| Service | $16,200 | $21,600 | $21,600 |
| Service | $14,400 | $21,600 | $21,600 |
| Total People | 6 | 6 | 6 |
| Total Payroll | $85,200 | $117,600 | $123,600 |
Financial Plan
The following sections will outline important financial information.
Important Assumptions
The following table details important financial assumptions.
| General Assumptions | |||
| Year 1 | Year 2 | Year 3 | |
| Plan Month | 1 | 2 | 3 |
| Current Interest Rate | 10.00% | 10.00% | 10.00% |
| Long-term Interest Rate | 10.00% | 10.00% | 10.00% |
| Tax Rate | 30.00% | 30.00% | 30.00% |
| Other | 0 | 0 | 0 |
Break-even Analysis
The Break-even Analysis table and chart indicate what is needed in monthly revenue to reach the break even point.

| Break-even Analysis | |
| Monthly Revenue Break-even | $11,869 |
| Assumptions: | |
| Average Percent Variable Cost | 15% |
| Estimated Monthly Fixed Cost | $10,098 |
Projected Profit and Loss
The following table and charts will indicate projected profit and loss.


| Pro Forma Profit and Loss | |||
| Year 1 | Year 2 | Year 3 | |
| Sales | $69,827 | $213,240 | $248,272 |
| Direct Cost of Sales | $10,416 | $31,808 | $37,033 |
| Other Costs of Sales | $0 | $0 | $0 |
| Total Cost of Sales | $10,416 | $31,808 | $37,033 |
| Gross Margin | $59,411 | $181,433 | $211,239 |
| Gross Margin % | 85.08% | 85.08% | 85.08% |
| Expenses | |||
| Payroll | $85,200 | $117,600 | $123,600 |
| Sales and Marketing and Other Expenses | $0 | $0 | $0 |
| Depreciation | $12,000 | $12,000 | $16,000 |
| Rent | $7,500 | $9,000 | $9,000 |
| Utilities | $2,200 | $2,640 | $2,640 |
| Insurance | $1,500 | $1,800 | $1,800 |
| Payroll Taxes | $12,780 | $17,640 | $18,540 |
| Total Operating Expenses | $121,180 | $160,680 | $171,580 |
| Profit Before Interest and Taxes | ($61,769) | $20,753 | $39,659 |
| EBITDA | ($49,769) | $32,753 | $55,659 |
| Interest Expense | $6,394 | $5,317 | $4,219 |
| Taxes Incurred | $0 | $4,631 | $10,632 |
| Net Profit | ($68,163) | $10,805 | $24,808 |
| Net Profit/Sales | -97.62% | 5.07% | 9.99% |
Projected Cash Flow
The following table and chart will indicate projected cash flow.

| Pro Forma Cash Flow | |||
| Year 1 | Year 2 | Year 3 | |
| Cash Received | |||
| Cash from Operations | |||
| Cash Sales | $69,827 | $213,240 | $248,272 |
| Subtotal Cash from Operations | $69,827 | $213,240 | $248,272 |
| Additional Cash Received | |||
| Sales Tax, VAT, HST/GST Received | $0 | $0 | $0 |
| New Current Borrowing | $0 | $0 | $0 |
| New Other Liabilities (interest-free) | $0 | $0 | $0 |
| New Long-term Liabilities | $0 | $0 | $0 |
| Sales of Other Current Assets | $0 | $0 | $0 |
| Sales of Long-term Assets | $0 | $0 | $0 |
| New Investment Received | $0 | $0 | $0 |
| Subtotal Cash Received | $69,827 | $213,240 | $248,272 |
| Expenditures | Year 1 | Year 2 | Year 3 |
| Expenditures from Operations | |||
| Cash Spending | $85,200 | $117,600 | $123,600 |
| Bill Payments | $38,101 | $79,195 | $78,378 |
| Subtotal Spent on Operations | $123,301 | $196,795 | $201,978 |
| Additional Cash Spent | |||
| Sales Tax, VAT, HST/GST Paid Out | $0 | $0 | $0 |
| Principal Repayment of Current Borrowing | $0 | $0 | $0 |
| Other Liabilities Principal Repayment | $0 | $0 | $0 |
| Long-term Liabilities Principal Repayment | $11,359 | $10,938 | $11,029 |
| Purchase Other Current Assets | $0 | $0 | $0 |
| Purchase Long-term Assets | $0 | $0 | $20,000 |
| Dividends | $0 | $0 | $0 |
| Subtotal Cash Spent | $134,660 | $207,733 | $233,007 |
| Net Cash Flow | ($64,833) | $5,507 | $15,265 |
| Cash Balance | $1,767 | $7,274 | $22,539 |
Projected Balance Sheet
The following table will indicate the projected balance sheet.
| Pro Forma Balance Sheet | |||
| Year 1 | Year 2 | Year 3 | |
| Assets | |||
| Current Assets | |||
| Cash | $1,767 | $7,274 | $22,539 |
| Inventory | $1,683 | $10,372 | $4,604 |
| Other Current Assets | $0 | $0 | $0 |
| Total Current Assets | $3,450 | $17,646 | $27,143 |
| Long-term Assets | |||
| Long-term Assets | $60,000 | $60,000 | $80,000 |
| Accumulated Depreciation | $12,000 | $24,000 | $40,000 |
| Total Long-term Assets | $48,000 | $36,000 | $40,000 |
| Total Assets | $51,450 | $53,646 | $67,143 |
| Liabilities and Capital | Year 1 | Year 2 | Year 3 |
| Current Liabilities | |||
| Accounts Payable | $4,372 | $6,701 | $6,419 |
| Current Borrowing | $0 | $0 | $0 |
| Other Current Liabilities | $0 | $0 | $0 |
| Subtotal Current Liabilities | $4,372 | $6,701 | $6,419 |
| Long-term Liabilities | $58,641 | $47,703 | $36,674 |
| Total Liabilities | $63,013 | $54,404 | $43,093 |
| Paid-in Capital | $65,000 | $65,000 | $65,000 |
| Retained Earnings | ($8,400) | ($76,563) | ($65,758) |
| Earnings | ($68,163) | $10,805 | $24,808 |
| Total Capital | ($11,563) | ($758) | $24,050 |
| Total Liabilities and Capital | $51,450 | $53,646 | $67,143 |
| Net Worth | ($11,563) | ($758) | $24,050 |
Business Ratios
The following table represents ratios specific to Borrow My Tools as well as industry average ratios.
| Ratio Analysis | ||||
| Year 1 | Year 2 | Year 3 | Industry Profile | |
| Sales Growth | n.a. | 205.39% | 16.43% | 7.07% |
| Percent of Total Assets | ||||
| Inventory | 3.27% | 19.33% | 6.86% | 3.96% |
| Other Current Assets | 0.00% | 0.00% | 0.00% | 44.65% |
| Total Current Assets | 6.70% | 32.89% | 40.43% | 76.22% |
| Long-term Assets | 93.30% | 67.11% | 59.57% | 23.78% |
| Total Assets | 100.00% | 100.00% | 100.00% | 100.00% |
| Current Liabilities | 8.50% | 12.49% | 9.56% | 33.47% |
| Long-term Liabilities | 113.98% | 88.92% | 54.62% | 16.23% |
| Total Liabilities | 122.47% | 101.41% | 64.18% | 49.70% |
| Net Worth | -22.47% | -1.41% | 35.82% | 50.30% |
| Percent of Sales | ||||
| Sales | 100.00% | 100.00% | 100.00% | 100.00% |
| Gross Margin | 85.08% | 85.08% | 85.08% | 100.00% |
| Selling, General & Administrative Expenses | 182.70% | 80.02% | 75.09% | 84.88% |
| Advertising Expenses | 0.00% | 0.00% | 0.00% | 1.01% |
| Profit Before Interest and Taxes | -88.46% | 9.73% | 15.97% | 1.94% |
| Main Ratios | ||||
| Current | 0.79 | 2.63 | 4.23 | 1.73 |
| Quick | 0.40 | 1.09 | 3.51 | 1.33 |
| Total Debt to Total Assets | 122.47% | 101.41% | 64.18% | 3.77% |
| Pre-tax Return on Net Worth | 589.49% | -2035.50% | 147.36% | 57.72% |
| Pre-tax Return on Assets | -132.49% | 28.77% | 52.78% | 8.92% |
| Additional Ratios | Year 1 | Year 2 | Year 3 | |
| Net Profit Margin | -97.62% | 5.07% | 9.99% | n.a |
| Return on Equity | 0.00% | 0.00% | 103.15% | n.a |
| Activity Ratios | ||||
| Inventory Turnover | 9.37 | 5.28 | 4.95 | n.a |
| Accounts Payable Turnover | 9.72 | 12.17 | 12.17 | n.a |
| Payment Days | 27 | 25 | 31 | n.a |
| Total Asset Turnover | 1.36 | 3.97 | 3.70 | n.a |
| Debt Ratios | ||||
| Debt to Net Worth | 0.00 | 0.00 | 1.79 | n.a |
| Current Liab. to Liab. | 0.07 | 0.12 | 0.15 | n.a |
| Liquidity Ratios | ||||
| Net Working Capital | ($922) | $10,945 | $20,724 | n.a |
| Interest Coverage | -9.66 | 3.90 | 9.40 | n.a |
| Additional Ratios | ||||
| Assets to Sales | 0.74 | 0.25 | 0.27 | n.a |
| Current Debt/Total Assets | 8% | 12% | 10% | n.a |
| Acid Test | 0.40 | 1.09 | 3.51 | n.a |
| Sales/Net Worth | 0.00 | 0.00 | 10.32 | n.a |
| Dividend Payout | 0.00 | 0.00 | 0.00 | n.a |
Appendix
| Sales Forecast | |||||||||||||
| Month 1 | Month 2 | Month 3 | Month 4 | Month 5 | Month 6 | Month 7 | Month 8 | Month 9 | Month 10 | Month 11 | Month 12 | ||
| Sales | |||||||||||||
| Wood | 0% | $0 | $0 | $350 | $800 | $1,350 | $1,800 | $3,100 | $3,500 | $3,750 | $3,900 | $4,100 | $3,900 |
| Assorted | 0% | $0 | $0 | $305 | $696 | $1,175 | $1,566 | $2,697 | $3,045 | $3,263 | $3,393 | $3,567 | $3,393 |
| Exterior | 0% | $0 | $0 | $266 | $608 | $1,026 | $1,368 | $2,356 | $2,660 | $2,850 | $2,964 | $3,116 | $2,964 |
| Total Sales | $0 | $0 | $921 | $2,104 | $3,551 | $4,734 | $8,153 | $9,205 | $9,863 | $10,257 | $10,783 | $10,257 | |
| Direct Cost of Sales | Month 1 | Month 2 | Month 3 | Month 4 | Month 5 | Month 6 | Month 7 | Month 8 | Month 9 | Month 10 | Month 11 | Month 12 | |
| Wood | $0 | $0 | $35 | $80 | $135 | $180 | $310 | $350 | $375 | $390 | $410 | $390 | |
| Assorted | $0 | $0 | $52 | $118 | $200 | $266 | $458 | $518 | $555 | $577 | $606 | $577 | |
| Exterior | $0 | $0 | $51 | $116 | $195 | $260 | $448 | $505 | $542 | $563 | $592 | $563 | |
| Subtotal Direct Cost of Sales | $0 | $0 | $137 | $314 | $530 | $706 | $1,216 | $1,373 | $1,471 | $1,530 | $1,608 | $1,530 | |
| Personnel Plan | |||||||||||||
| Month 1 | Month 2 | Month 3 | Month 4 | Month 5 | Month 6 | Month 7 | Month 8 | Month 9 | Month 10 | Month 11 | Month 12 | ||
| Josh | 0% | $0 | $0 | $2,000 | $2,000 | $2,000 | $2,000 | $2,000 | $2,000 | $2,000 | $2,000 | $2,000 | $2,000 |
| Sales | 0% | $0 | $0 | $0 | $1,600 | $1,600 | $1,600 | $1,600 | $1,600 | $1,600 | $1,600 | $1,600 | $1,600 |
| Sales | 0% | $0 | $0 | $0 | $0 | $0 | $1,600 | $1,600 | $1,600 | $1,600 | $1,600 | $1,600 | $1,600 |
| Bookkeeper | 0% | $0 | $0 | $0 | $1,000 | $1,000 | $1,000 | $1,000 | $1,000 | $1,000 | $1,000 | $1,000 | $1,000 |
| Service | 0% | $0 | $0 | $0 | $1,800 | $1,800 | $1,800 | $1,800 | $1,800 | $1,800 | $1,800 | $1,800 | $1,800 |
| Service | 0% | $0 | $0 | $0 | $0 | $1,800 | $1,800 | $1,800 | $1,800 | $1,800 | $1,800 | $1,800 | $1,800 |
| Total People | 0 | 0 | 1 | 4 | 5 | 6 | 6 | 6 | 6 | 6 | 6 | 6 | |
| Total Payroll | $0 | $0 | $2,000 | $6,400 | $8,200 | $9,800 | $9,800 | $9,800 | $9,800 | $9,800 | $9,800 | $9,800 | |
| General Assumptions | |||||||||||||
| Month 1 | Month 2 | Month 3 | Month 4 | Month 5 | Month 6 | Month 7 | Month 8 | Month 9 | Month 10 | Month 11 | Month 12 | ||
| Plan Month | 1 | 2 | 3 | 4 | 5 | 6 | 7 | 8 | 9 | 10 | 11 | 12 | |
| Current Interest Rate | 10.00% | 10.00% | 10.00% | 10.00% | 10.00% | 10.00% | 10.00% | 10.00% | 10.00% | 10.00% | 10.00% | 10.00% | |
| Long-term Interest Rate | 10.00% | 10.00% | 10.00% | 10.00% | 10.00% | 10.00% | 10.00% | 10.00% | 10.00% | 10.00% | 10.00% | 10.00% | |
| Tax Rate | 30.00% | 30.00% | 30.00% | 30.00% | 30.00% | 30.00% | 30.00% | 30.00% | 30.00% | 30.00% | 30.00% | 30.00% | |
| Other | 0 | 0 | 0 | 0 | 0 | 0 | 0 | 0 | 0 | 0 | 0 | 0 | |
| Pro Forma Profit and Loss | |||||||||||||
| Month 1 | Month 2 | Month 3 | Month 4 | Month 5 | Month 6 | Month 7 | Month 8 | Month 9 | Month 10 | Month 11 | Month 12 | ||
| Sales | $0 | $0 | $921 | $2,104 | $3,551 | $4,734 | $8,153 | $9,205 | $9,863 | $10,257 | $10,783 | $10,257 | |
| Direct Cost of Sales | $0 | $0 | $137 | $314 | $530 | $706 | $1,216 | $1,373 | $1,471 | $1,530 | $1,608 | $1,530 | |
| Other Costs of Sales | $0 | $0 | $0 | $0 | $0 | $0 | $0 | $0 | $0 | $0 | $0 | $0 | |
| Total Cost of Sales | $0 | $0 | $137 | $314 | $530 | $706 | $1,216 | $1,373 | $1,471 | $1,530 | $1,608 | $1,530 | |
| Gross Margin | $0 | $0 | $783 | $1,790 | $3,021 | $4,028 | $6,937 | $7,832 | $8,391 | $8,727 | $9,175 | $8,727 | |
| Gross Margin % | 0.00% | 0.00% | 85.08% | 85.08% | 85.08% | 85.08% | 85.08% | 85.08% | 85.08% | 85.08% | 85.08% | 85.08% | |
| Expenses | |||||||||||||
| Payroll | $0 | $0 | $2,000 | $6,400 | $8,200 | $9,800 | $9,800 | $9,800 | $9,800 | $9,800 | $9,800 | $9,800 | |
| Sales and Marketing and Other Expenses | $0 | $0 | $0 | $0 | $0 | $0 | $0 | $0 | $0 | $0 | $0 | $0 | |
| Depreciation | $1,000 | $1,000 | $1,000 | $1,000 | $1,000 | $1,000 | $1,000 | $1,000 | $1,000 | $1,000 | $1,000 | $1,000 | |
| Rent | $0 | $0 | $750 | $750 | $750 | $750 | $750 | $750 | $750 | $750 | $750 | $750 | |
| Utilities | $0 | $0 | $220 | $220 | $220 | $220 | $220 | $220 | $220 | $220 | $220 | $220 | |
| Insurance | 15% | $0 | $0 | $150 | $150 | $150 | $150 | $150 | $150 | $150 | $150 | $150 | $150 |
| Payroll Taxes | 15% | $0 | $0 | $300 | $960 | $1,230 | $1,470 | $1,470 | $1,470 | $1,470 | $1,470 | $1,470 | $1,470 |
| Total Operating Expenses | $1,000 | $1,000 | $4,420 | $9,480 | $11,550 | $13,390 | $13,390 | $13,390 | $13,390 | $13,390 | $13,390 | $13,390 | |
| Profit Before Interest and Taxes | ($1,000) | ($1,000) | ($3,637) | ($7,690) | ($8,529) | ($9,362) | ($6,453) | ($5,558) | ($4,999) | ($4,663) | ($4,215) | ($4,663) | |
| EBITDA | $0 | $0 | ($2,637) | ($6,690) | ($7,529) | ($8,362) | ($5,453) | ($4,558) | ($3,999) | ($3,663) | ($3,215) | ($3,663) | |
| Interest Expense | $576 | $568 | $561 | $553 | $545 | $537 | $529 | $521 | $513 | $505 | $497 | $489 | |
| Taxes Incurred | $0 | $0 | $0 | $0 | $0 | $0 | $0 | $0 | $0 | $0 | $0 | $0 | |
| Net Profit | ($1,576) | ($1,568) | ($4,197) | ($8,243) | ($9,074) | ($9,899) | ($6,982) | ($6,079) | ($5,512) | ($5,168) | ($4,712) | ($5,152) | |
| Net Profit/Sales | 0.00% | 0.00% | -455.99% | -391.76% | -255.57% | -209.11% | -85.64% | -66.04% | -55.89% | -50.39% | -43.70% | -50.23% | |
| Pro Forma Cash Flow | |||||||||||||
| Month 1 | Month 2 | Month 3 | Month 4 | Month 5 | Month 6 | Month 7 | Month 8 | Month 9 | Month 10 | Month 11 | Month 12 | ||
| Cash Received | |||||||||||||
| Cash from Operations | |||||||||||||
| Cash Sales | $0 | $0 | $921 | $2,104 | $3,551 | $4,734 | $8,153 | $9,205 | $9,863 | $10,257 | $10,783 | $10,257 | |
| Subtotal Cash from Operations | $0 | $0 | $921 | $2,104 | $3,551 | $4,734 | $8,153 | $9,205 | $9,863 | $10,257 | $10,783 | $10,257 | |
| Additional Cash Received | |||||||||||||
| Sales Tax, VAT, HST/GST Received | 0.00% | $0 | $0 | $0 | $0 | $0 | $0 | $0 | $0 | $0 | $0 | $0 | $0 |
| New Current Borrowing | $0 | $0 | $0 | $0 | $0 | $0 | $0 | $0 | $0 | $0 | $0 | $0 | |
| New Other Liabilities (interest-free) | $0 | $0 | $0 | $0 | $0 | $0 | $0 | $0 | $0 | $0 | $0 | $0 | |
| New Long-term Liabilities | $0 | $0 | $0 | $0 | $0 | $0 | $0 | $0 | $0 | $0 | $0 | $0 | |
| Sales of Other Current Assets | $0 | $0 | $0 | $0 | $0 | $0 | $0 | $0 | $0 | $0 | $0 | $0 | |
| Sales of Long-term Assets | $0 | $0 | $0 | $0 | $0 | $0 | $0 | $0 | $0 | $0 | $0 | $0 | |
| New Investment Received | $0 | $0 | $0 | $0 | $0 | $0 | $0 | $0 | $0 | $0 | $0 | $0 | |
| Subtotal Cash Received | $0 | $0 | $921 | $2,104 | $3,551 | $4,734 | $8,153 | $9,205 | $9,863 | $10,257 | $10,783 | $10,257 | |
| Expenditures | Month 1 | Month 2 | Month 3 | Month 4 | Month 5 | Month 6 | Month 7 | Month 8 | Month 9 | Month 10 | Month 11 | Month 12 | |
| Expenditures from Operations | |||||||||||||
| Cash Spending | $0 | $0 | $2,000 | $6,400 | $8,200 | $9,800 | $9,800 | $9,800 | $9,800 | $9,800 | $9,800 | $9,800 | |
| Bill Payments | $19 | $576 | $649 | $2,969 | $2,675 | $3,903 | $4,135 | $4,370 | $4,658 | $4,682 | $4,693 | $4,773 | |
| Subtotal Spent on Operations | $19 | $576 | $2,649 | $9,369 | $10,875 | $13,703 | $13,935 | $14,170 | $14,458 | $14,482 | $14,493 | $14,573 | |
| Additional Cash Spent | |||||||||||||
| Sales Tax, VAT, HST/GST Paid Out | $0 | $0 | $0 | $0 | $0 | $0 | $0 | $0 | $0 | $0 | $0 | $0 | |
| Principal Repayment of Current Borrowing | $0 | $0 | $0 | $0 | $0 | $0 | $0 | $0 | $0 | $0 | $0 | $0 | |
| Other Liabilities Principal Repayment | $0 | $0 | $0 | $0 | $0 | $0 | $0 | $0 | $0 | $0 | $0 | $0 | |
| Long-term Liabilities Principal Repayment | $904 | $911 | $919 | $927 | $934 | $942 | $950 | $958 | $966 | $974 | $982 | $990 | |
| Purchase Other Current Assets | $0 | $0 | $0 | $0 | $0 | $0 | $0 | $0 | $0 | $0 | $0 | $0 | |
| Purchase Long-term Assets | $0 | $0 | $0 | $0 | $0 | $0 | $0 | $0 | $0 | $0 | $0 | $0 | |
| Dividends | $0 | $0 | $0 | $0 | $0 | $0 | $0 | $0 | $0 | $0 | $0 | $0 | |
| Subtotal Cash Spent | $923 | $1,487 | $3,568 | $10,296 | $11,809 | $14,645 | $14,885 | $15,128 | $15,424 | $15,457 | $15,475 | $15,563 | |
| Net Cash Flow | ($923) | ($1,487) | ($2,647) | ($8,192) | ($8,259) | ($9,911) | ($6,732) | ($5,923) | ($5,561) | ($5,200) | ($4,692) | ($5,306) | |
| Cash Balance | $65,677 | $64,190 | $61,543 | $53,351 | $45,092 | $35,181 | $28,449 | $22,526 | $16,965 | $11,765 | $7,073 | $1,767 | |
| Pro Forma Balance Sheet | |||||||||||||
| Month 1 | Month 2 | Month 3 | Month 4 | Month 5 | Month 6 | Month 7 | Month 8 | Month 9 | Month 10 | Month 11 | Month 12 | ||
| Assets | Starting Balances | ||||||||||||
| Current Assets | |||||||||||||
| Cash | $66,600 | $65,677 | $64,190 | $61,543 | $53,351 | $45,092 | $35,181 | $28,449 | $22,526 | $16,965 | $11,765 | $7,073 | $1,767 |
| Inventory | $0 | $0 | $0 | $863 | $549 | $1,019 | $1,313 | $1,338 | $1,510 | $1,618 | $1,683 | $1,769 | $1,683 |
| Other Current Assets | $0 | $0 | $0 | $0 | $0 | $0 | $0 | $0 | $0 | $0 | $0 | $0 | $0 |
| Total Current Assets | $66,600 | $65,677 | $64,190 | $62,405 | $53,900 | $46,111 | $36,494 | $29,787 | $24,036 | $18,583 | $13,448 | $8,842 | $3,450 |
| Long-term Assets | |||||||||||||
| Long-term Assets | $60,000 | $60,000 | $60,000 | $60,000 | $60,000 | $60,000 | $60,000 | $60,000 | $60,000 | $60,000 | $60,000 | $60,000 | $60,000 |
| Accumulated Depreciation | $0 | $1,000 | $2,000 | $3,000 | $4,000 | $5,000 | $6,000 | $7,000 | $8,000 | $9,000 | $10,000 | $11,000 | $12,000 |
| Total Long-term Assets | $60,000 | $59,000 | $58,000 | $57,000 | $56,000 | $55,000 | $54,000 | $53,000 | $52,000 | $51,000 | $50,000 | $49,000 | $48,000 |
| Total Assets | $126,600 | $124,677 | $122,190 | $119,405 | $109,900 | $101,111 | $90,494 | $82,787 | $76,036 | $69,583 | $63,448 | $57,842 | $51,450 |
| Liabilities and Capital | Month 1 | Month 2 | Month 3 | Month 4 | Month 5 | Month 6 | Month 7 | Month 8 | Month 9 | Month 10 | Month 11 | Month 12 | |
| Current Liabilities | |||||||||||||
| Accounts Payable | $0 | $557 | $549 | $2,881 | $2,545 | $3,765 | $3,990 | $4,215 | $4,502 | $4,526 | $4,533 | $4,622 | $4,372 |
| Current Borrowing | $0 | $0 | $0 | $0 | $0 | $0 | $0 | $0 | $0 | $0 | $0 | $0 | $0 |
| Other Current Liabilities | $0 | $0 | $0 | $0 | $0 | $0 | $0 | $0 | $0 | $0 | $0 | $0 | $0 |
| Subtotal Current Liabilities | $0 | $557 | $549 | $2,881 | $2,545 | $3,765 | $3,990 | $4,215 | $4,502 | $4,526 | $4,533 | $4,622 | $4,372 |
| Long-term Liabilities | $70,000 | $69,096 | $68,185 | $67,265 | $66,339 | $65,404 | $64,462 | $63,512 | $62,554 | $61,588 | $60,614 | $59,632 | $58,641 |
| Total Liabilities | $70,000 | $69,653 | $68,734 | $70,147 | $68,884 | $69,169 | $68,452 | $67,727 | $67,056 | $66,114 | $65,147 | $64,254 | $63,013 |
| Paid-in Capital | $65,000 | $65,000 | $65,000 | $65,000 | $65,000 | $65,000 | $65,000 | $65,000 | $65,000 | $65,000 | $65,000 | $65,000 | $65,000 |
| Retained Earnings | ($8,400) | ($8,400) | ($8,400) | ($8,400) | ($8,400) | ($8,400) | ($8,400) | ($8,400) | ($8,400) | ($8,400) | ($8,400) | ($8,400) | ($8,400) |
| Earnings | $0 | ($1,576) | ($3,144) | ($7,341) | ($15,584) | ($24,658) | ($34,557) | ($41,540) | ($47,619) | ($53,131) | ($58,299) | ($63,012) | ($68,163) |
| Total Capital | $56,600 | $55,024 | $53,456 | $49,259 | $41,016 | $31,942 | $22,043 | $15,060 | $8,981 | $3,469 | ($1,699) | ($6,412) | ($11,563) |
| Total Liabilities and Capital | $126,600 | $124,677 | $122,190 | $119,405 | $109,900 | $101,111 | $90,494 | $82,787 | $76,036 | $69,583 | $63,448 | $57,842 | $51,450 |
| Net Worth | $56,600 | $55,024 | $53,456 | $49,259 | $41,016 | $31,942 | $22,043 | $15,060 | $8,981 | $3,469 | ($1,699) | ($6,412) | ($11,563) |

