
Kiowa Smoke Shops
Executive Summary
Introduction
Kiowa Smoke Shops LLC, (Kiowa) has been in operation as a family business since the early 1960’s. Kiowa offers named brand tobaccos, cigars, cigarettes, and roll-your-own accessories.
Over the past ten years, due to increasingly hostile regulations, judicial decisions, and tobacco opposition groups, the tobacco industry has suffered serious declines. Kiowa has seen a declining client base, increasing costs, and increasing difficulty with distribution channels. For the first time management has been forced to reduce staffing levels and institute pay cuts. It is for this reason that the company is seeking to create a revitalization plan for the future. This plan includes reducing costs, improving efficiencies, new distribution and marketing channels and a new venture into a combined cafe and tobacco store.
The Company
Kiowa Smoke Shops is a class C Limited Liability Company registered in the state of Kansas. Kiowa is exclusively owned by Mr. Fernando Renaldo and his wife, Elizabeth. The company does not anticipate bringing on new owners in the foreseeable future.
In 1960 Mr. Carlos Armando Renaldo and his family left their native Cuba for the U.S. Mr. Renaldo’s family had been tobacco growers in Cuba for generations, but the communist revolution in his homeland had left no opportunities for growers outside of government controlled communes. Once in America, Mr. Renaldo leveraged his family connections there to create Santiago Cigar Store in Orlando, Florida. Santiago’s catered to the growing Cuban population in the region and over the next 18 years the shop flourished. In 1979 the elder Renaldo sold the business to his son Fernando, who relocated the firm to Kansas City, Kansas. The younger Renaldo, wishing to conform to the midwest’s image, renamed the business Kiowa Smoke Shop. Since then the company has prospered enough for Mr. Renaldo to buy out two other tobacco shops.
Products
Kiowa Smoke Shops offers the widest variety of specialty and named brand tobacco products in the Kansas-Missouri area. These include cigars from Mexico, Spain, India, the UK, and other tobacco producing areas. We also have cigarettes, including national and foreign brands, roll-your-own products for those clients wishing to make their own cigarettes, pipe tobacco from around the world, plus accessories such as ashtrays, pipes, cigarette and cigar cases, fumidors etc.
The Market
The United States is the world’s leading tobacco exporter and importer and the second largest tobacco producer, behind only China. Most U.S. tobacco is used for cigarettes. However, both cigarette consumption and cigarette exports have fallen 16 percent since 1991, and the consumption of other tobacco products has suffered a similar loss. All of this makes for a current market situation that is unfavorable to Kiowa Smoke Shops. Since the Master Settlement Agreement (MSA) was signed in November 1998, cigarette companies have been forced to boost prices as a result of payments required by the settlement. Higher prices have curtailed consumption. The long-term decline in cigarette consumption due to non-economic factors continues as well, as private tobacco opposition and health care organizations continue to push for the elimination of all smoking throughout the nation.
Kiowa possesses a number of competitive advantages however. These includes established supply channels and its various cost advantages that are difficult to replicate, multiple locations in the Kansas City area, and our future combined cafe and tobacco store that will create more volume and greater client loyalty. This facility will act as a pilot project to determine the long-term profitability of this concept. If it proves popular, we plan to expand all of our facilities to include this unique customer experience.
Kiowa is limited in the types of marketing it can do. However, we plan to advertise in specialty publications such as Smokehouse, Cigar Connoisseur, and others. In addition, we are targeting a number of local magazines such as Kansas Highways, Midwest Life, and others that cater to upper-income people. We are also in the process of creating partnerships with other internet firms to create Internet links to our existing informational website. When we launch our online ordering features we will intensify these efforts.
Financial Considerations
Kiowa is a limited debt company and intends to stay that way. We expect to see increased profits from our revitalization efforts by the end of Year 1. Over the next three years we expect that much of our profits will be invested into our new website and cafe ventures. We do not anticipate any serious cash problems.
1.1 Objectives
The overall decline of the tobacco industry has lead to lower profit margins and increased risks and costs. Therefore, in order to remain a viable firm, we have created a revitalization plan that includes the following goals.
- Reduce costs by 15% over the next three years and ultimately by 20%, specifically concentrating on inventory overhead.
- Expand our customer base through the launching of our new website and our online ordering distribution outlet. Increase market awareness of our products through selected national advertising.
- Differentiate our patron’s purchasing experience through the creation of our tobacco cafe.
1.2 Mission
The Kiowa Smoke Shops strives to offer quality products, brands, and responsive service for a good price. Kiowa seeks to offer a unique experience to its patrons by stocking the most comprehensive tobacco products available for its discerning consumers and creating an intimate and comforting environment for the specialty and recreational tobacco customer. Kiowa will continue to maintain the highest standards of service in the tobacco industry.
1.3 Keys to Success
With the industry being increasingly pinched by declining numbers of customers and more and more hostile judicial and federal regulations, we must insure the following priorities:
- Expand our customer base to retain a sufficient level of profitability.
- Increase customer retention through high quality of service.
- Decrease costs and improve accounting practices to decrease collection days (improve short-term profits) and improve cost assessment.
Company Summary
Kiowa Smoke Shops began in 1961 when Fernando Renaldo’s father fled Cuba and started a cigar shop in Orlando, Florida. The elder Mr. Renaldo’s store, Santiago Cigar Shop did well and eventually he passed the business on to his son, the current owner. In 1979 the business was relocated in Kansas City, KS. Since that time the company has enjoyed profitable returns and has had good enough growth to expand into three different locations.
Over the past ten years, due to increasingly hostile regulations, judicial decisions, and tobacco opposition groups, the tobacco industry has suffered serious declines. Kiowa sees a declining client base, increasing costs, and increasing difficulty with distribution channels. For the first time since the company’s relocation in Kansas, management has been forced to reduce staffing levels and institute pay cuts, starting with retaining less earnings for the owners use. It is for this reason that the company is seeking to create a revitalization plan for the future.
2.1 Company History
In 1960 Mr. Carlos Armando Renaldo and his family left their native Cuba for the U.S. Mr. Renaldo’s family had been tobacco growers in Cuba for generations, but the communist revolution in his homeland left no opportunities for growers outside of government controlled communes. Once in America, Mr. Renaldo leveraged his family connections there to create Santiago Cigar Store in Orlando, Florida. Santiago’s catered to the growing Cuban population in the region and over the next 18 years the shop flourished, with an ever increasing clientele.

In 1979 the elder Renaldo sold the business to his son Fernando, who relocated the firm to Kansas City, Kansas. The younger Renaldo, wishing to conform to the midwest’s image, renamed the business Kiowa Smoke Shop. Since then the company has prospered enough for Mr. Renaldo to buy out two other tobacco shops. In 1985 Kiowa bought out Tobacco Heaven, on the corner of 13th and Main street in Topeka Falls, a suburb of Kansas City, and in 1988 also acquired Great Plains Smoke Store on Parvin Avenue in Kansas City, MO. Both facilities were subsequently made satellite stores.
However, over the past ten years, the tobacco industry has suffered from declining profits due to adverse marketing from tobacco opposition groups and government regulations. This trend has hit Kiowa very hard and Mr. Renaldo foresees that unless profits can be brought up to previous levels, he will go out of business.

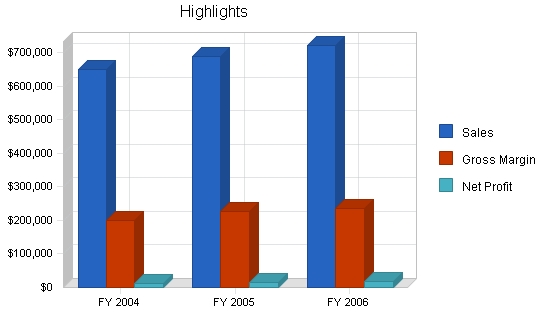
| Past Performance | |||
| FY 2001 | FY 2002 | FY 2003 | |
| Sales | $739,098 | $693,159 | $666,715 |
| Gross Margin | $229,416 | $207,670 | $195,414 |
| Gross Margin % | 31.04% | 29.96% | 29.31% |
| Operating Expenses | $157,724 | $160,141 | $160,349 |
| Inventory Turnover | 8.00 | 8.00 | 8.00 |
| Balance Sheet | |||
| FY 2001 | FY 2002 | FY 2003 | |
| Current Assets | |||
| Cash | $50,712 | $45,117 | $43,682 |
| Inventory | $84,166 | $80,687 | $76,362 |
| Other Current Assets | $13,729 | $14,866 | $11,558 |
| Total Current Assets | $148,607 | $140,670 | $131,602 |
| Long-term Assets | |||
| Long-term Assets | $61,000 | $56,500 | $56,820 |
| Accumulated Depreciation | $8,000 | $10,000 | $12,000 |
| Total Long-term Assets | $53,000 | $46,500 | $44,820 |
| Total Assets | $201,607 | $187,170 | $176,422 |
| Current Liabilities | |||
| Accounts Payable | $45,838 | $47,679 | $44,042 |
| Current Borrowing | $35,915 | $25,359 | $24,820 |
| Other Current Liabilities (interest free) | $5,000 | $7,000 | $5,600 |
| Total Current Liabilities | $86,753 | $80,038 | $74,462 |
| Long-term Liabilities | $35,335 | $32,877 | $30,761 |
| Total Liabilities | $122,088 | $112,915 | $105,223 |
| Paid-in Capital | $0 | $0 | $0 |
| Retained Earnings | ($5,481) | ($10,745) | ($8,801) |
| Earnings | $85,000 | $85,000 | $80,000 |
| Total Capital | $79,519 | $74,255 | $71,199 |
| Total Capital and Liabilities | $201,607 | $187,170 | $176,422 |
| Other Inputs | |||
| Payment Days | 45 | 45 | 45 |
2.2 Company Ownership
Kiowa Smoke Shops is a class C Limited Liability Company registered in the state of Kansas. Kiowa is exclusively owned by Mr. Fernando Renaldo (50%) and his wife, Elizabeth (50%). The company does not anticipate bringing on new owners in the foreseeable future.
Products
Kiowa Smoke Shops offers the widest variety of specialty and named brand tobaccos, cigars, cigarettes, and roll-your-own accessories in the Kansas-Missouri area. A listing of all our products would take up too much space, but a partial list is provided to give the reader an idea of the quality and scope of our products.
Cigars Brands, Individual and Boxed
Kiowa carries many of the finest brands of cigars currently being produced throughout the world, such as:
- Braniff
- Balmoral Royal
- Primo Del Rey
- Indian Tabac
- La Gloria Cubana
- Tony Borhani
- Victor Sinclair
Accessories
Kiowa carries a wide range of unique smoke shop gifts. These include:
- Ashtrays
- Pipes
- Cigarette and cigar cases
- Fumidors
- Tobacco jars
- Lighters
- Flasks
- Cleaners
Roll-your-own Cigarettes
For clients who prefer to roll their own cigarettes, Kiowa carries a number of fine tobaccos and other accessories for doing just that. Listed below are some of the cigarette tobaccos that we currently have available.
Cigarette Tobacco Brands
- McClintock Virginian
- Brookfield
- Drum
- Bugler
- Sampson
- Bali Shag
- American Spirit
Pipe Tobacco (canned and in various sized pouches)
Kiowa currently offers over 58 blends, all mixed by hand. These excellent pipe tobaccos have been perfected through over 40 years of retail exposure. Some of the more popular are:
- American Ribbon
- Kool Canvandish
- Ambrosia
- Britannica Blend
- Captain English
- McClelland
- Dunhill
- Mac Baren
- Flying Dutchman
- Kentucky Club
Many of these brands have various mixtures and blends, all of which Kiowa stocks. In addition to these, we stock the very popular American brand cigarettes such as Kool, Marlboro, Camel, etc.
Market Analysis Summary
We anticipate that 90% of all our patrons will be men. We have divided up our clients into the following market segments based on their dedication. These segments are the specialty smoker, the recreational smoker, average smokers, and occasional smokers.
Since the specialty and recreational smokers will be the most frequent patrons of Kiowa and have the highest average profit margin, we will be focusing on marketing and servicing these patrons the most.
Currently we have six competitors within the city limits of Kansas City. Most of these competitors are single store firms, and many of them have more limited stock. In addition, over the past ten years the number of local participants in the tobacco industry has seriously declined. As more participants leave the market, much of the client base, declining though it may be, will be left for the survivors and this means a real chance to consolidate and gain market share. At the moment, management is exploring the possibility of being a leader in market consolidation. This would create a buffer to declining profits by increasing the aforementioned market share and volume.
4.1 Market Segmentation
At the moment our potential list of patrons include all the smoking population in the Kansas City area and its suburbs, with an adult population of 3.5 million people (over the age of 21) we estimate this to be 450,000 people. However, only a small fraction of these potential patrons are specialty smokers and most of the rest are consumers accustomed to purchasing nationwide brand cigarettes and smokes from non-specialty stores such as grocery markets and convenience stores. Therefore we have divided our clients into the following market segments based on their dedication:
- Specialty Smokers: These are your hard core smokers who actively patronize smoke shops and are looking to find the most hard to find brands that give a unique smoking experience.
- Recreational Smokers: These are habitual smokers of everyday brands, but who occasionally are looking for something else.
- Average Smokers: These clients are dedicated to everyday brands but shop at smoke stores rather than markets or convenience stores.
- Occasional Smokers: These are people who only occasionally smoke a cigar or cigarette, but will sometimes be drawn to shop at a smoke shop due to special occasions (bachelor parties, birthdays, etc.)
While we acknowledge that there will be some female customers, we anticipate that 90% of all our patrons will be men. When we launch our Internet site with online ordering in 2004, we will be able to sell to all the potential clients in the U.S. Therefore we see the number of potential patron sharply increase in that year. Once we become established as an online retailer of specialty and nationwide brand smokes we expect to have an estimated potential customer base of ~150 million patrons.

| Market Analysis | |||||||
| 2003 | 2004 | 2005 | 2006 | 2007 | |||
| Potential Customers | Growth | CAGR | |||||
| Specialty smokers | -2% | 20,000 | 12,800,000 | 12,544,000 | 12,293,120 | 12,047,258 | 395.41% |
| Recreational smokers | -2% | 50,000 | 20,154,000 | 19,750,920 | 19,355,902 | 18,968,784 | 341.33% |
| Average smokers | -1% | 180,000 | 36,864,000 | 36,495,360 | 36,130,406 | 35,769,102 | 275.46% |
| Occasional smokers | -3% | 200,000 | 77,612,000 | 75,283,640 | 73,025,131 | 70,834,377 | 333.81% |
| Total | 318.18% | 450,000 | 147,430,000 | 144,073,920 | 140,804,559 | 137,619,521 | 318.18% |
4.2 Target Market Segment Strategy
Since the Specialty and Recreational Smokers will be the most frequent patrons of Kiowa and the highest average profit margin, we will be focusing on marketing and servicing these patrons the most. Usually these are clients who posess a upper level of income as well, which improves volume. Other segments will be drawn into the Kiowa shops through trickle down advertising and interest. We are seeking to create a larger dedicated client than what we possess through the creation of our website, to be launched in the second month of 2004.
4.3 Industry Analysis
Tobacco is the nation’s sixth largest cash crop, valued at $2.4 billion. The United States is the world’s leading tobacco exporter and importer and the second largest tobacco producer, behind only China. Most U.S. tobacco is used for cigarettes. However, both cigarette consumption and cigarette exports have fallen 16 percent since 1991, and the consumption of other tobacco products has suffered a similar loss. For example, domestic consumption is expected to fall just over 1 percent to 420 billion cigarettes. During the first nine months of 2002, only 96.3 billion cigarettes were exported. If this trend continues during the fourth quarter, cigarette exports could be the lowest since the mid-1980s.
All of this makes for a current market situation that is unfavorable to Kiowa Smoke Shops. Since the Master Settlement Agreement was signed in November 1998, the cigarette industry has been forced to raise prices to cover the costs associated with the settlement. The agreement between the attorneys general from 46 States and the major cigarette companies was intended primarily to reimburse States for expenses related to the treatment of smoking-related illnesses. Cigarette companies have boosted prices as a result of payments required by the settlement. Higher prices have curtailed consumption, although not as much as originally expected. The long-term decline in cigarette consumption due to non-economic factors continues as well, as private tobacco opposition and health care organizations continue to push for the elimination of all smoking throughout the nation.*
*Source: USDA Publications Website
4.3.1 Competition and Buying Patterns
Currently we have six competitors within the city limits of Kansas City. These include Tobacco Row, Durango Smoke Shop, Crossroads Tobacco, Brett’s Tobacco Emporium, Esquire Smokes, and Smoke Rings. Of all these various establishments, Kiowa is the largest. Most of these competitors are single store firms, and many of them have more limited stock. In addition, over the past ten years the number of local participants in the tobacco industry has seriously declined. According to the Kansas City Board of Trade, in 1992 the number of tobacco stores in the greater metropolitan area was 11 firms. As more participants leave the market, much of the client base, declining though it may be, will be left for the survivors and this means a real chance to consolidate and gain market share. At the moment, management is exploring the possibility of being a leader in market consolidation through aggressive acquisition of local competitors in the near future. This would create a buffer to declining profits by increasing the aforementioned market share and volume.
At the same time, there is a serious risk from marginal competitors who sell tobacco products as a small percentage of their total sales. These include grocery and convenience stores. At the present time these competitors only offer a limited number of nationwide brands and do not appeal to our target market segments. However, they do seriously impinge on our business due to the large volume of customers who shop in these establishments. We feel that despite any attempts to alter shopping habits the smoke shops across the country do not possess the power to change the overall market share that these indirect competitors have.
Starting in 2004, Kiowa will be launching its nationwide website with online ordering. This will open up new potentials for the firm and help to turn the company’s declining profits around. However, we will also be running into new competitors who are already established online. These include ZEES.com, Cigsonline, and Cybersmoke. It is Kiowa’s intention to create a defendable position in this cyber market through an easy-to-use and attractive website, multiple shipping options, low cost, and comprehensive marketing.
Strategy and Implementation Summary
Kiowa possesses a number of competitive advantages to its immediate rivals. These include established supply channels and its various cost advantages that are difficult to replicate, multiple locations in the Kansas City area, and our future combined cafe and tobacco store that will create more volume and greater client loyalty. This facility will act as a pilot project to determine the long-term profitability of this concept. If it proves popular, we plan to expand all of our facilities to include this unique customer experience.
Kiowa is limited in the types of marketing it can do. However, we plan to advertise in specialty publications such as Smokehouse, Cigar Connoisseur, and others. In addition, we are targeting a number of local magazines such as Kansas Highways, Midwest Life, and others that cater to upper-income people. We are also in the process of creating partnerships with other Internet firms to create Internet links to our existing informational website. When we launch our online ordering features we will intensify these efforts.
As every patron is critical in a shrinking market, Kiowa seeks to create long-term salesperson-to-customer relationships. This we see as the necessary step in repeat sales that will sustain our business. Promotions, specialty items and other such standard sales strategies will be used when possible.
5.1 Marketing Strategy
One of the most critical legislations passed recently has been the various restrictions on advertising for tobacco products. Because of this, Kiowa is limited in the types of marketing it can do. We plan to advertise in specialty publications such as Smokehouse, Cigar Connoisseur, and others. In addition, we are targeting a number of local magazines such as Kansas Highways, Midwest Life, and others that cater to upper-income people. We are also in the process of creating partnerships with other Internet firms to create Internet links to our existing informational website. When we launch our online ordering features we will intensify these efforts. Finally, we will be seeking to introduce our new combination cafe and tobacco shop to the community through newspaper articles and banner advertisements.
5.2 Sales Strategy
As every patron is critical in a shrinking market, Kiowa seeks to create long-term salesperson to customer relationships. This we see as the necessary step in repeat sales that will sustain our business. Promotions, specialty items and other such standard sales strategies will be used when possible.
5.2.1 Sales Forecast
Sales forecasts are based on conservative estimates. The tobacco products industry is fortunate in that sales are not seasonal and remain steady throughout the year. We estimate that sales will go up in 2005 due to our Internet distribution outlet and this will continue to moderately grow for the foreseeable future. We do not anticipate any sales growth from our combination cafe and tobacco shop until the last quarter of 2006 and management has decided not to include those revenues in this plan.


| Sales Forecast | |||
| FY 2004 | FY 2005 | FY 2006 | |
| Sales | |||
| Cigars | $189,996 | $201,188 | $210,532 |
| Cigarettes | $229,992 | $243,217 | $254,513 |
| Pipes and pipe tobacco | $130,080 | $137,800 | $144,200 |
| Roll-your-own products | $64,992 | $68,900 | $72,100 |
| Accessories | $34,992 | $38,450 | $40,050 |
| Total Sales | $650,052 | $689,555 | $721,395 |
| Direct Cost of Sales | FY 2004 | FY 2005 | FY 2006 |
| Cigars | $131,952 | $134,836 | $141,099 |
| Cigarettes | $159,729 | $163,004 | $170,575 |
| Pipes and pipe tobacco | $90,341 | $92,354 | $96,643 |
| Roll-your-own products | $45,137 | $46,177 | $48,321 |
| Accessories | $24,302 | $25,769 | $26,842 |
| Subtotal Direct Cost of Sales | $451,461 | $462,140 | $483,479 |
5.3 Competitive Edge
Kiowa possesses a number of competitive advantages to its immediate rivals. First of all, it has been dealing with its distributors for a very long time and has established close relations with these companies. Our established supply channels and its various cost advantages are difficult to replicate. Secondly, we are the only tobacco products firm that possesses multiple locations in the Kansas City area. This means more volume and lower marginal costs. Finally, as part of our revitalization plan, Kiowa will be expanding its Parvin Avenue facilities to create a combined cafe and tobacco store to create greater client loyalty. This facility will act as a pilot project to determine the long-term profitability of this concept. If it proves popular, we plan to expand all of our facilities to include this unique customer service.
Web Plan Summary
The Kiowa Quality Smokes website will be our newest distribution channel that will carry us forward and increase our client base in a shrinking market. Many people search the Internet for hard-to-find items and Kiowa plans to capitalize on this trend.
The Kiowa website needs to be a simple yet classy and well designed website that, at the same time, is in keeping with the latest trends and products in the tobacco industry. A site that is too flashy, or tries to use too much of the latest Shockwave or Flash technology can be over done, and cause potential clients to look elsewhere for online distributors.
The key to the website strategy will be combining a very well designed front end, with a back end capable of responding quickly and efficiently to our online customer’s orders.
6.1 Website Marketing Strategy
Marketing in an Internet retail business depends on recognition for expertise. Once customers have arrived at our website, we will have a classy website that will leverage the company’s long career as a specialty smoke shop to inspire confidence in our products and services.
Initial marketing starts with our existing store front customer base, informing them of our Internet presence and encouraging their word-of-mouth recommendations to others. In addition we will create a database of website customers so that we can regularly contact them concerning promotions and other sales events.
Once we have informed our client about our online presence, we will use an aggressive search engine positioning program. We use the database to make regular contact with email newsletters and notices about new products we carry, special offers, or activities we’re sponsoring.
6.2 Development Requirements
The Kiowa Quality Smokes website will be initially developed with few technical resources. A simple hosting provider, Alta Vista Web services, will host the site and provide the technical back end.
Kiowa will work with a contracted user interface designer to develop the simple, classy, yet Internet focused site. The user interface designer will work with a graphic artist to come up with the website logo, and the website graphics.
The maintenance of the site will be done by the our contracted designer, as Kiowa does not possess the capability to do so in-house. Our online ordering system will use industry standard software for tracking and shipping. We anticipate that any new distribution channel will increase overall inventory and handling costs. To reduce this impact on Kiowa’s business we have secured contracts with our major suppliers to provide us with just-in-time delivery services.
Management Summary
Management of Kiowa is accomplished by Fernando and Elizabeth Renaldo and our two full-time store managers. During an average day of operation, each store requires only one individual per store. In the past, accounting, billing, inventory, and all other bookkeeping was done by the Renaldos. However, management realizes that this has been one of the company’s biggest weaknesses and has lead to inefficiencies, prolonged collection periods, and overall loss of profits. In order to solve this problem, Kiowa has begun to outsource much of these tasks to a professional bookkeeping firm.
7.1 Personnel Plan
The personnel plan is included in the following table. It shows the owners’ combined salary followed by the two additional store managers’ salaries for our other facilities. In addition we have two part-time employees who shift their schedules between various stores. It should be further noted that there is a profit sharing program between all the full-time employees so that effort is rewarded.
Once our website becomes fully operational, we expect to have one of our part-time employees shift to full-time.
| Personnel Plan | |||
| FY 2004 | FY 2005 | FY 2006 | |
| Mr. and Mrs Renaldo | $60,000 | $60,000 | $60,000 |
| Store manager | $28,000 | $28,000 | $28,000 |
| Store manager | $28,000 | $28,000 | $28,000 |
| Part-time store employee | $7,200 | $14,400 | $14,400 |
| Part-time store employee | $7,200 | $7,200 | $7,200 |
| Total People | 5 | 5 | 5 |
| Total Payroll | $130,400 | $137,600 | $137,600 |
Financial Plan
The following sections are the financial projections for Kiowa Smoke Shops for the next three years. These tables represent a conservative estimate of revenues, expenses, and growth. We have placed much of the residual earnings into dividends for company employees, as in the past. However, we plan on basing dividend payouts on overall performance and health of the company and may decide to retain such earnings for future growth.
8.1 Important Assumptions
The following is our financial assumptions based on experience. Tax rates are average for a company of our size.
| General Assumptions | |||
| FY 2004 | FY 2005 | FY 2006 | |
| Plan Month | 1 | 2 | 3 |
| Current Interest Rate | 10.00% | 10.00% | 10.00% |
| Long-term Interest Rate | 10.00% | 10.00% | 10.00% |
| Tax Rate | 30.00% | 30.00% | 30.00% |
| Other | 0 | 0 | 0 |
8.2 Break-even Analysis
Our break-even analysis is based on average monthly fixed costs, which is based on historical figures, plus our average price per product. This estimate is also based on experience, however because of our wide range of products, its accuracy is somewhat less. The average variable costs are based on industry standards.

| Break-even Analysis | |
| Monthly Revenue Break-even | $48,140 |
| Assumptions: | |
| Average Percent Variable Cost | 69% |
| Estimated Monthly Fixed Cost | $14,707 |
8.3 Projected Cash Flow
We do not expect to have any serious cash flow problems in the future. Most of our residual cash is being invested in our new cafe venture for the next two years. Our current liabilities are debt secured to finance our new website. Our long-term debt will be used to start our cafe venture.

| Pro Forma Cash Flow | |||
| FY 2004 | FY 2005 | FY 2006 | |
| Cash Received | |||
| Cash from Operations | |||
| Cash Sales | $650,052 | $689,555 | $721,395 |
| Subtotal Cash from Operations | $650,052 | $689,555 | $721,395 |
| Additional Cash Received | |||
| Sales Tax, VAT, HST/GST Received | $0 | $0 | $0 |
| New Current Borrowing | $0 | $0 | $0 |
| New Other Liabilities (interest-free) | $0 | $0 | $0 |
| New Long-term Liabilities | $0 | $0 | $0 |
| Sales of Other Current Assets | $0 | $0 | $0 |
| Sales of Long-term Assets | $0 | $0 | $0 |
| New Investment Received | $0 | $0 | $0 |
| Subtotal Cash Received | $650,052 | $689,555 | $721,395 |
| Expenditures | FY 2004 | FY 2005 | FY 2006 |
| Expenditures from Operations | |||
| Cash Spending | $130,400 | $137,600 | $137,600 |
| Bill Payments | $476,163 | $532,556 | $562,327 |
| Subtotal Spent on Operations | $606,563 | $670,156 | $699,927 |
| Additional Cash Spent | |||
| Sales Tax, VAT, HST/GST Paid Out | $0 | $0 | $0 |
| Principal Repayment of Current Borrowing | $0 | $1,000 | $1,000 |
| Other Liabilities Principal Repayment | $0 | $0 | $0 |
| Long-term Liabilities Principal Repayment | $1,200 | $1,000 | $1,000 |
| Purchase Other Current Assets | $30,000 | $2,000 | $5,000 |
| Purchase Long-term Assets | $15,000 | $7,000 | $9,000 |
| Dividends | $0 | $0 | $0 |
| Subtotal Cash Spent | $652,763 | $681,156 | $715,927 |
| Net Cash Flow | ($2,711) | $8,399 | $5,468 |
| Cash Balance | $40,971 | $49,371 | $54,839 |
8.4 Projected Profit and Loss
The following is our best estimates of future revenues and costs, based on current market trends, past performance, and perceived revenue of our new cafe and website ventures.


| Pro Forma Profit and Loss | |||
| FY 2004 | FY 2005 | FY 2006 | |
| Sales | $650,052 | $689,555 | $721,395 |
| Direct Cost of Sales | $451,461 | $462,140 | $483,479 |
| Other Costs of Goods | $0 | $2,000 | $2,000 |
| Total Cost of Sales | $451,461 | $464,140 | $485,479 |
| Gross Margin | $198,591 | $225,415 | $235,916 |
| Gross Margin % | 30.55% | 32.69% | 32.70% |
| Expenses | |||
| Payroll | $130,400 | $137,600 | $137,600 |
| Sales and Marketing and Other Expenses | $6,000 | $12,000 | $14,000 |
| Depreciation | $0 | $2,000 | $4,000 |
| Rent | $9,600 | $9,900 | $10,400 |
| Utilities | $1,320 | $1,320 | $1,600 |
| Insurance | $3,600 | $3,800 | $4,200 |
| Payroll Taxes | $19,560 | $20,640 | $20,640 |
| Other | $6,000 | $11,000 | $14,000 |
| Total Operating Expenses | $176,480 | $198,260 | $206,440 |
| Profit Before Interest and Taxes | $22,111 | $27,155 | $29,476 |
| EBITDA | $22,111 | $29,155 | $33,476 |
| Interest Expense | $5,493 | $5,338 | $5,138 |
| Taxes Incurred | $4,985 | $6,545 | $7,301 |
| Net Profit | $11,633 | $15,272 | $17,037 |
| Net Profit/Sales | 1.79% | 2.21% | 2.36% |
8.5 Projected Balance Sheet
The following is a presentation of assets and liabilities. As we are a limited debt company, we tend to have a higher net worth than other comparable companies.
| Pro Forma Balance Sheet | |||
| FY 2004 | FY 2005 | FY 2006 | |
| Assets | |||
| Current Assets | |||
| Cash | $40,971 | $49,371 | $54,839 |
| Inventory | $41,384 | $42,363 | $44,319 |
| Other Current Assets | $41,558 | $43,558 | $48,558 |
| Total Current Assets | $123,913 | $135,292 | $147,716 |
| Long-term Assets | |||
| Long-term Assets | $71,820 | $78,820 | $87,820 |
| Accumulated Depreciation | $12,000 | $14,000 | $18,000 |
| Total Long-term Assets | $59,820 | $64,820 | $69,820 |
| Total Assets | $183,733 | $200,112 | $217,536 |
| Liabilities and Capital | FY 2004 | FY 2005 | FY 2006 |
| Current Liabilities | |||
| Accounts Payable | $40,921 | $44,027 | $46,415 |
| Current Borrowing | $24,820 | $23,820 | $22,820 |
| Other Current Liabilities | $5,600 | $5,600 | $5,600 |
| Subtotal Current Liabilities | $71,341 | $73,447 | $74,835 |
| Long-term Liabilities | $29,561 | $28,561 | $27,561 |
| Total Liabilities | $100,902 | $102,008 | $102,396 |
| Paid-in Capital | $0 | $0 | $0 |
| Retained Earnings | $71,199 | $82,832 | $98,104 |
| Earnings | $11,633 | $15,272 | $17,037 |
| Total Capital | $82,832 | $98,104 | $115,140 |
| Total Liabilities and Capital | $183,733 | $200,112 | $217,536 |
| Net Worth | $82,832 | $98,104 | $115,140 |
8.6 Business Ratios
The following is a presentation of industry standard ratios versus our own projections. For the most part, we follow the industry averages. We expect to see higher growths than average over the next two years due to our new ventures. Also our company has limited debt, meaning we have higher than average net worth.
| Ratio Analysis | ||||
| FY 2004 | FY 2005 | FY 2006 | Industry Profile | |
| Sales Growth | -2.50% | 6.08% | 4.62% | 6.22% |
| Percent of Total Assets | ||||
| Inventory | 22.52% | 21.17% | 20.37% | 30.17% |
| Other Current Assets | 22.62% | 21.77% | 22.32% | 25.04% |
| Total Current Assets | 67.44% | 67.61% | 67.90% | 84.57% |
| Long-term Assets | 32.56% | 32.39% | 32.10% | 15.43% |
| Total Assets | 100.00% | 100.00% | 100.00% | 100.00% |
| Current Liabilities | 38.83% | 36.70% | 34.40% | 38.68% |
| Long-term Liabilities | 16.09% | 14.27% | 12.67% | 12.41% |
| Total Liabilities | 54.92% | 50.98% | 47.07% | 51.09% |
| Net Worth | 45.08% | 49.02% | 52.93% | 48.91% |
| Percent of Sales | ||||
| Sales | 100.00% | 100.00% | 100.00% | 100.00% |
| Gross Margin | 30.55% | 32.69% | 32.70% | 21.60% |
| Selling, General & Administrative Expenses | 28.76% | 30.48% | 30.34% | 9.18% |
| Advertising Expenses | 0.00% | 0.00% | 0.00% | 0.96% |
| Profit Before Interest and Taxes | 3.40% | 3.94% | 4.09% | 1.57% |
| Main Ratios | ||||
| Current | 1.74 | 1.84 | 1.97 | 1.91 |
| Quick | 1.16 | 1.27 | 1.38 | 1.04 |
| Total Debt to Total Assets | 54.92% | 50.98% | 47.07% | 53.60% |
| Pre-tax Return on Net Worth | 20.06% | 22.24% | 21.14% | 4.72% |
| Pre-tax Return on Assets | 9.04% | 10.90% | 11.19% | 10.18% |
| Additional Ratios | FY 2004 | FY 2005 | FY 2006 | |
| Net Profit Margin | 1.79% | 2.21% | 2.36% | n.a |
| Return on Equity | 14.04% | 15.57% | 14.80% | n.a |
| Activity Ratios | ||||
| Inventory Turnover | 10.91 | 11.04 | 11.16 | n.a |
| Accounts Payable Turnover | 11.56 | 12.17 | 12.17 | n.a |
| Payment Days | 30 | 29 | 29 | n.a |
| Total Asset Turnover | 3.54 | 3.45 | 3.32 | n.a |
| Debt Ratios | ||||
| Debt to Net Worth | 1.22 | 1.04 | 0.89 | n.a |
| Current Liab. to Liab. | 0.71 | 0.72 | 0.73 | n.a |
| Liquidity Ratios | ||||
| Net Working Capital | $52,573 | $61,845 | $72,881 | n.a |
| Interest Coverage | 4.03 | 5.09 | 5.74 | n.a |
| Additional Ratios | ||||
| Assets to Sales | 0.28 | 0.29 | 0.30 | n.a |
| Current Debt/Total Assets | 39% | 37% | 34% | n.a |
| Acid Test | 1.16 | 1.27 | 1.38 | n.a |
| Sales/Net Worth | 7.85 | 7.03 | 6.27 | n.a |
| Dividend Payout | 0.00 | 0.00 | 0.00 | n.a |
Appendix
| Sales Forecast | |||||||||||||
| Apr | May | Jun | Jul | Aug | Sep | Oct | Nov | Dec | Jan | Feb | Mar | ||
| Sales | |||||||||||||
| Cigars | 0% | $15,833 | $15,833 | $15,833 | $15,833 | $15,833 | $15,833 | $15,833 | $15,833 | $15,833 | $15,833 | $15,833 | $15,833 |
| Cigarettes | 0% | $19,166 | $19,166 | $19,166 | $19,166 | $19,166 | $19,166 | $19,166 | $19,166 | $19,166 | $19,166 | $19,166 | $19,166 |
| Pipes and pipe tobacco | 0% | $10,840 | $10,840 | $10,840 | $10,840 | $10,840 | $10,840 | $10,840 | $10,840 | $10,840 | $10,840 | $10,840 | $10,840 |
| Roll-your-own products | 0% | $5,416 | $5,416 | $5,416 | $5,416 | $5,416 | $5,416 | $5,416 | $5,416 | $5,416 | $5,416 | $5,416 | $5,416 |
| Accessories | 0% | $2,916 | $2,916 | $2,916 | $2,916 | $2,916 | $2,916 | $2,916 | $2,916 | $2,916 | $2,916 | $2,916 | $2,916 |
| Total Sales | $54,171 | $54,171 | $54,171 | $54,171 | $54,171 | $54,171 | $54,171 | $54,171 | $54,171 | $54,171 | $54,171 | $54,171 | |
| Direct Cost of Sales | Apr | May | Jun | Jul | Aug | Sep | Oct | Nov | Dec | Jan | Feb | Mar | |
| Cigars | $10,996 | $10,996 | $10,996 | $10,996 | $10,996 | $10,996 | $10,996 | $10,996 | $10,996 | $10,996 | $10,996 | $10,996 | |
| Cigarettes | $13,311 | $13,311 | $13,311 | $13,311 | $13,311 | $13,311 | $13,311 | $13,311 | $13,311 | $13,311 | $13,311 | $13,311 | |
| Pipes and pipe tobacco | $7,528 | $7,528 | $7,528 | $7,528 | $7,528 | $7,528 | $7,528 | $7,528 | $7,528 | $7,528 | $7,528 | $7,528 | |
| Roll-your-own products | $3,761 | $3,761 | $3,761 | $3,761 | $3,761 | $3,761 | $3,761 | $3,761 | $3,761 | $3,761 | $3,761 | $3,761 | |
| Accessories | $2,025 | $2,025 | $2,025 | $2,025 | $2,025 | $2,025 | $2,025 | $2,025 | $2,025 | $2,025 | $2,025 | $2,025 | |
| Subtotal Direct Cost of Sales | $37,622 | $37,622 | $37,622 | $37,622 | $37,622 | $37,622 | $37,622 | $37,622 | $37,622 | $37,622 | $37,622 | $37,622 | |
| Personnel Plan | |||||||||||||
| Apr | May | Jun | Jul | Aug | Sep | Oct | Nov | Dec | Jan | Feb | Mar | ||
| Mr. and Mrs Renaldo | 0% | $5,000 | $5,000 | $5,000 | $5,000 | $5,000 | $5,000 | $5,000 | $5,000 | $5,000 | $5,000 | $5,000 | $5,000 |
| Store manager | 0% | $2,333 | $2,333 | $2,333 | $2,333 | $2,333 | $2,333 | $2,333 | $2,333 | $2,333 | $2,333 | $2,333 | $2,333 |
| Store manager | 0% | $2,333 | $2,333 | $2,333 | $2,333 | $2,333 | $2,333 | $2,333 | $2,333 | $2,333 | $2,333 | $2,333 | $2,333 |
| Part-time store employee | 0% | $600 | $600 | $600 | $600 | $600 | $600 | $600 | $600 | $600 | $600 | $600 | $600 |
| Part-time store employee | 0% | $600 | $600 | $600 | $600 | $600 | $600 | $600 | $600 | $600 | $600 | $600 | $600 |
| Total People | 5 | 5 | 5 | 5 | 5 | 5 | 5 | 5 | 5 | 5 | 5 | 5 | |
| Total Payroll | $10,867 | $10,867 | $10,867 | $10,867 | $10,867 | $10,867 | $10,867 | $10,867 | $10,867 | $10,867 | $10,867 | $10,867 | |
| General Assumptions | |||||||||||||
| Apr | May | Jun | Jul | Aug | Sep | Oct | Nov | Dec | Jan | Feb | Mar | ||
| Plan Month | 1 | 2 | 3 | 4 | 5 | 6 | 7 | 8 | 9 | 10 | 11 | 12 | |
| Current Interest Rate | 10.00% | 10.00% | 10.00% | 10.00% | 10.00% | 10.00% | 10.00% | 10.00% | 10.00% | 10.00% | 10.00% | 10.00% | |
| Long-term Interest Rate | 10.00% | 10.00% | 10.00% | 10.00% | 10.00% | 10.00% | 10.00% | 10.00% | 10.00% | 10.00% | 10.00% | 10.00% | |
| Tax Rate | 30.00% | 30.00% | 30.00% | 30.00% | 30.00% | 30.00% | 30.00% | 30.00% | 30.00% | 30.00% | 30.00% | 30.00% | |
| Other | 0 | 0 | 0 | 0 | 0 | 0 | 0 | 0 | 0 | 0 | 0 | 0 | |
| Pro Forma Profit and Loss | |||||||||||||
| Apr | May | Jun | Jul | Aug | Sep | Oct | Nov | Dec | Jan | Feb | Mar | ||
| Sales | $54,171 | $54,171 | $54,171 | $54,171 | $54,171 | $54,171 | $54,171 | $54,171 | $54,171 | $54,171 | $54,171 | $54,171 | |
| Direct Cost of Sales | $37,622 | $37,622 | $37,622 | $37,622 | $37,622 | $37,622 | $37,622 | $37,622 | $37,622 | $37,622 | $37,622 | $37,622 | |
| Other Costs of Goods | $0 | $0 | $0 | $0 | $0 | $0 | $0 | $0 | $0 | $0 | $0 | $0 | |
| Total Cost of Sales | $37,622 | $37,622 | $37,622 | $37,622 | $37,622 | $37,622 | $37,622 | $37,622 | $37,622 | $37,622 | $37,622 | $37,622 | |
| Gross Margin | $16,549 | $16,549 | $16,549 | $16,549 | $16,549 | $16,549 | $16,549 | $16,549 | $16,549 | $16,549 | $16,549 | $16,549 | |
| Gross Margin % | 30.55% | 30.55% | 30.55% | 30.55% | 30.55% | 30.55% | 30.55% | 30.55% | 30.55% | 30.55% | 30.55% | 30.55% | |
| Expenses | |||||||||||||
| Payroll | $10,867 | $10,867 | $10,867 | $10,867 | $10,867 | $10,867 | $10,867 | $10,867 | $10,867 | $10,867 | $10,867 | $10,867 | |
| Sales and Marketing and Other Expenses | $500 | $500 | $500 | $500 | $500 | $500 | $500 | $500 | $500 | $500 | $500 | $500 | |
| Depreciation | $0 | $0 | $0 | $0 | $0 | $0 | $0 | $0 | $0 | $0 | $0 | $0 | |
| Rent | $800 | $800 | $800 | $800 | $800 | $800 | $800 | $800 | $800 | $800 | $800 | $800 | |
| Utilities | $110 | $110 | $110 | $110 | $110 | $110 | $110 | $110 | $110 | $110 | $110 | $110 | |
| Insurance | $300 | $300 | $300 | $300 | $300 | $300 | $300 | $300 | $300 | $300 | $300 | $300 | |
| Payroll Taxes | 15% | $1,630 | $1,630 | $1,630 | $1,630 | $1,630 | $1,630 | $1,630 | $1,630 | $1,630 | $1,630 | $1,630 | $1,630 |
| Other | $500 | $500 | $500 | $500 | $500 | $500 | $500 | $500 | $500 | $500 | $500 | $500 | |
| Total Operating Expenses | $14,707 | $14,707 | $14,707 | $14,707 | $14,707 | $14,707 | $14,707 | $14,707 | $14,707 | $14,707 | $14,707 | $14,707 | |
| Profit Before Interest and Taxes | $1,843 | $1,843 | $1,843 | $1,843 | $1,843 | $1,843 | $1,843 | $1,843 | $1,843 | $1,843 | $1,843 | $1,843 | |
| EBITDA | $1,843 | $1,843 | $1,843 | $1,843 | $1,843 | $1,843 | $1,843 | $1,843 | $1,843 | $1,843 | $1,843 | $1,843 | |
| Interest Expense | $462 | $462 | $461 | $460 | $459 | $458 | $457 | $457 | $456 | $455 | $454 | $453 | |
| Taxes Incurred | $414 | $414 | $415 | $415 | $415 | $415 | $416 | $416 | $416 | $416 | $417 | $417 | |
| Net Profit | $966 | $967 | $967 | $968 | $969 | $969 | $970 | $970 | $971 | $971 | $972 | $973 | |
| Net Profit/Sales | 1.78% | 1.78% | 1.79% | 1.79% | 1.79% | 1.79% | 1.79% | 1.79% | 1.79% | 1.79% | 1.79% | 1.80% | |
| Pro Forma Cash Flow | |||||||||||||
| Apr | May | Jun | Jul | Aug | Sep | Oct | Nov | Dec | Jan | Feb | Mar | ||
| Cash Received | |||||||||||||
| Cash from Operations | |||||||||||||
| Cash Sales | $54,171 | $54,171 | $54,171 | $54,171 | $54,171 | $54,171 | $54,171 | $54,171 | $54,171 | $54,171 | $54,171 | $54,171 | |
| Subtotal Cash from Operations | $54,171 | $54,171 | $54,171 | $54,171 | $54,171 | $54,171 | $54,171 | $54,171 | $54,171 | $54,171 | $54,171 | $54,171 | |
| Additional Cash Received | |||||||||||||
| Sales Tax, VAT, HST/GST Received | 0.00% | $0 | $0 | $0 | $0 | $0 | $0 | $0 | $0 | $0 | $0 | $0 | $0 |
| New Current Borrowing | $0 | $0 | $0 | $0 | $0 | $0 | $0 | $0 | $0 | $0 | $0 | $0 | |
| New Other Liabilities (interest-free) | $0 | $0 | $0 | $0 | $0 | $0 | $0 | $0 | $0 | $0 | $0 | $0 | |
| New Long-term Liabilities | $0 | $0 | $0 | $0 | $0 | $0 | $0 | $0 | $0 | $0 | $0 | $0 | |
| Sales of Other Current Assets | $0 | $0 | $0 | $0 | $0 | $0 | $0 | $0 | $0 | $0 | $0 | $0 | |
| Sales of Long-term Assets | $0 | $0 | $0 | $0 | $0 | $0 | $0 | $0 | $0 | $0 | $0 | $0 | |
| New Investment Received | $0 | $0 | $0 | $0 | $0 | $0 | $0 | $0 | $0 | $0 | $0 | $0 | |
| Subtotal Cash Received | $54,171 | $54,171 | $54,171 | $54,171 | $54,171 | $54,171 | $54,171 | $54,171 | $54,171 | $54,171 | $54,171 | $54,171 | |
| Expenditures | Apr | May | Jun | Jul | Aug | Sep | Oct | Nov | Dec | Jan | Feb | Mar | |
| Expenditures from Operations | |||||||||||||
| Cash Spending | $10,867 | $10,867 | $10,867 | $10,867 | $10,867 | $10,867 | $10,867 | $10,867 | $10,867 | $10,867 | $10,867 | $10,867 | |
| Bill Payments | $44,287 | $8,526 | $42,338 | $42,337 | $42,336 | $42,336 | $42,335 | $42,335 | $42,334 | $42,333 | $42,333 | $42,332 | |
| Subtotal Spent on Operations | $55,154 | $19,393 | $53,204 | $53,204 | $53,203 | $53,202 | $53,202 | $53,201 | $53,201 | $53,200 | $53,200 | $53,199 | |
| Additional Cash Spent | |||||||||||||
| Sales Tax, VAT, HST/GST Paid Out | $0 | $0 | $0 | $0 | $0 | $0 | $0 | $0 | $0 | $0 | $0 | $0 | |
| Principal Repayment of Current Borrowing | $0 | $0 | $0 | $0 | $0 | $0 | $0 | $0 | $0 | $0 | $0 | $0 | |
| Other Liabilities Principal Repayment | $0 | $0 | $0 | $0 | $0 | $0 | $0 | $0 | $0 | $0 | $0 | $0 | |
| Long-term Liabilities Principal Repayment | $100 | $100 | $100 | $100 | $100 | $100 | $100 | $100 | $100 | $100 | $100 | $100 | |
| Purchase Other Current Assets | $0 | $0 | $0 | $0 | $0 | $0 | $0 | $0 | $0 | $0 | $15,000 | $15,000 | |
| Purchase Long-term Assets | $0 | $0 | $0 | $0 | $0 | $0 | $0 | $0 | $0 | $0 | $15,000 | $0 | |
| Dividends | $0 | $0 | $0 | $0 | $0 | $0 | $0 | $0 | $0 | $0 | $0 | $0 | |
| Subtotal Cash Spent | $55,254 | $19,493 | $53,304 | $53,304 | $53,303 | $53,302 | $53,302 | $53,301 | $53,301 | $53,300 | $83,300 | $68,299 | |
| Net Cash Flow | ($1,083) | $34,678 | $867 | $867 | $868 | $869 | $869 | $870 | $870 | $871 | ($29,129) | ($14,128) | |
| Cash Balance | $42,599 | $77,277 | $78,144 | $79,011 | $79,879 | $80,748 | $81,617 | $82,487 | $83,357 | $84,228 | $55,099 | $40,971 | |
| Pro Forma Balance Sheet | |||||||||||||
| Apr | May | Jun | Jul | Aug | Sep | Oct | Nov | Dec | Jan | Feb | Mar | ||
| Assets | Starting Balances | ||||||||||||
| Current Assets | |||||||||||||
| Cash | $43,682 | $42,599 | $77,277 | $78,144 | $79,011 | $79,879 | $80,748 | $81,617 | $82,487 | $83,357 | $84,228 | $55,099 | $40,971 |
| Inventory | $76,362 | $41,384 | $41,384 | $41,384 | $41,384 | $41,384 | $41,384 | $41,384 | $41,384 | $41,384 | $41,384 | $41,384 | $41,384 |
| Other Current Assets | $11,558 | $11,558 | $11,558 | $11,558 | $11,558 | $11,558 | $11,558 | $11,558 | $11,558 | $11,558 | $11,558 | $26,558 | $41,558 |
| Total Current Assets | $131,602 | $95,541 | $130,219 | $131,086 | $131,953 | $132,821 | $133,690 | $134,559 | $135,429 | $136,299 | $137,170 | $123,041 | $123,913 |
| Long-term Assets | |||||||||||||
| Long-term Assets | $56,820 | $56,820 | $56,820 | $56,820 | $56,820 | $56,820 | $56,820 | $56,820 | $56,820 | $56,820 | $56,820 | $71,820 | $71,820 |
| Accumulated Depreciation | $12,000 | $12,000 | $12,000 | $12,000 | $12,000 | $12,000 | $12,000 | $12,000 | $12,000 | $12,000 | $12,000 | $12,000 | $12,000 |
| Total Long-term Assets | $44,820 | $44,820 | $44,820 | $44,820 | $44,820 | $44,820 | $44,820 | $44,820 | $44,820 | $44,820 | $44,820 | $59,820 | $59,820 |
| Total Assets | $176,422 | $140,361 | $175,039 | $175,906 | $176,773 | $177,641 | $178,510 | $179,379 | $180,249 | $181,119 | $181,990 | $182,861 | $183,733 |
| Liabilities and Capital | Apr | May | Jun | Jul | Aug | Sep | Oct | Nov | Dec | Jan | Feb | Mar | |
| Current Liabilities | |||||||||||||
| Accounts Payable | $44,042 | $7,115 | $40,926 | $40,926 | $40,925 | $40,925 | $40,924 | $40,924 | $40,923 | $40,922 | $40,922 | $40,921 | $40,921 |
| Current Borrowing | $24,820 | $24,820 | $24,820 | $24,820 | $24,820 | $24,820 | $24,820 | $24,820 | $24,820 | $24,820 | $24,820 | $24,820 | $24,820 |
| Other Current Liabilities | $5,600 | $5,600 | $5,600 | $5,600 | $5,600 | $5,600 | $5,600 | $5,600 | $5,600 | $5,600 | $5,600 | $5,600 | $5,600 |
| Subtotal Current Liabilities | $74,462 | $37,535 | $71,346 | $71,346 | $71,345 | $71,345 | $71,344 | $71,344 | $71,343 | $71,342 | $71,342 | $71,341 | $71,341 |
| Long-term Liabilities | $30,761 | $30,661 | $30,561 | $30,461 | $30,361 | $30,261 | $30,161 | $30,061 | $29,961 | $29,861 | $29,761 | $29,661 | $29,561 |
| Total Liabilities | $105,223 | $68,196 | $101,907 | $101,807 | $101,706 | $101,606 | $101,505 | $101,404 | $101,304 | $101,203 | $101,103 | $101,002 | $100,902 |
| Paid-in Capital | $0 | $0 | $0 | $0 | $0 | $0 | $0 | $0 | $0 | $0 | $0 | $0 | $0 |
| Retained Earnings | ($8,801) | $71,199 | $71,199 | $71,199 | $71,199 | $71,199 | $71,199 | $71,199 | $71,199 | $71,199 | $71,199 | $71,199 | $71,199 |
| Earnings | $80,000 | $966 | $1,933 | $2,900 | $3,868 | $4,837 | $5,806 | $6,775 | $7,746 | $8,717 | $9,688 | $10,660 | $11,633 |
| Total Capital | $71,199 | $72,165 | $73,132 | $74,099 | $75,067 | $76,036 | $77,005 | $77,975 | $78,945 | $79,916 | $80,887 | $81,859 | $82,832 |
| Total Liabilities and Capital | $176,422 | $140,361 | $175,039 | $175,906 | $176,773 | $177,641 | $178,510 | $179,379 | $180,249 | $181,119 | $181,990 | $182,861 | $183,733 |
| Net Worth | $71,199 | $72,165 | $73,132 | $74,099 | $75,067 | $76,036 | $77,005 | $77,975 | $78,945 | $79,916 | $80,887 | $81,859 | $82,832 |

