
Full of Bologna
Executive Summary
This plan provides detailed investor information and includes the basic strategic business plan necessary for initial establishment and operation of Full of Bologna, A Taste of North Italy restaurant, bar and lounge at the new and exciting Greensward in Niceburb, Stasistate. The Greensward (a completely funded $58 million project) will open with it’s Firedrake Glass School, assorted high-traffic novelty and gift shops and museum traffic of 2,000 people per day in the summer. Thereafter, the passage of the Gaming Bill in Stasistate Legislature will likely boost traffic to 12,000+ per day.
A separate plan for The Greensward has been developed by Loess Cairn Commons, LLC and is extensive at 100+ pages. That plan outlines the business growth, methods, procedures for operation, and infrastructure management. It also includes letters of support from various governors, states and high-level business leaders. A third report (100+ pages) supports this business plan as a Complete Appraisal and Self Contained Report, from CVE Gambier Bay Real Estate Services, Inc., and was prepared for Ms. Kitty Morris, Vice President of First Niceburb Bank.
This business is being developed by a dynamic, hard-working team of proven managers.
Full of Bologna focuses on local customers, gambling visitors, and tourist restaurant patrons who have a desire for good food and a fascinating atmosphere. Niceburb itself is located in between the Warfside and Stasistate Memorial Bridges. The Greensward (where we will be located) is a creative nautically themed public/private mixed-use development on 25 acres on the Stasistate River in Historic Niceburb, Border County, Stasistate. The property development will be comprised of seven buildings totaling approximately 191,000 square feet of retail, restaurant, hotel, and office space, including food court and entertainment.
The Greensward is in the Gigametro-Megametro-Jumbometro supersprawl statistical area along the Stasistate River. The buildings are in Stasistate; the dock and it’s ancillary pier with it’s 17-foot draft is in development, as the development border is at the low mean water line, a boundary set in the days of original settlement.
The Greensward is easily accessed from both the Interstate and state highways. There is a population of 3.6 million within a 45-minute drive. The metro airport, the modernized general aviation airport, a premier helicopter facility, and the Amtrak are all just a short drive away.
The city of Niceburb is in the process of revitalizing. The city will have much to offer and the people that it draws expect a place where they will get the best of everything. Full of Bologna restaurant, lounge and dancing will offer a new fine dining concept to the area. The fun atmosphere, our excellent food and our friendly staff will stand out and make a name in the region. We will succeed by giving people a combination of excellent and interesting food in an environment that attracts successful people that want to get a little bit more out of life than just the ordinary!
Full of Bologna, A Taste of North Italy will be formed in January in Stasistate, as an LLC corporation under the Laws of Stasistate.
The dynamic management team responsible for the design, building, development of company policy, and hands-on-management of the daily operations are Fluno Gorgonzola the former Executive Chef to the President of the United States, Estate Manager for the U.S. State Department at Camp David. In Hawaii, Tokyo, Japan, and Brussels, Belgium Mr. Gogonzola also ran a $51 million per annum budget for a chain of 37 restaurants, with 400+ staff serving 5,000 meals per day for the federal government. His 30+ years of expertise runs from restaurant management for the first family (small) to hands-on single restaurant operational success (medium hard-core work) to global control of a restaurant chain.
Also included are Tsoutsouros Graviera, Vasto Parmigiano, Jr., Severo Sardo, Forli Taleggio (Landlord and former Manager of the Lowland Heights Golf Club, in Stonestate) and Gimli Kefalotiri. All of them are seasoned in the restaurant, publicity and/or advertising businesses. In addition, a team-oriented and customer-focused staff of 26 will support the management team. Full of Bologna will retain the services of a CPA firm to perform professional company audits, prepare taxes and serve as a business consultant to assist in setting achievable long-range strategic goals. Payroll will be done in-house as we are already established experts at it, as well as collection and payment of sales and use taxes (both Federal and multi-state regulations and forms).
Establishment of Full of Bologna provides Niceburb, Border County, and the surrounding area quality family food, entertainment and catering services. It will fit prominently into the Niceburb Greensward project and is listed as building #7 in their business plan and design. Two other projects are part of The Greensward under Gorgonzola – a restaurant on the river (Jolly Jack-tar Restaurant and Show and a hotel with conference and catering facilities (The Highfalutin Hotel and Spa). The restaurant is the second Jolly Jack-tar Restaurant and Show (#1 is in Historic Malaria Swamp Village Museum in Cape Flotsom, Stasistate).
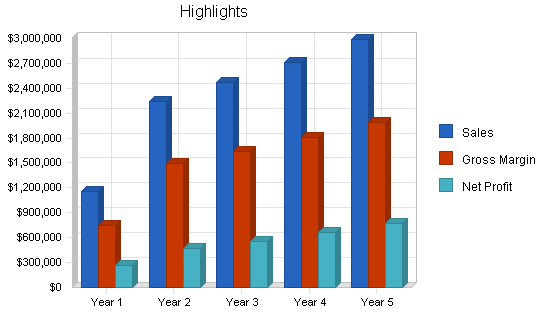
Based on the current prices in the restaurant market, Full of Bologna has the potential of high net worth by year four and that is based on very conservative estimates and under-inflated projections. With good management, a tremendous revenue growth is expected.
The equity for each investor will be based on his or her investment. An in-depth look can be found in our Business Ratios.
Ways to minimize risk factors to Full of Bologna’s success include:
- Obtain sufficient capital to build and cover expenses of initial operation. All investor capital will be held in escrow until the project is totally funded.
- Maintain low overhead cost which increases the bottom line profit. Multi-skilled personnel will be employed, and a continual training program will ensure they deliver consistent, superior service, where customer satisfaction is paramount.
- Build a sufficient customer base. An excellent location has been determined by demographics, and an aggressive marketing program by a full-time employee will ensure desired results. Especially in working with The Greensward.
- Establish community involvement to demonstrate how the business will contribute to a better quality of life. Community projects using the local bowling center’s facilities will be developed to help civic groups obtain their financial goals. School, church, and other groups will be welcomed for tours of the bowling center.
- All payments will be cash or credit card, which eliminates the need for invoicing and collections.
1.1 Objectives
The objectives for Full of Bologna are outlined below:
- To create a restaurant whose goal is to exceed customer’s expectations.
- To increase the number of customers served by at least 20% per year through superior performance and word-of-mouth referrals.
- Have a clientele return rate of 60% by end of first year.
- Become an established community destination by end of first year for the 3,000,000 people within a 30 minute drive.
- Keeping food cost under 35% revenue.
-
Keeping employee labor cost between 24-29% of revenue.
-
Establish and maintain a reputation for excellent food and service.
-
Averaging sales between $1,500,000-2,500,000 per year.
-
Expand our marketing and advertising in Pennsylvania, Stasistate and New York.
1.2 Keys to Success
The creation of a unique and innovative, 1400s, Italian High Renaissance, fine dining atmosphere will differentiate us from the competition. The restaurant will stand out from the other restaurants in the area because of the unique design and decor. Our waiters and waitresses dress will be stunning in period costume. We will offer a fine dining experience in a cozy atmosphere. The predicted, 12,000 people per day traffic flow into the casinos, will provide us with serious seating inside and covers per day.

Product quality. Not only great food but great service and atmosphere.
The menu will appeal to a wide and varied clientele. It is international with the interesting twist of offering genuine traditional recipes of Bologna and surrounding areas of North Italy. Of course, we will have all of the American-Italian favorites available as well. Huge meat balls, massive lasagnas and fresh pasta.
We will have special theme nights like restaurant nights, local artist’s openings, Easter dinners, Columbus Day, Midsummer party, Fourth of July celebration, Labor Day weekend, wine tasting dinners, special ethnic food nights, and smörgåsbords. All this will attract a varied clientele to Full of Bologna.
Controlling costs at all times without exception. Due to intense competition, restaurateurs must look for ways to differentiate their place of business in order to achieve and maintain a competitive advantage. The founders of Full of Bologna realize this. With its re-development Niceburb needs a place that will fit into the ‘new look’ of the community that is sophisticated and entertaining. The fact that no other restaurants in the area have this concept and atmosphere – presents us with a window of opportunity and an entrance into a profitable niche in the market.
Company Summary
The restaurant will be an LLC corporation, owned by its founders (Misters Gorgonzola, Parmigiano, and Sardo), and an as yet undetermined investor (major).
Tsoutsouros Graviera and Gimli Kefalotiri will have a minor stake in stock issue, which will be non-voting, non-binding and non-determinative to resolutions.
2.1 Start-up Summary
The founder of the company is Fluno Gorgonzola. Mr. Gorgonzola works the entire restaurant from kitchen to managing personnel, handling accounts, algorithms, and computerized functions. Gorganzola focuses on the financial, service standards and food quality issues. Tsoutsouros Graviera and Vasto Parmigiano, Jr. will be the Restaurant Managers. Gimli Kefalotiri will be the overall Bar Manager.
Our restaurant space is the old bank building shown as Building #7 at The Greensward located at Water and 12th streets (on the corner). The space is approximately 4,500 square feet of usable space (main floor), a proposed, refurbished mini -mezzanine of 500 square feet (upstairs), a proposed bar/dining and dance floor downstairs and approximately 1,000 square feet of outdoor patio dining space at the front and left sides of the building (umbrellas – tables and shrubbery).
We will begin construction of Full of Bologna, A Taste of North Italy on January 2, 2005 and open April 2, 2005. We are seeking an investor to start up the company.
Our start-up costs are mostly expensed equipment, furniture, painting, reconstruction, rent, start-up labor, liquor license, six months operating cash, and legal and consulting costs associated with opening the restaurant. These are the start-up requirements to the best of our knowledge and experience in the industry. Our bidding conference fixes prices with typed bids and solidifies costs.
A number of items are self-explanatory. Of specific note are:
- Stationery, Menus, and Guest Checks – We know the exact costs of these items from day-to-day experience and purchasing across the three state region, firsthand. Our stationery will be simple with the Full of Bologna logo on it (invoices, letterhead, envelopes, catering and event contracts). As many items that can be made in-house will be controlled by our own Microsoft Registered Developers (Gorgonzola and Graviera) to save thousands of dollars. Our menu’s will be designed, typed, developed and revised in-house to further save money. Final printing will also be done in-house to further control costs. Guest checks will be custom designed and serial numbered.
- Property Insurance and Workmans Compensation Insurance – These evaluations have recently been conducted with the our insurance agents. Our estimate for Property Insurance is based on 250k of equipment protection (and 26 other line item protections) with a $1,000,000 and $2,000,000 protection for general liability. This policy most likely will be carried via Sirius America. Workers Compensation will most likely be handled by Amerihealth.
- Rent, or lease payments – Loess Cairn Commons, LLC has agreed to abstain from any form of rent until opening day of The Greensward, due to the sheer amount of work that needs to be done to the interior, associated and extraneous costs, opening during the winter months with related poor numbers of guests and little or no traffic in a dead end area that is dilapidated, rampant and torn down. Upon opening day, a ramp-up to traffic of 12,000 visitors daily is expected and therefore rent will engage at the cost of $3,000 per month for the first three months and thereafter at the full rate of $6,000 per month. This is based on the computation of pre-lease letter of intent rate at $16.00 per square foot x 4,500 square feet.
- Office Supplies and General Roll-out/Set-up – This includes all forms of general usage items like staplers for the waiter station, host station, kitchen and office. Pens, paper cutter, paper, pads and pencils, shredder and file cabinets are just a few examples of this category. Full roll-out will occur with complete set-up in one day.
- Exterior and Interior Signage – This will include a sand blasted sign for the front as well as directional and informational signs for the parking area. Some critical signage inside is required by Stasistate and Federal law and these will be completed as well (injury, Workers Comp, Material Safety Data Sheets, Workers Right to Know, etc…). Of important note is the flow and ebb of daily work processes which are streamlined and standardized via signs inside. Team members who know what to do, what not to do and how to do, via signs and instructions everywhere, assimilate into the force much faster and with greater emotional understanding. Becoming a full and contributing member of the team in a rapid manner brings satisfaction as a complete and ready helper.
- Computers, Printers and Fax Setup – Microsoft XP Professional will be the guiding force behind all of our hardware related choices.
- Micros Wireless Waiter PDA Installation – The Micros system computerization of cash registers, printers, PDA wireless transmittal, flat screens (in the kitchen, waiter area, office and host station) and hardware solutions will be expensive, but worth the investment. Waiters take orders and the wireless system transmits immediately to the kitchen while the order is duplicated in the waiter area for tracking and expediting. Simultaneously and quietly the office and host station monitors and tracks the entire restaurant floor. Waiters submit Form 1244 data nightly for IRS tip tracking compliance thus avoiding the ever increasing problem of investigations into restaurants. Likewise, hours worked are recorded digitally and overtime laws are monitored more effectively with simple printout or data blend into QuickBooks or into PayCycle of Blisstate, our certified Stasistate and Federal payment processor. Of specific note is our capability to process all payment via phone or Internet for dealers bills. Our employees will be on direct deposit for pay checks. Our means of dealing with high intensity traditional paper processes are to streamline them and advance them into the extremist digital divide of electronic means.
- Serving Staff Uniforms – We utilize some modern, inexpensive resources such as Vol-de-Mart and Zeers while paying higher prices for must-have items only.
- Mezzanine Building and Extension – Working with our Master Architect, Borgia Romano of GaGG, we will extend the present mezzanine out to create approximately 1,500 square feet of space for upstairs dining.
- Mechanicals, Tearout and New Installation – A complete installation of heat and air conditioning will be needed as well as hot water piping and electrical wiring.& A low voltage alarm and fire detection system will be installed.
- Start-up Labor Costs for four Months – This sector is for Gimli Kefalotiri at $3,000 per month, Tsoutsouros Graviera at $4,000 per month, Vasto Parmigiano at $5,000 per month and Fluno Gorgonzola at $5,800 per month.

| Start-up | |
| Requirements | |
| Start-up Expenses | |
| Legal Representation w/Paperwork Evaluation | $4,240 |
| Stationery, Menus, Guest Checks | $4,942 |
| Consulting Fees – Investment Banker | $45,000 |
| Property & Workers Comp Policies | $9,233 |
| Basement Rehabilitation | $2,888 |
| Office Supplies & General Roll-out/Set-up | $2,410 |
| Pest Control and Spraying | $800 |
| Serving Staff Theme Uniforms | $8,245 |
| Modern Kitchen Staff Uniforms | $3,748 |
| Outside Building & Landscaping | $854 |
| Liquor License | $100,000 |
| Visa, Discover, AMEX, MC Items | $922 |
| Computer Software | $2,229 |
| Building Interior | $800 |
| Mezzanine Rollout & Sharpening | $1,900 |
| Chamber of Commerce/Other Memberships | $1,200 |
| Initial Job Hiring Related Advertising | $540 |
| Initial, Kick-start, Teaser Advertising | $5,000 |
| Associated Painting Needed | $1,600 |
| Phone, Electric, Cable and Gas Deposits | $1,480 |
| Food and Liquor Setup | $2,000 |
| Kitchen Supplies | $4,000 |
| Opening Celebration w/Music | $4,000 |
| Cleaning Costs | $2,200 |
| Start-up Labor Costs for Four Months | $71,200 |
| Expense Account for Food, Fuel, Bills | $2,300 |
| Pre-funding Costs to Fluno Gorgonzola | $3,400 |
| Copy Machine | $800 |
| Fire and Burglar Alarm Installation | $6,700 |
| Milestones/Contingency/Other | $20,000 |
| Commercial Pre-Inspection of Building | $800 |
| Total Start-up Expenses | $315,431 |
| Start-up Assets | |
| Cash Required | $40,000 |
| Start-up Inventory | $23,878 |
| Other Current Assets | $0 |
| Long-term Assets | $0 |
| Total Assets | $63,878 |
| Total Requirements | $379,309 |
Products and Services
The Menu
Fresh, home-made and simple is the Full of Bologna message. The current popularity of fresh and healthy eating is exciting for customers. Our low-carb, low-fat or no-fat and low-calorie offerings, such as our gourmet vegetarian lasagna, will be stunning and amazing while offering full and robust flavor. This is in keeping with the number one trend cited by the National Restaurant Association (NRA) 2005 Report. We also will key in on high flavor, bold and spicy tones as cited as the number three trend. The number two is Ethnic food so Italian remains at the top.
Our selection of gourmet iced and hot teas or coffees along with lattes, cappucinos and espressos will resound strongly within the NRA study as these were mentioned as trends number four and ten.
Our specialty Italian and Mediterranean sandwiches, like the famous Italian Huge Plate Muffelata, will be home run hits across the board. Our hand-made breads fresh from the kitchen will astound diners when they accompany meals and as sandwiches. Our previous successes with Salami, Provolone and Italian Style Ham and Balsamic Vinegar/Olive Oil Remoulade Wrap or our Fried Chicken Caesar Wrap will meet with the NRA’s predicted desires for “wraps” cited under hot trend number six–gourmet sandwiches, and nine–wraps. We also showcase an exquisite hand-made demi roll with goat cheese and roasted peppers and vegetables. This mini sandwich is served with fresh sliced pomodoro tomatoes and crisp Boston or Romaine lettuce.
Hot trend items number seven–seafood, and eight–comfort foods will also be addressed with our wonderful fish and seafood dishes that play into exotic spice and flavor profiles. Some examples of these include our Spinach Stuffed, Fresh Atlantic Flounder with Roasted Red Pepper Cream Sauce and Pesto Dots. We stuff this with our own hand reduced, fresh spinach leaves in a double chicken broth and then mix in Italian bread crumbs and lemon. The heartiness of this dish plays towards the noted comfort foods cycle as does our Huge Italian Meatballs (baseball sized) over Spaghetti, Handmade Po Valley Oven Meatloaf with Tomato Sauce and Garlic Mashed Potatoes or Prosciutto and Peas in Fresh Cream over Spinach Linguini.
Our food products will be fresh and of the finest quality, prepared with sensitivity and care on the premises. Full of Bologna will change the “specials” on the menu every 3-4 months, but we’ll keep ‘Your Favorites.’
Our wine list will be modest in size and primarily focused on wines from Italy, France and California. Approximately 25% will be exclusively available by the glass and the remaining labels will be available by the bottle.
We will also feature a moderate international beer selection on tap and in bottles. These will be exclusively dominated by Belgian and Italian beers. We will develop our own micro brewery, offering several of our own beers. The comfortable softly-lit bar features a comprehensive selection of the finest Vodkas, homemade Italian apertifs and digestifs (like Lemoncello) and single malt Scotches as well as all of the other favorites. We will offer a number of Campari specialties.
During the busy summer months customers can also sit outside on our patio and we will offer a special summer menu, featuring lighter fare, exotic drinks, and non-alcoholic offerings. The patio and garden setting will be a fun and casual atmosphere for the summer crowd.
We will offer a three course ‘business lunch’ prix fixe and a three course dinner prix fixe in addition to the regular menu. We will be open 7 days a week serving lunch Monday – Friday 10:30 AM – 2:30 PM and dinner Sunday – Thursday, between 5 PM – 10 PM. Friday and Saturday Dinner 5 PM – 11 PM. The lounge will be open until 2 AM Friday and Saturday. Sunday – Thursday the lounge will stay open till 12 AM. Saturday and Sunday we will serve brunch between 11 AM – 3 PM.
The Atmosphere
Full of Bologna, A Taste of North Italy will be in the old bank building at The Greensward in Niceburb and will feature a Renaissance Era Carriage parked out front. The entire inside decor will be that of the Italian High Renaissance, with the host and wait staff in period costumes.
When you walk into Full of Bologna you will hear the, melodic, expressive tunes, and madrigal singing of Renaissance Italy. The green and white checkered floors off to the side contrast with the classy dark green rugs in the stronghold middle of this powerful and foreboding bank building. Everything one looks at or touches evokes feelings of the High Renaissance, when Italy was the center of European revival of classic culture, modern science, world exploration and the new individual expression in literature, music and art.
For busy people in today’s hassled world and for the hundreds of thousands of vacationers each week who need to escape from this time and place, Full of Bologna offers an amazing diversion from life. Unlike so many other restaurants – Full of Bologna goes beyond excellent decorating, expected menu items and regular themes. Although a lot of the theme restaurants look great inside, the food is good and the menu matches the theme – Full of Bologna brings history alive, reversed back in time, where talking with anyone or listening to 1300s music is all part of living within that time.
Style of Service
Service is smart and quick with friendliness and unprecedented standards of kindness. This attitude is exuded and demonstrated first and foremost by Fluno Gorgonzola as if he was still working at the White House. We will leave the customer overwhelmed by value, hospitality and a sense that the norms of dining out have been broken. To reinforce the customer’s perception of value, Full of Bologna will strive for consistency. Consistency provides patrons with a sense of assurance according to the National Restaurant Association. Service begins within our minds with immediate recognition upon entry into our restaurant (customers are considered “guests,” at Full of Bologna). The management and servers will handle every detail to make the customer’s special evening even more special! All this and our great atmosphere will make customers want to come back again and again!
Market Analysis Summary
In the case of specialty centers such as The Greensward, estimating sales potential becomes significantly more subjective than that of a more traditional retail center with defined areas of trade. In the case of The Greensward, Claritas, Inc., a nationally recognized vendor of demographic information to the retailing industry, quotes it will attract patrons from fairly distant locales, making it a destination, rather than a convenience center.
In the region, there are several such specialty centers. These specialty areas tend to draw day or weekend patrons attracted by the appeal of goods offered. The Greensward’s proximity to densely populated areas of Renaissance, Blisstate and Stasistate is expected to indicate a reasonable expectancy for success.
The Greensward’s Draw and Trade Area
According to Claritas, Inc., it is likely that The Greensward’s draw will be as extensive as a two-hour commute. This appears reasonable as South Stasistate receives many visitors throughout the year, many of whom spend long weekends or longer. For analytical purposes Claritas, Inc. has divided the trade area into primary and secondary zones. “Between 40% and 60% of a specialty center’s retail sales are generated from the primary trade area. Another 20% to 25% comes from the secondary area. The balance is derived from inflow of transient customers passing through or working in the properties trade area.” Claritas, Inc. determined that the primary trade area for The Greensward is a radius of 20 miles with the secondary trade area extending outward to a 40 mile radius.
While a certain level of subjectivity exists in attempting to quantify the limits of a property’s trade area, based upon observations and discussions with the owners, The Greensward’s total trade area is quite expansive. The Firedrake Glass School, combined with available lodging facilities and water frontage tend to create characteristics which, at minimum will draw patrons within a reasonable commute. Niceburb is within 20 minutes of Megametro, receives, 35 minutes of Gigametro and 30 minutes from the Regional Transit Rail Station. There is good accessibility to and from nodes of residential development (specifically the Swampy Ridge region recently designated as the largest housing growth sector in the state (Construction Data News)) as well as the anticipated tenant mix at The Greensward relative to alternative centers form the basis of this opinion.
Trade Area Population
Claritas estimates the current households of the secondary trade area of The Greensward property at 1.47 million. This represents a 5.8% increase since 1990. The population of the total trade area is now estimated to be 5.38 million, which is a 4.6% increase over the same time period. Looking forward, Claritas projects the population of the total trade area to increase further to 5.43 million (0.98%) while that of the secondary trade area is expected to become 1.49 million (1.69%) by the year 2006.
Trade Area Households
A household consists of all the people occupying a single housing unit. National trends indicate that the number of households is increasing at a faster rate than the growth of the population. Claritas shows that the number of households in the primary trade area of The Greensward is now 551,039, which is up 9.11% since 1990. Within the total trade area, the number of households is now estimated to be 2.03 million, an increase of 7.3%. By the year 2007, Claritas estimates that the number of households in the primary trade area to increase by 2.9%. The secondary trade area is expected to experience a slightly lower increase of 2.0%. Considering the above, there is growth in the number of households in the trade area. Additionally, a greater number of smaller households with fewer children generally indicate more disposable income which is a positive factor for a property like The Greensward. Disposable income is generally spent on eating out and entertainment (National Restaurant Association 2005 Report and Outlook) with sales exceeding $440 billion in America for 2004.
Trade Area Income
The median effective buying income (EBI) or disposable income after federal taxes in the Gigametro Metropolitan Area is currently estimated to be $43,800. Throughout the entire metropolitan area it is estimated that 20.4% of the 1.925 million households have an effective buying income under $35,000 annually while 42.0% of households have yearly EBI in excess of $50,000. Border County’s current median household income level of $38,834 is 11.3% below the metropolitan area’s median.
Income levels, whether on a per capita, or per household basis, indicate the economic level of the residents of the trade area. Median household income, when combined with the number of households, is a major determinant of an area’s retail sales potential. According to Claritas, the total trade area of The Greensward has an estimated household income of $70,025, which is more than that of the region and Border County as a whole. Focusing on the smaller primary trade area, the current estimated household income is $74,742, reflective of the high incomes in neighboring areas such as Gigametro and Megametro.
Trade Area Sales
In order to estimate the sales potential for a project such as The Greensward, Outland-Goathum Real Estate (OGRE) has made some qualitative estimates of potential patrons based on their experience with specialty centers and the competition in the region found in their, “Complete Appraisal and Self-Contained Report.” These projections include the average limit of travel, the number of visits per year, households and income levels of prospective patrons, and spending habits. This analysis incorporates generalities abstracted from various publications with subjective adjustments which OGRE believes are reasonable and applicable to The Greensward property and its market area.
The Greensward will be anchored by the enclosed Firedrake Glass School, a restaurant/dinner theater, as well as a hotel and European spa showcased by the famed Pierre and Carlo management of salons and spas. The 40,000 square foot working glass museum and retail center will be exciting with live glass blowing and cutting. Customers will be able to have personalized pieces created in front of their very eyes and be involved in the creation of their own pieces. One of the most prominent artists will be Mr. Measham Stilton – the, “Gustave Caillebotte of Glass.” As a related example; the, “Corning Center,” located in Corning, New York has 7m (seven million) visitors a year according to the recent Director Peter Yenewen who owns Crystal Signatures. The Corning Glass Center and Museum has recently completed a 65 million dollar renovation in 2000 by Smith-Miller and Hawkinson. In addition to the anchor tenants The Greensward will also include approximately 40 specialty shops and it is expected that patrons will spend from a half day to a weekend during each visit (OGRE). Some of the other specialty shops include; a Ralph Lauren Outlet, art gallery and shop, food court under tent, Jolly Jack-tar Nautical Gift Shop and other shops.
On the other hand, unlike traditional shopping centers, specialty centers are typically visited only occasionally. This sporadic patronage is conservatively estimated by us at one to two visits a year per household. Likely, those visitors within a 20 mile radius would be more inclined to visit more often, while the opposite is true of those from 20 to 40 miles out. OGRE and Claritas concluded that households within 20 miles would visit an average of 1.5 times per year, while those living within the 20 to 40 mile radius would likely visit about half as often.
Based on figures provided by Claritas, 72.6% of households within 20 miles and 68.2% of households within 40 miles distant quantitatively equates to 1.4 million households purchasing goods and services at The Greensward. Due to the specialty nature of the property, it is not typical that all of the households within these radii would be interested in The Greensward, or may choose an alternate location offering similar products or services. This is even more likely for those households outside of the 20 mile radius, which have more alternatives within the same driving distance. Considering these factors, we have conservatively projected that 50% of those potential visitors within 20 miles would patronize The Greensward, while 25% of those 20 to 40 miles out would visit regularly. Combined this is an average of 32.1% which results in 451,826 households visiting an average of 1.08 times per year or 1,238 households visiting per day (with local staff at the shops, restaurants and hotel this is approximately 1,300 total). Our business plan is based on 195 lunches and 195 dinners per day (130 winter). This will escalate as the landlord brings in 20 to 40 buses per day with visitors from retirement homes, societies, churches and other special interest groups. It may further escalate as gaming becomes a reality and the two casino barges are docked at The Greensward as early as fall of 2005. For our estimates, though, we are only, conservatively utilizing the OGRE and Claritas figures (no buses and no gaming). It should be of particular interest that the developer and landlord previously built the outlet malls in Centerville and utilized successful busing schemes to bring in thousands per day.
The U.S. restaurant industry is expected to post a record $476 billion in sales in 900,000 restaurant locations in 2005, according to the National Restaurant Association (NRA). The industry outlook for our region is also bright, as sales are expected to reach more than $48.1 billion next year. In addition, the region is expected to add 129,800 restaurant-industry jobs over the next 10 years.
“The nation’s restaurants are proud to continue being an essential part of Americans’ lifestyles, as American consumers will spend almost 47% of their food dollars in the restaurant community in 2005,” said Steven C. Anderson, president and chief executive officer of the Association. In 2005, Stasistate restaurants are expected to post sales of $10.4 billion (5.1% increase from 2004); Mythtate, $23.3 billion (4.9% increase); and Blisstate, $14.4 billion (4.3% increase).
“Several economic indicators, such as improvements in regional economic conditions, gains in disposable income and general population growth, pave the way for continued solid performance and growth,” said Hudson Riehle, senior vice president of the Association’s Research and Information Services Division. In our region sales are expected grow at a 4.8% rate. With the number of restaurant locations in the United States growing to 900,000 in 2005, the number of restaurant jobs will also increase; the industry is expected to add 1.8 million jobs in the next 10 years.
Lastly, we have considered the spending habits of potential visitors. Although it would not be unusual for upper income families to spend several hundred dollars per visit, we must consider that 35% of the potential patrons have a median household income of less than $75,000, with nearly half of these families in the $35k to $50k range. Overall, it is in our opinion that a reasonable estimate of average spending would be in the range of $100 per visit. Factoring in all of the above, results in net potential sales for the The Greensward at approximately $48.9 million per year. A summary of the calculations is as follows:
Estimated Sales Potential
The Greensward and it’s impact on Full of Bologna, Jolly Jack-tar Restaurant and Show and The Highfalutin Hotel and Spa
| 2003 Estimated Data |
20 Mile Radius |
40 Mile Radius |
Total Area |
|
Households |
551,039 |
1,476,825 |
2,027,864 |
| Times: % earning over $35k |
72.6% |
68.2% |
69.4% |
|
Equals: Potential Visits |
400,054 |
1,007,195 |
1,407,249 |
|
Times: Ratio of Interested Hhlds |
50.0% |
25.0% |
32.1% |
| Equals: Net Potential Visits |
200,027 |
251,799 |
451,826 |
| Times: Average Visits per Year |
1.5 |
0.75 |
1.08 |
| Equals: Net Yearly Visits |
300,040 |
188,849 |
488,889 |
| Times: Avg Spending Allowance |
$100 |
$100 |
$100 |
| Equals: Sales Potential |
$30,004,073 |
$18,884,900 |
$48,888,973 |
Based on the proposed building area of 189,842 gross leasable square feet this indicates potential sales of $258 per square foot. As a check on the reasonableness of this figure, we have reviewed data assembled by the Urban Land Institute (ULI). Community shopping centers in the Eastern United States average sales of $251.28 in sales per gross leasable square foot, with centers in the upper decile averaging just under $480 per square foot. Given the specialty nature of The Greensward with it’s proposed mixed use (i.e.) hotel rooms, restaurant, antiques mall, Firedrake Glass School, it is likely that sales would, overall, be slightly above average. However, the purchasing power within the radii would likely keep the center from categorization in the upper decile. Therefore, the results displayed above appear reasonable given the attributes of The Greensward property proposed.
4.1 Market Segmentation
In the following tables we detail and show households by age of household and households by household income. Our target market consists of households between the ages of 35 to 44; 45 to 54; 55 to 64 and 65 to 74. Within the primary and secondary target markets (per OGRE analysis) of 20 and 40 miles the result of this demographic trend is 68.43% of the market – 2002 estimate (Claritas 2002 Study). Claritas, while compiling this information, used the 1990 Census figures and converted it to Census 2000 geographics. Claritas further projected that in 2007 this will rise to 69.26% of the market.
Our target market consists of household earners of over $35,000 per annum. Within the primary and secondary target markets (per OGRE analysis) of 20 and 40 miles the result of this demographic trend is 68.17% of the market – 2002 estimate (Claritas 2002 Study). The average household income was $70,025. Claritas, while compiling this information, used the 1990 Census figures and converted it to Census 2000 geographics. Claritas further projected that in 2007 this will rise to $83,607 or 69.26% of the market.
Demographic Trends
| Households by Age |
2000 Census |
2002 Estimate |
2007 Projections |
| Households by Age of Holders |
2,013,167 |
2,027,864 |
2,069,361 |
|
Household Age 15-24 |
4.05% |
4.57% |
4.57% |
|
Household Age 25-34 |
16.68% |
16.09% |
15.40% |
|
Household Age 35-44 |
22.74% |
21.89% |
19.52% |
|
Household Age 45-54 |
20.20% |
20.83% |
21.74% |
|
Household Age 55-64 |
13.71% |
14.55% |
16.86% |
|
Household Age 65-74 |
11.59% |
11.16% |
11.14% |
|
Household Age 75+ |
11.03% |
10.92% |
10.77% |
| Households by Income |
2000 Census |
2002 Estimate |
2007 Projections |
| Average Income |
$43,198 |
$70,025 |
$83,607 |
| Median Income |
$34,747 |
$54,246 |
$62,901 |
|
Households by Income |
1,889,141 |
2,027,864 |
2,069,361 |
|
Less than $15,000 |
20.53% |
11.74% |
8.84% |
|
$15,000 – $24,999 |
14.92% |
9.85% |
8.78% |
|
$25,000 – $34,999 |
14.87% |
10.24% |
9.17% |
|
$35,000 – $49,999 |
19.23% |
14.58% |
13.46% |
|
$50,000 – $74,999 |
18.14% |
21.15% |
18.88% |
|
$75,000 – $99,999 |
6.65% |
13.47% |
14.39% |
|
$100,000 – $149,999 |
3.57% |
11.23% |
14.48% |
|
$150,000 – $249,999 |
1.20% |
5.68% |
7.43% |
|
$250,000 – $499,999 |
0.51% |
1.40% |
3.40% |
|
$500,000 and over |
0.25% |
0.66% |
1.15% |
Yet another Market Segmentation Analysis using different segments is shown in the table and chart below.

| Market Analysis | |||||||
| Year 1 | Year 2 | Year 3 | Year 4 | Year 5 | |||
| Potential Customers | Growth | CAGR | |||||
| Households 15-24 | 0% | 1,917,280 | 1,917,280 | 1,917,280 | 1,917,280 | 1,917,280 | 0.00% |
| Happy Couples | 0% | 479,320 | 479,320 | 479,320 | 479,320 | 479,320 | 0.00% |
| Families | 0% | 958,640 | 958,640 | 958,640 | 958,640 | 958,640 | 0.00% |
| High-end Singles | 0% | 1,288,055 | 1,288,055 | 1,288,055 | 1,288,055 | 1,288,055 | 0.00% |
| Tourists and Gamblers | 0% | 4,368,000 | 4,368,000 | 4,368,000 | 4,368,000 | 4,368,000 | 0.00% |
| Total | 0.00% | 9,011,295 | 9,011,295 | 9,011,295 | 9,011,295 | 9,011,295 | 0.00% |
4.2 Service Business Analysis
What is in store for the restaurant industry in 2005? No one has all the answers, but the National Restaurant Association SmartBrief paints a picture of the year that lies ahead. The Year-End Report presents the results from a survey of SmartBrief readers on issues facing the industry and insights from National Restaurant Association Chairman of the Board Burton “Skip” Sack.
Thoughts From the Industry:
1. What do you predict will be the hottest new food or beverage items in restaurants in 2005?
1. “Healthy” eating — low-carb, low-fat, low-calorie, low in trans fats
2. Ethnic foods — Asian, Indian, Mexican and fusion cuisine top the list
3. High flavor — bold/spicy flavors in foods; flavor-infused cocktails, milk, water
4. Teas — specialty teas, diet spiced teas, tea-infused dishes
5. Natural/organic foods and beverages
6. Sandwiches — gourmet, deli, new flavors and breads
8. Seafood
7. Comfort foods
9. Wraps
10. Coffees — specialty coffees, flavored lattes, even coffee-based sauces
2. As a restaurant industry professional, what is the one issue that keeps you awake at night?
1. Rising costs (food, labor, energy, insurance, etc.)
2. Recruiting and retaining employees
3. Food safety/food security
4. Competition
5. Litigation/government regulations
3. When planning your next family vacation, will you:
Research restaurants ahead of time — 13.1%
Wing it and choose your restaurants once your vacation gets under way — 37.5%
Both of the above — 49.4%
4. In 2005, restaurants will receive about 47 cents (46.7%) out of every dollar consumers spend on food. What do you think the percentage will be by 2015?
46.7% (current share) or less — 21%
46.8% to 50% of every dollar — 19%
50.1% to 55% of every dollar — 31%
More than 55% of every dollar — 29%
Median answer: 52% of every dollar
The U.S. restaurant industry is expected to post a record $476 billion in sales in 900,000 restaurant locations in 2005, according to the National Restaurant Association (NRA). The industry outlook for our region is also bright, as sales are expected to reach more than $48.1 billion next year. In addition, the region is expected to add 129,800 restaurant-industry jobs over the next 10 years.
“The nation’s restaurants are proud to continue being an essential part of Americans’ lifestyles, as American consumers will spend almost 47% of their food dollars in the restaurant community in 2005,” said Steven C. Anderson, president and chief executive officer of the Association. In 2005, Stasistate restaurants are expected to post sales of $10.4 billion (5.1% increase from 2004); Mythtate, $23.3 billion (4.9% increase); and Blisstate, $14.4 billion (4.3% increase).
4.2.1 Competition and Buying Patterns
Full of Bologna, A Taste of North Italy and the Jolly Jack-tar restaurants will be the only full-service restaurants within the 25-acre Greensward complex. The business plan projections are based on 15% of the 1,300 person-per-day traffic flow of the OGRE Appraisal Report. Additional patrons are expected due to the following factors:
- Bus tours set up by Loess Cairn Commons, LLC (landlord) bringing in an additional 1,000+ persons per day to visit the Firedrake Glass School which will be the centerpiece of the newly created “Firedrake Glass School Trail.”
- Special events held throughout the year such as the Offshore Powerboat Association (OPA), “Liberty Grand Prix,” with it’s high-powered big-bore racers. Will be able to contribute sponsorship for the races at The Greensward.
- “Naval Battle on the River,” a re-enactment of a colonial era warship battle on the geographics River with the Civil War Sailor and Marine Magazine and Association (CWSMMA). This will be held on Saturdays and Sundays (May 15 – September 30).
- Loess Cairn Commons, LLC (landlord) currently has a commitment from Barkdust Mills for 3,600 room nights (occupancy) in The Greensward’s, “Highfalutin Hotel and Spa,” resort. In addition to this, the current available capacity of room nights in this, the largest growing sector of the our multi-state region is inadequate. Both Bowsprig, Inc. and Grumpliere Co. are increasing workers capacity in the Wetdryland district, along Center Edge Road and ultimately in Bogsboro.
The Full of Bologna restaurant and lounge should capture a minimum of 15% of the traffic flow traveling to the destination center because there are few restaurants in the Niceburb area other than the restaurants listed below:
The most popular eating places in the area are explained below:
- Golden Diner: This is an 80 seat, typical, diner, open all week and serves breakfast, lunch and dinner. It is located within an 8 minute drive of The Greensward. Their price range is $4 – $9 for lunch and $6 – $12 for dinner entrees.
- The Italian Kitchen: An upscale restaurant/lounge/bar with an Italian menu, it is located within a 15 minute walk of The Greensward and has been open for 30 years (demonstrating viability of concept). They are open for lunch and dinner. The entrees on their menu range from $16 – $49 and a mixed drink is $4 – $9. This is a strict Italian eatery very similar to Full of Bologna. They offer common, good, traditional Italian peasant food. It is well known, with people coming from three states to eat there, and does extremely well (sometimes at 350+ dinners even on a Thursday night) regardless of the fact that the area is still undeveloped and uncultivated.
- The Riverview Inn: This restaurant is about 30 minutes south of The Greensward, on the water. It does not have easy access from the Interstate highway. They have normal seating for 185 people between their two dining rooms. The menu range is from $15 to $30. This facility also can handle banquets of up to 250 people. This is a wonderful restaurant to visit and has been building it’s reputation slowly, through the years.
Marketing Strategy
Marketing and Sales Forecast information is presented in the following topics.
5.1 Competitive Edge
The Greensward destination retail center with its captive audience and a reduced sales tax on goods of 3%, will provide the overall competitive edge needed to meet the financial projections. Additionally, the expertise of Fluno Gorgonzola’s gourmet cooking will be marketed and used as a draw to attract more customers. Chef Fluno has appeared on over a dozen television programs and has authored numerous articles around the world.
Mr. Gorgonzola will continue to make guest appearances and continue to author articles, however now he will use these opportunities to market his Full of Bologna, A Taste of North Italy and Jolly Jack-Tar restaurants at The Greensward. He will further promote the restaurants by placing advertisements offering monthly cooking lessons and demonstrations.
In addition to TV appearances, hands-on demonstrations, and cooking classes, there is the strong possibility that The Greensward location will be one of the sites on the appearances River that will host slot machines. Currently there are 10 Assemblymen and 2 State Senators that have voted positively to extend the locations for slot machines in appearances. (The Greensward includes 11 acres that are located within the appearances River and the State of appearances.) The legislation is currently slated for the 2005 session as Bill #10. Further discussion can be provided by the Real Estate Developer, Mr. Forli Taleggio.
5.2 Marketing Strategy
A charge of $2.00 dollars per square foot is being charged on the 191,000 sq ft. of retail space by the Real Estate developer. All tenants will be required to incur this cost. These dollars equate to $382,000 per month or $4,584,000 per year. In additional to the marketing dollars spent on the The Greensward, Full of Bologna will spend an additional $3,375 per month or $40,500 per year on the following:
Advertising – Print
- Brochures placed in the shops at The Greensward with reciprocal placement of the shops’ brochures in Full of Bologna
- Menus placed in the Highfalutin Hotel
- Coupons handed out on site
- Sandwich boards worn by costumed personnel on site w/ madrigal music played outside of the restaurant
- Paid Advertisements in Dinner Guide & Yellow Book Publications
Media-Radio and TV
- Paid News Radio Ads impersonating Cesare and Lucrezia Borgia, with Renaissance music in background
- Guest TV appearances by “Chef Fluno” plugging his new restaurants at The Greensward
Public Relations
Survey Cards will be placed at each table for patrons to collect data on the following:
- Quality of the Food & Service
- Demographic Information to target marketing efforts
- Sign In Book/ Ledger & Fish Bowl for Business Cards to create an E-mail List
Website
- Newsletter- to include both a Calendar of Special Events by Full of Bologna and The Greensward Festivals and the site will also include Letters by customers and Pictures of customers at events
- Coupons may be downloaded off the web site.
- Full of Bologna will be linked to/ from hundreds of websites, including the Border County Chamber of Commerce and U.S. Chamber of Commerce.
Marketing Sales Packages
- Bus Tour Packages – Dining to be included with the Glass Center Tours
- Catering Packages targeting Local Industry and Corporate Parks
- Wedding Packages in conjunction with the Hotel & Spa Resort
- Get Away Tours in conjunction with the Hotel & Spa Resort
Special Events
Full of Bologna Special Events
- Private “Cooking Demonstrations”
- Black Tie Cigar/Vodka/ Gourmet Dinners
- Lecture/Dinner Series
- Chili Making Contest in September
- Pumpkin Carving Contest in October
- Gingerbread Making Contest in November
- Ice Sculpture Contest in February
In conjunction with The Greensward Special Activities
January
- Arts Business Institute Weekend Workshop
- “Greens and Grits” weeklong dinner series honoring MLK at Jolly Jack-tar Restaurant and Show (with music, stepping and special African-American speeches, lectures and presentations)
- Tour the World Dinner and Wine / Lecture Series at Full of Bologna (Alsace-Lorraine with Chef Fluno)
- Robot Wars, “Battle and Master” series at Highfalutin Hotel and Spa
February
- Presidents Day History Bee
- African American History Symposium, Celebration, Dancing and Robert Smalls Dinner
- Romantic Holiday Weekend Package with Special Spa discounts
- Mardi Gras Weekend Package and Mardi Gras Feast with King Cake Cutting at Jolly Jack-tar
- Tour the World Dinner and Wine / Lecture Series at Full of Bologna (Japan and Sushi with Chef Fluno)
March
- Tribute to Europe at the Firedrake Glass School
- Saint Patrick’s Day Party / Parade / Green Beer Keg Party at Jolly Jack-tar with Festival (four days)
- Segway HT Event
- Tour the World Dinner and Wine / Lecture Series at Full of Bologna (Ice Carving with Chef Fluno)
- Black Tie Cigar Wine night with Cigar Afficionado and Wine Spectator Magazines
April
- Remote Control Raceboat Championships with Gold and Silver Cup Awards
- Corporate Spelling Bee, “Let’s Watch an Adult Do It and Win Cash” Official Games
- Annual Art on the Blacktop Symposium
- Arts Business Institute Weekend Workshop
- Tour the World Dinner and Wine / Lecture Series at Full of Bologna (Easter & Spring with Chef Fluno)
May
- Civil War Naval Reenactment with, “Cannon Raging Over the Open Water” and Tall Ship event
- Cinco de Mayo Fireworks and Verizon Mariachi Bands Competition for the voting public (televised live)
- House and Garden Tours
- Highfalutin Hotel and Spa Reality TV Show kickoff with Pierre and Carlo di Roma Salon and Spa
- Segway HT Event
- “Masters of the Fire and Water, Make Your Own” Glass Art Show
- Tour the World Dinner and Wine / Lecture Series at Full of Bologna (Planting in the Graden with Chef Fluno)
June
- World War II Commemoration with reenactors howitzer, machine gun and rifle firing demo’s
- Jolly Jack-tar Micro-brewery, Annual Beer Drinking and Pretzel Eating Battle. Beer seminars and craft making with tastings (three days)
- “Liberty Grand Prix” Boat Races Kick Off / Picnic and displays of SMART items.
- Outdoor Summer, Free Concert Series begins each Saturday night
- Tour the World Dinner and Wine / Lecture Series at Full of Bologna (Garde Manger with Chef Fluno)
- Computer Expo
July
- 4th of July Fireworks with Waiters and Waitress Serving and Running Competition
- Revolutionary War Naval and Army Reenactment with Horse Riding for kids / petting zoo
- Boat Races
- Special Indoor Concert Series begins at Jolly Jack-tar (paid)
- Segway HT Event
- Tour the World Dinner and Wine / Lecture Series at Full of Bologna (BBQ with Chef Fluno)
- “BBQ Battle on the River” with, “Cash is King” prizes
August
- Boat Races and Jet-ski series runoff
- The Circus Comes to The Greensward (outside) with full-sized tents and acts (one week)
- Poetry and writers conference with “Poetic License Competition”
- “Annual Poker Crown Platinum Winner Series” with dealing masters at the table of prizes
- Tour the World Dinner and Wine / Lecture Series at Jolly Jack-tar (Cajun & Creole with Chef Fluno)
- Black Tie Cigar Wine night with Cigar Afficionado and Wine Spectator Magazines
September
- War of 1812 Naval Reenactment
- “Big Boss Muscle Boy Toy” Car Show with, “Bring Your Own Hot Chicks”
- Segway HT Event
- Tour the World Dinner and Wine / Lecture Series at Full of Bologna (Champagne, France with Chef Fluno)
- Annual Scottish Highland Games with gamesmaster and tossing of the caber
October
- Bluegrass Festival, Rodeo and 4-H celebration, games and best of show contests
- Offshore Boat Races
- Tribute to Christopher Columbus and Parade, Special Full of Bologna dinners and wine tasting
- Tour the World Dinner and Wine / Lecture Series at Jolly Jack-tar (Bologna, Italy and Sicily with Chef Fluno)
- “Halloween with Fright Night Rides on the Tractor” scarecrow building, pumpkin carving funfest and ghost tours
November
- Veterans Day Ceremonies / Fireworks / Weapons and Aircraft Displays with Jet Fly Over
- Indian Harvest, Pow-wow, Dancing and Arts Festival
- Tour the World Dinner and Wine / Lecture Series at Jolly Jack-tar (Thanksgiving with our Indian friends and Chef Fluno)
- Black Tie Cigar Wine night with Cigar Afficionado and Wine Spectator Magazines
December
- Breakfast(s) with Santa and Children’s Craft Making by the River
- Christmas Tree Lighting & Winter Walking Tour, Historic Candlelight Tour with the Old Time Sailors
- Glass Art Show for the Holidays and Roman reenactors at the Glass Center in full dress
- New Year’s Eve Fireworks with Masquerade Ball
- Tour the World Dinner and Wine / Lecture Series at Jolly Jack-tar (A Charles Dickens Christmas with Chef Fluno)
5.3 Sales Forecast
ASSUMPTIONS FOR SALES PROJECTIONS
LUNCH:
- 195 lunches per day (on average), 12 months per year (15% of the OGRE daily traffic of 1,300 people per day)
- Typical lunches per year (in full year) is 70,200
- $10.50 per person average
DINNER:
- 195 dinners per day (June, July, August) (15% of OGRE)
- 130 dinners per day (remainder of year) (10% of OGRE)
- Typical dinners per year (in full year) is 52,650
- $20.00 per person average
LIQUOR SALES – RESTAURANT:
- In general 60% of dinner patrons will consume alcohol
- This equates to 117 drinks per day during the summer (195 dinners) and 78 (130 dinners) during the winter
- A 1/3 split between beer, wine and liquor will occur for beverage types sold
MIXED DRINKS:
- 1/3 of 117 drinkers = 39 mixed drinks per night (summer months)
- 1,170 mixed drinks with dinner during each summer month
- 1/3 of 78 drinkers = 26 drinks per night (winter months)
- 780 mixed drinks with dinner during each winter month
- Mixed drinks sell on average @ $4.50 per
WINE BY THE BOTTLE SALES:
- 4 bottles per evening Sunday through Thursday = 20 bottles
- 20 bottles – Friday night
- 20 bottles – Saturday
- 60 bottles per week = 240 bottles per month = 2,880 total
- Average sale price – $16.00
WINE BY THE GLASS SALES:
- 1/3 of 117 drinkers = 39 glasses of wine per night (summer months)
- Factor appropriate 50% reorder rate = 59 glasses of wine
- 1,770 with dinner during each summer month
- 1/3 of 78 drinkers = 26 glasses of wine per night (winter months)
- Factor appropriate 50% reorder rate = 39 glasses of wine
- 1,170 with dinner during each winter month
- Wine by the glass sells on average @ $4.00 per
BEER SALES:
- 1/3 of 117 drinkers = 39 beers per night (summer months)
- 1,170 beers with dinner during each summer month
- 1/3 of 78 drinkers = 26 beers per night (winter months)
- 780 beers with dinner during each winter month
- Beers sell on average @ $3.00 per
LIQUOR SALES – NIGHTCLUB:
MIXED DRINKS:
- 10 drinks per evening Sunday through Thursday = 50 drinks
- 100 drinks – Friday night
- 140 drinks – Saturday
- 290 drinks per week = 1,160 drinks per month = 13,920
- Mixed drinks sell on average @ $4.50 per
WINE BY THE GLASS SALES:
- 2 glasses per evening Sunday through Thursday = 10 glasses
- 20 glasses – Friday night
- 40 glasses – Saturday
- 70 glasses per week = 280 drinks per month = 3,360 total
- Wine by the glass sells on average @ $4.00
BEER SALES:
- 20 beers per evening Sunday through Thursday = 100 beers
- 150 beers – Friday night
- 150 beers – Saturday
- 400 beers per week = 1,600 beers per month = 19,200 total
- Beers sell on average @ $3.00 per
All figures in the enclosed charts include 10% growth in years 06′ – 09′


| Sales Forecast | |||||
| Year 1 | Year 2 | Year 3 | Year 4 | Year 5 | |
| Unit Sales | |||||
| Lunch Sales | 35,700 | 70,200 | 77,220 | 84,942 | 93,436 |
| Dinner Sales | 27,300 | 52,650 | 57,915 | 63,706 | 70,077 |
| Gift Shop Item Sales | 1,080 | 2,160 | 2,376 | 2,617 | 2,875 |
| Web Shop Sales | 151 | 300 | 330 | 363 | 399 |
| Catering Sales | 6 | 12 | 13 | 14 | 15 |
| Liquor Sales | 12,420 | 24,450 | 26,895 | 29,584 | 32,543 |
| Wine Bottle Sales | 1,440 | 2,880 | 3,168 | 3,485 | 3,833 |
| Wine by the Glass Sales | 9,900 | 19,200 | 21,120 | 23,232 | 25,555 |
| Beer Sales | 15,060 | 29,730 | 32,703 | 35,973 | 39,570 |
| Chef’s Table in the Vault Sales | 90 | 180 | 198 | 218 | 240 |
| Total Unit Sales | 103,147 | 201,762 | 221,938 | 244,134 | 268,543 |
| Unit Prices | Year 1 | Year 2 | Year 3 | Year 4 | Year 5 |
| Lunch Sales | $10.50 | $10.50 | $10.50 | $10.50 | $10.50 |
| Dinner Sales | $20.00 | $20.00 | $20.00 | $20.00 | $20.00 |
| Gift Shop Item Sales | $6.00 | $6.00 | $6.00 | $6.00 | $6.00 |
| Web Shop Sales | $6.00 | $6.00 | $6.00 | $6.00 | $6.00 |
| Catering Sales | $2,000.00 | $2,000.00 | $2,000.00 | $2,000.00 | $2,000.00 |
| Liquor Sales | $4.50 | $4.50 | $4.50 | $4.50 | $4.50 |
| Wine Bottle Sales | $16.00 | $16.00 | $16.00 | $16.00 | $16.00 |
| Wine by the Glass Sales | $4.00 | $4.00 | $4.00 | $4.00 | $4.00 |
| Beer Sales | $3.00 | $3.00 | $3.00 | $3.00 | $3.00 |
| Chef’s Table in the Vault Sales | $520.00 | $520.00 | $520.00 | $520.00 | $520.00 |
| Sales | |||||
| Lunch Sales | $374,850 | $737,100 | $810,810 | $891,891 | $981,080 |
| Dinner Sales | $546,000 | $1,053,000 | $1,158,300 | $1,274,120 | $1,401,540 |
| Gift Shop Item Sales | $6,480 | $12,960 | $14,256 | $15,702 | $17,250 |
| Web Shop Sales | $906 | $1,800 | $1,980 | $2,178 | $2,394 |
| Catering Sales | $12,000 | $24,000 | $26,000 | $28,000 | $30,000 |
| Liquor Sales | $55,890 | $110,025 | $121,028 | $133,128 | $146,444 |
| Wine Bottle Sales | $23,040 | $46,080 | $50,688 | $55,760 | $61,328 |
| Wine by the Glass Sales | $39,600 | $76,800 | $84,480 | $92,928 | $102,220 |
| Beer Sales | $45,180 | $89,190 | $98,109 | $107,919 | $118,710 |
| Chef’s Table in the Vault Sales | $46,800 | $93,600 | $102,960 | $113,360 | $124,800 |
| Total Sales | $1,150,746 | $2,244,555 | $2,468,611 | $2,714,986 | $2,985,766 |
| Direct Unit Costs | Year 1 | Year 2 | Year 3 | Year 4 | Year 5 |
| Lunch Sales | $3.36 | $3.36 | $3.36 | $3.36 | $3.36 |
| Dinner Sales | $6.60 | $6.60 | $6.60 | $6.60 | $6.60 |
| Gift Shop Item Sales | $1.92 | $2.88 | $2.88 | $2.88 | $2.88 |
| Web Shop Sales | $1.92 | $2.70 | $2.70 | $2.70 | $2.70 |
| Catering Sales | $640.00 | $680.00 | $680.00 | $680.00 | $680.00 |
| Liquor Sales | $1.44 | $0.90 | $0.90 | $0.90 | $0.90 |
| Wine Bottle Sales | $5.12 | $4.80 | $4.80 | $4.80 | $4.80 |
| Wine by the Glass Sales | $1.28 | $0.80 | $0.80 | $0.80 | $0.80 |
| Beer Sales | $0.96 | $0.60 | $0.60 | $0.60 | $0.60 |
| Chef’s Table in the Vault Sales | $182.00 | $182.00 | $182.00 | $182.00 | $182.00 |
| Direct Cost of Sales | |||||
| Lunch Sales | $119,952 | $235,872 | $259,459 | $285,405 | $313,946 |
| Dinner Sales | $180,180 | $347,490 | $382,239 | $420,460 | $462,508 |
| Gift Shop Item Sales | $2,074 | $6,221 | $6,843 | $7,537 | $8,280 |
| Web Shop Sales | $290 | $810 | $891 | $980 | $1,077 |
| Catering Sales | $3,840 | $8,160 | $8,840 | $9,520 | $10,200 |
| Liquor Sales | $17,885 | $22,005 | $24,206 | $26,626 | $29,289 |
| Wine Bottle Sales | $7,373 | $13,824 | $15,206 | $16,728 | $18,398 |
| Wine by the Glass Sales | $12,672 | $15,360 | $16,896 | $18,586 | $20,444 |
| Beer Sales | $14,458 | $17,838 | $19,622 | $21,584 | $23,742 |
| Chef’s Table in the Vault Sales | $16,380 | $32,760 | $36,036 | $39,676 | $43,680 |
| Subtotal Direct Cost of Sales | $375,103 | $700,340 | $770,238 | $847,101 | $931,564 |
5.4 Milestones
The accompanying table lists important program milestones, with dates and managers in charge, and budgets for each. The milestone schedule indicates our emphasis on planning for implementation.
What the table doesn’t show is the commitment behind it. Our business plan includes complete provisions for plan-vs.-actual analysis, and we will hold monthly follow-up meetings to discuss the variance and course corrections.

| Milestones | |||||
| Milestone | Start Date | End Date | Budget | Manager | Department |
| Meeting and Measuring Evaluation | 5/1/2005 | 5/20/2005 | $85 | T. Graviera | Administrative |
| Contractor Setup | 5/1/2005 | 5/15/2005 | $450 | W. Wensleydale | Construction |
| Website Development | 5/10/2005 | 6/15/2005 | $4,578 | SoarEyeSite | Media |
| Evaluation & Research | 5/12/2005 | 5/30/2005 | $350 | V. Parmigiano | Administrativ |
| Business Plan Investment | 5/1/2005 | 5/30/2005 | $6,304 | F. Gorgonzola | Administrative |
| Legal and CPA Items | 5/5/2005 | 5/15/2005 | $1,210 | D. Stilton | Accounting |
| Library of Congress | 5/14/2005 | 6/14/2005 | $35 | F. Gorgonzola | Legal |
| US Patent & Trademark Office | 5/14/2005 | 8/14/2005 | $375 | F. Gorgonzola | Legal |
| Licensure & Permits | 6/1/2005 | 6/30/2005 | $560 | SoarEyeSite | Media |
| Full Contractor Work/Eruption | 5/14/2005 | 6/22/2005 | TBD | W. Wensleydale | Construction |
| Carriage and Patio Placement | 6/18/2005 | 6/28/2005 | TBD | W. Wensleydale | Construction |
| Alarm Installation | 6/1/2005 | 6/10/2005 | TBD | W. Wensleydale | Construction |
| Costume Research – Design | 5/19/2005 | 5/30/2005 | $699 | S. Sardo | Construction |
| Bids Received In-house | 5/10/2005 | 5/20/2005 | $75 | W. Wensleydale | Construction |
| Stress Test Staff and Kitchen | 6/26/2005 | 6/30/2005 | $3,000 | F. Gorgonzola | Construction |
| Grand Opening | 7/1/2005 | 7/7/2005 | $4,200 | W. Wensleydale | Opening |
| Pre-media Advertising | 6/12/2005 | 7/1/2005 | $4,800 | T. Graviera | Construction |
| Contractor Mega-bid Meeting | 5/2/2005 | 5/5/2005 | $756 | W. Wensleydale | Construction |
| Totals | $27,477 | ||||
Web Plan Summary
Full of Bologna will have a stunning website. It will be the virtual business card and portfolio for the company, simple, classy and well designed. Our site will offer our menus, prices, reviews and happenings. We will also have a monthly newsletter about what did happen to get new customers interested in our restaurant. Customers will be able to send us an E-mail when they want to make reservations at our restaurant. Fast, easy and convenient!
We will have a very small gift shop online.
We will have an online guest book to complement in the foyer. All conversions to a master email list will occur from online or the guest book. Our newsletter will be distributed via VOLUNTARY Double Opt-in sign up in AOL, text or html formats. Our Secure Servers in Blisstate auto-recognize how people want email delivered. Each newsletter will also offer immediate, one-click removal from the list.
6.1 Website Marketing Strategy
Our Web Marketing will center primarily around distribution of our URL via paper means first. That will plug and pull unique hits on our real time database reporting and stats. Our restaurant concept will not rely on achieving first hit status for keywords to draw customers into the premise. Rather, a visit to the website will most always be an after-the-fact event; such as after visiting the restaurant or after reading our brochure or after hearing our commercial on the radio.
We will garner some specific unique entry hits via usage of our time proven keyword and html skills at Formaggio Azioni, LLC. These will result in number one placement across certain keywords and dozens of engines, worldwide. We have had success using numerous URLs, keyword generation and testing with the number one rated international, “Web Position Gold 2” program. In addition to that, complete, separate websites are built specifically for precise search engines. The most intelligent designers are able to achieve #1 ranking via weekly updating across 1,200+ engines. Our primary goal model is the Google engine.
Translation in six languages will also be offered for free and then, paid, through SYSTRAN (in 2006).
We will be linked to/from hundreds of websites, including the Border County Chamber of Commerce and US Chamber of Commerce.
6.2 Development Requirements
The Full of Bologna website will initially be developed with few technical resources. Our simple hosting provider, SoopaDoopaHooplaweb.com, Inc. will host the site and provide the technical back end.
We will develop the simple, elegant, yet Internet focused site.
The maintenance of the site will be done by Fluto Gorgonzola, who is currently designing the graphics and logos. Future development such as newsletters and other related special restaurant issues will come about.
Management Summary
The initial management team depends on the founders themselves, with little back-up. As we grow, we will take on additional consulting help, plus graphic/editorial, sales, and marketing.
Full of Bologna, A Taste of North Italy depends on the Main Bartender (Gimli Kefalotiri), Main Managers (Tsoutsouros Graviera and Vasto Parmigiano) and Executive Chef/Owner (Fluto Gorgonzola) for management. Main management responsibilities will be divided between the top three. While all three are still focused mainly on the quality of expertise, one must take ultimate responsibility for administration and finance and marketing, one for personnel and property and one for food service.
Operating under the successful principles of noted consultant W. Edwards Deming – we will not have organizational charts, preferential parking spots or other icons that create barriers to growth and heightened team development.
Every three months, the CEO assesses the results of these tasks and the personality of the employee involved to determine promotion and/or salary issues.
The key to fulfillment and delivery will be provided by the principal of the business, Fluno Gorgonzola and a host of team helpers. Ensuring success each step of the way, with invaluable resource veterans, is key this plan. The real core value is professional expertise, provided by a combination of experience, hard work, and education (in that order) from several helpers.
Management Team*
- Fluno Gorgonzola — Certified Executive Chef and Certified Restaurant Manager
- Vasto Parmigiano — Restaurant Day Manager
- Gimli Kefalotiri — Bar and Lounge Manager
- Tsoutsouros Graviera — PR and Night Manager
Consultants*
- James Mantua — Realistic restaurant operation and opening
- Rick Monte Cassino — Maitre Cuisinier — Menus
- Rupert and Abruzzi Salerno — Chefs— Cash operations, design, bar, wine, menu, loss reduction at bar and kitchen
- Allan Flivver and Joe Bastogne — Small Business Association (SBA), Service Corps of Retired Business Executives (SCORE) — Business planning
- Jean-Baptiste Capsize — Executive Chef — Menus and systems
- Herve le Chevre — Executive Chef — Menu and stream-lining of corporate educational process and training
- Musukama Eelray — Executive Chef — Menu and training of staff
- Lihue Kamaina — Executive Chef — Menu and business operations
- Hank Stellanova — Executive Chef — Menu and kitchen operations, cookbook publishing and television cooking show production
- Toto Scorche — Executive Chef — Equipment and operations
- Joachim Hanko — Sommelier — Wine and spirits
- Anne Charleston — Master Sommelier — Wine, spirits, beer, cigars
- Denise Elmsford — Education Assistant — Staff training
* Confidential and Proprietary Information removed from this Sample Plan.
We will turn to qualified professionals for freelance back-up in market research and presentation and report development, which are areas that we can afford to contract out without risking the core values provided to the clients.
7.1 Personnel Plan
There are currently less than five employees of Full of Bologna. The growth of the company will be determined by how accurately and efficiently the company is able to implement the facets of this business plan.
Each member of the Full of Bologna team is highly valued; everyone is expected to have opinions, as it is a team that will make this company excel. It is the mission of the company to employ people who are committed to a high standard of excellence, who thrive on a team atmosphere, and who have outstanding customer service skills. This idealism is represented by the current staff, and will continue to be the guideline by which new team members are hired.
General computer and highly automated Micros processes will streamline functions. A number of expensive, labor intensive tasks will not be needed at Full of Bologna.
| Personnel Plan | |||||
| Year 1 | Year 2 | Year 3 | Year 4 | Year 5 | |
| Manager Day | $24,000 | $50,000 | $52,500 | $55,125 | $57,881 |
| Manager Night | $18,000 | $36,000 | $37,800 | $39,690 | $41,674 |
| Manager Lounge/Bar | $18,000 | $36,000 | $37,800 | $39,690 | $41,674 |
| Wait Staff day & night – 16 x 40 hrs x 4.00 p/hr | $16,640 | $30,720 | $32,256 | $33,869 | $35,562 |
| Dishwasher – 2 x 40 hrs x 7.00 p/hr | $13,720 | $26,880 | $28,224 | $29,635 | $31,116 |
| Cooks – 2 day & 3 night = 7 x 40 hrs x 10.00 p/hr | $70,000 | $134,400 | $141,120 | $148,176 | $155,584 |
| Bartenders – 4 flex x 40 hrs x 2.50 p/hr | $10,000 | $19,200 | $20,160 | $21,268 | $22,226 |
| Executive Chef | $34,000 | $60,000 | $62,000 | $64,000 | $66,000 |
| Total People | 0 | 0 | 0 | 0 | 0 |
| Total Payroll | $204,360 | $393,200 | $411,860 | $431,453 | $451,717 |
Financial Plan
Our financial plan is based on raising approximately $349,000 by way of private equity investment.
We will achieve profitability in just over two years and due to the nature of the exponential growth of access charges, we will realize an excellent percentage net profit on sales by year one.
8.1 Start-up Funding
Total start-up requirements are listed. The start-up costs are to be financed by direct investment and owner investment. The details are included in the following tables.
| Start-up Funding | |
| Start-up Expenses to Fund | $315,431 |
| Start-up Assets to Fund | $63,878 |
| Total Funding Required | $379,309 |
| Assets | |
| Non-cash Assets from Start-up | $23,878 |
| Cash Requirements from Start-up | $40,000 |
| Additional Cash Raised | $0 |
| Cash Balance on Starting Date | $40,000 |
| Total Assets | $63,878 |
| Liabilities and Capital | |
| Liabilities | |
| Current Borrowing | $0 |
| Long-term Liabilities | $0 |
| Accounts Payable (Outstanding Bills) | $0 |
| Other Current Liabilities (interest-free) | $0 |
| Total Liabilities | $0 |
| Capital | |
| Planned Investment | |
| Owner Equity | $30,009 |
| Investor | $349,300 |
| Additional Investment Requirement | $0 |
| Total Planned Investment | $379,309 |
| Loss at Start-up (Start-up Expenses) | ($315,431) |
| Total Capital | $63,878 |
| Total Capital and Liabilities | $63,878 |
| Total Funding | $379,309 |
8.2 Important Assumptions
The financial plan depends on important assumptions, most of which are shown in the following table as annual figures. The key underlying assumptions are:
- We assume a slow-growth economy, without major recession. We assume that The Greensward will open in October with it’s 12,000 people per day traffic.
- We assume that there are no unforseen changes in the expectancy in the popularity of our restaurant.
- We assume access to investments and financing which are sufficient to maintain and fulfill our financial plan as shown in the tables.
| General Assumptions | |||||
| Year 1 | Year 2 | Year 3 | Year 4 | Year 5 | |
| Plan Month | 1 | 2 | 3 | 4 | 5 |
| Current Interest Rate | 10.00% | 10.00% | 10.00% | 10.00% | 10.00% |
| Long-term Interest Rate | 10.00% | 10.00% | 10.00% | 10.00% | 10.00% |
| Tax Rate | 30.00% | 30.00% | 30.00% | 30.00% | 30.00% |
| Other | 0 | 0 | 0 | 0 | 0 |
8.3 Break-even Analysis
The following table and chart show our Break-even Analysis.

| Break-even Analysis | |
| Monthly Units Break-even | 4,054 |
| Monthly Revenue Break-even | $45,231 |
| Assumptions: | |
| Average Per-Unit Revenue | $11.16 |
| Average Per-Unit Variable Cost | $3.64 |
| Estimated Monthly Fixed Cost | $30,487 |
8.4 Projected Profit and Loss
Our Pro Forma Profit and Loss statement was constructed from a conservative point-of-view, and is based in large part on past performance of other restaurants. By strengthening our service position, and rebuilding our customer relationships, we will widen our customer base and increase sales.
Month-to-month assumptions for profit and loss are included in the appendices.


| Pro Forma Profit and Loss | |||||
| Year 1 | Year 2 | Year 3 | Year 4 | Year 5 | |
| Sales | $1,150,746 | $2,244,555 | $2,468,611 | $2,714,986 | $2,985,766 |
| Direct Cost of Sales | $375,103 | $700,340 | $770,238 | $847,101 | $931,564 |
| Staff Meals | $2,800 | $5,000 | $5,000 | $5,000 | $5,000 |
| Other Costs of Goods/DESCOMM/Bank | $24,000 | $50,000 | $55,000 | $60,000 | $65,000 |
| Total Cost of Sales | $401,903 | $755,340 | $830,238 | $912,101 | $1,001,564 |
| Gross Margin | $748,843 | $1,489,215 | $1,638,373 | $1,802,885 | $1,984,201 |
| Gross Margin % | 65.07% | 66.35% | 66.37% | 66.40% | 66.46% |
| Expenses | |||||
| Payroll | $204,360 | $393,200 | $411,860 | $431,453 | $451,717 |
| Marketing/Promotion | $50,000 | $52,500 | $52,500 | $52,500 | $52,500 |
| Depreciation | $0 | $0 | $0 | $0 | $0 |
| Employee Healthcare | $21,000 | $40,000 | $41,000 | $40,000 | $40,000 |
| Rent | $16,500 | $72,000 | $72,000 | $72,000 | $72,000 |
| Utilities and Security Services | $22,700 | $34,680 | $36,414 | $38,234 | $40,146 |
| Ceramic, Glass and Silver Upkeep | $1,000 | $9,000 | $9,000 | $9,000 | $9,000 |
| Accounting Fees | $2,500 | $5,000 | $5,000 | $5,000 | $5,000 |
| Manager Comps & Grease Handouts | $17,500 | $30,000 | $30,000 | $30,000 | $30,000 |
| Dues and Subscriptions | $600 | $2,000 | $2,000 | $2,000 | $2,000 |
| Legal Expenses | $0 | $5,000 | $5,000 | $5,000 | $5,000 |
| Flowers | $2,400 | $2,000 | $2,000 | $2,000 | $2,000 |
| Travel Expense | $0 | $4,000 | $4,000 | $4,000 | $4,000 |
| Exterminating | $150 | $300 | $300 | $300 | $300 |
| Fines and Penalties | $100 | $300 | $300 | $300 | $300 |
| Payroll Processing | $610 | $1,200 | $1,250 | $1,300 | $1,350 |
| Insurance, Licensure & RE Taxes | $4,900 | $20,500 | $21,500 | $22,500 | $23,500 |
| Payroll Taxes | $0 | $56,964 | $53,844 | $53,844 | $53,844 |
| Maintenance Costs/Repairs | $12,000 | $49,500 | $49,500 | $49,500 | $49,500 |
| Linen and Dry Cleaning | $1,125 | $1,800 | $1,800 | $1,800 | $1,800 |
| Computer Upkeep/Upgrade | $0 | $12,200 | $12,000 | $12,200 | $12,200 |
| Dish and Cleaning Supplies | $2,400 | $13,800 | $14,000 | $14,200 | $14,400 |
| Office Products Upkeep | $1,200 | $7,000 | $7,000 | $7,000 | $7,000 |
| Paper Product Deliveries | $4,800 | $9,600 | $10,000 | $10,400 | $10,800 |
| Total Operating Expenses | $365,845 | $822,544 | $842,268 | $864,531 | $888,357 |
| Profit Before Interest and Taxes | $382,998 | $666,671 | $796,105 | $938,354 | $1,095,844 |
| EBITDA | $382,998 | $666,671 | $796,105 | $938,354 | $1,095,844 |
| Interest Expense | $0 | $0 | $0 | $0 | $0 |
| Taxes Incurred | $114,899 | $200,001 | $238,831 | $281,506 | $328,753 |
| Net Profit | $268,099 | $466,670 | $557,273 | $656,848 | $767,091 |
| Net Profit/Sales | 23.30% | 20.79% | 22.57% | 24.19% | 25.69% |
8.5 Projected Cash Flow
Because we are treating the new company as a start-up, the cash balance for FY2005 is somewhat exaggerated by the instant influx of new capital. Subsequent years however show a healthy growth in cash flow, mainly due to increased sales.

| Pro Forma Cash Flow | |||||
| Year 1 | Year 2 | Year 3 | Year 4 | Year 5 | |
| Cash Received | |||||
| Cash from Operations | |||||
| Cash Sales | $1,150,746 | $2,244,555 | $2,468,611 | $2,714,986 | $2,985,766 |
| Subtotal Cash from Operations | $1,150,746 | $2,244,555 | $2,468,611 | $2,714,986 | $2,985,766 |
| Additional Cash Received | |||||
| Sales Tax, VAT, HST/GST Received | $69,045 | $134,673 | $148,117 | $162,899 | $179,146 |
| New Current Borrowing | $0 | $0 | $0 | $0 | $0 |
| New Other Liabilities (interest-free) | $0 | $0 | $0 | $0 | $0 |
| New Long-term Liabilities | $0 | $0 | $0 | $0 | $0 |
| Sales of Other Current Assets | $10,300 | $12,000 | $13,000 | $14,000 | $15,000 |
| Sales of Long-term Assets | $0 | $0 | $0 | $0 | $0 |
| New Investment Received | $0 | $0 | $0 | $0 | $0 |
| Subtotal Cash Received | $1,230,091 | $2,391,228 | $2,629,727 | $2,891,885 | $3,179,912 |
| Expenditures | Year 1 | Year 2 | Year 3 | Year 4 | Year 5 |
| Expenditures from Operations | |||||
| Cash Spending | $204,360 | $393,200 | $411,860 | $431,453 | $451,717 |
| Bill Payments | $570,420 | $1,380,599 | $1,493,514 | $1,619,145 | $1,758,632 |
| Subtotal Spent on Operations | $774,780 | $1,773,799 | $1,905,374 | $2,050,598 | $2,210,349 |
| Additional Cash Spent | |||||
| Sales Tax, VAT, HST/GST Paid Out | $0 | $0 | $0 | $0 | $0 |
| Principal Repayment of Current Borrowing | $0 | $0 | $0 | $0 | $0 |
| Other Liabilities Principal Repayment | $0 | $0 | $0 | $0 | $0 |
| Long-term Liabilities Principal Repayment | $0 | $0 | $0 | $0 | $0 |
| Purchase Other Current Assets | $0 | $0 | $0 | $0 | $0 |
| Purchase Long-term Assets | $0 | $0 | $0 | $0 | $0 |
| Dividends | $0 | $0 | $0 | $0 | $0 |
| Subtotal Cash Spent | $774,780 | $1,773,799 | $1,905,374 | $2,050,598 | $2,210,349 |
| Net Cash Flow | $455,311 | $617,429 | $724,353 | $841,288 | $969,562 |
| Cash Balance | $495,311 | $1,112,740 | $1,837,093 | $2,678,380 | $3,647,942 |
8.6 Projected Balance Sheet
The Projected Balance Sheet is quite solid. We do not project any real trouble meeting our debt obligations–as long as we can achieve our specific objectives.
| Pro Forma Balance Sheet | |||||
| Year 1 | Year 2 | Year 3 | Year 4 | Year 5 | |
| Assets | |||||
| Current Assets | |||||
| Cash | $495,311 | $1,112,740 | $1,837,093 | $2,678,380 | $3,647,942 |
| Inventory | $14,331 | $26,756 | $29,427 | $32,364 | $35,591 |
| Other Current Assets | ($10,300) | ($22,300) | ($35,300) | ($49,300) | ($64,300) |
| Total Current Assets | $499,342 | $1,117,196 | $1,831,219 | $2,661,444 | $3,619,234 |
| Long-term Assets | |||||
| Long-term Assets | $0 | $0 | $0 | $0 | $0 |
| Accumulated Depreciation | $0 | $0 | $0 | $0 | $0 |
| Total Long-term Assets | $0 | $0 | $0 | $0 | $0 |
| Total Assets | $499,342 | $1,117,196 | $1,831,219 | $2,661,444 | $3,619,234 |
| Liabilities and Capital | Year 1 | Year 2 | Year 3 | Year 4 | Year 5 |
| Current Liabilities | |||||
| Accounts Payable | $98,320 | $114,831 | $123,464 | $133,942 | $145,495 |
| Current Borrowing | $0 | $0 | $0 | $0 | $0 |
| Other Current Liabilities | $69,045 | $203,718 | $351,835 | $514,734 | $693,880 |
| Subtotal Current Liabilities | $167,364 | $318,549 | $475,299 | $648,675 | $839,374 |
| Long-term Liabilities | $0 | $0 | $0 | $0 | $0 |
| Total Liabilities | $167,364 | $318,549 | $475,299 | $648,675 | $839,374 |
| Paid-in Capital | $379,309 | $379,309 | $379,309 | $379,309 | $379,309 |
| Retained Earnings | ($315,431) | ($47,332) | $419,338 | $976,611 | $1,633,459 |
| Earnings | $268,099 | $466,670 | $557,273 | $656,848 | $767,091 |
| Total Capital | $331,977 | $798,647 | $1,355,920 | $2,012,768 | $2,779,859 |
| Total Liabilities and Capital | $499,342 | $1,117,196 | $1,831,219 | $2,661,444 | $3,619,234 |
| Net Worth | $331,977 | $798,647 | $1,355,920 | $2,012,768 | $2,779,859 |
8.7 Business Ratios
The company’s projected business ratios are provided in the table below. The final column, Industry Profile, shows significant ratios for the Restaurant industry, as determined by the Standard Industry Classification (SIC) Index code 5812.0108, Italian Restaurants.
| Ratio Analysis | ||||||
| Year 1 | Year 2 | Year 3 | Year 4 | Year 5 | Industry Profile | |
| Sales Growth | 0.00% | 95.05% | 9.98% | 9.98% | 9.97% | 7.41% |
| Percent of Total Assets | ||||||
| Inventory | 2.87% | 2.39% | 1.61% | 1.22% | 0.98% | 3.70% |
| Other Current Assets | -2.06% | -2.00% | -1.93% | -1.85% | -1.78% | 33.73% |
| Total Current Assets | 100.00% | 100.00% | 100.00% | 100.00% | 100.00% | 41.73% |
| Long-term Assets | 0.00% | 0.00% | 0.00% | 0.00% | 0.00% | 58.27% |
| Total Assets | 100.00% | 100.00% | 100.00% | 100.00% | 100.00% | 100.00% |
| Current Liabilities | 33.52% | 28.51% | 25.96% | 24.37% | 23.19% | 17.03% |
| Long-term Liabilities | 0.00% | 0.00% | 0.00% | 0.00% | 0.00% | 22.99% |
| Total Liabilities | 33.52% | 28.51% | 25.96% | 24.37% | 23.19% | 40.02% |
| Net Worth | 66.48% | 71.49% | 74.04% | 75.63% | 76.81% | 59.98% |
| Percent of Sales | ||||||
| Sales | 100.00% | 100.00% | 100.00% | 100.00% | 100.00% | 100.00% |
| Gross Margin | 65.07% | 66.35% | 66.37% | 66.40% | 66.46% | 63.75% |
| Selling, General & Administrative Expenses | 41.78% | 45.56% | 43.79% | 42.21% | 40.76% | 42.43% |
| Advertising Expenses | 0.00% | 0.00% | 0.00% | 0.00% | 0.00% | 2.93% |
| Profit Before Interest and Taxes | 33.28% | 29.70% | 32.25% | 34.56% | 36.70% | 2.33% |
| Main Ratios | ||||||
| Current | 2.98 | 3.51 | 3.85 | 4.10 | 4.31 | 1.31 |
| Quick | 2.90 | 3.42 | 3.79 | 4.05 | 4.27 | 0.84 |
| Total Debt to Total Assets | 33.52% | 28.51% | 25.96% | 24.37% | 23.19% | 49.91% |
| Pre-tax Return on Net Worth | 115.37% | 83.48% | 58.71% | 46.62% | 39.42% | 5.87% |
| Pre-tax Return on Assets | 76.70% | 59.67% | 43.47% | 35.26% | 30.28% | 11.73% |
| Additional Ratios | Year 1 | Year 2 | Year 3 | Year 4 | Year 5 | |
| Net Profit Margin | 23.30% | 20.79% | 22.57% | 24.19% | 25.69% | n.a |
| Return on Equity | 80.76% | 58.43% | 41.10% | 32.63% | 27.59% | n.a |
| Activity Ratios | ||||||
| Inventory Turnover | 19.19 | 34.09 | 27.42 | 27.42 | 27.42 | n.a |
| Accounts Payable Turnover | 6.80 | 12.17 | 12.17 | 12.17 | 12.17 | n.a |
| Payment Days | 27 | 28 | 29 | 29 | 29 | n.a |
| Total Asset Turnover | 2.30 | 2.01 | 1.35 | 1.02 | 0.82 | n.a |
| Debt Ratios | ||||||
| Debt to Net Worth | 0.50 | 0.40 | 0.35 | 0.32 | 0.30 | n.a |
| Current Liab. to Liab. | 1.00 | 1.00 | 1.00 | 1.00 | 1.00 | n.a |
| Liquidity Ratios | ||||||
| Net Working Capital | $331,977 | $798,647 | $1,355,920 | $2,012,768 | $2,779,859 | n.a |
| Interest Coverage | 0.00 | 0.00 | 0.00 | 0.00 | 0.00 | n.a |
| Additional Ratios | ||||||
| Assets to Sales | 0.43 | 0.50 | 0.74 | 0.98 | 1.21 | n.a |
| Current Debt/Total Assets | 34% | 29% | 26% | 24% | 23% | n.a |
| Acid Test | 2.90 | 3.42 | 3.79 | 4.05 | 4.27 | n.a |
| Sales/Net Worth | 3.47 | 2.81 | 1.82 | 1.35 | 1.07 | n.a |
| Dividend Payout | 0.00 | 0.00 | 0.00 | 0.00 | 0.00 | n.a |
Appendix
| Sales Forecast | |||||||||||||
| Month 1 | Month 2 | Month 3 | Month 4 | Month 5 | Month 6 | Month 7 | Month 8 | Month 9 | Month 10 | Month 11 | Month 12 | ||
| Unit Sales | |||||||||||||
| Lunch Sales | 0% | 0 | 0 | 0 | 0 | 0 | 600 | 5,850 | 5,850 | 5,850 | 5,850 | 5,850 | 5,850 |
| Dinner Sales | 0% | 0 | 0 | 0 | 0 | 0 | 0 | 5,850 | 5,850 | 3,900 | 3,900 | 3,900 | 3,900 |
| Gift Shop Item Sales | 0% | 0 | 0 | 0 | 0 | 0 | 0 | 180 | 180 | 180 | 180 | 180 | 180 |
| Web Shop Sales | 0% | 0 | 0 | 0 | 0 | 0 | 6 | 20 | 25 | 25 | 25 | 25 | 25 |
| Catering Sales | 0% | 0 | 0 | 0 | 0 | 0 | 0 | 1 | 1 | 1 | 1 | 1 | 1 |
| Liquor Sales | 0% | 0 | 0 | 0 | 0 | 0 | 0 | 2,330 | 2,330 | 1,940 | 1,940 | 1,940 | 1,940 |
| Wine Bottle Sales | 0% | 0 | 0 | 0 | 0 | 0 | 0 | 240 | 240 | 240 | 240 | 240 | 240 |
| Wine by the Glass Sales | 0% | 0 | 0 | 0 | 0 | 0 | 0 | 2,050 | 2,050 | 1,450 | 1,450 | 1,450 | 1,450 |
| Beer Sales | 0% | 0 | 0 | 0 | 0 | 0 | 0 | 2,770 | 2,770 | 2,380 | 2,380 | 2,380 | 2,380 |
| Chef’s Table in the Vault Sales | 0% | 0 | 0 | 0 | 0 | 0 | 0 | 15 | 15 | 15 | 15 | 15 | 15 |
| Total Unit Sales | 0 | 0 | 0 | 0 | 0 | 606 | 19,306 | 19,311 | 15,981 | 15,981 | 15,981 | 15,981 | |
| Unit Prices | Month 1 | Month 2 | Month 3 | Month 4 | Month 5 | Month 6 | Month 7 | Month 8 | Month 9 | Month 10 | Month 11 | Month 12 | |
| Lunch Sales | $10.50 | $10.50 | $10.50 | $10.50 | $10.50 | $10.50 | $10.50 | $10.50 | $10.50 | $10.50 | $10.50 | $10.50 | |
| Dinner Sales | $20.00 | $20.00 | $20.00 | $20.00 | $20.00 | $20.00 | $20.00 | $20.00 | $20.00 | $20.00 | $20.00 | $20.00 | |
| Gift Shop Item Sales | $6.00 | $6.00 | $6.00 | $6.00 | $6.00 | $6.00 | $6.00 | $6.00 | $6.00 | $6.00 | $6.00 | $6.00 | |
| Web Shop Sales | $6.00 | $6.00 | $6.00 | $6.00 | $6.00 | $6.00 | $6.00 | $6.00 | $6.00 | $6.00 | $6.00 | $6.00 | |
| Catering Sales | $2,000.00 | $2,000.00 | $2,000.00 | $2,000.00 | $2,000.00 | $2,000.00 | $2,000.00 | $2,000.00 | $2,000.00 | $2,000.00 | $2,000.00 | $2,000.00 | |
| Liquor Sales | $4.50 | $4.50 | $4.50 | $4.50 | $4.50 | $4.50 | $4.50 | $4.50 | $4.50 | $4.50 | $4.50 | $4.50 | |
| Wine Bottle Sales | $16.00 | $16.00 | $16.00 | $16.00 | $16.00 | $16.00 | $16.00 | $16.00 | $16.00 | $16.00 | $16.00 | $16.00 | |
| Wine by the Glass Sales | $4.00 | $4.00 | $4.00 | $4.00 | $4.00 | $4.00 | $4.00 | $4.00 | $4.00 | $4.00 | $4.00 | $4.00 | |
| Beer Sales | $3.00 | $3.00 | $3.00 | $3.00 | $3.00 | $3.00 | $3.00 | $3.00 | $3.00 | $3.00 | $3.00 | $3.00 | |
| Chef’s Table in the Vault Sales | $520.00 | $520.00 | $520.00 | $520.00 | $520.00 | $520.00 | $520.00 | $520.00 | $520.00 | $520.00 | $520.00 | $520.00 | |
| Sales | |||||||||||||
| Lunch Sales | $0 | $0 | $0 | $0 | $0 | $6,300 | $61,425 | $61,425 | $61,425 | $61,425 | $61,425 | $61,425 | |
| Dinner Sales | $0 | $0 | $0 | $0 | $0 | $0 | $117,000 | $117,000 | $78,000 | $78,000 | $78,000 | $78,000 | |
| Gift Shop Item Sales | $0 | $0 | $0 | $0 | $0 | $0 | $1,080 | $1,080 | $1,080 | $1,080 | $1,080 | $1,080 | |
| Web Shop Sales | $0 | $0 | $0 | $0 | $0 | $36 | $120 | $150 | $150 | $150 | $150 | $150 | |
| Catering Sales | $0 | $0 | $0 | $0 | $0 | $0 | $2,000 | $2,000 | $2,000 | $2,000 | $2,000 | $2,000 | |
| Liquor Sales | $0 | $0 | $0 | $0 | $0 | $0 | $10,485 | $10,485 | $8,730 | $8,730 | $8,730 | $8,730 | |
| Wine Bottle Sales | $0 | $0 | $0 | $0 | $0 | $0 | $3,840 | $3,840 | $3,840 | $3,840 | $3,840 | $3,840 | |
| Wine by the Glass Sales | $0 | $0 | $0 | $0 | $0 | $0 | $8,200 | $8,200 | $5,800 | $5,800 | $5,800 | $5,800 | |
| Beer Sales | $0 | $0 | $0 | $0 | $0 | $0 | $8,310 | $8,310 | $7,140 | $7,140 | $7,140 | $7,140 | |
| Chef’s Table in the Vault Sales | $0 | $0 | $0 | $0 | $0 | $0 | $7,800 | $7,800 | $7,800 | $7,800 | $7,800 | $7,800 | |
| Total Sales | $0 | $0 | $0 | $0 | $0 | $6,336 | $220,260 | $220,290 | $175,965 | $175,965 | $175,965 | $175,965 | |
| Direct Unit Costs | Month 1 | Month 2 | Month 3 | Month 4 | Month 5 | Month 6 | Month 7 | Month 8 | Month 9 | Month 10 | Month 11 | Month 12 | |
| Lunch Sales | 32.00% | $3.36 | $3.36 | $3.36 | $3.36 | $3.36 | $3.36 | $3.36 | $3.36 | $3.36 | $3.36 | $3.36 | $3.36 |
| Dinner Sales | 33.00% | $6.60 | $6.60 | $6.60 | $6.60 | $6.60 | $6.60 | $6.60 | $6.60 | $6.60 | $6.60 | $6.60 | $6.60 |
| Gift Shop Item Sales | 48.00% | $1.92 | $1.92 | $1.92 | $1.92 | $1.92 | $1.92 | $1.92 | $1.92 | $1.92 | $1.92 | $1.92 | $1.92 |
| Web Shop Sales | 45.00% | $1.92 | $1.92 | $1.92 | $1.92 | $1.92 | $1.92 | $1.92 | $1.92 | $1.92 | $1.92 | $1.92 | $1.92 |
| Catering Sales | 34.00% | $640.00 | $640.00 | $640.00 | $640.00 | $640.00 | $640.00 | $640.00 | $640.00 | $640.00 | $640.00 | $640.00 | $640.00 |
| Liquor Sales | 20.00% | $1.44 | $1.44 | $1.44 | $1.44 | $1.44 | $1.44 | $1.44 | $1.44 | $1.44 | $1.44 | $1.44 | $1.44 |
| Wine Bottle Sales | 30.00% | $5.12 | $5.12 | $5.12 | $5.12 | $5.12 | $5.12 | $5.12 | $5.12 | $5.12 | $5.12 | $5.12 | $5.12 |
| Wine by the Glass Sales | 20.00% | $1.28 | $1.28 | $1.28 | $1.28 | $1.28 | $1.28 | $1.28 | $1.28 | $1.28 | $1.28 | $1.28 | $1.28 |
| Beer Sales | 20.00% | $0.96 | $0.96 | $0.96 | $0.96 | $0.96 | $0.96 | $0.96 | $0.96 | $0.96 | $0.96 | $0.96 | $0.96 |
| Chef’s Table in the Vault Sales | 35.00% | $182.00 | $182.00 | $182.00 | $182.00 | $182.00 | $182.00 | $182.00 | $182.00 | $182.00 | $182.00 | $182.00 | $182.00 |
| Direct Cost of Sales | |||||||||||||
| Lunch Sales | $0 | $0 | $0 | $0 | $0 | $2,016 | $19,656 | $19,656 | $19,656 | $19,656 | $19,656 | $19,656 | |
| Dinner Sales | $0 | $0 | $0 | $0 | $0 | $0 | $38,610 | $38,610 | $25,740 | $25,740 | $25,740 | $25,740 | |
| Gift Shop Item Sales | $0 | $0 | $0 | $0 | $0 | $0 | $346 | $346 | $346 | $346 | $346 | $346 | |
| Web Shop Sales | $0 | $0 | $0 | $0 | $0 | $12 | $38 | $48 | $48 | $48 | $48 | $48 | |
| Catering Sales | $0 | $0 | $0 | $0 | $0 | $0 | $640 | $640 | $640 | $640 | $640 | $640 | |
| Liquor Sales | $0 | $0 | $0 | $0 | $0 | $0 | $3,355 | $3,355 | $2,794 | $2,794 | $2,794 | $2,794 | |
| Wine Bottle Sales | $0 | $0 | $0 | $0 | $0 | $0 | $1,229 | $1,229 | $1,229 | $1,229 | $1,229 | $1,229 | |
| Wine by the Glass Sales | $0 | $0 | $0 | $0 | $0 | $0 | $2,624 | $2,624 | $1,856 | $1,856 | $1,856 | $1,856 | |
| Beer Sales | $0 | $0 | $0 | $0 | $0 | $0 | $2,659 | $2,659 | $2,285 | $2,285 | $2,285 | $2,285 | |
| Chef’s Table in the Vault Sales | $0 | $0 | $0 | $0 | $0 | $0 | $2,730 | $2,730 | $2,730 | $2,730 | $2,730 | $2,730 | |
| Subtotal Direct Cost of Sales | $0 | $0 | $0 | $0 | $0 | $2,028 | $71,887 | $71,897 | $57,323 | $57,323 | $57,323 | $57,323 | |
| Personnel Plan | |||||||||||||
| Month 1 | Month 2 | Month 3 | Month 4 | Month 5 | Month 6 | Month 7 | Month 8 | Month 9 | Month 10 | Month 11 | Month 12 | ||
| Manager Day | 0% | $0 | $0 | $0 | $0 | $0 | $0 | $4,000 | $4,000 | $4,000 | $4,000 | $4,000 | $4,000 |
| Manager Night | 0% | $0 | $0 | $0 | $0 | $0 | $0 | $3,000 | $3,000 | $3,000 | $3,000 | $3,000 | $3,000 |
| Manager Lounge/Bar | 0% | $0 | $0 | $0 | $0 | $0 | $0 | $3,000 | $3,000 | $3,000 | $3,000 | $3,000 | $3,000 |
| Wait Staff day & night – 16 x 40 hrs x 4.00 p/hr | 0% | $0 | $0 | $0 | $0 | $0 | $1,280 | $2,560 | $2,560 | $2,560 | $2,560 | $2,560 | $2,560 |
| Dishwasher – 2 x 40 hrs x 7.00 p/hr | 0% | $0 | $0 | $0 | $0 | $0 | $280 | $2,240 | $2,240 | $2,240 | $2,240 | $2,240 | $2,240 |
| Cooks – 2 day & 3 night = 7 x 40 hrs x 10.00 p/hr | 0% | $0 | $0 | $0 | $0 | $0 | $2,800 | $11,200 | $11,200 | $11,200 | $11,200 | $11,200 | $11,200 |
| Bartenders – 4 flex x 40 hrs x 2.50 p/hr | 0% | $0 | $0 | $0 | $0 | $0 | $400 | $1,600 | $1,600 | $1,600 | $1,600 | $1,600 | $1,600 |
| Executive Chef | 0% | $0 | $0 | $0 | $0 | $0 | $4,000 | $5,000 | $5,000 | $5,000 | $5,000 | $5,000 | $5,000 |
| Total People | 0 | 0 | 0 | 0 | 0 | 0 | 0 | 0 | 0 | 0 | 0 | 0 | |
| Total Payroll | $0 | $0 | $0 | $0 | $0 | $8,760 | $32,600 | $32,600 | $32,600 | $32,600 | $32,600 | $32,600 | |
| Pro Forma Profit and Loss | |||||||||||||
| Month 1 | Month 2 | Month 3 | Month 4 | Month 5 | Month 6 | Month 7 | Month 8 | Month 9 | Month 10 | Month 11 | Month 12 | ||
| Sales | $0 | $0 | $0 | $0 | $0 | $6,336 | $220,260 | $220,290 | $175,965 | $175,965 | $175,965 | $175,965 | |
| Direct Cost of Sales | $0 | $0 | $0 | $0 | $0 | $2,028 | $71,887 | $71,897 | $57,323 | $57,323 | $57,323 | $57,323 | |
| Staff Meals | $0 | $0 | $0 | $0 | $0 | $400 | $400 | $400 | $400 | $400 | $400 | $400 | |
| Other Costs of Goods/DESCOMM/Bank | $0 | $0 | $0 | $0 | $0 | $0 | $5,000 | $5,000 | $3,500 | $3,500 | $3,500 | $3,500 | |
| Total Cost of Sales | $0 | $0 | $0 | $0 | $0 | $2,428 | $77,287 | $77,297 | $61,223 | $61,223 | $61,223 | $61,223 | |
| Gross Margin | $0 | $0 | $0 | $0 | $0 | $3,908 | $142,973 | $142,993 | $114,742 | $114,742 | $114,742 | $114,742 | |
| Gross Margin % | 0.00% | 0.00% | 0.00% | 0.00% | 0.00% | 61.69% | 64.91% | 64.91% | 65.21% | 65.21% | 65.21% | 65.21% | |
| Expenses | |||||||||||||
| Payroll | $0 | $0 | $0 | $0 | $0 | $8,760 | $32,600 | $32,600 | $32,600 | $32,600 | $32,600 | $32,600 | |
| Marketing/Promotion | $0 | $0 | $0 | $0 | $0 | $10,000 | $10,000 | $10,000 | $5,000 | $5,000 | $5,000 | $5,000 | |
| Depreciation | $0 | $0 | $0 | $0 | $0 | $0 | $0 | $0 | $0 | $0 | $0 | $0 | |
| Employee Healthcare | $0 | $0 | $0 | $0 | $0 | $3,000 | $3,000 | $3,000 | $3,000 | $3,000 | $3,000 | $3,000 | |
| Rent | $0 | $0 | $0 | $0 | $0 | $0 | $1,500 | $2,000 | $2,500 | $3,000 | $3,500 | $4,000 | |
| Utilities and Security Services | $0 | $0 | $0 | $500 | $1,000 | $3,600 | $3,600 | $3,600 | $2,600 | $2,600 | $2,600 | $2,600 | |
| Ceramic, Glass and Silver Upkeep | $0 | $0 | $0 | $0 | $0 | $0 | $0 | $200 | $200 | $200 | $200 | $200 | |
| Accounting Fees | $0 | $0 | $0 | $0 | $0 | $0 | $400 | $400 | $400 | $400 | $400 | $500 | |
| Manager Comps & Grease Handouts | $0 | $0 | $0 | $0 | $0 | $0 | $5,000 | $2,500 | $2,500 | $2,500 | $2,500 | $2,500 | |
| Dues and Subscriptions | $0 | $0 | $0 | $0 | $0 | $0 | $0 | $0 | $0 | $0 | $600 | $0 | |
| Legal Expenses | $0 | $0 | $0 | $0 | $0 | $0 | $0 | $0 | $0 | $0 | $0 | $0 | |
| Flowers | $0 | $0 | $0 | $0 | $0 | $0 | $400 | $400 | $400 | $400 | $400 | $400 | |
| Travel Expense | $0 | $0 | $0 | $0 | $0 | $0 | $0 | $0 | $0 | $0 | $0 | $0 | |
| Exterminating | $0 | $0 | $0 | $0 | $0 | $0 | $25 | $25 | $25 | $25 | $25 | $25 | |
| Fines and Penalties | $0 | $0 | $0 | $0 | $0 | $0 | $0 | $0 | $0 | $0 | $0 | $100 | |
| Payroll Processing | $0 | $0 | $0 | $0 | $190 | $60 | $60 | $60 | $60 | $60 | $60 | $60 | |
| Insurance, Licensure & RE Taxes | $0 | $0 | $0 | $0 | $0 | $700 | $700 | $700 | $700 | $700 | $700 | $700 | |
| Payroll Taxes | 15% | $0 | $0 | $0 | $0 | $0 | $0 | $0 | $0 | $0 | $0 | $0 | $0 |
| Maintenance Costs/Repairs | $0 | $0 | $0 | $0 | $0 | $0 | $2,000 | $2,000 | $2,000 | $2,000 | $2,000 | $2,000 | |
| Linen and Dry Cleaning | $0 | $0 | $0 | $0 | $0 | $175 | $175 | $175 | $150 | $150 | $150 | $150 | |
| Computer Upkeep/Upgrade | $0 | $0 | $0 | $0 | $0 | $0 | $0 | $0 | $0 | $0 | $0 | $0 | |
| Dish and Cleaning Supplies | $0 | $0 | $0 | $0 | $0 | $0 | $400 | $400 | $400 | $400 | $400 | $400 | |
| Office Products Upkeep | 15% | $0 | $0 | $0 | $0 | $0 | $0 | $200 | $200 | $200 | $200 | $200 | $200 |
| Paper Product Deliveries | $0 | $0 | $0 | $0 | $0 | $0 | $800 | $800 | $800 | $800 | $800 | $800 | |
| Total Operating Expenses | $0 | $0 | $0 | $500 | $1,190 | $26,295 | $60,860 | $59,060 | $53,535 | $54,035 | $55,135 | $55,235 | |
| Profit Before Interest and Taxes | $0 | $0 | $0 | ($500) | ($1,190) | ($22,387) | $82,113 | $83,933 | $61,207 | $60,707 | $59,607 | $59,507 | |
| EBITDA | $0 | $0 | $0 | ($500) | ($1,190) | ($22,387) | $82,113 | $83,933 | $61,207 | $60,707 | $59,607 | $59,507 | |
| Interest Expense | $0 | $0 | $0 | $0 | $0 | $0 | $0 | $0 | $0 | $0 | $0 | $0 | |
| Taxes Incurred | $0 | $0 | $0 | ($150) | ($357) | ($6,716) | $24,634 | $25,180 | $18,362 | $18,212 | $17,882 | $17,852 | |
| Net Profit | $0 | $0 | $0 | ($350) | ($833) | ($15,671) | $57,479 | $58,753 | $42,845 | $42,495 | $41,725 | $41,655 | |
| Net Profit/Sales | 0.00% | 0.00% | 0.00% | 0.00% | 0.00% | -247.33% | 26.10% | 26.67% | 24.35% | 24.15% | 23.71% | 23.67% | |
| Pro Forma Cash Flow | |||||||||||||
| Month 1 | Month 2 | Month 3 | Month 4 | Month 5 | Month 6 | Month 7 | Month 8 | Month 9 | Month 10 | Month 11 | Month 12 | ||
| Cash Received | |||||||||||||
| Cash from Operations | |||||||||||||
| Cash Sales | $0 | $0 | $0 | $0 | $0 | $6,336 | $220,260 | $220,290 | $175,965 | $175,965 | $175,965 | $175,965 | |
| Subtotal Cash from Operations | $0 | $0 | $0 | $0 | $0 | $6,336 | $220,260 | $220,290 | $175,965 | $175,965 | $175,965 | $175,965 | |
| Additional Cash Received | |||||||||||||
| Sales Tax, VAT, HST/GST Received | 6.00% | $0 | $0 | $0 | $0 | $0 | $380 | $13,216 | $13,217 | $10,558 | $10,558 | $10,558 | $10,558 |
| New Current Borrowing | $0 | $0 | $0 | $0 | $0 | $0 | $0 | $0 | $0 | $0 | $0 | $0 | |
| New Other Liabilities (interest-free) | $0 | $0 | $0 | $0 | $0 | $0 | $0 | $0 | $0 | $0 | $0 | $0 | |
| New Long-term Liabilities | $0 | $0 | $0 | $0 | $0 | $0 | $0 | $0 | $0 | $0 | $0 | $0 | |
| Sales of Other Current Assets | $0 | $0 | $0 | $1,000 | $1,000 | $1,000 | $1,000 | $1,100 | $1,200 | $1,400 | $1,300 | $1,300 | |
| Sales of Long-term Assets | $0 | $0 | $0 | $0 | $0 | $0 | $0 | $0 | $0 | $0 | $0 | $0 | |
| New Investment Received | $0 | $0 | $0 | $0 | $0 | $0 | $0 | $0 | $0 | $0 | $0 | $0 | |
| Subtotal Cash Received | $0 | $0 | $0 | $1,000 | $1,000 | $7,716 | $234,476 | $234,607 | $187,723 | $187,923 | $187,823 | $187,823 | |
| Expenditures | Month 1 | Month 2 | Month 3 | Month 4 | Month 5 | Month 6 | Month 7 | Month 8 | Month 9 | Month 10 | Month 11 | Month 12 | |
| Expenditures from Operations | |||||||||||||
| Cash Spending | $0 | $0 | $0 | $0 | $0 | $8,760 | $32,600 | $32,600 | $32,600 | $32,600 | $32,600 | $32,600 | |
| Bill Payments | $0 | $0 | $0 | $12 | $366 | $1,179 | $15,055 | $126,390 | $127,870 | $97,010 | $100,896 | $101,642 | |
| Subtotal Spent on Operations | $0 | $0 | $0 | $12 | $366 | $9,939 | $47,655 | $158,990 | $160,470 | $129,610 | $133,496 | $134,242 | |
| Additional Cash Spent | |||||||||||||
| Sales Tax, VAT, HST/GST Paid Out | $0 | $0 | $0 | $0 | $0 | $0 | $0 | $0 | $0 | $0 | $0 | $0 | |
| Principal Repayment of Current Borrowing | $0 | $0 | $0 | $0 | $0 | $0 | $0 | $0 | $0 | $0 | $0 | $0 | |
| Other Liabilities Principal Repayment | $0 | $0 | $0 | $0 | $0 | $0 | $0 | $0 | $0 | $0 | $0 | $0 | |
| Long-term Liabilities Principal Repayment | $0 | $0 | $0 | $0 | $0 | $0 | $0 | $0 | $0 | $0 | $0 | $0 | |
| Purchase Other Current Assets | $0 | $0 | $0 | $0 | $0 | $0 | $0 | $0 | $0 | $0 | $0 | $0 | |
| Purchase Long-term Assets | $0 | $0 | $0 | $0 | $0 | $0 | $0 | $0 | $0 | $0 | $0 | $0 | |
| Dividends | $0 | $0 | $0 | $0 | $0 | $0 | $0 | $0 | $0 | $0 | $0 | $0 | |
| Subtotal Cash Spent | $0 | $0 | $0 | $12 | $366 | $9,939 | $47,655 | $158,990 | $160,470 | $129,610 | $133,496 | $134,242 | |
| Net Cash Flow | $0 | $0 | $0 | $988 | $634 | ($2,223) | $186,820 | $75,618 | $27,252 | $58,313 | $54,327 | $53,581 | |
| Cash Balance | $40,000 | $40,000 | $40,000 | $40,988 | $41,622 | $39,399 | $226,220 | $301,837 | $329,090 | $387,403 | $441,730 | $495,311 | |
| Pro Forma Balance Sheet | |||||||||||||
| Month 1 | Month 2 | Month 3 | Month 4 | Month 5 | Month 6 | Month 7 | Month 8 | Month 9 | Month 10 | Month 11 | Month 12 | ||
| Assets | Starting Balances | ||||||||||||
| Current Assets | |||||||||||||
| Cash | $40,000 | $40,000 | $40,000 | $40,000 | $40,988 | $41,622 | $39,399 | $226,220 | $301,837 | $329,090 | $387,403 | $441,730 | $495,311 |
| Inventory | $23,878 | $23,878 | $23,878 | $23,878 | $23,878 | $23,878 | $21,851 | $17,972 | $17,974 | $14,331 | $14,331 | $14,331 | $14,331 |
| Other Current Assets | $0 | $0 | $0 | $0 | ($1,000) | ($2,000) | ($3,000) | ($4,000) | ($5,100) | ($6,300) | ($7,700) | ($9,000) | ($10,300) |
| Total Current Assets | $63,878 | $63,878 | $63,878 | $63,878 | $63,867 | $63,501 | $58,250 | $240,191 | $314,711 | $337,120 | $394,034 | $447,061 | $499,342 |
| Long-term Assets | |||||||||||||
| Long-term Assets | $0 | $0 | $0 | $0 | $0 | $0 | $0 | $0 | $0 | $0 | $0 | $0 | $0 |
| Accumulated Depreciation | $0 | $0 | $0 | $0 | $0 | $0 | $0 | $0 | $0 | $0 | $0 | $0 | $0 |
| Total Long-term Assets | $0 | $0 | $0 | $0 | $0 | $0 | $0 | $0 | $0 | $0 | $0 | $0 | $0 |
| Total Assets | $63,878 | $63,878 | $63,878 | $63,878 | $63,867 | $63,501 | $58,250 | $240,191 | $314,711 | $337,120 | $394,034 | $447,061 | $499,342 |
| Liabilities and Capital | Month 1 | Month 2 | Month 3 | Month 4 | Month 5 | Month 6 | Month 7 | Month 8 | Month 9 | Month 10 | Month 11 | Month 12 | |
| Current Liabilities | |||||||||||||
| Accounts Payable | $0 | $0 | $0 | $0 | $338 | $805 | $10,845 | $122,092 | $124,641 | $93,647 | $97,508 | $98,252 | $98,320 |
| Current Borrowing | $0 | $0 | $0 | $0 | $0 | $0 | $0 | $0 | $0 | $0 | $0 | $0 | $0 |
| Other Current Liabilities | $0 | $0 | $0 | $0 | $0 | $0 | $380 | $13,596 | $26,813 | $37,371 | $47,929 | $58,487 | $69,045 |
| Subtotal Current Liabilities | $0 | $0 | $0 | $0 | $338 | $805 | $11,225 | $135,688 | $151,454 | $131,018 | $145,437 | $156,739 | $167,364 |
| Long-term Liabilities | $0 | $0 | $0 | $0 | $0 | $0 | $0 | $0 | $0 | $0 | $0 | $0 | $0 |
| Total Liabilities | $0 | $0 | $0 | $0 | $338 | $805 | $11,225 | $135,688 | $151,454 | $131,018 | $145,437 | $156,739 | $167,364 |
| Paid-in Capital | $379,309 | $379,309 | $379,309 | $379,309 | $379,309 | $379,309 | $379,309 | $379,309 | $379,309 | $379,309 | $379,309 | $379,309 | $379,309 |
| Retained Earnings | ($315,431) | ($315,431) | ($315,431) | ($315,431) | ($315,431) | ($315,431) | ($315,431) | ($315,431) | ($315,431) | ($315,431) | ($315,431) | ($315,431) | ($315,431) |
| Earnings | $0 | $0 | $0 | $0 | ($350) | ($1,183) | ($16,854) | $40,625 | $99,379 | $142,224 | $184,719 | $226,444 | $268,099 |
| Total Capital | $63,878 | $63,878 | $63,878 | $63,878 | $63,528 | $62,695 | $47,025 | $104,504 | $163,257 | $206,102 | $248,597 | $290,322 | $331,977 |
| Total Liabilities and Capital | $63,878 | $63,878 | $63,878 | $63,878 | $63,867 | $63,501 | $58,250 | $240,191 | $314,711 | $337,120 | $394,034 | $447,061 | $499,342 |
| Net Worth | $63,878 | $63,878 | $63,878 | $63,878 | $63,528 | $62,695 | $47,025 | $104,504 | $163,257 | $206,102 | $248,597 | $290,322 | $331,977 |


