
Edgar Risk Ventures, Ltd.
Executive Summary
Introduction
This probably needs a bit of an introduction–it is not your run-of-the-mill music business plan. It is somewhat unconventional, a bit more ‘flashy’ than most, you say…but, you know what? I bet you read it. It’s slightly different, a bit innovative and certainly creative. You see, we had a difficult time conforming to the formal approach, and every so often, rather than slightly breaking one of the rules of ‘business plan etiquette,’ we either mangled it a bit or obliterated it altogether and made up our own. It works for us–we wonder if it will work for you, too.
Every little now and then I wonder how connected we all are as individual beings living in a collective world. I wonder how much we really consider each other. Is life just a separate journey for each of us? Can I make your journey easier? Can you do the same for me? Is it safer to care for only yourself? Funny thing is, even if we choose a solitary path, the ripples from just our thoughts, let alone our actions, are enough to touch someone or something else. We are not solitary souls adrift in a world of chaos, though we may feel that at times. We are dynamic, creative, expressive individuals constantly contributing to the components of life…and thus we create our world. We wanted our Business Plan to convey that, and we wanted you to know our intentions.
Every Little Now and Then…
…someone or something comes along that makes us sit up and pay attention. Something that touches us at a level much deeper than routine…something that whispers to the soul because it holds value, honesty and integrity. Pay attention. This may be that something.
Edgar Risk Ventures, Ltd., is formed as an entertainment production, distribution and performance company specializing in the utilization and maximization of current entertainment business opportunities offered through digital satellite music services, the worldwide reach of the Internet, as well as within the middle marketplace of the music industry and consumer venue.
That being said, let’s explain that the balance of this music business plan may not follow all those revered rules of professional etiquette proffered by the ‘experts.’ We are a rather innovative and creative bunch, not given easily to the molding of the masses into narrow visions of ‘should’ and ‘have to.’ On the other hand, we have been around a while and thus gained insight and wisdom lending value to learned lessons and ‘right’ paths. There is immeasurable worth and undeniable clarity that comes from a good Business Plan. Ours, we think, is a dandy but is not the expected ‘stuffy’ treatise. The proof, however, is whether it accurately describes, foretells and transmits the focus and objectives of the company itself. Time will tell, we assume, but perhaps you can judge for yourself if the following ‘rings true’ and holds significance for you.
Objectives
Please allow us a bit of creative license here to tell our story in the words that provide a comfortable format for us…
The Music and What To Do With It…
The sounds of our existence…the cadence of our lives…the melodies of our hearts–all represented, enveloped, molded and embodied in a myriad of musical expressions. Music touches every facet of our lives, giving us hope in moments of despair, ecstasy in moments of passion, victory in struggle and courage in conflict. No, we don’t plan to write, produce and perform the next great musical on Broadway. Yes, we do plan to provide some of the finest music you’ll find just about anywhere. You see, we’re not looking for stardom…most of the players involved with our company have already been there to some extent or another. We’re planning to provide the music you live by, love with, cry because of, laugh at and sing along with. We specialize in reality–you know, one real live someone reaching out to another real live someone…kind of Person to Person, if you know what we mean. There just are those special voices, those incredible songs, those amazing musicians, those undeniably charismatic entertainers who reach into our souls and make us sit up and take notice. One someone will fall under the spell of a country ballad, another will tap their foot to a bluegrass melody, someone else will be mouthing the words to a familiar pop tune, and yet another will zone into a Dixieland jazz piece. That’s the magic of music–it knows no boundaries…it erases them.
Our objective is, simply, to create the business entity that authors the activities of our amazingly gifted group of individuals to produce, distribute and perform musical offerings to be marketed through the digital satellite networks, Internet access and traditional avenues of production and distribution, as well as occasional live performances. We will do this in specific ways to achieve specific results, project by project.
1. By early Fall Year 1, Edgar Risk Ventures, Ltd., will be housed in its own fully-functional office with full Internet access, digital satellite licensing/access, and the integrated equipment/personnel infrastructure to meet its project needs.
2. By early Fall Year 1, Edgar Risk Ventures, Ltd., will be fully insured, bonded and indemnified to perform the myriad responsibilities involved with the production of music, the packaging for sale of that music and the occasional performance of music.
3. By early Fall Year1, Edgar Risk Ventures, Ltd., will have identified no less than four individual projects for production.
4. By the end of Year 1, Edgar Risk Ventures, Ltd., will have at least four projects in production or packaged and released into the realm of ‘air play’ and/or market access.
5. By mid-Year 2 and beyond, Edgar Risk Ventures, Ltd., will be receiving a return from at least six to nine completed projects ‘living’ in the music marketplace, whether they are through Internet distribution, digital satellite exposure, traditional music market or live performances.
6. By the end of Year 3, Edgar Risk Ventures, Ltd., will be receiving a return from a total of twelve new and all previous projects still ‘living’ in the music marketplace.
Keys to Success
1. The strategic organization of creative endeavors into project format, allowing each project to be individually financed, developed, maintained and tracked according to its unique requirements and objectives.
a. Provides the ‘umbrella security and licensing’ from Edgar Risk Ventures but allows each project to live out its own singular existence.
b. Each project becomes a viable revenue source for Edgar Risk Ventures, dependent upon its own success and market worthiness.
c. The multiple-project format allows a broad diversity of effort and application to maximize the potential inherent in each market through individual projects.
d. This format also dilutes the risk involved with each individual project for Edgar Risk Ventures as a result of the separate funding secured for each project.
2. Development of multiple avenues of visibility for Edgar Risk Ventures through strategic contacts, Internet presence, traditional advertising, digital satellite access and product development.
3. Strategic utilization of the unique pool of production and performance talent integral in the personnel makeup of Edgar Risk Ventures.
4. Excellence and commitment woven into every finished product and performance, thus creating the integrity Edgar Risk Ventures, Ltd., shall possess.

Mission
Edgar Risk Ventures, Ltd., offers individual artists the opportunity for recorded performance (CDs, tapes), market distribution, digital satellite air play, traditional air play, Internet marketing and exposure, and market return.
Edgar Risk Ventures, Ltd., offers consumers of the digital satellite market, the Internet e-commerce market, the live performance market and the recorded product market the opportunity to obtain high-quality, professionally performed, expertly produced, efficiently distributed music products of many genres including, but not limited to, country, bluegrass, pop, jazz and religious sectors.
Edgar Risk Ventures, Ltd., offers its production, distribution and performance projects through individual format plan to investors as a planned return-on-investment opportunity. Such projects ‘live’ as separate entities, but enjoy the umbrella security, strategic relationships, beneficial knowledge and proficient talent provided by the holding company, Edgar Risk Ventures. These projects ‘live’ as long as the project is viable and enduring.
Company Summary
What’cha Gonna Do…
Edgar Risk Ventures, Ltd. (ERV), is a newly-formed Limited Liability Company providing high-level expertise in the music and performance production industry. ERV is not interested in competing with the Warner Brothers and Columbia Records of the world. It has been created to fulfill the dreams and expectations of those talented people who desire to acquire a quality ‘finished product’ showcasing their talent, and to satisfy the demand for such entertainment performances, whether recorded or live, within the middle market of the music consumer industry. Edgar Risk Ventures has been created to explore the opportunities available worldwide to further the dissemination and propagation of high-quality, professional musical renderings of known and unknown artists for the enjoyment of audiences throughout the world.
Company Ownership
As a Limited Liability Company in the State of Nevada, ownership of Edgar Risk Ventures is identified as belonging to its managers. The ownership percentages for the managers of this company are:
- Robert Edgar: 52%
- Lee Edgar: 16%
- Michael Glazewski: 16%
- Leo Devilbiss: 16%
Start-up Summary
Total start-up expense comes to $18,500, of which $3,200 has been expended to date by Bob and Lee Edgar. Details of the total start-up requirements are shown in the tables below.

| Start-up Funding | |
| Start-up Expenses to Fund | $18,500 |
| Start-up Assets to Fund | $42,500 |
| Total Funding Required | $61,000 |
| Assets | |
| Non-cash Assets from Start-up | $4,500 |
| Cash Requirements from Start-up | $38,000 |
| Additional Cash Raised | $0 |
| Cash Balance on Starting Date | $38,000 |
| Total Assets | $42,500 |
| Liabilities and Capital | |
| Liabilities | |
| Current Borrowing | $4,000 |
| Long-term Liabilities | $10,000 |
| Accounts Payable (Outstanding Bills) | $1,000 |
| Other Current Liabilities (interest-free) | $2,000 |
| Total Liabilities | $17,000 |
| Capital | |
| Planned Investment | |
| Bob Edgar | $25,000 |
| Michael Glazewski | $12,000 |
| Leo Devilbiss | $7,000 |
| Additional Investment Requirement | $0 |
| Total Planned Investment | $44,000 |
| Loss at Start-up (Start-up Expenses) | ($18,500) |
| Total Capital | $25,500 |
| Total Capital and Liabilities | $42,500 |
| Total Funding | $61,000 |
| Start-up | |
| Requirements | |
| Start-up Expenses | |
| Legal | $3,000 |
| Publications/membership | $1,000 |
| Office equipment | $3,500 |
| Consultants | $0 |
| Insurance | $4,500 |
| Website development/hosting | $4,000 |
| Website Management | $0 |
| Expensed Equipment | $0 |
| Other | $2,500 |
| Total Start-up Expenses | $18,500 |
| Start-up Assets | |
| Cash Required | $38,000 |
| Other Current Assets | $0 |
| Long-term Assets | $4,500 |
| Total Assets | $42,500 |
| Total Requirements | $61,000 |
Company Locations and Facilities
Edgar Risk Ventures will seek appropriate office space in the Las Vegas/Henderson, Nevada metropolitan area. Las Vegas offers many benefits to the company:
- A close association with the entertainment industry.
- Competent and professional music production companies and studios.
- Competent, experienced and professional studio and stage musicians.
- Marketing and distribution avenues through particularly strong ties to West Coast companies, as well as to Nashville and the East Coast.
- A burgeoning group of Internet-related companies providing services in the fields of graphics, Web-hosting, Web-marketing, CD reproduction and software distribution.
- Piggyback opportunities with both performers and their associated production companies as they tour through Southern Nevada.
Services
The Goods and How to Get ‘Em…
Edgar Risk Ventures does not necessarily ‘produce’ products, but products become the ‘evidence’ of our services. When a performer or artist comes to us for packaging, the actual CD, digital satellite reproduction, music video, brochures, pictures, etc., can all be considered ‘products’–all are expansions and fulfillment of that individual artist’s ‘performance’ effort. It is difficult at best to foresee the products that may be utilized for each performer. A savvy production group (such as ours) will weigh the performance, charisma, audience acceptance, production grasp and overall marketability of each artist and incorporate only those peripheral ‘products’ that develop into viable components of the project. This requires good judgment, extensive experience, strong management ability, not to mention perhaps the most important and elusive capability…that of ‘reading’ the market. Edgar Risk Ventures encompasses individuals with separate and unique abilities lending themselves to this process. The overall excellence in this endeavor, however, rests in the comprehensive combined expertise of the principals of this company, with their backgrounds in the entertainment industry, business management, marketing, accounting, production, public relations and solid business application. These strengths point to an overall understanding of the marketability and viability of each ‘product’ considered.
Edgar Risk Ventures offers ‘services’ of varied structure and expandability:
- The complete ‘packaging’ of an artist–comprehensive individual tutoring, extensive rehearsal time, in-studio production work, arrangement and editing of recorded product, coordination of the manufacture and distribution of product, marketing of finished product, ongoing analysis of strategic placement and acceptance of product and performance, influential public relations efforts, follow-up and maximization of audience acceptability with additional strategies to further amplify recognition and revenue, and the coordination and management of live performances in correlation with the recorded product and market demand. Ultimately, the ‘rainbow’s end’ outcome of such a project would be the negotiation with and resultant contractual ‘sale’ or ‘lease’ of an artist/project to a major label recording company.
- A limited packaging of an artist to result in a specific outcome or product; e.g., a pre-determined number of CDs delivered to the artist per his/her desires (including, of course, all the above activities required to produce said CD). Such packaging may or may not include distribution, marketing and coordination of live performances in conjunction with the produced CD.
- The complete production and rendition of a desired performance or show including the appropriate above-mentioned activities to effect the client’s directive.
- Coordination and packaging of community dance projects with Edgar Risk Ventures ‘stable’ performers or contracted entertainers, including all of the above-mentioned activities as required.
- Contractual negotiation services on behalf of an artist with interested label and management companies.
- Individual consultant services for artists during rehearsal or studio recording sessions.
- Actual performances in various venues by Edgar Risk Ventures stable performers for a contracted price.
- Coordination of strategic ‘gratis’ appearances of artists for public relations and marketing purposes.
- The development, maintenance, funding coordination and undertaking of any worthwhile and promising project as identified.
Competitive Comparison
We happen to believe that there is no competition in the entertainment industry–only hard work, right marketing, skill in the delivery of a performance, strategic placement of a finished product, maximization of audience acceptability…and then, the final ingredient–the benevolence of the entertainment gods. Or, as Bob Edgar often says, “The audience is like a big pie. Somewhere in that pie are those who like what I do. All I have to do is satisfy them, and I can enjoy my piece of the pie. The only one I’m in competition with is myself.”
We, as a company, subscribe to this concept. It is not competition that creates an Elvis, or a Marty Robbins, or a Faith Hill. Not that one of us plans on becoming the next great star in the firmament. There does exist, however, the possibility that we may ‘discover’ that new star. What does create the new star is the sometimes intangible but undeniable synchronicity of the ‘right’ song sung by the ‘right’ artist with the ‘right’ combination of production, distribution and marketing to result in the audience’s recognition and acceptance of the ‘rightful’ reign of the newly-confirmed heir to fame.
We believe that those ‘right’ components can be applied to every project, thus resulting in a correlation of success and recognition within the parameters of that project. This does not mean we expect every project to produce a ‘star.’ It does mean that we commit ourselves to the excellence and integrity of every project. We expect that most of our clients will hope for the full realization of their entertainment aspirations. We respect and honor their dreams and will perform to the best of our abilities to assist them in their endeavor. Each client will receive exactly what is represented as deliverable. We shall not, however, promise or guarantee any individual’s fame or success. We leave that to the realm of those who deal in destiny.
We do believe that ‘competing’ in the entertainment industry is enhanced and amplified through the following actions, each of which is an integral part of our overall service to each client:
- Constant and mindful application of industry standards and state-of-the-art technologies. This requires the continuous, sometimes arduous, task of updating and educating oneself on industry developments and evolving techniques.
- The ongoing maintenance of strategic industry contacts and relationships to ensure a broad understanding of the market and the ability to penetrate and utilize the industry to our benefit.
- Strong and knowledgeable business management to maximize the potential and profitability of each project and its associated artist/product.
- Continuous application of accurate accountability of all project components to ensure as much as possible the successful completion of each project and the satisfaction of each client and investor.
Fulfillment
Service fulfillment will be provided by principals of Edgar Risk Ventures in coordination with the contributing contractors required to complete ‘products.’ Companies such as recording studios, CD manufacturers and replicators, distribution houses, licensing firms, performance venues, booking agents, traditional and online advertising groups, just to name a few, are regularly contracted to contribute to the finished ‘product’ of a project.
Market Analysis Summary
Where Will We Go From Here…
In today’s technological world, we find a challenging and ever-expanding marketplace for almost any product or service. Such is the case for the services and products of Edgar Risk Ventures. Through the worldwide reach of the Internet, innovative and resourceful companies can market their ‘wares’ around the world, literally. It may seem unlikely that someone in, say, South America would contact us to package and market them as an artist. Unlikely, perhaps, but certainly not impossible to do, or impossible that they would buy product from us. Our production clients will, based on our past experience, come from areas ‘closer to home,’ but, through the far-reaching aspects of Bob Edgar’s career, we have learned that contacts from anywhere in the world are certainly possible.
Market Segmentation
Most important in our marketing approach will be the utilization of the contact and relationship base in the entertainment industry already established by Bob Edgar. The initial projects already identified by Edgar Risk Ventures come from his contacts and influence.
Word-of-mouth advertising represents an important aspect, as well, with the quality of each project holding paramount value in the furtherance of our good reputation. Entertainers, by nature, are a conversant lot, and word-of-mouth advertising, although difficult to track and predict, can represent a major percentage of customer attraction.
Comprehensive utilization of the marketing opportunities offered through Internet usage will be the anchor for most of our marketing programs. The Edgar Risk Ventures website will be a focal point where anyone interested in our services may migrate for further information and contact. References to the website will be incorporated into all collateral marketing pieces and campaigns. Internet search engine placement using correct keywords and meta tags will be employed to attract a maximum number of visitors to our website. Regular evaluations of search engine placement activity will guide our continuing strategy.
Unlike marketing a specific brand of toothpaste where large numbers of purchases create cash flow and profitability, Edgar Risk Ventures believes that word-of-mouth advertising, combined with the effective utilization of our website and traditional marketing avenues, will create enough business to carry us well into our second year of operation and beyond. There are enough individual projects identified at present to easily occupy the first nine to twelve months of operation.
As we progress further into our future, we will focus on the strengths and factors that produced the most successful and rewarding projects and continue the incorporation of those factors into our day-to-day operations. Traditional advertising will be continuously employed, but predominantly will, as our experience has shown, serve mainly as a support and recognition tool, providing credibility but not necessarily bringing in the majority of our clients. We do believe that most of our clients will be word-of-mouth referrals or those who come to us via interest in our website as well as in our released product.

| Market Analysis | |||||||
| Year 1 | Year 2 | Year 3 | Year 4 | Year 5 | |||
| Potential Customers | Growth | CAGR | |||||
| Nationwide entertainers | 15% | 350,000 | 402,500 | 462,875 | 532,306 | 612,152 | 15.00% |
| Local and regional organizations | 5% | 12,350 | 12,968 | 13,616 | 14,297 | 15,012 | 5.00% |
| Total | 14.70% | 362,350 | 415,468 | 476,491 | 546,603 | 627,164 | 14.70% |
Target Market Segment Strategy
Successfully proffering your wares in the music industry is a delicate balance of offering a quality product and strategically placing that product where it can be seen and acquired. To a large extent the ‘big boys’ have the upper hand in reaching the masses. Unless you understand the audience and the idiosyncrasies inherent in that audience (and there are always idiosyncrasies), you may be one of those unfortunate many who spend large amounts of money appealing to the very people who could not care less about your project and its associated artist/product.
Not all of our projects will include a market component…most will. Each individual artist who employs the services of Edgar Risk Ventures brings their own audience segment with them. Artists inexperienced in music marketing usually cannot effectively recognize their own market. Identification of and the subsequent approach to that market will be an inherent element of each project we embrace. There are specific channels open in each individual genre, as well as the national and international opportunities available when warranted. Allow us to explain our approach and rationale in story form…
It Could (and does) Happen This Way…
Suppose that a musically gifted man, Earl Anthony (a completely made-up name), now in his early thirties and regularly playing in his own country band, hears a CD recently produced for his drummer’s brother by Edgar Risk Ventures. Earl, too, has been planning to record…just hasn’t quite put it together yet. He’s impressed with the quality of sound, the arranging, the packaging of the CD product, even though he’s not particularly impressed with his drummer’s brother as a musician. (Alas, entertainers are notoriously critical of each other.) The drummer mentions something about a website that he saw when his brother was in production with Edgar Risk Ventures and gives Earl the website address. Earl visits the site, several times, and finally decides to contact the company…just to see how they respond.
Edgar Risk Ventures receives the rather hesitant inquiry from Earl and responds promptly with both general information and polite questions designed to ‘open’ the path to more in-depth communication. Earl replies with answers to the questions, is enjoying the email camaraderie with someone in the ‘music business’ and eventually makes an initial telephone appointment to discuss a possible CD project of his own. Following this are a couple of lengthy sessions discussing Earl’s objectives, his aspirations, listening to home demos of his band and observing Earl as he performs live on stage. Edgar Risk Ventures presents Earl with a proposal for a CD project. Earl accepts…and life is breathed into a brand new project by three individual investors who have previously participated in ERV projects and enjoyed both the process as well as their return on investment. Earl, himself, becomes the fourth investor, having saved a modest sum for this venture.
Earl is groomed for studio production work by Bob Edgar, who takes Earl under his wing, diplomatically offering professional guidance as well as encouragement. Earl is a good studio candidate, applying himself conscientiously and creatively. Bob Edgar is gradually impressed with Earl’s artistry and vocal renditions during the first portion of the recording sessions–he passes along his views to the rest of the principals at ERV. ERV now begins to tentatively eye further avenues of market appeal pending the completion of the CD.
During the actual production period, arrangements are put in place for CD replication, packaging, distribution and marketing. Inclusion of the Earl Anthony CD into the Edgar Risk Ventures website is planned and the webmaster begins appropriate arrangements to correlate the website announcements and CD ordering capability with the release. The initial market thrust, as requested by Earl, is to the local area surrounding his home town. This is a ‘safe’ market for him, but ERV believes that a regional campaign will be more appropriate based on their observation of audience acceptance of Earl’s entertainment efforts. ERV now begins to think that inclusion of a digital satellite release would offer a ‘read’ on this artist’s recorded charisma and appeal, being an economical yet reliable path for this validation. The regional campaign was incorporated into the project from the beginning. The digital satellite component is now included, as well, with ERV footing the bill for these costs. They are minimal compared to the value of the market test they provide. Based on the continuing integrity of the recorded product as well as Earl’s stage presence, ERV begins to consider additional marketing avenues. Meanwhile, marketing pieces to accompany the CD throughout the targeted region are prepared, radio contacts are made and appropriate arrangements and licensing are acquired for both the regional and satellite releases.
Close monitoring of satellite charts as well as radio audience receptivity are maintained by Edgar Risk Ventures as an individual cut (song) from the CD is released into the public sector. Within six days, Earl Anthony hits the satellite charts and shows some upward movement. ERV begins tentative plans for immediate shipment of additional quantities of CDs to regional music stores. The ongoing analysis of the digital satellite charts indicates continued and growing acceptance of Earl Anthony as a vocalist. A major market for his product appears to be forming in the Netherlands, where country music is enjoying a ‘hot’ market. Preliminary inquiries are made to radio stations throughout the Netherlands followed by email marketing pieces. Orders begin to come into the ERV website, as well as order requests from stores in the target region. Another cut from the CD is chosen for release (to follow within eight to ten weeks from the initial release) and preparations begin to support its marketability. This component is an adjunct to the original project, will require additional funding from the original investors, but will supplement revenues arriving from the initial marketing of the product. This is how a project grows, matures and endures in the music marketplace.
Edgar Risk Ventures begins an assessment of venues available in the regional area for a promoted performance by Earl Anthony. This component, also, was not incorporated into the original project, but is now added due to the apparent receptivity of the market audience. One of the initial project investors (an avid country music fan) agrees to underwrite the costs associated with this decision for a percentage of profits from this component. A suitable venue is contracted and preparations begin for a promoted performance by Earl Anthony and his band in a location central to the regional area being marketed. A promo team is sent to the region to prepare the market, place the ads, coordinate sponsorship through the local radio station, arrange for partnering of concessions, etc.
While maintaining the forward thrust of Earl Anthony’s maiden voyage into the commercial market, ERV closely monitors his digital satellite charting. This tool is key to understanding the ‘reach’ of this particular artist. It is also a reliable barometer for consideration of a national release in the United States. Although numbers are not always identical, popularity reflected through the satellite charts more often than not mirror the popularity potential for the same artist through a traditional national release in the U.S. This method of ‘trying the market’ is much more economical than just jumping into a national release…and tied together with the results of the regional target market, provides substantial validation for increased exposure. Tentative plans are begun by ERV to prepare a new project proposal for Earl Anthony for a multi-level project (release of several cuts from a new CD through various venues).
The promoted performance is carried through, following three weeks of a concentrated and strategic advertising campaign. On the initial performance night, the venue, a community college theater capable of seating 900, is filled to capacity. ERV has learned, through its reach into this market, that thousands of CDs have been sold in the last seven weeks in the regional area surrounding the venue and the local radio stations have been reporting constant demand for Earl Anthony airplay. ERV therefore arranged for three performances by Earl over a three-day span. Earl and ERV (not to mention the gratified investor) are encouraged to see the venue fill each night. The promoted performance component of the project has proven successful.
A U.S. national release is incorporated into the multi-level project being prepared for Earl Anthony. Project investors are contacted and another level and round of market approach is planned. ERV, primarily through Bob Edgar, begins a ‘conversational campaign’ for Earl through production and recording contacts in the industry. The potential for attracting a major label with this artist is apparent. All participants would stand to benefit from such an outcome, which becomes more possible every day.
Well, in a nutshell, utilizing a ‘pretend’ artist and project, we have taken you through the market utilization and potentials inherent in the production/marketing of a music artist and product. Each project carries its own variables. The capable, prudent and informed approach, which ERV will provide to each client and project, will maximize the potentials and increase the profitability factors collectively.
Strategy and Implementation Summary
How We Get There From Here…
Edgar Risk Ventures has several projects identified at present for immediate or near-future commencement. The sequence of initiation for these projects is based on the strategic placement of product within the middle market of the music industry. There is ample room in this market for successful operations such as Edgar Risk Ventures, offering enthusiastic audiences who exhibit unusually high levels of loyalty to their favored entertainers and artists. Each new project will be designed to integrate with the previous one, while also penetrating new but kindred markets.
Project Strategy
Pricing strategies, product sales forecasts, strategic partnerships, market penetration, audience reception–all are individually dependent upon the unique aspects of both artist and product and weigh heavily upon the techniques utilized for project implementation. Thus the strategy of separate financing for each project substantially benefits ERV in establishing firm footing and stability for a project’s performance and life. These projects will ‘live’ in the marketplace individually, but will also become part of the ERV family of active, viable, revenue-producing components of its complete portfolio. Should a project not live up to its initial revenue projections, its impact is lessened by the others, with the possibility that one negative result could seriously harm the parent company becoming a remote, if not non-existent, eventuality.
The well-informed, cautious but enthusiastic planning of each project will provide for contingencies associated with both ERV and the individual component. Identification of appropriate audiences, whether domestic or foreign, is key to a project’s success. There are receptive audiences in Japan who are eager for good bluegrass music, both instrumental and vocal; while in the U.S., the same artist(s) would become just ‘part of the pack’ and must vie desperately for recognition in a burgeoning genre.
Identification of audience, assessment of artist abilities and reach, the strategic release of recorded product, worldwide exposure through Internet concentration and well-placed, beneficially-crafted contracts with suppliers will provide Edgar Risk Ventures a solid, firm footing upon which to build. The principals of this firm are not only well-equipped to accomplish this type of strategic evaluation, but are endowed with various talents, which when combined, form a formidable and impressive ‘knack’ for weighing and coordinating all components wisely to produce success.
Marketing Strategy
One of the leadoff projects will be a regional release coupled with a digital satellite release on Bob Edgar. The digital satellite testing has already been accomplished on this artist with phenomenally encouraging results. There is already a niche market for his product in the United States, as well as selected areas overseas. His name is known in the music production industry, and recapturing of the public audience appears not just possible, but entirely probable. Although re-entering the music market requires a certain amount of maintenance and attention, it is not Bob Edgar’s singular desire to focus entirely on his own artistic career. He enjoys producing, has immense ability to educate and guide hungry new talent and is looking forward to interacting with ERV clients on an ongoing and profitable basis. The re-establishment of his ‘name’ in the music industry, however, will add significant credibility and status for the planned activities of Edgar Risk Ventures, Ltd.
Concurrent with the preparation of Bob Edgar’s project will be the initiation of other projects hitting more specialized markets (bluegrass and religious), offering the expansion of reach and market array that will attract future clients. There are additional clients from the country music sector ‘waiting in the wings’ to fill out what will be a busy first year for this company. Initiation of these projects will be timelined for strategic impact as well as profitability.
Sales Strategy
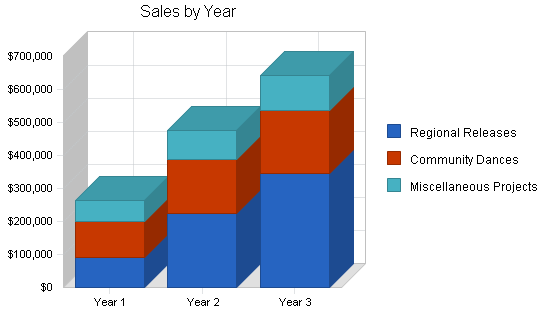
The following table and charts show the projected sales forecast for Edgar Risk Ventures.

| Sales Forecast | |||
| Year 1 | Year 2 | Year 3 | |
| Sales | |||
| Regional Releases | $90,180 | $225,450 | $345,690 |
| Community Dances | $109,000 | $163,500 | $190,750 |
| Miscellaneous Projects | $65,730 | $86,075 | $104,855 |
| Total Sales | $264,910 | $475,025 | $641,295 |
| Direct Cost of Sales | Year 1 | Year 2 | Year 3 |
| Regional Releases | $32,174 | $51,478 | $78,761 |
| Community Dances | $56,400 | $84,600 | $98,700 |
| Miscellaneous Projects | $23,730 | $31,075 | $37,855 |
| Subtotal Direct Cost of Sales | $112,304 | $167,153 | $215,316 |
Management Summary
The Players and Their Roles…
The initial management team consists of two operational positions and three advisory manager positions.
Organizational Structure
The operational positions within the company are: president and vice president administration. These positions carry full-time responsibilities for the ongoing daily operation of the company.
The advisory/manager positions are: controller, company counsel and ambassador of goodwill. These positions, in the beginning, carry part-time responsibilities dedicated to specialized functions necessary at times to fulfill the daily operation requirements of the company. As the scope of business enlarges for Edgar Risk Ventures, one or more of these individual positions may become full-time appointments.
Management Team
Bob Edgar, President
The specialized nature of the company’s business scope requires a leading management individual with extensive experience, background and contacts in the entertainment and music production fields. This is what we find in Bob Edgar.
Our visionary, entrepreneur and accomplished entertainer-executive is a Nashville recording artist who has recorded 54 masters, released 21 songs with ten of those achieving regional number one status and three rising to national fame. If you, like many of us, can say to yourself that you have a “memory of my yesterlove,” then perhaps “from a window in your memory” you recall Montana Woman. Bob’s first single, released in 1970, stayed on the charts for more than 20 weeks and became an instant national hit. Many years of entertaining in numerous venues followed Bob’s first record release. Even before that he was entrenched in the entertainment industry, achieving notable national recognition as a DJ throughout the Intermountain West and Southwest. He additionally served as emcee to many Grand Ole Opry road shows, during which time he enhanced both his personal friendship repertoire and established a valuable contact base with many performers and their companies. Bob’s performing career includes appearances throughout the United States, Canada, the Northwest Territories, Alaska and Japan. These involved on-stage performances as well as radio, television and movie appearances.
Given his extensive performance career, one might think all of Bob’s qualifications for this present business venture would come from that quadrant. However, Bob has always believed that music, in addition to being the language of the soul, is and should be managed as a business. Hence, over the years of his career he has compiled a long list of music business accomplishments, some of which are–production of singles and/or albums for individual artists in various venues; negotiating recording contracts with mid- to major-level music companies for individual artists; producing as well as performing in the television pilot, “Cowhide,” of which he still retains ownership; the formation of the Sweetwater Jubilee, a live weekly performance, and its associated Sweetwater Broadcast Network featuring a live weekly radio show, of which he still retains ownership; producing numerous live shows of varying magnitude and audience demographics for fund-raising activities, raising over the years hundreds of thousands of dollars for charities and/or individuals; maintaining a well-organized contact base within the music production and performance industry.
Through this extensive music business background and experience now evolves a businessman-entertainer with weathered wisdom, excellent creative judgment, confidence and shining talent. Bob Edgar is a well-qualified executive who can lead this company forward in accomplishing the myriad projects already envisioned and waiting to be clothed in reality.
Lee Edgar, Vice-President Administration
In addition to “earning her feathers” through the survival of twenty-plus years as partner, confidant, economic specialist, travel companion, planner extraordinaire and helpmate to Bob Edgar (no small feat in and of itself), Lee’s expertise definitely lies in the business administration field. She has spent her business career in executive suites of businesses of varying sizes and has gained experience in almost every industry available–retail consumer, legal and medical, convention and visitor venues, advertising and public relations, sales and marketing, television and computer manufacturing, software technology, television broadcasting, and most recently, the explosive business frontier known as the Internet. This medley of varied experiences has melded into an uncanny knack for relating to and understanding the needs of an extremely broad spectrum of people of every walk of life. This ability lends itself well to the somewhat mystical craft known as “pleasing the masses” in any music/entertainment venture.
Lee possesses the ability to administrate the varied business responsibilities and duties of this fledgling company as well as lending her excellent organizational and management skills to expanding and growing the company in the future. In addition to her extensive experience in office organization and administration, she has also acquired broad experience in the management of staff and/or departmental personnel, project supervision and completion, ‘hands-on’ involvement with music production and performance activities, television production, coordination of performers as well as production contacts, and contractual negotiations.
Lee Edgar is a creative, charismatic, romantic soul who believes her calling is to “pick up the silver threads of challenge and purpose along with the golden threads of vision and desire and guide them onto the loom of reality to produce the fabric of accomplishment.” Her commitment to this company is one of excellence…uncompromised.
Michael Glazewski, Controller
This ‘numbers man’ certainly ‘adds up’ as well qualified to fulfill the responsibilities inherent in the accounting duties of Edgar Risk Ventures. Mike is a Chicago-born, Midwest-raised transplant to Las Vegas via Arizona. Graduating from Arizona State University in 1989 with a BA in Accounting, he has worked in the warehousing industry since then. Mike has gained valuable insight and experience in not only the accounting aspect of business, but in the management of people as well as product and resources… significantly valuable skills for the planned projects of Edgar Risk Ventures.
Mike’s experience includes involvement in budget preparation and compliance; daily business accounting functions such as accounts payable, accounts receivable, general ledger maintenance, financial analysis, banking, strategic planning, purchasing, information systems, company policy establishment and all aspects of maintaining daily business operations.
As the activities of Edgar Risk Ventures proceed, Mike’s expertise will be utilized as required to support operations. He has indicated his commitment to the company to assist in every aspect of company operations falling within the scope of accounting and financial management. As the activities of the company increase, his involvement will increase incrementally. It is anticipated that this position may become full-time by the end of the first nine to twelve months of operation.
On a personal note, Mike’s stability and dependability are enhanced by his loving family–wife Christine, a music therapist who now is a full-time mom to daughters Lauren, currently enjoying kindergarten, Katherine who eagerly attends ballet classes, and the newest addition to their family, Michael Jr., just a month old at this writing. Dad Mike still devotes whatever time he can to the sports he loves best…baseball and golf. All in all, Edgar Risk Ventures will be amply rewarded by Mike Glazewski’s abilities, experience and overall integrity.
Leo Devilbiss, Ambassador of Goodwill
Every well-balanced organization–you know, those that have substance and warmth–has one of those special people who is ‘salt of the earth’ priceless in handling the ‘loose ends’ and those ‘important little details.’ And, through that person’s immaculate dispensation of cheerfulness and tact, he becomes the glue that bonds to all the pieces and holds them together through thick and thin. Yeah, that’s Leo, all right.
Leo Devilbiss is a shining example of the rarest of humans…a truly compassionate and unselfish man. Coupled with this personal accolade is his ability to acquire, organize and administrate. Conscientious and dependable, Leo performs the duties of a procurement officer to a tee. We need a hexagon-shaped yellow widget with purple edges…he finds it. Along the way, he manages to touch with goodwill and enthusiasm the minds and hearts of all those he contacts.
A tireless ambassador of goodwill, he brings the picture of our endeavors into focus with clarity and friendship. That mischievous little sparkle in his eye is just a telltale sign of how much he enjoys his efforts in creating warm welcomes and acceptance of us and what we do. Retired from the U.S. Air Force with 22 years of aeronautical mechanics and scheduling experience, as well as 10 years of part-time work with Sears Roebuck & Company, he comes to us not only as a treasured friend, but someone with both public and business expertise.
Sharing his wife Donna’s love of bluegrass music, the couple lives in Henderson, Nevada, where Leo devotes many hours of every week to the fulfillment of varying duties at the Henderson Senior Center. He loves people, enjoys helping them and never tires in his willingness to provide. He is truly the superior choice to occupy the position of ambassador of goodwill for Edgar Risk Ventures, Ltd., a job with enormous importance for an entertainment company.
Personnel Plan
It is anticipated that full-time employment will be required of only the president and vice president administration for the first six to nine months, possibly even the first year of operation. Thus, salaries for only these two employees for that time period are included in the Projected Profit and Loss Statement shown in the next section, with accounting and legal expenses calculated individually. It is difficult to ascertain when additional personnel will be needed, although part-time employment of subcontracted services may be required from time to time.
| Personnel Plan | |||
| Year 1 | Year 2 | Year 3 | |
| President | $35,000 | $35,000 | $35,000 |
| Vice president- Admin | $35,000 | $35,000 | $35,000 |
| Controller | $7,000 | $7,000 | $19,000 |
| Ambassador of Goodwill | $7,000 | $7,000 | $19,000 |
| Total People | 4 | 4 | 4 |
| Total Payroll | $84,000 | $84,000 | $108,000 |
Financial Plan
Success Is a Journey, Not a Destination…
The next topics present in our Financial Plan supported by tables and charts.
Important Assumptions
The following financials cover the balance of the year 2001 and carry through year 2003, holding certain assumptions as to the level of activities and numbers of projects to be undertaken. The assumptions for the balance of the current year and well into year 2002 are based on rather definite and reliable data, knowing the nature and potential of projects already identified and ready to be produced. As additional clients and projects appear on the scene, the assumptions become less definite at this time, but certainly the revenue and exposure potential increases incrementally with each added project.
All financials except the ‘Rainbow’s End’ components utilize the most conservative of figures. This is to protect both the legitimacy of expected revenues as well as the credibility of activity. The added assumption of the ‘Rainbow’s End’ factors are utilized only to display possibilities inherent in each project.
| General Assumptions | |||
| Year 1 | Year 2 | Year 3 | |
| Plan Month | 1 | 2 | 3 |
| Current Interest Rate | 10.00% | 10.00% | 10.00% |
| Long-term Interest Rate | 10.00% | 10.00% | 10.00% |
| Tax Rate | 30.00% | 30.00% | 30.00% |
| Other | 0 | 0 | 0 |
Break-even Analysis
The following Break-even Analysis shows what is needed in monthly sales to break even in relation to monthly expenses.

| Break-even Analysis | |
| Monthly Revenue Break-even | $20,479 |
| Assumptions: | |
| Average Percent Variable Cost | 42% |
| Estimated Monthly Fixed Cost | $11,797 |
Projected Profit and Loss
The following table and chart present the projected Profit and Loss.


| Pro Forma Profit and Loss | |||
| Year 1 | Year 2 | Year 3 | |
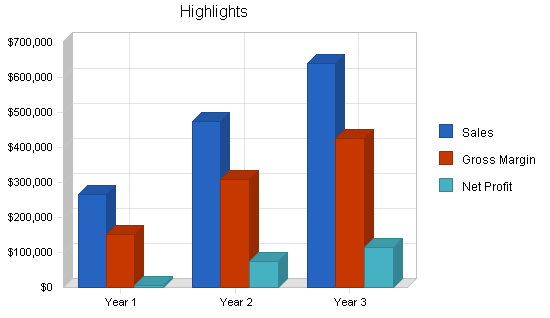
| Sales | $264,910 | $475,025 | $641,295 |
| Direct Cost of Sales | $112,304 | $167,153 | $215,316 |
| Other Production Expenses | $0 | $0 | $0 |
| Total Cost of Sales | $112,304 | $167,153 | $215,316 |
| Gross Margin | $152,607 | $307,872 | $425,979 |
| Gross Margin % | 57.61% | 64.81% | 66.42% |
| Expenses | |||
| Payroll | $84,000 | $84,000 | $108,000 |
| Sales and Marketing and Other Expenses | $30,750 | $86,200 | $117,700 |
| Depreciation | $0 | $0 | $0 |
| Leased Equipment | $0 | $2,000 | $5,000 |
| Publications/memberships | $1,620 | $1,620 | $1,620 |
| Insurance | $3,600 | $4,200 | $4,500 |
| Rent | $9,000 | $9,000 | $10,000 |
| Payroll Taxes | $12,600 | $12,600 | $16,200 |
| Other | $0 | $0 | $0 |
| Total Operating Expenses | $141,570 | $199,620 | $263,020 |
| Profit Before Interest and Taxes | $11,037 | $108,252 | $162,959 |
| EBITDA | $11,037 | $108,252 | $162,959 |
| Interest Expense | $1,313 | $850 | $750 |
| Taxes Incurred | $2,917 | $32,221 | $48,663 |
| Net Profit | $6,807 | $75,181 | $113,546 |
| Net Profit/Sales | 2.57% | 15.83% | 17.71% |
Projected Cash Flow
The following table and chart show the Projected Cash Flow and Cash Balance for Edgar Risk Ventures.

| Pro Forma Cash Flow | |||
| Year 1 | Year 2 | Year 3 | |
| Cash Received | |||
| Cash from Operations | |||
| Cash Sales | $238,419 | $427,523 | $577,166 |
| Cash from Receivables | $23,779 | $45,351 | $62,427 |
| Subtotal Cash from Operations | $262,198 | $472,874 | $639,593 |
| Additional Cash Received | |||
| Sales Tax, VAT, HST/GST Received | $0 | $0 | $0 |
| New Current Borrowing | $0 | $0 | $0 |
| New Other Liabilities (interest-free) | $0 | $0 | $0 |
| New Long-term Liabilities | $0 | $0 | $0 |
| Sales of Other Current Assets | $0 | $0 | $0 |
| Sales of Long-term Assets | $0 | $0 | $0 |
| New Investment Received | $0 | $0 | $0 |
| Subtotal Cash Received | $262,198 | $472,874 | $639,593 |
| Expenditures | Year 1 | Year 2 | Year 3 |
| Expenditures from Operations | |||
| Cash Spending | $84,000 | $84,000 | $108,000 |
| Bill Payments | $160,883 | $304,104 | $411,209 |
| Subtotal Spent on Operations | $244,883 | $388,104 | $519,209 |
| Additional Cash Spent | |||
| Sales Tax, VAT, HST/GST Paid Out | $0 | $0 | $0 |
| Principal Repayment of Current Borrowing | $4,000 | $0 | $0 |
| Other Liabilities Principal Repayment | $0 | $0 | $0 |
| Long-term Liabilities Principal Repayment | $1,000 | $1,000 | $1,000 |
| Purchase Other Current Assets | $0 | $0 | $0 |
| Purchase Long-term Assets | $20,000 | $28,000 | $38,000 |
| Dividends | $0 | $50,000 | $60,000 |
| Subtotal Cash Spent | $269,883 | $467,104 | $618,209 |
| Net Cash Flow | ($7,685) | $5,770 | $21,384 |
| Cash Balance | $30,315 | $36,085 | $57,469 |
Projected Balance Sheet
The following table is the Projected Balance Sheet.
| Pro Forma Balance Sheet | |||
| Year 1 | Year 2 | Year 3 | |
| Assets | |||
| Current Assets | |||
| Cash | $30,315 | $36,085 | $57,469 |
| Accounts Receivable | $2,712 | $4,863 | $6,566 |
| Other Current Assets | $0 | $0 | $0 |
| Total Current Assets | $33,027 | $40,948 | $64,035 |
| Long-term Assets | |||
| Long-term Assets | $24,500 | $52,500 | $90,500 |
| Accumulated Depreciation | $0 | $0 | $0 |
| Total Long-term Assets | $24,500 | $52,500 | $90,500 |
| Total Assets | $57,527 | $93,448 | $154,535 |
| Liabilities and Capital | Year 1 | Year 2 | Year 3 |
| Current Liabilities | |||
| Accounts Payable | $14,220 | $25,960 | $34,500 |
| Current Borrowing | $0 | $0 | $0 |
| Other Current Liabilities | $2,000 | $2,000 | $2,000 |
| Subtotal Current Liabilities | $16,220 | $27,960 | $36,500 |
| Long-term Liabilities | $9,000 | $8,000 | $7,000 |
| Total Liabilities | $25,220 | $35,960 | $43,500 |
| Paid-in Capital | $44,000 | $44,000 | $44,000 |
| Retained Earnings | ($18,500) | ($61,693) | ($46,512) |
| Earnings | $6,807 | $75,181 | $113,546 |
| Total Capital | $32,307 | $57,488 | $111,035 |
| Total Liabilities and Capital | $57,527 | $93,448 | $154,535 |
| Net Worth | $32,307 | $57,488 | $111,035 |
Business Ratios
The industry standard business ratios are taken from the music recording industry, Standard Industrial Classification (SIC) code 7922, Theatrical Producers and Services, Excluding Motion Pictures. ERV’s ratios conform to most of the ratios, however there are some differences that must be explained. First of all, ERV will not be a highly leveraged company since it has access to significant amounts of investment capital prior to business launch. Furthermore the company is convinced that due to Mr. Edgar’s past success and well developed “brand image” in the industry and with music listeners in general, the company will be able to leverage this fame into higher initial profits. The company wishes to utilize this by spending a significantly more amount of money on advertising to strengthen its future profits.
| Ratio Analysis | ||||
| Year 1 | Year 2 | Year 3 | Industry Profile | |
| Sales Growth | n.a. | 79.32% | 35.00% | 15.20% |
| Percent of Total Assets | ||||
| Accounts Receivable | 4.71% | 5.20% | 4.25% | 5.70% |
| Other Current Assets | 0.00% | 0.00% | 0.00% | 32.50% |
| Total Current Assets | 57.41% | 43.82% | 41.44% | 41.30% |
| Long-term Assets | 42.59% | 56.18% | 58.56% | 58.70% |
| Total Assets | 100.00% | 100.00% | 100.00% | 100.00% |
| Current Liabilities | 28.20% | 29.92% | 23.62% | 34.70% |
| Long-term Liabilities | 15.64% | 8.56% | 4.53% | 27.90% |
| Total Liabilities | 43.84% | 38.48% | 28.15% | 62.60% |
| Net Worth | 56.16% | 61.52% | 71.85% | 37.40% |
| Percent of Sales | ||||
| Sales | 100.00% | 100.00% | 100.00% | 100.00% |
| Gross Margin | 57.61% | 64.81% | 66.42% | 0.00% |
| Selling, General & Administrative Expenses | 55.04% | 48.98% | 48.72% | 74.90% |
| Advertising Expenses | 0.00% | 10.53% | 11.70% | 2.90% |
| Profit Before Interest and Taxes | 4.17% | 22.79% | 25.41% | 2.00% |
| Main Ratios | ||||
| Current | 2.04 | 1.46 | 1.75 | 1.29 |
| Quick | 2.04 | 1.46 | 1.75 | 0.85 |
| Total Debt to Total Assets | 43.84% | 38.48% | 28.15% | 62.60% |
| Pre-tax Return on Net Worth | 30.10% | 186.82% | 146.09% | 2.30% |
| Pre-tax Return on Assets | 16.90% | 114.93% | 104.97% | 6.00% |
| Additional Ratios | Year 1 | Year 2 | Year 3 | |
| Net Profit Margin | 2.57% | 15.83% | 17.71% | n.a |
| Return on Equity | 21.07% | 130.78% | 102.26% | n.a |
| Activity Ratios | ||||
| Accounts Receivable Turnover | 9.77 | 9.77 | 9.77 | n.a |
| Collection Days | 57 | 29 | 33 | n.a |
| Accounts Payable Turnover | 12.24 | 12.17 | 12.17 | n.a |
| Payment Days | 27 | 23 | 26 | n.a |
| Total Asset Turnover | 4.60 | 5.08 | 4.15 | n.a |
| Debt Ratios | ||||
| Debt to Net Worth | 0.78 | 0.63 | 0.39 | n.a |
| Current Liab. to Liab. | 0.64 | 0.78 | 0.84 | n.a |
| Liquidity Ratios | ||||
| Net Working Capital | $16,807 | $12,988 | $27,535 | n.a |
| Interest Coverage | 8.41 | 127.35 | 217.28 | n.a |
| Additional Ratios | ||||
| Assets to Sales | 0.22 | 0.20 | 0.24 | n.a |
| Current Debt/Total Assets | 28% | 30% | 24% | n.a |
| Acid Test | 1.87 | 1.29 | 1.57 | n.a |
| Sales/Net Worth | 8.20 | 8.26 | 5.78 | n.a |
| Dividend Payout | 0.00 | 0.67 | 0.53 | n.a |
Appendix
| Sales Forecast | |||||||||||||
| Month 1 | Month 2 | Month 3 | Month 4 | Month 5 | Month 6 | Month 7 | Month 8 | Month 9 | Month 10 | Month 11 | Month 12 | ||
| Sales | |||||||||||||
| Regional Releases | 0% | $0 | $0 | $22,545 | $0 | $22,545 | $0 | $0 | $0 | $0 | $45,090 | $0 | $0 |
| Community Dances | 0% | $5,450 | $16,350 | $5,450 | $5,450 | $5,450 | $5,450 | $10,900 | $10,900 | $10,900 | $16,350 | $0 | $16,350 |
| Miscellaneous Projects | 0% | $5,478 | $5,478 | $5,478 | $5,478 | $5,478 | $5,478 | $5,478 | $5,478 | $5,478 | $5,478 | $5,478 | $5,478 |
| Total Sales | $10,928 | $21,828 | $33,473 | $10,928 | $33,473 | $10,928 | $16,378 | $16,378 | $16,378 | $66,918 | $5,478 | $21,828 | |
| Direct Cost of Sales | Month 1 | Month 2 | Month 3 | Month 4 | Month 5 | Month 6 | Month 7 | Month 8 | Month 9 | Month 10 | Month 11 | Month 12 | |
| Regional Releases | $0 | $0 | $8,775 | $0 | $8,775 | $0 | $0 | $0 | $0 | $14,624 | $0 | $0 | |
| Community Dances | $2,820 | $8,460 | $2,820 | $2,820 | $2,820 | $2,820 | $5,640 | $5,640 | $5,640 | $8,460 | $0 | $8,460 | |
| Miscellaneous Projects | $1,978 | $1,978 | $1,978 | $1,978 | $1,978 | $1,978 | $1,978 | $1,978 | $1,978 | $1,978 | $1,978 | $1,978 | |
| Subtotal Direct Cost of Sales | $4,798 | $10,438 | $13,573 | $4,798 | $13,573 | $4,798 | $7,618 | $7,618 | $7,618 | $25,061 | $1,978 | $10,438 | |
| Personnel Plan | |||||||||||||
| Month 1 | Month 2 | Month 3 | Month 4 | Month 5 | Month 6 | Month 7 | Month 8 | Month 9 | Month 10 | Month 11 | Month 12 | ||
| President | 0% | $2,917 | $2,917 | $2,917 | $2,917 | $2,917 | $2,917 | $2,917 | $2,917 | $2,917 | $2,917 | $2,917 | $2,917 |
| Vice president- Admin | 0% | $2,917 | $2,917 | $2,917 | $2,917 | $2,917 | $2,917 | $2,917 | $2,917 | $2,917 | $2,917 | $2,917 | $2,917 |
| Controller | 0% | $0 | $0 | $0 | $0 | $0 | $0 | $0 | $0 | $1,750 | $1,750 | $1,750 | $1,750 |
| Ambassador of Goodwill | 0% | $0 | $0 | $0 | $0 | $0 | $0 | $0 | $0 | $1,750 | $1,750 | $1,750 | $1,750 |
| Total People | 4 | 4 | 4 | 4 | 4 | 4 | 4 | 4 | 4 | 4 | 4 | 4 | |
| Total Payroll | $5,833 | $5,833 | $5,833 | $5,833 | $5,833 | $5,833 | $5,833 | $5,833 | $9,333 | $9,333 | $9,333 | $9,333 | |
| General Assumptions | |||||||||||||
| Month 1 | Month 2 | Month 3 | Month 4 | Month 5 | Month 6 | Month 7 | Month 8 | Month 9 | Month 10 | Month 11 | Month 12 | ||
| Plan Month | 1 | 2 | 3 | 4 | 5 | 6 | 7 | 8 | 9 | 10 | 11 | 12 | |
| Current Interest Rate | 10.00% | 10.00% | 10.00% | 10.00% | 10.00% | 10.00% | 10.00% | 10.00% | 10.00% | 10.00% | 10.00% | 10.00% | |
| Long-term Interest Rate | 10.00% | 10.00% | 10.00% | 10.00% | 10.00% | 10.00% | 10.00% | 10.00% | 10.00% | 10.00% | 10.00% | 10.00% | |
| Tax Rate | 30.00% | 30.00% | 30.00% | 30.00% | 30.00% | 30.00% | 30.00% | 30.00% | 30.00% | 30.00% | 30.00% | 30.00% | |
| Other | 0 | 0 | 0 | 0 | 0 | 0 | 0 | 0 | 0 | 0 | 0 | 0 | |
| Pro Forma Profit and Loss | |||||||||||||
| Month 1 | Month 2 | Month 3 | Month 4 | Month 5 | Month 6 | Month 7 | Month 8 | Month 9 | Month 10 | Month 11 | Month 12 | ||
| Sales | $10,928 | $21,828 | $33,473 | $10,928 | $33,473 | $10,928 | $16,378 | $16,378 | $16,378 | $66,918 | $5,478 | $21,828 | |
| Direct Cost of Sales | $4,798 | $10,438 | $13,573 | $4,798 | $13,573 | $4,798 | $7,618 | $7,618 | $7,618 | $25,061 | $1,978 | $10,438 | |
| Other Production Expenses | $0 | $0 | $0 | $0 | $0 | $0 | $0 | $0 | $0 | $0 | $0 | $0 | |
| Total Cost of Sales | $4,798 | $10,438 | $13,573 | $4,798 | $13,573 | $4,798 | $7,618 | $7,618 | $7,618 | $25,061 | $1,978 | $10,438 | |
| Gross Margin | $6,130 | $11,390 | $19,900 | $6,130 | $19,900 | $6,130 | $8,760 | $8,760 | $8,760 | $41,857 | $3,500 | $11,390 | |
| Gross Margin % | 56.10% | 52.18% | 59.45% | 56.10% | 59.45% | 56.10% | 53.49% | 53.49% | 53.49% | 62.55% | 63.90% | 52.18% | |
| Expenses | |||||||||||||
| Payroll | $5,833 | $5,833 | $5,833 | $5,833 | $5,833 | $5,833 | $5,833 | $5,833 | $9,333 | $9,333 | $9,333 | $9,333 | |
| Sales and Marketing and Other Expenses | $2,562 | $2,562 | $2,562 | $2,562 | $2,562 | $2,562 | $2,562 | $2,562 | $2,562 | $2,562 | $2,562 | $2,562 | |
| Depreciation | $0 | $0 | $0 | $0 | $0 | $0 | $0 | $0 | $0 | $0 | $0 | $0 | |
| Leased Equipment | $0 | $0 | $0 | $0 | $0 | $0 | $0 | $0 | $0 | $0 | $0 | $0 | |
| Publications/memberships | $135 | $135 | $135 | $135 | $135 | $135 | $135 | $135 | $135 | $135 | $135 | $135 | |
| Insurance | $300 | $300 | $300 | $300 | $300 | $300 | $300 | $300 | $300 | $300 | $300 | $300 | |
| Rent | $750 | $750 | $750 | $750 | $750 | $750 | $750 | $750 | $750 | $750 | $750 | $750 | |
| Payroll Taxes | 15% | $875 | $875 | $875 | $875 | $875 | $875 | $875 | $875 | $1,400 | $1,400 | $1,400 | $1,400 |
| Other | $0 | $0 | $0 | $0 | $0 | $0 | $0 | $0 | $0 | $0 | $0 | $0 | |
| Total Operating Expenses | $10,456 | $10,456 | $10,456 | $10,456 | $10,456 | $10,456 | $10,456 | $10,456 | $14,481 | $14,481 | $14,481 | $14,481 | |
| Profit Before Interest and Taxes | ($4,326) | $934 | $9,444 | ($4,326) | $9,444 | ($4,326) | ($1,696) | ($1,696) | ($5,721) | $27,376 | ($10,981) | ($3,091) | |
| EBITDA | ($4,326) | $934 | $9,444 | ($4,326) | $9,444 | ($4,326) | ($1,696) | ($1,696) | ($5,721) | $27,376 | ($10,981) | ($3,091) | |
| Interest Expense | $116 | $115 | $115 | $114 | $113 | $113 | $112 | $111 | $110 | $110 | $109 | $75 | |
| Taxes Incurred | ($1,333) | $246 | $2,799 | ($1,332) | $2,799 | ($1,331) | ($542) | ($542) | ($1,749) | $8,180 | ($3,327) | ($950) | |
| Net Profit | ($3,109) | $573 | $6,531 | ($3,108) | $6,532 | ($3,107) | ($1,265) | ($1,265) | ($4,082) | $19,086 | ($7,763) | ($2,216) | |
| Net Profit/Sales | -28.45% | 2.63% | 19.51% | -28.44% | 19.51% | -28.43% | -7.73% | -7.72% | -24.92% | 28.52% | -141.72% | -10.15% | |
| Pro Forma Cash Flow | |||||||||||||
| Month 1 | Month 2 | Month 3 | Month 4 | Month 5 | Month 6 | Month 7 | Month 8 | Month 9 | Month 10 | Month 11 | Month 12 | ||
| Cash Received | |||||||||||||
| Cash from Operations | |||||||||||||
| Cash Sales | $9,835 | $19,645 | $30,125 | $9,835 | $30,125 | $9,835 | $14,740 | $14,740 | $14,740 | $60,226 | $4,930 | $19,645 | |
| Cash from Receivables | $0 | $36 | $1,129 | $2,222 | $3,272 | $1,168 | $3,272 | $1,111 | $1,638 | $1,638 | $1,806 | $6,487 | |
| Subtotal Cash from Operations | $9,835 | $19,681 | $31,254 | $12,056 | $33,397 | $11,003 | $18,012 | $15,851 | $16,378 | $61,864 | $6,736 | $26,132 | |
| Additional Cash Received | |||||||||||||
| Sales Tax, VAT, HST/GST Received | 0.00% | $0 | $0 | $0 | $0 | $0 | $0 | $0 | $0 | $0 | $0 | $0 | $0 |
| New Current Borrowing | $0 | $0 | $0 | $0 | $0 | $0 | $0 | $0 | $0 | $0 | $0 | $0 | |
| New Other Liabilities (interest-free) | $0 | $0 | $0 | $0 | $0 | $0 | $0 | $0 | $0 | $0 | $0 | $0 | |
| New Long-term Liabilities | $0 | $0 | $0 | $0 | $0 | $0 | $0 | $0 | $0 | $0 | $0 | $0 | |
| Sales of Other Current Assets | $0 | $0 | $0 | $0 | $0 | $0 | $0 | $0 | $0 | $0 | $0 | $0 | |
| Sales of Long-term Assets | $0 | $0 | $0 | $0 | $0 | $0 | $0 | $0 | $0 | $0 | $0 | $0 | |
| New Investment Received | $0 | $0 | $0 | $0 | $0 | $0 | $0 | $0 | $0 | $0 | $0 | $0 | |
| Subtotal Cash Received | $9,835 | $19,681 | $31,254 | $12,056 | $33,397 | $11,003 | $18,012 | $15,851 | $16,378 | $61,864 | $6,736 | $26,132 | |
| Expenditures | Month 1 | Month 2 | Month 3 | Month 4 | Month 5 | Month 6 | Month 7 | Month 8 | Month 9 | Month 10 | Month 11 | Month 12 | |
| Expenditures from Operations | |||||||||||||
| Cash Spending | $5,833 | $5,833 | $5,833 | $5,833 | $5,833 | $5,833 | $5,833 | $5,833 | $9,333 | $9,333 | $9,333 | $9,333 | |
| Bill Payments | $1,273 | $8,444 | $15,611 | $20,678 | $8,632 | $20,677 | $8,321 | $11,809 | $11,786 | $12,038 | $37,345 | $4,267 | |
| Subtotal Spent on Operations | $7,107 | $14,277 | $21,444 | $26,512 | $14,465 | $26,511 | $14,155 | $17,643 | $21,120 | $21,372 | $46,678 | $13,601 | |
| Additional Cash Spent | |||||||||||||
| Sales Tax, VAT, HST/GST Paid Out | $0 | $0 | $0 | $0 | $0 | $0 | $0 | $0 | $0 | $0 | $0 | $0 | |
| Principal Repayment of Current Borrowing | $0 | $0 | $0 | $0 | $0 | $0 | $0 | $0 | $0 | $0 | $0 | $4,000 | |
| Other Liabilities Principal Repayment | $0 | $0 | $0 | $0 | $0 | $0 | $0 | $0 | $0 | $0 | $0 | $0 | |
| Long-term Liabilities Principal Repayment | $83 | $83 | $83 | $83 | $83 | $83 | $83 | $83 | $83 | $83 | $83 | $83 | |
| Purchase Other Current Assets | $0 | $0 | $0 | $0 | $0 | $0 | $0 | $0 | $0 | $0 | $0 | $0 | |
| Purchase Long-term Assets | $0 | $0 | $0 | $0 | $20,000 | $0 | $0 | $0 | $0 | $0 | $0 | $0 | |
| Dividends | $0 | $0 | $0 | $0 | $0 | $0 | $0 | $0 | $0 | $0 | $0 | $0 | |
| Subtotal Cash Spent | $7,190 | $14,361 | $21,527 | $26,595 | $34,549 | $26,594 | $14,238 | $17,726 | $21,203 | $21,455 | $46,762 | $17,684 | |
| Net Cash Flow | $2,645 | $5,321 | $9,727 | ($14,539) | ($1,151) | ($15,591) | $3,774 | ($1,875) | ($4,825) | $40,408 | ($40,026) | $8,448 | |
| Cash Balance | $40,645 | $45,965 | $55,692 | $41,154 | $40,002 | $24,411 | $28,185 | $26,309 | $21,484 | $61,892 | $21,867 | $30,315 | |
| Pro Forma Balance Sheet | |||||||||||||
| Month 1 | Month 2 | Month 3 | Month 4 | Month 5 | Month 6 | Month 7 | Month 8 | Month 9 | Month 10 | Month 11 | Month 12 | ||
| Assets | Starting Balances | ||||||||||||
| Current Assets | |||||||||||||
| Cash | $38,000 | $40,645 | $45,965 | $55,692 | $41,154 | $40,002 | $24,411 | $28,185 | $26,309 | $21,484 | $61,892 | $21,867 | $30,315 |
| Accounts Receivable | $0 | $1,093 | $3,239 | $5,457 | $4,328 | $4,404 | $4,328 | $2,694 | $3,221 | $3,221 | $8,275 | $7,016 | $2,712 |
| Other Current Assets | $0 | $0 | $0 | $0 | $0 | $0 | $0 | $0 | $0 | $0 | $0 | $0 | $0 |
| Total Current Assets | $38,000 | $41,737 | $49,204 | $61,150 | $45,482 | $44,406 | $28,739 | $30,879 | $29,530 | $24,705 | $70,167 | $28,883 | $33,027 |
| Long-term Assets | |||||||||||||
| Long-term Assets | $4,500 | $4,500 | $4,500 | $4,500 | $4,500 | $24,500 | $24,500 | $24,500 | $24,500 | $24,500 | $24,500 | $24,500 | $24,500 |
| Accumulated Depreciation | $0 | $0 | $0 | $0 | $0 | $0 | $0 | $0 | $0 | $0 | $0 | $0 | $0 |
| Total Long-term Assets | $4,500 | $4,500 | $4,500 | $4,500 | $4,500 | $24,500 | $24,500 | $24,500 | $24,500 | $24,500 | $24,500 | $24,500 | $24,500 |
| Total Assets | $42,500 | $46,237 | $53,704 | $65,650 | $49,982 | $68,906 | $53,239 | $55,379 | $54,030 | $49,205 | $94,667 | $53,383 | $57,527 |
| Liabilities and Capital | Month 1 | Month 2 | Month 3 | Month 4 | Month 5 | Month 6 | Month 7 | Month 8 | Month 9 | Month 10 | Month 11 | Month 12 | |
| Current Liabilities | |||||||||||||
| Accounts Payable | $1,000 | $7,930 | $14,907 | $20,405 | $7,929 | $20,404 | $7,928 | $11,416 | $11,415 | $10,755 | $37,215 | $3,777 | $14,220 |
| Current Borrowing | $4,000 | $4,000 | $4,000 | $4,000 | $4,000 | $4,000 | $4,000 | $4,000 | $4,000 | $4,000 | $4,000 | $4,000 | $0 |
| Other Current Liabilities | $2,000 | $2,000 | $2,000 | $2,000 | $2,000 | $2,000 | $2,000 | $2,000 | $2,000 | $2,000 | $2,000 | $2,000 | $2,000 |
| Subtotal Current Liabilities | $7,000 | $13,930 | $20,907 | $26,405 | $13,929 | $26,404 | $13,928 | $17,416 | $17,415 | $16,755 | $43,215 | $9,777 | $16,220 |
| Long-term Liabilities | $10,000 | $9,917 | $9,833 | $9,750 | $9,667 | $9,583 | $9,500 | $9,417 | $9,333 | $9,250 | $9,167 | $9,083 | $9,000 |
| Total Liabilities | $17,000 | $23,847 | $30,740 | $36,155 | $23,595 | $35,987 | $23,428 | $26,833 | $26,749 | $26,005 | $52,381 | $18,860 | $25,220 |
| Paid-in Capital | $44,000 | $44,000 | $44,000 | $44,000 | $44,000 | $44,000 | $44,000 | $44,000 | $44,000 | $44,000 | $44,000 | $44,000 | $44,000 |
| Retained Earnings | ($18,500) | ($18,500) | ($18,500) | ($18,500) | ($18,500) | ($18,500) | ($18,500) | ($18,500) | ($18,500) | ($18,500) | ($18,500) | ($18,500) | ($18,500) |
| Earnings | $0 | ($3,109) | ($2,536) | $3,995 | $887 | $7,419 | $4,312 | $3,046 | $1,782 | ($2,300) | $16,786 | $9,023 | $6,807 |
| Total Capital | $25,500 | $22,391 | $22,964 | $29,495 | $26,387 | $32,919 | $29,812 | $28,546 | $27,282 | $23,200 | $42,286 | $34,523 | $32,307 |
| Total Liabilities and Capital | $42,500 | $46,237 | $53,704 | $65,650 | $49,982 | $68,906 | $53,239 | $55,379 | $54,030 | $49,205 | $94,667 | $53,383 | $57,527 |
| Net Worth | $25,500 | $22,391 | $22,964 | $29,495 | $26,387 | $32,919 | $29,812 | $28,546 | $27,282 | $23,200 | $42,286 | $34,523 | $32,307 |


