
University Telephones
Executive Summary
University Telephones will offer State University students landline phones, cell phones, and cell phone plans. University Telephones will operate out of a storefront that is sandwiched between a popular student espresso shop and the University Bookstore. Located just a half block from campus, University Telephones is accessible to all students.
The university community centers around Steward Street which is the major entrance and exit from campus. Each year, students spend in excess of $100 million dollars for products and services with businesses serving the university community.
University Telephones will focus on students that live on and off campus by offering products and service plans that are tailored to student needs. Approximately six thousand students live on campus. An additional twelve thousand students live off campus. Currently, there is no telephone equipment outlet operation within five miles of the campus.
Robert Conway, owner of University Telephones, has been the manager of the University Bookstore’s electronic department for the past four years and is very familiar with his target customer base.
1.1 Mission
University Telephones’ mission is to offer its customers the highest quality telephone products and services. Robert focuses on personalized service to his customers by offering convenience and rapid service. Additionally, University Telephones has the technologically expertise assist customers in picking the product and service that best meets the student’s needs. Finally, Robert has strong vendor relationships with the product suppliers and will be able to meet customer’s demand for the newest innovation in telephone technology.
1.2 Keys to Success
University Telephones’ keys to success will include:
- Excellent customer service.
- Grow and maintain a referral network of customers.
- Focus expertise in cell phones and cell phone programs.
- Rapid response to customer problems with product or plan.
Company Summary
University Telephones will offer State University students landline phones, cell phones, and cell phones plans. Robert Conway, owner of University Telephones, believes the store is the perfect location to capture students as they make crucial purchases at the beginning of each term.
University Telephones will provide students support and convenience second to none.
2.1 Company Ownership
Robert Conway is the sole owner of University Telephones.
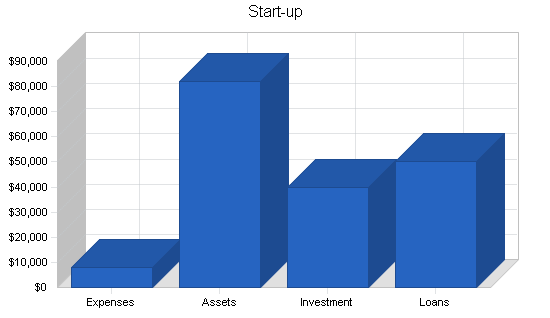
2.2 Start-up Summary
Robert will invest $40,000 in University Telephones. He will also secure a $50,000 long-term loan. The following chart and table show projected initial start-up costs for University Telephones.
| Start-up | |
| Requirements | |
| Start-up Expenses | |
| Legal | $1,000 |
| Insurance | $1,000 |
| Rent | $2,000 |
| Expensed Equipment | $4,000 |
| Total Start-up Expenses | $8,000 |
| Start-up Assets | |
| Cash Required | $2,000 |
| Start-up Inventory | $30,000 |
| Other Current Assets | $0 |
| Long-term Assets | $50,000 |
| Total Assets | $82,000 |
| Total Requirements | $90,000 |
| Start-up Funding | |
| Start-up Expenses to Fund | $8,000 |
| Start-up Assets to Fund | $82,000 |
| Total Funding Required | $90,000 |
| Assets | |
| Non-cash Assets from Start-up | $80,000 |
| Cash Requirements from Start-up | $2,000 |
| Additional Cash Raised | $0 |
| Cash Balance on Starting Date | $2,000 |
| Total Assets | $82,000 |
| Liabilities and Capital | |
| Liabilities | |
| Current Borrowing | $0 |
| Long-term Liabilities | $50,000 |
| Accounts Payable (Outstanding Bills) | $0 |
| Other Current Liabilities (interest-free) | $0 |
| Total Liabilities | $50,000 |
| Capital | |
| Planned Investment | |
| Robert Conway | $40,000 |
| Other | $0 |
| Additional Investment Requirement | $0 |
| Total Planned Investment | $40,000 |
| Loss at Start-up (Start-up Expenses) | ($8,000) |
| Total Capital | $32,000 |
| Total Capital and Liabilities | $82,000 |
| Total Funding | $90,000 |
2.3 Company Locations and Facilities
University Telephones is located on 3455 Steward Street.
Products
The following are the products and services offered by University Telephones:
- Landline Phones: Sony, RCA, Panasonic, Toshiba, GE, Sanyo, and Conair.
- Cell Phones: Ericsson, Sprint, Motorola, Neopoint, Nokia, Panasonic, and Sanyo.
- Cell Phone Accessories: antennas, batteries, belt clips, cables and adapters, cases, chargers, faceplates, and modems.
- Cell Phone Plans: local service, regional service, national service, prepaid service.
Market Analysis Summary
The university community serves 18,000 students. Each year, students spend in excess of $100 million dollars for products and services with businesses in the university community. In a recent campus survey, over 75% of students reported that they own cell phones. Of that number, over 80% reported that they also have a landline phone. This represents a multi-million dollar market in the university community.
University Telephones will focus on students that live on and off campus by offering products and service plans that are tailored to student needs. Approximately, 6,000 students live on campus. An additional 12,000 students live off campus. Currently, there is no telephone equipment outlet operation within five miles of the campus.
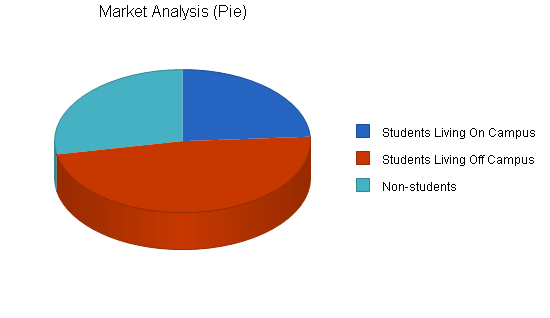
4.1 Market Segmentation
University Telephones will focus on two customer groups:
- Students living on campus;
- Students living off campus;
- Non-students that work or live in university area. This group includes university faculty, administration, and university-area residents.
| Market Analysis | |||||||
| Year 1 | Year 2 | Year 3 | Year 4 | Year 5 | |||
| Potential Customers | Growth | CAGR | |||||
| Students Living On Campus | 2% | 6,000 | 6,120 | 6,242 | 6,367 | 6,494 | 2.00% |
| Students Living Off Campus | 3% | 12,000 | 12,360 | 12,731 | 13,113 | 13,506 | 3.00% |
| Non-students | 5% | 7,000 | 7,350 | 7,718 | 8,104 | 8,509 | 5.00% |
| Total | 3.34% | 25,000 | 25,830 | 26,691 | 27,584 | 28,509 | 3.34% |
4.2 Target Market Segment Strategy
The market for telephone equipment and cell phone plans is very fragmented, crowded and competitive. Among these, there are only a few large local firms that serve the entire city of Richmond. The remainder are small firms that sell from kiosks in the surrounding malls. University Telephones’ current niche is its location on Steward Street. At the beginning of each term, a number of telephone equipment and service providers set up tables and kiosks on Steward Street but after day ten, they have all left the area. University Telephones will have a permanent home on Steward Street and we believe that will be seen as a advantage by our customers.
Strategy and Implementation Summary
University Telephones will promote the store opening. We will advertise in the university daily student newspaper as well as the university area advertising flyer. In the advertisements for the store opening, we will have a 20% off coupon for product purchases over twenty dollars. We will continue this discount for the first month of operation.
5.1 Competitive Edge
The University Telephones’ competitive edge is:
- Location: University Telephones is located on Steward Street, just a half block from campus. The foot traffic on Steward Street is very strong. University Telephones is sandwiched between a popular student espresso shop and the University Bookstore.
- Customer Service: Robert Conway, owner of University Telephones, has been the manager of the University Bookstore’s electronic department for the past four years and is very familiar with his target customer base. He has an excellent reputation for customer service. Most importantly, the store location will improve customer satisfaction when problems with product or service occur. Customers will value the ability to come into the store between classes to resolve any problems that come up.
5.2 Sales Strategy
The sales strategy of University Telephones is simple. The key to customer satisfaction is having the product and services that meet the customer’s needs. A crucial part of that is to also have knowledgeable employees to help customers find what they want quickly.
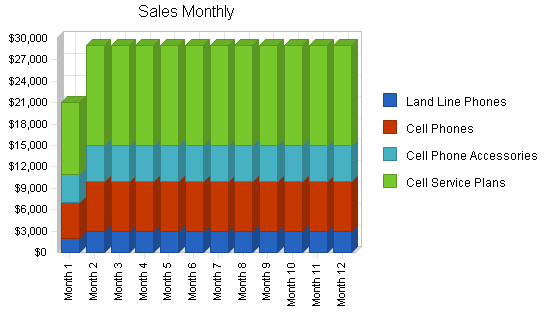
5.2.1 Sales Forecast
The following is University Telephones’ sales forecast for three years.
| Sales Forecast | |||
| Year 1 | Year 2 | Year 3 | |
| Sales | |||
| Land Line Phones | $35,000 | $37,000 | $44,000 |
| Cell Phones | $82,000 | $89,000 | $98,000 |
| Cell Phone Accessories | $59,000 | $63,000 | $72,000 |
| Cell Service Plans | $164,000 | $170,000 | $190,000 |
| Total Sales | $340,000 | $359,000 | $404,000 |
| Direct Cost of Sales | Year 1 | Year 2 | Year 3 |
| Land Line Phones | $8,200 | $9,000 | $1,000 |
| Cell Phones | $18,800 | $20,000 | $25,000 |
| Cell Phone Accessories | $15,300 | $15,000 | $19,000 |
| Cell Service Plans | $117,000 | $118,000 | $121,000 |
| Subtotal Direct Cost of Sales | $159,300 | $162,000 | $166,000 |
Management Summary
Robert Conway, owner of University Telephones, has been an employee of the University Bookstore for the past eleven years. Robert worked as a sales associate at the bookstore during his senior year at State University. After receiving a BA in English, Robert was promoted to Floor Manager. Over the years, Robert developed expertise in electronic products and was a leader in the bookstore’s expansion into electronic products. He was the electronic department’s first manager in 1996. Since then, the department has grown into its own storefront that is adjacent to the bookstore and has its own staff. Robert supervised the growth of the department and developed a reputation as a outstanding manager.

Robert Convey will manage the daily operations of University Telephones.
6.1 Personnel Plan
University Telephones will have a staff of five:
- Manager;
- Store Staff (4).
| Personnel Plan | |||
| Year 1 | Year 2 | Year 3 | |
| Robert Conway | $36,000 | $40,000 | $44,000 |
| Store Staff (4) | $96,000 | $106,000 | $114,000 |
| Other | $0 | $0 | $0 |
| Total People | 5 | 5 | 5 |
| Total Payroll | $132,000 | $146,000 | $158,000 |
Financial Plan
The following is the financial plan for University Telephones.
7.1 Break-even Analysis
The monthly break-even point is approximately $28,300.

| Break-even Analysis | |
| Monthly Revenue Break-even | $28,318 |
| Assumptions: | |
| Average Percent Variable Cost | 47% |
| Estimated Monthly Fixed Cost | $15,050 |
7.2 Projected Balance Sheet
The following table highlights the projected balance sheet for the next three years.
| Pro Forma Balance Sheet | |||
| Year 1 | Year 2 | Year 3 | |
| Assets | |||
| Current Assets | |||
| Cash | $21,509 | $18,733 | $37,092 |
| Inventory | $14,960 | $15,214 | $15,589 |
| Other Current Assets | $0 | $0 | $0 |
| Total Current Assets | $36,469 | $33,946 | $52,682 |
| Long-term Assets | |||
| Long-term Assets | $50,000 | $50,000 | $50,000 |
| Accumulated Depreciation | $2,400 | $4,800 | $7,200 |
| Total Long-term Assets | $47,600 | $45,200 | $42,800 |
| Total Assets | $84,069 | $79,146 | $95,482 |
| Liabilities and Capital | Year 1 | Year 2 | Year 3 |
| Current Liabilities | |||
| Accounts Payable | $17,184 | $16,817 | $17,913 |
| Current Borrowing | $0 | $0 | $0 |
| Other Current Liabilities | $0 | $0 | $0 |
| Subtotal Current Liabilities | $17,184 | $16,817 | $17,913 |
| Long-term Liabilities | $39,200 | $28,400 | $17,600 |
| Total Liabilities | $56,384 | $45,217 | $35,513 |
| Paid-in Capital | $40,000 | $40,000 | $40,000 |
| Retained Earnings | ($8,000) | ($12,315) | ($6,071) |
| Earnings | ($4,315) | $6,244 | $26,040 |
| Total Capital | $27,685 | $33,929 | $59,969 |
| Total Liabilities and Capital | $84,069 | $79,146 | $95,482 |
| Net Worth | $27,685 | $33,929 | $59,969 |
7.3 Projected Profit and Loss
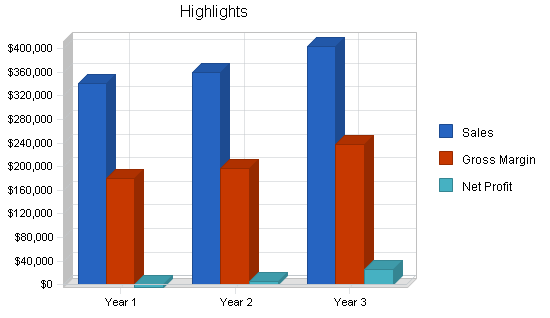
The following table and charts highlight the projected profit and loss for the next three years.


| Pro Forma Profit and Loss | |||
| Year 1 | Year 2 | Year 3 | |
| Sales | $340,000 | $359,000 | $404,000 |
| Direct Cost of Sales | $159,300 | $162,000 | $166,000 |
| Other Production Expenses | $0 | $0 | $0 |
| Total Cost of Sales | $159,300 | $162,000 | $166,000 |
| Gross Margin | $180,700 | $197,000 | $238,000 |
| Gross Margin % | 53.15% | 54.87% | 58.91% |
| Expenses | |||
| Payroll | $132,000 | $146,000 | $158,000 |
| Sales and Marketing and Other Expenses | $0 | $0 | $0 |
| Depreciation | $2,400 | $2,400 | $2,400 |
| Leased Equipment | $0 | $0 | $0 |
| Utilities | $2,400 | $2,400 | $2,400 |
| Insurance | $0 | $0 | $0 |
| Rent | $24,000 | $12,000 | $12,000 |
| Payroll Taxes | $19,800 | $21,900 | $23,700 |
| Other | $0 | $0 | $0 |
| Total Operating Expenses | $180,600 | $184,700 | $198,500 |
| Profit Before Interest and Taxes | $100 | $12,300 | $39,500 |
| EBITDA | $2,500 | $14,700 | $41,900 |
| Interest Expense | $4,415 | $3,380 | $2,300 |
| Taxes Incurred | $0 | $2,676 | $11,160 |
| Net Profit | ($4,315) | $6,244 | $26,040 |
| Net Profit/Sales | -1.27% | 1.74% | 6.45% |
7.4 Projected Cash Flow
The following table and chart highlight the projected cash flow for the next three years.

| Pro Forma Cash Flow | |||
| Year 1 | Year 2 | Year 3 | |
| Cash Received | |||
| Cash from Operations | |||
| Cash Sales | $340,000 | $359,000 | $404,000 |
| Subtotal Cash from Operations | $340,000 | $359,000 | $404,000 |
| Additional Cash Received | |||
| Sales Tax, VAT, HST/GST Received | $0 | $0 | $0 |
| New Current Borrowing | $0 | $0 | $0 |
| New Other Liabilities (interest-free) | $0 | $0 | $0 |
| New Long-term Liabilities | $0 | $0 | $0 |
| Sales of Other Current Assets | $0 | $0 | $0 |
| Sales of Long-term Assets | $0 | $0 | $0 |
| New Investment Received | $0 | $0 | $0 |
| Subtotal Cash Received | $340,000 | $359,000 | $404,000 |
| Expenditures | Year 1 | Year 2 | Year 3 |
| Expenditures from Operations | |||
| Cash Spending | $132,000 | $146,000 | $158,000 |
| Bill Payments | $177,691 | $204,976 | $216,840 |
| Subtotal Spent on Operations | $309,691 | $350,976 | $374,840 |
| Additional Cash Spent | |||
| Sales Tax, VAT, HST/GST Paid Out | $0 | $0 | $0 |
| Principal Repayment of Current Borrowing | $0 | $0 | $0 |
| Other Liabilities Principal Repayment | $0 | $0 | $0 |
| Long-term Liabilities Principal Repayment | $10,800 | $10,800 | $10,800 |
| Purchase Other Current Assets | $0 | $0 | $0 |
| Purchase Long-term Assets | $0 | $0 | $0 |
| Dividends | $0 | $0 | $0 |
| Subtotal Cash Spent | $320,491 | $361,776 | $385,640 |
| Net Cash Flow | $19,509 | ($2,776) | $18,360 |
| Cash Balance | $21,509 | $18,733 | $37,092 |
7.5 Business Ratios
Business ratios for the years of this plan are shown below. Industry profile ratios based on the Standard Industrial Classification (SIC) code 3661, Telephone Equipment, are shown for comparison.
| Ratio Analysis | ||||
| Year 1 | Year 2 | Year 3 | Industry Profile | |
| Sales Growth | 0.00% | 5.59% | 12.53% | 10.50% |
| Percent of Total Assets | ||||
| Inventory | 17.79% | 19.22% | 16.33% | 26.50% |
| Other Current Assets | 0.00% | 0.00% | 0.00% | 31.10% |
| Total Current Assets | 43.38% | 42.89% | 55.17% | 83.50% |
| Long-term Assets | 56.62% | 57.11% | 44.83% | 16.50% |
| Total Assets | 100.00% | 100.00% | 100.00% | 100.00% |
| Current Liabilities | 20.44% | 21.25% | 18.76% | 48.90% |
| Long-term Liabilities | 46.63% | 35.88% | 18.43% | 13.30% |
| Total Liabilities | 67.07% | 57.13% | 37.19% | 62.20% |
| Net Worth | 32.93% | 42.87% | 62.81% | 37.80% |
| Percent of Sales | ||||
| Sales | 100.00% | 100.00% | 100.00% | 100.00% |
| Gross Margin | 53.15% | 54.87% | 58.91% | 41.50% |
| Selling, General & Administrative Expenses | 54.42% | 53.14% | 52.47% | 26.80% |
| Advertising Expenses | 0.00% | 0.00% | 0.00% | 1.00% |
| Profit Before Interest and Taxes | 0.03% | 3.43% | 9.78% | 2.60% |
| Main Ratios | ||||
| Current | 2.12 | 2.02 | 2.94 | 1.71 |
| Quick | 1.25 | 1.11 | 2.07 | 0.97 |
| Total Debt to Total Assets | 67.07% | 57.13% | 37.19% | 62.20% |
| Pre-tax Return on Net Worth | -15.59% | 26.29% | 62.03% | 3.00% |
| Pre-tax Return on Assets | -5.13% | 11.27% | 38.96% | 7.80% |
| Additional Ratios | Year 1 | Year 2 | Year 3 | |
| Net Profit Margin | -1.27% | 1.74% | 6.45% | n.a |
| Return on Equity | -15.59% | 18.40% | 43.42% | n.a |
| Activity Ratios | ||||
| Inventory Turnover | 10.34 | 10.74 | 10.78 | n.a |
| Accounts Payable Turnover | 11.34 | 12.17 | 12.17 | n.a |
| Payment Days | 27 | 30 | 29 | n.a |
| Total Asset Turnover | 4.04 | 4.54 | 4.23 | n.a |
| Debt Ratios | ||||
| Debt to Net Worth | 2.04 | 1.33 | 0.59 | n.a |
| Current Liab. to Liab. | 0.30 | 0.37 | 0.50 | n.a |
| Liquidity Ratios | ||||
| Net Working Capital | $19,285 | $17,129 | $34,769 | n.a |
| Interest Coverage | 0.02 | 3.64 | 17.17 | n.a |
| Additional Ratios | ||||
| Assets to Sales | 0.25 | 0.22 | 0.24 | n.a |
| Current Debt/Total Assets | 20% | 21% | 19% | n.a |
| Acid Test | 1.25 | 1.11 | 2.07 | n.a |
| Sales/Net Worth | 12.28 | 10.58 | 6.74 | n.a |
| Dividend Payout | 0.00 | 0.00 | 0.00 | n.a |
Appendix
| Sales Forecast | |||||||||||||
| Month 1 | Month 2 | Month 3 | Month 4 | Month 5 | Month 6 | Month 7 | Month 8 | Month 9 | Month 10 | Month 11 | Month 12 | ||
| Sales | |||||||||||||
| Land Line Phones | 0% | $2,000 | $3,000 | $3,000 | $3,000 | $3,000 | $3,000 | $3,000 | $3,000 | $3,000 | $3,000 | $3,000 | $3,000 |
| Cell Phones | 0% | $5,000 | $7,000 | $7,000 | $7,000 | $7,000 | $7,000 | $7,000 | $7,000 | $7,000 | $7,000 | $7,000 | $7,000 |
| Cell Phone Accessories | 0% | $4,000 | $5,000 | $5,000 | $5,000 | $5,000 | $5,000 | $5,000 | $5,000 | $5,000 | $5,000 | $5,000 | $5,000 |
| Cell Service Plans | 0% | $10,000 | $14,000 | $14,000 | $14,000 | $14,000 | $14,000 | $14,000 | $14,000 | $14,000 | $14,000 | $14,000 | $14,000 |
| Total Sales | $21,000 | $29,000 | $29,000 | $29,000 | $29,000 | $29,000 | $29,000 | $29,000 | $29,000 | $29,000 | $29,000 | $29,000 | |
| Direct Cost of Sales | Month 1 | Month 2 | Month 3 | Month 4 | Month 5 | Month 6 | Month 7 | Month 8 | Month 9 | Month 10 | Month 11 | Month 12 | |
| Land Line Phones | $500 | $700 | $700 | $700 | $700 | $700 | $700 | $700 | $700 | $700 | $700 | $700 | |
| Cell Phones | $1,200 | $1,600 | $1,600 | $1,600 | $1,600 | $1,600 | $1,600 | $1,600 | $1,600 | $1,600 | $1,600 | $1,600 | |
| Cell Phone Accessories | $1,000 | $1,300 | $1,300 | $1,300 | $1,300 | $1,300 | $1,300 | $1,300 | $1,300 | $1,300 | $1,300 | $1,300 | |
| Cell Service Plans | $7,000 | $10,000 | $10,000 | $10,000 | $10,000 | $10,000 | $10,000 | $10,000 | $10,000 | $10,000 | $10,000 | $10,000 | |
| Subtotal Direct Cost of Sales | $9,700 | $13,600 | $13,600 | $13,600 | $13,600 | $13,600 | $13,600 | $13,600 | $13,600 | $13,600 | $13,600 | $13,600 | |
| Personnel Plan | |||||||||||||
| Month 1 | Month 2 | Month 3 | Month 4 | Month 5 | Month 6 | Month 7 | Month 8 | Month 9 | Month 10 | Month 11 | Month 12 | ||
| Robert Conway | 0% | $3,000 | $3,000 | $3,000 | $3,000 | $3,000 | $3,000 | $3,000 | $3,000 | $3,000 | $3,000 | $3,000 | $3,000 |
| Store Staff (4) | 0% | $8,000 | $8,000 | $8,000 | $8,000 | $8,000 | $8,000 | $8,000 | $8,000 | $8,000 | $8,000 | $8,000 | $8,000 |
| Other | 0% | $0 | $0 | $0 | $0 | $0 | $0 | $0 | $0 | $0 | $0 | $0 | $0 |
| Total People | 5 | 5 | 5 | 5 | 5 | 5 | 5 | 5 | 5 | 5 | 5 | 5 | |
| Total Payroll | $11,000 | $11,000 | $11,000 | $11,000 | $11,000 | $11,000 | $11,000 | $11,000 | $11,000 | $11,000 | $11,000 | $11,000 | |
| General Assumptions | |||||||||||||
| Month 1 | Month 2 | Month 3 | Month 4 | Month 5 | Month 6 | Month 7 | Month 8 | Month 9 | Month 10 | Month 11 | Month 12 | ||
| Plan Month | 1 | 2 | 3 | 4 | 5 | 6 | 7 | 8 | 9 | 10 | 11 | 12 | |
| Current Interest Rate | 10.00% | 10.00% | 10.00% | 10.00% | 10.00% | 10.00% | 10.00% | 10.00% | 10.00% | 10.00% | 10.00% | 10.00% | |
| Long-term Interest Rate | 10.00% | 10.00% | 10.00% | 10.00% | 10.00% | 10.00% | 10.00% | 10.00% | 10.00% | 10.00% | 10.00% | 10.00% | |
| Tax Rate | 30.00% | 30.00% | 30.00% | 30.00% | 30.00% | 30.00% | 30.00% | 30.00% | 30.00% | 30.00% | 30.00% | 30.00% | |
| Other | 0 | 0 | 0 | 0 | 0 | 0 | 0 | 0 | 0 | 0 | 0 | 0 | |
| Pro Forma Profit and Loss | |||||||||||||
| Month 1 | Month 2 | Month 3 | Month 4 | Month 5 | Month 6 | Month 7 | Month 8 | Month 9 | Month 10 | Month 11 | Month 12 | ||
| Sales | $21,000 | $29,000 | $29,000 | $29,000 | $29,000 | $29,000 | $29,000 | $29,000 | $29,000 | $29,000 | $29,000 | $29,000 | |
| Direct Cost of Sales | $9,700 | $13,600 | $13,600 | $13,600 | $13,600 | $13,600 | $13,600 | $13,600 | $13,600 | $13,600 | $13,600 | $13,600 | |
| Other Production Expenses | $0 | $0 | $0 | $0 | $0 | $0 | $0 | $0 | $0 | $0 | $0 | $0 | |
| Total Cost of Sales | $9,700 | $13,600 | $13,600 | $13,600 | $13,600 | $13,600 | $13,600 | $13,600 | $13,600 | $13,600 | $13,600 | $13,600 | |
| Gross Margin | $11,300 | $15,400 | $15,400 | $15,400 | $15,400 | $15,400 | $15,400 | $15,400 | $15,400 | $15,400 | $15,400 | $15,400 | |
| Gross Margin % | 53.81% | 53.10% | 53.10% | 53.10% | 53.10% | 53.10% | 53.10% | 53.10% | 53.10% | 53.10% | 53.10% | 53.10% | |
| Expenses | |||||||||||||
| Payroll | $11,000 | $11,000 | $11,000 | $11,000 | $11,000 | $11,000 | $11,000 | $11,000 | $11,000 | $11,000 | $11,000 | $11,000 | |
| Sales and Marketing and Other Expenses | $0 | $0 | $0 | $0 | $0 | $0 | $0 | $0 | $0 | $0 | $0 | $0 | |
| Depreciation | $200 | $200 | $200 | $200 | $200 | $200 | $200 | $200 | $200 | $200 | $200 | $200 | |
| Leased Equipment | $0 | $0 | $0 | $0 | $0 | $0 | $0 | $0 | $0 | $0 | $0 | $0 | |
| Utilities | $200 | $200 | $200 | $200 | $200 | $200 | $200 | $200 | $200 | $200 | $200 | $200 | |
| Insurance | $0 | $0 | $0 | $0 | $0 | $0 | $0 | $0 | $0 | $0 | $0 | $0 | |
| Rent | $2,000 | $2,000 | $2,000 | $2,000 | $2,000 | $2,000 | $2,000 | $2,000 | $2,000 | $2,000 | $2,000 | $2,000 | |
| Payroll Taxes | 15% | $1,650 | $1,650 | $1,650 | $1,650 | $1,650 | $1,650 | $1,650 | $1,650 | $1,650 | $1,650 | $1,650 | $1,650 |
| Other | $0 | $0 | $0 | $0 | $0 | $0 | $0 | $0 | $0 | $0 | $0 | $0 | |
| Total Operating Expenses | $15,050 | $15,050 | $15,050 | $15,050 | $15,050 | $15,050 | $15,050 | $15,050 | $15,050 | $15,050 | $15,050 | $15,050 | |
| Profit Before Interest and Taxes | ($3,750) | $350 | $350 | $350 | $350 | $350 | $350 | $350 | $350 | $350 | $350 | $350 | |
| EBITDA | ($3,550) | $550 | $550 | $550 | $550 | $550 | $550 | $550 | $550 | $550 | $550 | $550 | |
| Interest Expense | $409 | $402 | $394 | $387 | $379 | $372 | $364 | $357 | $349 | $342 | $334 | $327 | |
| Taxes Incurred | $0 | $0 | $0 | $0 | $0 | $0 | $0 | $0 | $0 | $0 | $0 | $0 | |
| Net Profit | ($4,159) | ($52) | ($44) | ($37) | ($29) | ($22) | ($14) | ($7) | $1 | $8 | $16 | $23 | |
| Net Profit/Sales | -19.81% | -0.18% | -0.15% | -0.13% | -0.10% | -0.07% | -0.05% | -0.02% | 0.00% | 0.03% | 0.05% | 0.08% | |
| Pro Forma Cash Flow | |||||||||||||
| Month 1 | Month 2 | Month 3 | Month 4 | Month 5 | Month 6 | Month 7 | Month 8 | Month 9 | Month 10 | Month 11 | Month 12 | ||
| Cash Received | |||||||||||||
| Cash from Operations | |||||||||||||
| Cash Sales | $21,000 | $29,000 | $29,000 | $29,000 | $29,000 | $29,000 | $29,000 | $29,000 | $29,000 | $29,000 | $29,000 | $29,000 | |
| Subtotal Cash from Operations | $21,000 | $29,000 | $29,000 | $29,000 | $29,000 | $29,000 | $29,000 | $29,000 | $29,000 | $29,000 | $29,000 | $29,000 | |
| Additional Cash Received | |||||||||||||
| Sales Tax, VAT, HST/GST Received | 0.00% | $0 | $0 | $0 | $0 | $0 | $0 | $0 | $0 | $0 | $0 | $0 | $0 |
| New Current Borrowing | $0 | $0 | $0 | $0 | $0 | $0 | $0 | $0 | $0 | $0 | $0 | $0 | |
| New Other Liabilities (interest-free) | $0 | $0 | $0 | $0 | $0 | $0 | $0 | $0 | $0 | $0 | $0 | $0 | |
| New Long-term Liabilities | $0 | $0 | $0 | $0 | $0 | $0 | $0 | $0 | $0 | $0 | $0 | $0 | |
| Sales of Other Current Assets | $0 | $0 | $0 | $0 | $0 | $0 | $0 | $0 | $0 | $0 | $0 | $0 | |
| Sales of Long-term Assets | $0 | $0 | $0 | $0 | $0 | $0 | $0 | $0 | $0 | $0 | $0 | $0 | |
| New Investment Received | $0 | $0 | $0 | $0 | $0 | $0 | $0 | $0 | $0 | $0 | $0 | $0 | |
| Subtotal Cash Received | $21,000 | $29,000 | $29,000 | $29,000 | $29,000 | $29,000 | $29,000 | $29,000 | $29,000 | $29,000 | $29,000 | $29,000 | |
| Expenditures | Month 1 | Month 2 | Month 3 | Month 4 | Month 5 | Month 6 | Month 7 | Month 8 | Month 9 | Month 10 | Month 11 | Month 12 | |
| Expenditures from Operations | |||||||||||||
| Cash Spending | $11,000 | $11,000 | $11,000 | $11,000 | $11,000 | $11,000 | $11,000 | $11,000 | $11,000 | $11,000 | $11,000 | $11,000 | |
| Bill Payments | $142 | $4,534 | $12,689 | $17,844 | $17,836 | $17,829 | $17,821 | $17,814 | $17,806 | $17,799 | $17,791 | $17,784 | |
| Subtotal Spent on Operations | $11,142 | $15,534 | $23,689 | $28,844 | $28,836 | $28,829 | $28,821 | $28,814 | $28,806 | $28,799 | $28,791 | $28,784 | |
| Additional Cash Spent | |||||||||||||
| Sales Tax, VAT, HST/GST Paid Out | $0 | $0 | $0 | $0 | $0 | $0 | $0 | $0 | $0 | $0 | $0 | $0 | |
| Principal Repayment of Current Borrowing | $0 | $0 | $0 | $0 | $0 | $0 | $0 | $0 | $0 | $0 | $0 | $0 | |
| Other Liabilities Principal Repayment | $0 | $0 | $0 | $0 | $0 | $0 | $0 | $0 | $0 | $0 | $0 | $0 | |
| Long-term Liabilities Principal Repayment | $900 | $900 | $900 | $900 | $900 | $900 | $900 | $900 | $900 | $900 | $900 | $900 | |
| Purchase Other Current Assets | $0 | $0 | $0 | $0 | $0 | $0 | $0 | $0 | $0 | $0 | $0 | $0 | |
| Purchase Long-term Assets | $0 | $0 | $0 | $0 | $0 | $0 | $0 | $0 | $0 | $0 | $0 | $0 | |
| Dividends | $0 | $0 | $0 | $0 | $0 | $0 | $0 | $0 | $0 | $0 | $0 | $0 | |
| Subtotal Cash Spent | $12,042 | $16,434 | $24,589 | $29,744 | $29,736 | $29,729 | $29,721 | $29,714 | $29,706 | $29,699 | $29,691 | $29,684 | |
| Net Cash Flow | $8,958 | $12,566 | $4,411 | ($744) | ($736) | ($729) | ($721) | ($714) | ($706) | ($699) | ($691) | ($684) | |
| Cash Balance | $10,958 | $23,524 | $27,934 | $27,190 | $26,454 | $25,725 | $25,004 | $24,290 | $23,583 | $22,884 | $22,193 | $21,509 | |
| Pro Forma Balance Sheet | |||||||||||||
| Month 1 | Month 2 | Month 3 | Month 4 | Month 5 | Month 6 | Month 7 | Month 8 | Month 9 | Month 10 | Month 11 | Month 12 | ||
| Assets | Starting Balances | ||||||||||||
| Current Assets | |||||||||||||
| Cash | $2,000 | $10,958 | $23,524 | $27,934 | $27,190 | $26,454 | $25,725 | $25,004 | $24,290 | $23,583 | $22,884 | $22,193 | $21,509 |
| Inventory | $30,000 | $20,300 | $14,960 | $14,960 | $14,960 | $14,960 | $14,960 | $14,960 | $14,960 | $14,960 | $14,960 | $14,960 | $14,960 |
| Other Current Assets | $0 | $0 | $0 | $0 | $0 | $0 | $0 | $0 | $0 | $0 | $0 | $0 | $0 |
| Total Current Assets | $32,000 | $31,258 | $38,484 | $42,894 | $42,150 | $41,414 | $40,685 | $39,964 | $39,250 | $38,543 | $37,844 | $37,153 | $36,469 |
| Long-term Assets | |||||||||||||
| Long-term Assets | $50,000 | $50,000 | $50,000 | $50,000 | $50,000 | $50,000 | $50,000 | $50,000 | $50,000 | $50,000 | $50,000 | $50,000 | $50,000 |
| Accumulated Depreciation | $0 | $200 | $400 | $600 | $800 | $1,000 | $1,200 | $1,400 | $1,600 | $1,800 | $2,000 | $2,200 | $2,400 |
| Total Long-term Assets | $50,000 | $49,800 | $49,600 | $49,400 | $49,200 | $49,000 | $48,800 | $48,600 | $48,400 | $48,200 | $48,000 | $47,800 | $47,600 |
| Total Assets | $82,000 | $81,058 | $88,084 | $92,294 | $91,350 | $90,414 | $89,485 | $88,564 | $87,650 | $86,743 | $85,844 | $84,953 | $84,069 |
| Liabilities and Capital | Month 1 | Month 2 | Month 3 | Month 4 | Month 5 | Month 6 | Month 7 | Month 8 | Month 9 | Month 10 | Month 11 | Month 12 | |
| Current Liabilities | |||||||||||||
| Accounts Payable | $0 | $4,117 | $12,095 | $17,249 | $17,242 | $17,235 | $17,228 | $17,220 | $17,213 | $17,206 | $17,199 | $17,191 | $17,184 |
| Current Borrowing | $0 | $0 | $0 | $0 | $0 | $0 | $0 | $0 | $0 | $0 | $0 | $0 | $0 |
| Other Current Liabilities | $0 | $0 | $0 | $0 | $0 | $0 | $0 | $0 | $0 | $0 | $0 | $0 | $0 |
| Subtotal Current Liabilities | $0 | $4,117 | $12,095 | $17,249 | $17,242 | $17,235 | $17,228 | $17,220 | $17,213 | $17,206 | $17,199 | $17,191 | $17,184 |
| Long-term Liabilities | $50,000 | $49,100 | $48,200 | $47,300 | $46,400 | $45,500 | $44,600 | $43,700 | $42,800 | $41,900 | $41,000 | $40,100 | $39,200 |
| Total Liabilities | $50,000 | $53,217 | $60,295 | $64,549 | $63,642 | $62,735 | $61,828 | $60,920 | $60,013 | $59,106 | $58,199 | $57,291 | $56,384 |
| Paid-in Capital | $40,000 | $40,000 | $40,000 | $40,000 | $40,000 | $40,000 | $40,000 | $40,000 | $40,000 | $40,000 | $40,000 | $40,000 | $40,000 |
| Retained Earnings | ($8,000) | ($8,000) | ($8,000) | ($8,000) | ($8,000) | ($8,000) | ($8,000) | ($8,000) | ($8,000) | ($8,000) | ($8,000) | ($8,000) | ($8,000) |
| Earnings | $0 | ($4,159) | ($4,211) | ($4,255) | ($4,292) | ($4,321) | ($4,343) | ($4,357) | ($4,363) | ($4,363) | ($4,354) | ($4,338) | ($4,315) |
| Total Capital | $32,000 | $27,841 | $27,789 | $27,745 | $27,708 | $27,679 | $27,658 | $27,643 | $27,637 | $27,637 | $27,646 | $27,662 | $27,685 |
| Total Liabilities and Capital | $82,000 | $81,058 | $88,084 | $92,294 | $91,350 | $90,414 | $89,485 | $88,564 | $87,650 | $86,743 | $85,844 | $84,953 | $84,069 |
| Net Worth | $32,000 | $27,841 | $27,789 | $27,745 | $27,708 | $27,679 | $27,658 | $27,643 | $27,637 | $27,638 | $27,646 | $27,662 | $27,685 |

