
Roth & Calder Telemarketing Professionals, Inc.
Executive Summary
Introduction
It is the mission of Roth & Calder Telemarketing Professionals, Inc. (R&C) to provide comprehensive telemarketing consultation and creation of telemarketing advertising campaigns for our clients in the Cawleweton region. It is our long-term goal to become THE preferred business-to-business telemarketing agency for the East Coast area. Our firm is not interested in simply producing a service for our clients. We believe in creating a long-term relationship with them so that the delivery of their message can reach the right people, at the right moment to insure effective communication with their market.
The Company
Roth & Calder will be a limited liability partnership registered in the state of Delaware for tax purposes. Its founder is Mr. Thomas Roth, a former marketing executive with General Foods. Mr. Roth has brought together a highly respected group of marketing, development, and telemarketing specialists who, combined, have a total of 25 years of experience in this industry.
The company has a limited number of private investors and does not plan to go public. The company has its main offices in Cawleweton. The facilities include conference rooms and office spaces. The company expects to begin offering its services in January of Year 1.
The company’s potential clients will initially be all the companies in the Cawleweton area. We can service both small and large companies and provide virtually any consultation services in regards to telephone communications with clients.
The Services
In order to create the maximum effect for our clients, we provide a comprehensive program for them that may include some of the following services:
- Identification of Program Objectives and Expectations
- Creation of customized lists of leads
- Market research
- Consultation and training of telemarketing personnel
- Script writing for programs
- Creation of follow-up programs for successful calls.
This is only a partial list of our services as each project is customized to our client and its scope, length, depth, reach, and cost are unique.
The Market
The telemarketing industry is, at the moment, a growing industry with most companies having an annual growth between 6.5% and 8%. This is due to businesses that are becoming increasingly aware of the need for market information and the desire to reduce customer turnover rates in a hard hit economy. However, long-term analysis of growth rates in this industry shows a cyclical pattern and R&C does not expect this high growth rate to continue.
The telemarketing industry is quite fragmented with companies that vary greatly in size, scope, services offered, and market share. Many companies are general advertising agencies that offer telemarketing services along with a wide range of other consulting services. In addition, many companies, not realizing the potential advantages of outsourcing, choose to develop their own telemarketing services.
R&C believes that the greatest threat at the moment is in new entrants to the market who perceive an opportunity in a “high” growth industry. The most likely entrants will be existing advertising agencies wishing to horizontally integrate and enter new sub-markets. However, the one major disadvantage to new entrants is that all firms engaged in contracting to telemarketing agencies face significant switching costs when bringing on a new partner. Furthermore, R&C understands that in this industry there is a significant learning curve that creates declining “unit” costs as a firm gains more cumulative experience in the field itself and with long-term clients specifically.
Rivalry among different telemarketing agencies as stated before is quite intense. The telemarketing industry as a whole is mature with long-term moderate growth. Most of the largest agencies are mutually dependent when it comes to jockeying for position and market share. The fact that there are so many diverse and seemingly “generic” or general telemarketing agencies makes this a cutthroat industry.
The threat of clients backwardly integrating so as to have all their advertising done in-house is one of the major factors that buyers use to indirectly control price in this industry, and increase competition among firms. This must always be foremost in the minds of R&C’s management when offering services and setting prices.
Financial Considerations
Start-up assets required include expenses and cash needed to support operations until revenues reach an acceptable level. Most of the company’s liabilities will come from outside private investors and management investment, however, we have obtained current borrowing from Bank of America Commercial Investments, the principal to be paid off in three years. A long-term loan through VieilArgent Bank of Richburb will be paid off in ten years.

1.1 Objectives
The Three-year goals for Roth & Calder Telemarketing Professionals, Inc. are as follows.
- Achieve break-even by year two.
- Establish a regional (East Coast) scope for operations within five years and a national presence within 10 years.
- Establish minimum 95% customer satisfaction rate to establish long-term relationships with our clients and create a viable reputation.
1.2 Mission
It is the mission of Roth & Calder Telemarketing Professionals, Inc. (R&C) to provide comprehensive telemarketing consultation, and creation of telemarketing advertising campaigns for our clients in the Cawleweton region. It is our long-term goal to become THE preferred business-to-business telemarketing agency for the East Coast area. Our firm is not interested in simply producing a service for our clients. We believe in creating a long-term relationship with them so that the delivery of their message can reach the right people, at the right moment to insure effective communication with their market.
R&C is strictly a business-to-business company and seeks to provide answers to companies who desire to communicate with their customers via the phone. This can take the shape of advertising, surveys, seminar and conference invitations, etc. R&C has a combined 25 years of experience working with companies in delivering effective and professional telemarketing techniques.
1.3 Keys to Success
R&C’s keys to long-term survivability and profitability are as follows:
- Differentiate our services so that our clients realize that we are able to better serve their needs rather than a more generic competitor or in-house telemarketing.
- Keeping close contact with clients and establishing a well functioning long-term relationship with them to generate repeat business and a top notch reputation.
- Establish a comprehensive service experience for our clients that includes consultation, analysis of telemarketing campaign goals and target markets, creation of streamlined and custom advertising campaigns based on needs, expectations, implementation, and follow-up analysis.
Company Summary
Roth & Calder will be a limited liability partnership registered in the state of Delaware for tax purposes. Its founder is Mr. Thomas Roth, formerly a marketing executive with General Foods. Mr. Roth has brought together a highly respected group of marketing, development, and telemarketing specialists who, combined, have a total of 25 years of experience in this industry.
The company has a limited number of private investors and does not plan to go public. The company has its main offices in Cawleweton. The facilities include conference rooms and office spaces. The company expects to begin offering its services in January.
The company’s potential clients will initially be all the companies in the Cawleweton area. We can service both small and large companies and provide virtually any consultation services in regards to telephone communications with clients.

2.1 Company Ownership
The company will have a number of outside private investors who will own 27% of the company’s shares. The rest will be owned by the senior management including Mr. Thomas Roth, (25%), Ms. Jane Calder (20%), Mrs. Susan Howell, (20%), and Mr. Leonard Gray (8%). All other financing will come from loans.
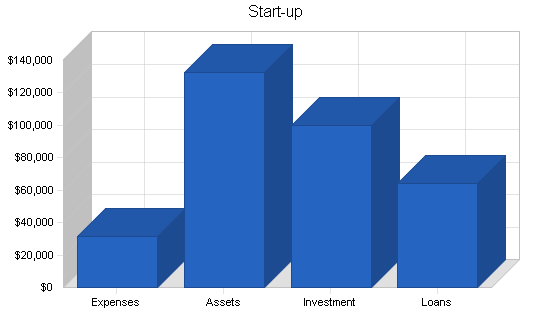
2.2 Start-up Summary
Start-up assets required include equipment, and additional expenses as well as cash to support operations until revenues reach an acceptable level. Most of the company’s liabilities will come from outside private investors and management investment, however, we have obtained current borrowing from Bank of America Commercial Investments, the principal to be paid off in three years. A long-term loan through VieilArgent Bank of Richburb will be paid off in ten years.
| Start-up | |
| Requirements | |
| Start-up Expenses | |
| Legal | $2,000 |
| Insurance | $1,000 |
| Utilities | $200 |
| Rent | $2,000 |
| Accounting and bookkeeping fees | $2,000 |
| Expensed equipment | $10,000 |
| Advertising | $6,500 |
| Other | $8,000 |
| Total Start-up Expenses | $31,700 |
| Start-up Assets | |
| Cash Required | $117,300 |
| Other Current Assets | $5,000 |
| Long-term Assets | $10,000 |
| Total Assets | $132,300 |
| Total Requirements | $164,000 |
| Start-up Funding | |
| Start-up Expenses to Fund | $31,700 |
| Start-up Assets to Fund | $132,300 |
| Total Funding Required | $164,000 |
| Assets | |
| Non-cash Assets from Start-up | $15,000 |
| Cash Requirements from Start-up | $117,300 |
| Additional Cash Raised | $0 |
| Cash Balance on Starting Date | $117,300 |
| Total Assets | $132,300 |
| Liabilities and Capital | |
| Liabilities | |
| Current Borrowing | $16,000 |
| Long-term Liabilities | $45,000 |
| Accounts Payable (Outstanding Bills) | $3,000 |
| Other Current Liabilities (interest-free) | $0 |
| Total Liabilities | $64,000 |
| Capital | |
| Planned Investment | |
| Mr. Thomas Roth | $25,000 |
| Ms. Jane Calder | $20,000 |
| Mrs. Susan Howell | $20,000 |
| Mr. Leonard Grey | $8,000 |
| Others | $27,000 |
| Additional Investment Requirement | $0 |
| Total Planned Investment | $100,000 |
| Loss at Start-up (Start-up Expenses) | ($31,700) |
| Total Capital | $68,300 |
| Total Capital and Liabilities | $132,300 |
| Total Funding | $164,000 |
Services
Roth & Calder offers a complete, custom telemarketing campaign. The most common telemarketing campaigns are for the following purposes:
- Generate sales leads
- Set appointments
- Market research
- Surveys (including statistical analysis and political surveys)
- Driving eyeballs to websites
- Trial subscriptions
- Database or mailing list information
- Business development
- Point-of-sale product promotion
- Seminar and conference invitations.
In order to create the maximum effect for our clients, we provide a comprehensive program for them that may include some of the following services:
- Identification of Program Objectives and Expectations.
- Creation of customized lists of leads
- Market research
- Consultation and training of telemarketing personnel
- Script writing for programs
- Creation of follow-up programs for successful calls.
This is only a partial list of our services as each project is customized to our client and its scope, length, depth, reach, and cost are unique.
Market Analysis Summary
The telemarketing industry is, at the moment, a growing industry with most companies having an annual growth between 6.5% and 8%. This is due to businesses that are becoming increasingly aware of the need for market information and the desire to reduce customer turnover rates in a hard hit economy. However, long-term analysis of growth rates in this industry shows a cyclical pattern and R&C does not expect this high growth rate to continue.
The telemarketing industry is quite fragmented with companies that vary greatly in size, scope, services offered, and market share. Many companies are general advertising agencies that offer telemarketing services along with a wide range of other consulting services. In addition, many companies, not realizing the potential advantages of outsourcing, choose to develop their own telemarketing services.
Roth & Calder Telemarketing Professionals’ business strategy is to establish a focused approach to its services rather than being everything to its clients. Our company does not intend to be a call center, nor will it ever become so. We are a consulting firm that designs telemarketing campaigns for its clients and matches these clients with the appropriate call center who has the necessary capabilities. These services are where we can offer a higher standard of quality to our clients. This will allow us to charge a higher profit margin to our clients for these differentiated and more focused services. This will also require average project times to be somewhat longer, and therefore we expect initial profitability levels to be lower than average.
4.1 Market Segmentation
Virtually every company, whether large and small, requires some form of telemarketing at some point. Often it is a survey to determine customer satisfaction or awareness. Sometimes it is effectively communicating an upcoming event such as a conference. Other companies wish to know if telemarketing is a feasible method of sales generation. Because of this almost universal need for some form of telemarketing consultation that spans almost all industries, R&C has decided not to create any market segments it wishes to concentrate on nor focus on a target market. We have the capacity to service almost any company of whatever size. We think that at this point in the company’s history, any attempt to target specific markets would hinder our growth potential.
The market analysis table and chart which follows shows the number of businesses within the greater Cawleweton region. This will be our geographical focus for the first 4-5 years of our company’s existance. Later, as we expand to an East Coast, and then a nationwide scope, our future business plans will include all of our potential clients across the country.
| Market Analysis | |||||||
| Year 1 | Year 2 | Year 3 | Year 4 | Year 5 | |||
| Potential Customers | Growth | CAGR | |||||
| Total companies within the Atlanta area | 4% | 13,400 | 13,869 | 14,354 | 14,856 | 15,376 | 3.50% |
| Other | 0% | 0 | 0 | 0 | 0 | 0 | 0.00% |
| Total | 3.50% | 13,400 | 13,869 | 14,354 | 14,856 | 15,376 | 3.50% |
4.2 Service Business Analysis
The telemarketing industry is, at the moment, a growing industry with most companies having an annual growth between 6.5% and 8%. This is due to businesses that are becoming increasingly aware of the need for market information and the desire to reduce customer turnover rates in a hard hit economy. However, long-term analysis of growth rates in this industry shows a cyclical pattern and R&C does not expect this high growth rate to continue.
The telemarketing industry is quite fragmented with companies that vary greatly in size, scope, services offered, and market share. Many companies are general advertising agencies that offer telemarketing services along with a wide range of other consulting services. In addition, many companies, not realizing the potential advantages of outsourcing, choose to develop their own telemarketing services.
R&C believes that the greatest threat at the moment is in new entrants to the market who perceive an opportunity in a “high” growth industry. The most likely entrants will be existing advertising agencies wishing to horizontally integrate and enter new sub-markets. However, the one major disadvantage to new entrants is that all firms engaged in contracting to telemarketing agencies face significant switching costs when bringing on a new partner. Furthermore, R&C understands that in this industry there is a significant learning curve that creates declining “unit” costs as a firm gains more cumulative experience in the field itself and with long-term clients specifically.
Rivalry among different telemarketing agencies as stated before is quite intense. The telemarketing industry as a whole is mature with long-term moderate growth. Most of the largest agencies are mutually dependent when it comes to jockeying for position and market share. The fact that there are so many diverse and seemingly “generic” or general telemarketing agencies makes this a cutthroat industry.
The threat of clients backwardly integrating so as to have all their advertising done in-house is one of the major factors that buyers use to indirectly control price in this industry, and increase competition among firms. This must always be foremost in the minds of R&C’s management when offering services and setting prices.
4.2.1 Competition and Buying Patterns
Competition
Competition includes all potential advertising and telemarketing agencies plus call centers across the country. In addition we have indirect competition from organizations that handle all their telemarketing in-house. Practically speaking, this means we have the greatest threat from the largest telemarketing agencies such as Davis & Henke, Ludquist telemarketing, and other big, nationwide consulting companies that hold significant market share. The telemarketing consultation industry is highly fragmented, with a large number of small companies that mainly cater to small firms and a few large companies that seek the largest contracts from companies such as Sprint, GM, etc. This makes competition within the industry very intense. Through our focused strategy we intend to avoid such a debilitating environment and avoid its drawbacks such as price wars, etc.
Buying patterns and needs
Companies usually enter into contracts with telemarketing agencies based on their reputation of professionalism and effective campaigns in the past. This reputation is difficult to obtain by new firms unless its personnel bring it with them from previous companies such as ours. Price and scope are also important reasons for accepting contracts, especially if the company is small.
Strategy and Implementation Summary
Roth & Calder Telemarketing Professionals’ business strategy is to establish a focused approach to its services rather than being everything to its clients. Our company does not intend to be a call center, nor will it ever become so. We are a consulting firm that designs telemarketing campaigns for its clients and matches these clients with the appropriate call center who has the necessary capabilities. These services are where we can offer a higher standard of quality to our clients. This will allow us to charge a higher profit margin to our clients for these differentiated and more focused services. This will also require average project times to be somewhat longer, and therefore we expect initial profitability levels to be lower than average.
5.1 Marketing Strategy
In order to attract clients, R&C will begin to contact promising organizations and offer free initial consultations, and initial contracts at reduced prices. These promotions will allow us to begin to make our reputation. In addition, Mr. Roth and Ms. Calder will be traveling to six conventions across the Eastern part of the country during the first year of operations where we will have booths to advertise our services. Finally we will be setting up cold calls to potential clients and have half- and full-page advertisements in various publications catering to local businesses and organizations.
5.2 Sales Strategy
R&C’s management will be focusing on leveraging its employee’s established reputations and contacts in the telemarketing industry to generate contracts. Both Mr. Roth and Ms. Calder have been in the industry for many years and experience shows that many of their existing clients will still wish to work with them despite having to establish new contracts with R&C. We also understand that we may need to lower prices in our first couple of years in order to attract new customers and close deals.
Mr. Roth has been actively seeking to acquire a large contract with Magraw Construction over the past seven months. This company is the largest single residential contractor on the East Coast and has been seeking a telemarketing consultant for a customer survey project to be launched in the near future. R&C believes that its chances of acquiring this contract are excellent.
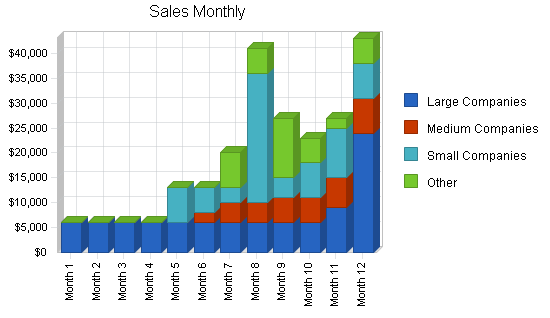
5.2.1 Sales Forecast
Sales forecasts are based on the various contract projects we anticipate acquiring. Anticipated revenues are based on average costs per project based on estimated time and complexity of project plus an undisclosed profit margin. The company does not have any significant direct costs of sales. We have broken up our total projected sales into the various size companies we expect to attract as clients.
- Large companies – predominently large projects
- Medium companies – varied projects
- Small companies – mostly small projects
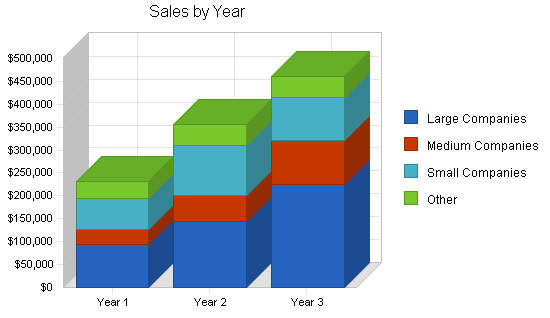
| Sales Forecast | |||
| Year 1 | Year 2 | Year 3 | |
| Sales | |||
| Large Companies | $93,000 | $145,000 | $224,000 |
| Medium Companies | $33,000 | $56,000 | $98,000 |
| Small Companies | $69,000 | $110,000 | $93,000 |
| Other | $36,000 | $45,000 | $45,000 |
| Total Sales | $231,000 | $356,000 | $460,000 |
| Direct Cost of Sales | Year 1 | Year 2 | Year 3 |
| All client projects | $0 | $0 | $0 |
| Other | $0 | $0 | $0 |
| Subtotal Direct Cost of Sales | $0 | $0 | $0 |
Management Summary
The company will have four officers: President, Mr. Thomas Roth; Head of Operations, Ms. Jane Calder; plus two telemarketing consultants. We will also hire an office manager, and someone to do cold calls. The company plans to hire additional consultants and administrative personnel as we begin to get large numbers of contracts.
6.1 Personnel
R&C’s management brings to the company strong capabilities in creative flair, research, and a unique combination of skills drawn from other businesses.
Mr. Thomas Roth just recently left a position as marketing executive with General Foods and has many years of experience working with telemarketing programs. Among the companies Mr. Roth has previously worked for are Lucas Advertising, McDonald Pollsters, and Capital Investments. Mr. Roth has successfully launched numerous telemarketing campaigns with these organizations including customer surveys, political surveys, and product introductions. Mr. Roth has an MBA in Marketing and an BS in International Relations.
Ms. Jane Calder, who has a Bachelors degree in marketing, worked for Ford Motor Company from 1978-1988 as an advertising executive. In 1989 she went to work for Anderson Consulting in their marketing and advertising division. Four years later Ms. Calder went to work as information campaign consultant for Senator Offenbaughten of Bigstate.
| Personnel Plan | |||
| Year 1 | Year 2 | Year 3 | |
| Mr. Thomas Roth – President | $36,000 | $36,000 | $60,000 |
| Ms. Jane Calder – Operations Head/Principal Consultant | $36,000 | $36,000 | $60,000 |
| Mrs. Susan Howell – Telemarketing Consultant | $36,000 | $36,000 | $45,000 |
| Mr. Leonard Grey – Telemarketing Consultant | $36,000 | $36,000 | $36,000 |
| Office Manager | $20,400 | $22,000 | $22,000 |
| Cold Caller | $13,440 | $15,000 | $0 |
| Total People | 6 | 6 | 5 |
| Total Payroll | $177,840 | $181,000 | $223,000 |
Financial Plan
Our financial plan anticipates one year of negative profits as we gain sales volume. We have budgeted enough investment to cover these losses and have an additional credit line available if sales do not match predictions.
Annual financial data is presented with associated topics. Monthly table data is provided in the Appendix.
7.1 Important Assumptions
We are assuming approximately 75% sales on credit and average interest rates below 10%. These are considered to be conservative in case our predictions are erroneous.
| General Assumptions | |||
| Year 1 | Year 2 | Year 3 | |
| Plan Month | 1 | 2 | 3 |
| Current Interest Rate | 10.00% | 10.00% | 10.00% |
| Long-term Interest Rate | 8.00% | 8.00% | 8.00% |
| Tax Rate | 30.00% | 30.00% | 30.00% |
| Other | 0 | 0 | 0 |
7.2 Break-even Analysis
Our break-even analysis is based on the assumption that our gross margin is 100%. In other words, we will have insignificant direct cost of sales. Since each project will be of different scope, length, and complexity, it is difficult to assign an average per unit revenue figure. However, it is conservatively believed that during the first three years, average profitability per month per “segment” (based on client size) will be about $8,000. This is because, at first, we will be dealing with smaller companies that have smaller projects. We expect that about three to four projects per month will guarantee a break-even point, for the first year, averaged over 12 months.

| Break-even Analysis | |
| Monthly Revenue Break-even | $22,210 |
| Assumptions: | |
| Average Percent Variable Cost | 0% |
| Estimated Monthly Fixed Cost | $22,210 |
7.3 Projected Profit and Loss
The following table itemizes our revenues and associated costs. We expect to be paying higher costs in marketing and advertising than other companies as we attempt to build sales volume. As the reader can see, we expect monthly profits to begin in third quarter 2004 and yearly profits to occur in 2005.


| Pro Forma Profit and Loss | |||
| Year 1 | Year 2 | Year 3 | |
| Sales | $231,000 | $356,000 | $460,000 |
| Direct Cost of Sales | $0 | $0 | $0 |
| Other Costs of Sales | $1,200 | $0 | $0 |
| Total Cost of Sales | $1,200 | $0 | $0 |
| Gross Margin | $229,800 | $356,000 | $460,000 |
| Gross Margin % | 99.48% | 100.00% | 100.00% |
| Expenses | |||
| Payroll | $177,840 | $181,000 | $223,000 |
| Sales and Marketing and Other Expenses | $12,000 | $24,000 | $24,000 |
| Depreciation | $0 | $2,500 | $2,500 |
| Rent | $12,000 | $12,000 | $13,000 |
| Utilities | $3,600 | $3,600 | $4,000 |
| Insurance | $3,000 | $3,000 | $3,000 |
| Payroll Taxes | $26,676 | $27,150 | $33,450 |
| Travel | $24,200 | $12,000 | $10,000 |
| Other | $7,200 | $8,000 | $10,000 |
| Total Operating Expenses | $266,516 | $273,250 | $322,950 |
| Profit Before Interest and Taxes | ($36,716) | $82,750 | $137,050 |
| EBITDA | ($36,716) | $85,250 | $139,550 |
| Interest Expense | $5,021 | $4,420 | $3,440 |
| Taxes Incurred | $0 | $23,499 | $40,083 |
| Net Profit | ($41,737) | $54,831 | $93,527 |
| Net Profit/Sales | -18.07% | 15.40% | 20.33% |
7.4 Projected Cash Flow
The following is our cash flow table and chart. We do not expect to have any short-term cash flow problems even though we will be operating at a loss for the first year. Our short-term loan will be repaid by the end of 2006. Our long-term loan will be paid off in ten years.

| Pro Forma Cash Flow | |||
| Year 1 | Year 2 | Year 3 | |
| Cash Received | |||
| Cash from Operations | |||
| Cash Sales | $57,750 | $89,000 | $115,000 |
| Cash from Receivables | $121,425 | $238,956 | $321,668 |
| Subtotal Cash from Operations | $179,175 | $327,956 | $436,668 |
| Additional Cash Received | |||
| Sales Tax, VAT, HST/GST Received | $0 | $0 | $0 |
| New Current Borrowing | $0 | $0 | $0 |
| New Other Liabilities (interest-free) | $0 | $0 | $0 |
| New Long-term Liabilities | $0 | $0 | $0 |
| Sales of Other Current Assets | $0 | $0 | $0 |
| Sales of Long-term Assets | $0 | $0 | $0 |
| New Investment Received | $3,000 | $0 | $0 |
| Subtotal Cash Received | $182,175 | $327,956 | $436,668 |
| Expenditures | Year 1 | Year 2 | Year 3 |
| Expenditures from Operations | |||
| Cash Spending | $177,840 | $181,000 | $223,000 |
| Bill Payments | $89,413 | $116,481 | $139,058 |
| Subtotal Spent on Operations | $267,253 | $297,481 | $362,058 |
| Additional Cash Spent | |||
| Sales Tax, VAT, HST/GST Paid Out | $0 | $0 | $0 |
| Principal Repayment of Current Borrowing | $2,000 | $6,000 | $8,000 |
| Other Liabilities Principal Repayment | $0 | $0 | $0 |
| Long-term Liabilities Principal Repayment | $2,000 | $3,000 | $4,000 |
| Purchase Other Current Assets | $0 | $7,000 | $10,000 |
| Purchase Long-term Assets | $0 | $0 | $0 |
| Dividends | $15,000 | $20,000 | $56,000 |
| Subtotal Cash Spent | $286,253 | $333,481 | $440,058 |
| Net Cash Flow | ($104,078) | ($5,525) | ($3,390) |
| Cash Balance | $13,222 | $7,697 | $4,307 |
7.5 Projected Balance Sheet
The Projected Balance Sheet is shown below.
| Pro Forma Balance Sheet | |||
| Year 1 | Year 2 | Year 3 | |
| Assets | |||
| Current Assets | |||
| Cash | $13,222 | $7,697 | $4,307 |
| Accounts Receivable | $51,825 | $79,869 | $103,201 |
| Other Current Assets | $5,000 | $12,000 | $22,000 |
| Total Current Assets | $70,047 | $99,566 | $129,508 |
| Long-term Assets | |||
| Long-term Assets | $10,000 | $10,000 | $10,000 |
| Accumulated Depreciation | $0 | $2,500 | $5,000 |
| Total Long-term Assets | $10,000 | $7,500 | $5,000 |
| Total Assets | $80,047 | $107,066 | $134,508 |
| Liabilities and Capital | Year 1 | Year 2 | Year 3 |
| Current Liabilities | |||
| Accounts Payable | $8,484 | $9,671 | $11,587 |
| Current Borrowing | $14,000 | $8,000 | $0 |
| Other Current Liabilities | $0 | $0 | $0 |
| Subtotal Current Liabilities | $22,484 | $17,671 | $11,587 |
| Long-term Liabilities | $43,000 | $40,000 | $36,000 |
| Total Liabilities | $65,484 | $57,671 | $47,587 |
| Paid-in Capital | $103,000 | $103,000 | $103,000 |
| Retained Earnings | ($46,700) | ($108,437) | ($109,606) |
| Earnings | ($41,737) | $54,831 | $93,527 |
| Total Capital | $14,563 | $49,394 | $86,921 |
| Total Liabilities and Capital | $80,047 | $107,066 | $134,508 |
| Net Worth | $14,563 | $49,394 | $86,921 |
7.6 Business Ratios
We have included industry standard ratios from the advertising consultant industry, Standard Industrial Classification (SIC) code 7311.9901, to compare with ours. As this is a new sub-market of the overall industry, we expect some significant differences especially in sales growth, financing ratios, long-term asset investments and net worth. However, our projections indicate a healthy company that will be able to obtain land retain long-term profitability.
| Ratio Analysis | ||||
| Year 1 | Year 2 | Year 3 | Industry Profile | |
| Sales Growth | 0.00% | 54.11% | 29.21% | 5.46% |
| Percent of Total Assets | ||||
| Accounts Receivable | 64.74% | 74.60% | 76.72% | 32.83% |
| Other Current Assets | 6.25% | 11.21% | 16.36% | 43.34% |
| Total Current Assets | 87.51% | 92.99% | 96.28% | 79.45% |
| Long-term Assets | 12.49% | 7.01% | 3.72% | 20.55% |
| Total Assets | 100.00% | 100.00% | 100.00% | 100.00% |
| Current Liabilities | 28.09% | 16.51% | 8.61% | 33.32% |
| Long-term Liabilities | 53.72% | 37.36% | 26.76% | 9.34% |
| Total Liabilities | 81.81% | 53.87% | 35.38% | 42.66% |
| Net Worth | 18.19% | 46.13% | 64.62% | 57.34% |
| Percent of Sales | ||||
| Sales | 100.00% | 100.00% | 100.00% | 100.00% |
| Gross Margin | 99.48% | 100.00% | 100.00% | 100.00% |
| Selling, General & Administrative Expenses | 118.02% | 84.81% | 79.82% | 79.77% |
| Advertising Expenses | 0.00% | 0.00% | 0.00% | 5.00% |
| Profit Before Interest and Taxes | -15.89% | 23.24% | 29.79% | 2.91% |
| Main Ratios | ||||
| Current | 3.12 | 5.63 | 11.18 | 1.94 |
| Quick | 3.12 | 5.63 | 11.18 | 1.61 |
| Total Debt to Total Assets | 81.81% | 53.87% | 35.38% | 50.78% |
| Pre-tax Return on Net Worth | -286.59% | 158.58% | 153.71% | 11.85% |
| Pre-tax Return on Assets | -52.14% | 73.16% | 99.33% | 24.09% |
| Additional Ratios | Year 1 | Year 2 | Year 3 | |
| Net Profit Margin | -18.07% | 15.40% | 20.33% | n.a |
| Return on Equity | -286.59% | 111.01% | 107.60% | n.a |
| Activity Ratios | ||||
| Accounts Receivable Turnover | 3.34 | 3.34 | 3.34 | n.a |
| Collection Days | 54 | 90 | 97 | n.a |
| Accounts Payable Turnover | 11.19 | 12.17 | 12.17 | n.a |
| Payment Days | 28 | 28 | 28 | n.a |
| Total Asset Turnover | 2.89 | 3.33 | 3.42 | n.a |
| Debt Ratios | ||||
| Debt to Net Worth | 4.50 | 1.17 | 0.55 | n.a |
| Current Liab. to Liab. | 0.34 | 0.31 | 0.24 | n.a |
| Liquidity Ratios | ||||
| Net Working Capital | $47,563 | $81,894 | $117,921 | n.a |
| Interest Coverage | -7.31 | 18.72 | 39.84 | n.a |
| Additional Ratios | ||||
| Assets to Sales | 0.35 | 0.30 | 0.29 | n.a |
| Current Debt/Total Assets | 28% | 17% | 9% | n.a |
| Acid Test | 0.81 | 1.11 | 2.27 | n.a |
| Sales/Net Worth | 15.86 | 7.21 | 5.29 | n.a |
| Dividend Payout | 0.00 | 0.36 | 0.60 | n.a |
Appendix
| Sales Forecast | |||||||||||||
| Month 1 | Month 2 | Month 3 | Month 4 | Month 5 | Month 6 | Month 7 | Month 8 | Month 9 | Month 10 | Month 11 | Month 12 | ||
| Sales | |||||||||||||
| Large Companies | 0% | $6,000 | $6,000 | $6,000 | $6,000 | $6,000 | $6,000 | $6,000 | $6,000 | $6,000 | $6,000 | $9,000 | $24,000 |
| Medium Companies | 0% | $0 | $0 | $0 | $0 | $0 | $2,000 | $4,000 | $4,000 | $5,000 | $5,000 | $6,000 | $7,000 |
| Small Companies | 0% | $0 | $0 | $0 | $0 | $7,000 | $5,000 | $3,000 | $26,000 | $4,000 | $7,000 | $10,000 | $7,000 |
| Other | 0% | $0 | $0 | $0 | $0 | $0 | $0 | $7,000 | $5,000 | $12,000 | $5,000 | $2,000 | $5,000 |
| Total Sales | $6,000 | $6,000 | $6,000 | $6,000 | $13,000 | $13,000 | $20,000 | $41,000 | $27,000 | $23,000 | $27,000 | $43,000 | |
| Direct Cost of Sales | Month 1 | Month 2 | Month 3 | Month 4 | Month 5 | Month 6 | Month 7 | Month 8 | Month 9 | Month 10 | Month 11 | Month 12 | |
| All client projects | $0 | $0 | $0 | $0 | $0 | $0 | $0 | $0 | $0 | $0 | $0 | $0 | |
| Other | $0 | $0 | $0 | $0 | $0 | $0 | $0 | $0 | $0 | $0 | $0 | $0 | |
| Subtotal Direct Cost of Sales | $0 | $0 | $0 | $0 | $0 | $0 | $0 | $0 | $0 | $0 | $0 | $0 | |
| Personnel Plan | |||||||||||||
| Month 1 | Month 2 | Month 3 | Month 4 | Month 5 | Month 6 | Month 7 | Month 8 | Month 9 | Month 10 | Month 11 | Month 12 | ||
| Mr. Thomas Roth – President | 0% | $3,000 | $3,000 | $3,000 | $3,000 | $3,000 | $3,000 | $3,000 | $3,000 | $3,000 | $3,000 | $3,000 | $3,000 |
| Ms. Jane Calder – Operations Head/Principal Consultant | 0% | $3,000 | $3,000 | $3,000 | $3,000 | $3,000 | $3,000 | $3,000 | $3,000 | $3,000 | $3,000 | $3,000 | $3,000 |
| Mrs. Susan Howell – Telemarketing Consultant | 0% | $3,000 | $3,000 | $3,000 | $3,000 | $3,000 | $3,000 | $3,000 | $3,000 | $3,000 | $3,000 | $3,000 | $3,000 |
| Mr. Leonard Grey – Telemarketing Consultant | 0% | $3,000 | $3,000 | $3,000 | $3,000 | $3,000 | $3,000 | $3,000 | $3,000 | $3,000 | $3,000 | $3,000 | $3,000 |
| Office Manager | 0% | $1,700 | $1,700 | $1,700 | $1,700 | $1,700 | $1,700 | $1,700 | $1,700 | $1,700 | $1,700 | $1,700 | $1,700 |
| Cold Caller | 0% | $1,120 | $1,120 | $1,120 | $1,120 | $1,120 | $1,120 | $1,120 | $1,120 | $1,120 | $1,120 | $1,120 | $1,120 |
| Total People | 0% | 6 | 6 | 6 | 6 | 6 | 6 | 6 | 6 | 6 | 6 | 6 | 6 |
| Total Payroll | $14,820 | $14,820 | $14,820 | $14,820 | $14,820 | $14,820 | $14,820 | $14,820 | $14,820 | $14,820 | $14,820 | $14,820 | |
| General Assumptions | |||||||||||||
| Month 1 | Month 2 | Month 3 | Month 4 | Month 5 | Month 6 | Month 7 | Month 8 | Month 9 | Month 10 | Month 11 | Month 12 | ||
| Plan Month | 1 | 2 | 3 | 4 | 5 | 6 | 7 | 8 | 9 | 10 | 11 | 12 | |
| Current Interest Rate | 10.00% | 10.00% | 10.00% | 10.00% | 10.00% | 10.00% | 10.00% | 10.00% | 10.00% | 10.00% | 10.00% | 10.00% | |
| Long-term Interest Rate | 8.00% | 8.00% | 8.00% | 8.00% | 8.00% | 8.00% | 8.00% | 8.00% | 8.00% | 8.00% | 8.00% | 8.00% | |
| Tax Rate | 30.00% | 30.00% | 30.00% | 30.00% | 30.00% | 30.00% | 30.00% | 30.00% | 30.00% | 30.00% | 30.00% | 30.00% | |
| Other | 0 | 0 | 0 | 0 | 0 | 0 | 0 | 0 | 0 | 0 | 0 | 0 | |
| Pro Forma Profit and Loss | |||||||||||||
| Month 1 | Month 2 | Month 3 | Month 4 | Month 5 | Month 6 | Month 7 | Month 8 | Month 9 | Month 10 | Month 11 | Month 12 | ||
| Sales | $6,000 | $6,000 | $6,000 | $6,000 | $13,000 | $13,000 | $20,000 | $41,000 | $27,000 | $23,000 | $27,000 | $43,000 | |
| Direct Cost of Sales | $0 | $0 | $0 | $0 | $0 | $0 | $0 | $0 | $0 | $0 | $0 | $0 | |
| Other Costs of Sales | $0 | $0 | $0 | $0 | $0 | $500 | $0 | $700 | $0 | $0 | $0 | $0 | |
| Total Cost of Sales | $0 | $0 | $0 | $0 | $0 | $500 | $0 | $700 | $0 | $0 | $0 | $0 | |
| Gross Margin | $6,000 | $6,000 | $6,000 | $6,000 | $13,000 | $12,500 | $20,000 | $40,300 | $27,000 | $23,000 | $27,000 | $43,000 | |
| Gross Margin % | 100.00% | 100.00% | 100.00% | 100.00% | 100.00% | 96.15% | 100.00% | 98.29% | 100.00% | 100.00% | 100.00% | 100.00% | |
| Expenses | |||||||||||||
| Payroll | $14,820 | $14,820 | $14,820 | $14,820 | $14,820 | $14,820 | $14,820 | $14,820 | $14,820 | $14,820 | $14,820 | $14,820 | |
| Sales and Marketing and Other Expenses | $1,000 | $1,000 | $1,000 | $1,000 | $1,000 | $1,000 | $1,000 | $1,000 | $1,000 | $1,000 | $1,000 | $1,000 | |
| Depreciation | $0 | $0 | $0 | $0 | $0 | $0 | $0 | $0 | $0 | $0 | $0 | $0 | |
| Rent | $1,000 | $1,000 | $1,000 | $1,000 | $1,000 | $1,000 | $1,000 | $1,000 | $1,000 | $1,000 | $1,000 | $1,000 | |
| Utilities | $300 | $300 | $300 | $300 | $300 | $300 | $300 | $300 | $300 | $300 | $300 | $300 | |
| Insurance | $250 | $250 | $250 | $250 | $250 | $250 | $250 | $250 | $250 | $250 | $250 | $250 | |
| Payroll Taxes | 15% | $2,223 | $2,223 | $2,223 | $2,223 | $2,223 | $2,223 | $2,223 | $2,223 | $2,223 | $2,223 | $2,223 | $2,223 |
| Travel | 15% | $1,200 | $3,000 | $1,000 | $2,000 | $2,000 | $3,000 | $2,000 | $1,000 | $2,000 | $3,000 | $1,000 | $3,000 |
| Other | $600 | $600 | $600 | $600 | $600 | $600 | $600 | $600 | $600 | $600 | $600 | $600 | |
| Total Operating Expenses | $21,393 | $23,193 | $21,193 | $22,193 | $22,193 | $23,193 | $22,193 | $21,193 | $22,193 | $23,193 | $21,193 | $23,193 | |
| Profit Before Interest and Taxes | ($15,393) | ($17,193) | ($15,193) | ($16,193) | ($9,193) | ($10,693) | ($2,193) | $19,107 | $4,807 | ($193) | $5,807 | $19,807 | |
| EBITDA | ($15,393) | ($17,193) | ($15,193) | ($16,193) | ($9,193) | ($10,693) | ($2,193) | $19,107 | $4,807 | ($193) | $5,807 | $19,807 | |
| Interest Expense | $433 | $431 | $428 | $425 | $422 | $420 | $417 | $414 | $412 | $409 | $406 | $403 | |
| Taxes Incurred | $0 | $0 | $0 | $0 | $0 | $0 | $0 | $0 | $0 | $0 | $0 | $0 | |
| Net Profit | ($15,826) | ($17,624) | ($15,621) | ($16,618) | ($9,615) | ($11,113) | ($2,610) | $18,693 | $4,395 | ($602) | $5,401 | $19,404 | |
| Net Profit/Sales | -263.77% | -293.73% | -260.35% | -276.97% | -73.97% | -85.48% | -13.05% | 45.59% | 16.28% | -2.62% | 20.00% | 45.12% | |
| Pro Forma Cash Flow | |||||||||||||
| Month 1 | Month 2 | Month 3 | Month 4 | Month 5 | Month 6 | Month 7 | Month 8 | Month 9 | Month 10 | Month 11 | Month 12 | ||
| Cash Received | |||||||||||||
| Cash from Operations | |||||||||||||
| Cash Sales | $1,500 | $1,500 | $1,500 | $1,500 | $3,250 | $3,250 | $5,000 | $10,250 | $6,750 | $5,750 | $6,750 | $10,750 | |
| Cash from Receivables | $0 | $150 | $4,500 | $4,500 | $4,500 | $4,675 | $9,750 | $9,925 | $15,525 | $30,400 | $20,150 | $17,350 | |
| Subtotal Cash from Operations | $1,500 | $1,650 | $6,000 | $6,000 | $7,750 | $7,925 | $14,750 | $20,175 | $22,275 | $36,150 | $26,900 | $28,100 | |
| Additional Cash Received | |||||||||||||
| Sales Tax, VAT, HST/GST Received | 0.00% | $0 | $0 | $0 | $0 | $0 | $0 | $0 | $0 | $0 | $0 | $0 | $0 |
| New Current Borrowing | $0 | $0 | $0 | $0 | $0 | $0 | $0 | $0 | $0 | $0 | $0 | $0 | |
| New Other Liabilities (interest-free) | $0 | $0 | $0 | $0 | $0 | $0 | $0 | $0 | $0 | $0 | $0 | $0 | |
| New Long-term Liabilities | $0 | $0 | $0 | $0 | $0 | $0 | $0 | $0 | $0 | $0 | $0 | $0 | |
| Sales of Other Current Assets | $0 | $0 | $0 | $0 | $0 | $0 | $0 | $0 | $0 | $0 | $0 | $0 | |
| Sales of Long-term Assets | $0 | $0 | $0 | $0 | $0 | $0 | $0 | $0 | $0 | $0 | $0 | $0 | |
| New Investment Received | $0 | $0 | $0 | $0 | $0 | $0 | $1,500 | $1,500 | $0 | $0 | $0 | $0 | |
| Subtotal Cash Received | $1,500 | $1,650 | $6,000 | $6,000 | $7,750 | $7,925 | $16,250 | $21,675 | $22,275 | $36,150 | $26,900 | $28,100 | |
| Expenditures | Month 1 | Month 2 | Month 3 | Month 4 | Month 5 | Month 6 | Month 7 | Month 8 | Month 9 | Month 10 | Month 11 | Month 12 | |
| Expenditures from Operations | |||||||||||||
| Cash Spending | $14,820 | $14,820 | $14,820 | $14,820 | $14,820 | $14,820 | $14,820 | $14,820 | $14,820 | $14,820 | $14,820 | $14,820 | |
| Bill Payments | $3,234 | $7,066 | $8,737 | $6,834 | $7,798 | $7,845 | $9,243 | $7,780 | $7,497 | $7,818 | $8,715 | $6,846 | |
| Subtotal Spent on Operations | $18,054 | $21,886 | $23,557 | $21,654 | $22,618 | $22,665 | $24,063 | $22,600 | $22,317 | $22,638 | $23,535 | $21,666 | |
| Additional Cash Spent | |||||||||||||
| Sales Tax, VAT, HST/GST Paid Out | $0 | $0 | $0 | $0 | $0 | $0 | $0 | $0 | $0 | $0 | $0 | $0 | |
| Principal Repayment of Current Borrowing | $0 | $181 | $181 | $181 | $181 | $181 | $181 | $181 | $181 | $181 | $181 | $190 | |
| Other Liabilities Principal Repayment | $0 | $0 | $0 | $0 | $0 | $0 | $0 | $0 | $0 | $0 | $0 | $0 | |
| Long-term Liabilities Principal Repayment | $0 | $181 | $181 | $181 | $181 | $181 | $181 | $181 | $181 | $181 | $181 | $190 | |
| Purchase Other Current Assets | $0 | $0 | $0 | $0 | $0 | $0 | $0 | $0 | $0 | $0 | $0 | $0 | |
| Purchase Long-term Assets | $0 | $0 | $0 | $0 | $0 | $0 | $0 | $0 | $0 | $0 | $0 | $0 | |
| Dividends | $0 | $0 | $0 | $0 | $0 | $0 | $0 | $0 | $0 | $0 | $0 | $15,000 | |
| Subtotal Cash Spent | $18,054 | $22,248 | $23,919 | $22,016 | $22,980 | $23,027 | $24,425 | $22,962 | $22,679 | $23,000 | $23,897 | $37,046 | |
| Net Cash Flow | ($16,554) | ($20,598) | ($17,919) | ($16,016) | ($15,230) | ($15,102) | ($8,175) | ($1,287) | ($404) | $13,150 | $3,003 | ($8,946) | |
| Cash Balance | $100,746 | $80,148 | $62,229 | $46,213 | $30,983 | $15,881 | $7,706 | $6,419 | $6,015 | $19,165 | $22,168 | $13,222 | |
| Pro Forma Balance Sheet | |||||||||||||
| Month 1 | Month 2 | Month 3 | Month 4 | Month 5 | Month 6 | Month 7 | Month 8 | Month 9 | Month 10 | Month 11 | Month 12 | ||
| Assets | Starting Balances | ||||||||||||
| Current Assets | |||||||||||||
| Cash | $117,300 | $100,746 | $80,148 | $62,229 | $46,213 | $30,983 | $15,881 | $7,706 | $6,419 | $6,015 | $19,165 | $22,168 | $13,222 |
| Accounts Receivable | $0 | $4,500 | $8,850 | $8,850 | $8,850 | $14,100 | $19,175 | $24,425 | $45,250 | $49,975 | $36,825 | $36,925 | $51,825 |
| Other Current Assets | $5,000 | $5,000 | $5,000 | $5,000 | $5,000 | $5,000 | $5,000 | $5,000 | $5,000 | $5,000 | $5,000 | $5,000 | $5,000 |
| Total Current Assets | $122,300 | $110,246 | $93,998 | $76,079 | $60,063 | $50,083 | $40,056 | $37,131 | $56,669 | $60,990 | $60,990 | $64,093 | $70,047 |
| Long-term Assets | |||||||||||||
| Long-term Assets | $10,000 | $10,000 | $10,000 | $10,000 | $10,000 | $10,000 | $10,000 | $10,000 | $10,000 | $10,000 | $10,000 | $10,000 | $10,000 |
| Accumulated Depreciation | $0 | $0 | $0 | $0 | $0 | $0 | $0 | $0 | $0 | $0 | $0 | $0 | $0 |
| Total Long-term Assets | $10,000 | $10,000 | $10,000 | $10,000 | $10,000 | $10,000 | $10,000 | $10,000 | $10,000 | $10,000 | $10,000 | $10,000 | $10,000 |
| Total Assets | $132,300 | $120,246 | $103,998 | $86,079 | $70,063 | $60,083 | $50,056 | $47,131 | $66,669 | $70,990 | $70,990 | $74,093 | $80,047 |
| Liabilities and Capital | Month 1 | Month 2 | Month 3 | Month 4 | Month 5 | Month 6 | Month 7 | Month 8 | Month 9 | Month 10 | Month 11 | Month 12 | |
| Current Liabilities | |||||||||||||
| Accounts Payable | $3,000 | $6,773 | $8,510 | $6,574 | $7,538 | $7,536 | $8,983 | $7,530 | $7,238 | $7,525 | $8,489 | $6,553 | $8,484 |
| Current Borrowing | $16,000 | $16,000 | $15,819 | $15,638 | $15,457 | $15,276 | $15,095 | $14,914 | $14,733 | $14,552 | $14,371 | $14,190 | $14,000 |
| Other Current Liabilities | $0 | $0 | $0 | $0 | $0 | $0 | $0 | $0 | $0 | $0 | $0 | $0 | $0 |
| Subtotal Current Liabilities | $19,000 | $22,773 | $24,329 | $22,212 | $22,995 | $22,812 | $24,078 | $22,444 | $21,971 | $22,077 | $22,860 | $20,743 | $22,484 |
| Long-term Liabilities | $45,000 | $45,000 | $44,819 | $44,638 | $44,457 | $44,276 | $44,095 | $43,914 | $43,733 | $43,552 | $43,371 | $43,190 | $43,000 |
| Total Liabilities | $64,000 | $67,773 | $69,148 | $66,850 | $67,452 | $67,088 | $68,173 | $66,358 | $65,704 | $65,629 | $66,231 | $63,933 | $65,484 |
| Paid-in Capital | $100,000 | $100,000 | $100,000 | $100,000 | $100,000 | $100,000 | $100,000 | $101,500 | $103,000 | $103,000 | $103,000 | $103,000 | $103,000 |
| Retained Earnings | ($31,700) | ($31,700) | ($31,700) | ($31,700) | ($31,700) | ($31,700) | ($31,700) | ($31,700) | ($31,700) | ($31,700) | ($31,700) | ($31,700) | ($46,700) |
| Earnings | $0 | ($15,826) | ($33,450) | ($49,071) | ($65,689) | ($75,305) | ($86,417) | ($89,027) | ($70,335) | ($65,939) | ($66,541) | ($61,140) | ($41,737) |
| Total Capital | $68,300 | $52,474 | $34,850 | $19,229 | $2,611 | ($7,005) | ($18,117) | ($19,227) | $965 | $5,361 | $4,759 | $10,160 | $14,563 |
| Total Liabilities and Capital | $132,300 | $120,246 | $103,998 | $86,079 | $70,063 | $60,083 | $50,056 | $47,131 | $66,669 | $70,990 | $70,990 | $74,093 | $80,047 |
| Net Worth | $68,300 | $52,474 | $34,850 | $19,229 | $2,611 | ($7,005) | ($18,117) | ($19,227) | $965 | $5,361 | $4,759 | $10,160 | $14,563 |


