
OSS Telecom Technology
Executive Summary
OSS Telecom Technology is an exciting Bend, Oregon based offshoot of OSS Telecom Technology Taiwan, a $300 million steel conglomerate. The main company was formed to pursue opportunities in operations support systems (OSS) in the telecom software industry. The company has enjoyed a solid base of 24 telecom operators utilizing their software.
OSS Telecom Technology will pursue several objectives that will allow them to quickly gain market penetration. The first objective is to offer a high value, high quality product for the telecom industry. Also important from an internal operation standpoint is the ability to develop superior human assets through training and competitive incentives. Lastly, OSS Telecom Technology will pursue a customer intimacy model. The pursuit of this specific business model will ensure complete satisfaction of their customers.
The Products
OSS Telecom Technology has a diverse OSS-based repertoire of products to support the telecom industry. Their first product is CARIBOU, a subscriber billing software solution. Within the CARIBOU package, traffic processing, bill generation, accounts payable, system administration, packaging, and customer care and administration are addressed. Each module within CARIBOU is its own robust application.
OSS Telecom Technology also offers their MEDUSA product. The MEDUSA product provides network support in the form of configuration, control, and management of network elements.
The Market
The market potential is huge for OSS Telecom Technology’s products, evidenced by what appears to be the unstoppable growth of the telecom industry is quite promising. Currently, the telecom industry is the strongest growth industry and is responsible for huge gains in the capital markets. The proliferation of cell phones, as just one subset of the telecom industry is increasing at rates which at one time were unimaginable. One illustrative example is that it is forecasted that within two years 65% of children from the age of 10-15 will have cell phones. Broadband Internet service is also forecasted to achieve record penetration. Within three years it is expected that 85% of the population will have access to some sort of broadband connection with 60% of that group subscribing.
OSS Telecom Technology will target two market segments. The first is Tier 2 telecom operators. This segment has an 8% annual growth rate and 481 potential customer. The second targeted market segment will be Tier 3 telecom operators. While the annual growth rate of this segment is less at 6%, there are more potential customers, 2,011.
Management Team
OSS Telecom Technology has put together an experienced management team to lead the organization through this dynamic industry. The assembled team was chosen to a large degree on the experience that they had within the industry. The telecom industry is quite technical and comprehensive information and insight of this unique sector is instrumental for success. Victor Smith has been brought in as CEO. Victor has 25 years of telecom experience. The last 12 years Victor has severed as COO of Atlas Telecom, a major player. OSS has another Atlas Telecom executive in the person of Kenneth Jones. Kenneth is the Executive Vice President and has also served with the NCR Corporation and Harris Corp. Kenneth worked on a large variety of projects at these companies and brings a strong skill set to OSS Telecom Technology. James Jackson is also an Executive Vice President with experience from IBM, Atlas, Mosaics and the Lotus Development Corporation. Rounding out the management team is Ken Smith with topical experience from MIDCOM Communications and US Intelio Networks.
OSS Telecom Technology, leveraging their strong management team and their superior product offerings will reach the Break-even point in year two. After a Net Loss in year one, Net Profit will become positive at the end of year two, but will leap up in year three. Sales for OSS Telecom Technology is forecasted to be moderate in year one and see a hefty increase again by the end of year three.
1.1 Objectives
OSS Telecom Technology’s operating model is designed to meet our goals which include:
- Developing OSS solutions for telecom operations.
- Bringing high value, high quality products to market.
- Developing human assets through training and competitive incentives.
- Practicing a customer intimacy business model.
1.2 Mission
Our mission is to be the provider of high value, high quality, convergent OSS solutions to telecom operators worldwide. These scalable solutions will have unparalleled support to ensure flexibility and to meet–and exceed–customer expectations.
1.3 Keys to Success
Strategic Imperatives
In order to achieve its mission, OSS Telecom Technology has made a set of clear and distinctive strategic choices. These choices have been developed based on two key factors:
- The OSS marketplace
- The company’s capabilities
These choices translate into key strategic imperatives which OSS Telecom Technology is pursuing to gain leadership in the OSS market. There are three levels of operators within the telecom market. Tier 1 are operators with a subscriber base above one million, Tier 2 are operators with a subscriber base between 100,000 and one million, and Tier 3 operators are those with less than 100,000 subscribers.
- Value focus: OSS Telecom Technology will focus on Tier 3 operators, providing full featured, scalable, and reliable products and service at competitive prices. The lifecycle price of OSS Telecom Technology’s software products will be 20-40% below Tier 1 competitors such as LHS and Kenan, but will still possess all the features and services offered by these players. Tier 3 competitors, such as Moscom, while lower on price, will not be able to compete with the features and service OSS Telecom Technology offers.
- Wireline and Wireless Product Portfolio: OSS Telecom Technology’s product offering will evolve from Global Systems for Mobile Communications (GSM) to include other wireless, fixed, and Internet billing solutions. While initial products were GSM-based, OSS Telecom Technology is already broadening its product lines to include local loop billing and convergent billing capabilities, which are key customer requirements.
- Engineering Center of Excellence: OSS Telecom Technology will continue to develop its low cost, high quality software development and programming center in Taiwan, which provides significant cost advantages over U.S. and Europe-based competitors.
- Consulting Services: OSS Telecom Technology will combine consulting services with products to develop strong customer relationships and advance its product offerings. The provision of consulting services will allow a more customized, relationship-driven approach to our customers. OSS Telecom Technology will pursue those projects which can be made into products and marketed to other potential customers. OSS Telecom Technology will employ strict criteria to determine which consulting services projects it undertakes. Unless there is an opportunity to “productize” or repeat the solution being developed, the project will not be pursued.
- Sales Channels: A multi-national marketing and sales team will build both direct and indirect sales channels. In order to capitalize on the opportunities in each geographic region, OSS Telecom Technology has put into place a network of on-the-ground, experienced, and incentivized sales and marketing personnel. These teams will build both direct customer relationships and indirect channels (through systems integrators, switch manufacturers, etc.). The indirect channel partners will give OSS Telecom Technology critical leverage. OSS Telecom Technology will allocate resources to building its partnerships with indirect sales channels. Partners such as Compaq will allow OSS Telecom Technology to gain geographic reach, credibility, and customers which would not otherwise be possible. Specific partner support programs will be put into place to ensure cultivation of these partnerships.

Company Summary
OSS Telecom Technology is a subsidiary of OSS Telecom Technology Taiwan, a $300 million conglomerate, historically specializing in value-added steel products. OSS Telecom Technology is recognized as a leader in using sound business practices, which include: high-quality standards, constant development of infrastructure, and investment in assets to produce high-value products for its customers. OSS Telecom Technology believes that its people are its strongest asset. To this end, OSS Telecom Technology has developed an exemplary training institute to train managers in the latest management techniques and production staff in state-of-the-art manufacturing. OSS Telecom Technology prides itself on its integrity and ability to meet and exceed customers’ expectations.

2.1 Company Ownership
OSS Telecom Technology Taiwan was formed as a Taiwanese corporation in 1994 to pursue opportunities in the Operations Support Systems (OSS) telecommunications market, with a particular focus on Customer Care and Billing software solutions (CCB systems).
2.2 Company History
Attracted by the potential of the telecom industry and based on its own core business values, OSS Telecom Technology developed a strategy to enter the telecommunications business. Initial steps in this strategy included the acquisition of a GSM license for Taipei to provide GSM services in Taipei and paging services throughout Taiwan. Telecom Malaysia was selected as a joint venture partner for the implementation of telecom operations.
OSS Telecom Technology soon discovered that new tools needed to be developed to efficiently operate within a competitive telecom environment. As a result, OSS Telecom Technology formed an information technology group specializing in telecom software development. Telecom Malaysia selected OSS Telecom Technology to develop a system called DINE, which is a mediation product that interfaces with five different types of telecom switches and collects call detail records (CDRs) from 1,200 central offices for 4 million subscribers. This was OSS Telecom Technology’s first project, and was the beginning of the success story in which OSS Telecom Technology focused on telecom Operations Support Systems (OSS) solutions.
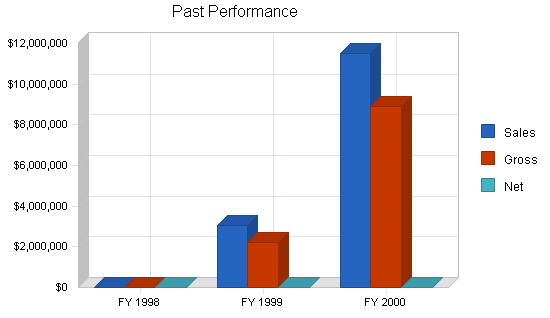
| Past Performance | |||
| FY 1998 | FY 1999 | FY 2000 | |
| Sales | $0 | $3,051,400 | $11,513,000 |
| Gross Margin | $0 | $2,203,300 | $8,902,400 |
| Gross Margin % | 0.00% | 72.21% | 77.32% |
| Operating Expenses | $0 | $7,890,400 | $13,662,300 |
| Collection Period (days) | 0 | 117 | 58 |
| Balance Sheet | |||
| FY 1998 | FY 1999 | FY 2000 | |
| Current Assets | |||
| Cash | $0 | ($4,840,000) | ($16,772,000) |
| Accounts Receivable | $0 | $1,221,000 | $1,854,000 |
| Other Current Assets | $0 | $1,011,000 | $1,511,000 |
| Total Current Assets | $0 | ($2,608,000) | ($13,407,000) |
| Long-term Assets | |||
| Long-term Assets | $0 | $6,726,000 | $8,917,000 |
| Accumulated Depreciation | $0 | $917,000 | $1,694,000 |
| Total Long-term Assets | $0 | $5,809,000 | $7,223,000 |
| Total Assets | $0 | $3,201,000 | ($6,184,000) |
| Current Liabilities | |||
| Accounts Payable | $0 | $1,136,000 | $2,115,000 |
| Current Borrowing | $0 | $0 | $0 |
| Other Current Liabilities (interest free) | $0 | $0 | $0 |
| Total Current Liabilities | $0 | $1,136,000 | $2,115,000 |
| Long-term Liabilities | $0 | $7,300,000 | $1,030,000 |
| Total Liabilities | $0 | $8,436,000 | $3,145,000 |
| Paid-in Capital | $0 | $1,667,000 | $1,667,000 |
| Retained Earnings | $0 | ($6,902,000) | ($10,996,000) |
| Earnings | $0 | $0 | $0 |
| Total Capital | $0 | ($5,235,000) | ($9,329,000) |
| Total Capital and Liabilities | $0 | $3,201,000 | ($6,184,000) |
| Other Inputs | |||
| Payment Days | 0 | 30 | 28 |
| Sales on Credit | $0 | $1,900,000 | $9,600,000 |
| Receivables Turnover | 0.00 | 1.56 | 5.18 |
2.3 Company Locations and Facilities
OSS Telecom Technology has established its headquarters in Bend, Oregon. The company entered into a five-year lease of a 6,500 square foot office facility. Regional sales offices have been established in Denver, Colorado (three-year lease of a 2,500-square foot office); Mexico City (two-year lease of a 2,000-square foot office). Two technical support office facilities are located in Taiwan, in the cities of Taipei and Kaohsiung (three-year leases of 5,000 and 3,500-square foot offices, respectively).
Services
This section describes OSS Telecom Technology’s different products, including CARIBOU, MEDUSA, PAN, and the new products in production such as the SMSC and the IN Pre-Paid Calling Card platform. This section also gives an overview of the product road maps for the various products and includes some of the highlights which make the products unique from and more advanced than similar competing products.
3.1 Service Description
Below is a description of OSS Telecom Technology’s different products, including CARIBOU, MEDUSA, PAN, and the new products in production such as the SMSC and the IN Pre-Paid Calling Card platform. This section also gives an overview of the product road maps for the various products and includes some of the highlights which make these products unique from and more advanced than similar competing products.
Description of CARIBOU
Subscriber Billing
The basic billing system consists of the following modules:
- Traffic Processing
- Bill Generation
- Accounts & Payment
- Systems Administration
- Packaging
- Customer Care and Administration
- Specific Value-Added Features
I. Traffic Processing
- Pricing: CDRs received through tape or from the mediation system are validated and then taken up for pricing using the tariff package, tariff plan, rate structure, rate calendar, discounts structure. There are four types of pricing – FLAT, VOLUME, STEP, and SEGMENTED.
- Reject Maintenance: CDRs with missing information are listed with reject value codes for manual processing.
- Traffic Posting: After pricing, the records are posted to the corresponding subscriber account that is used during bill generation.
II. Bill Generation
Bill generation can be of three types–ad-hoc billing, warm (hot) billing, and cycle wise billing. The system can take care of multiple billing cycles and multiple billing groups.
- Pre-bill processing: This process is mainly used for calculating the recurring amount of each bill cycle.
- Final bill generation: This process starts after pre-bill processing and it calculates the total bill and its corresponding discounts for every subscriber. Other than total bill calculation, it takes care of VOLUME PRICING, FLAT discount, and VOLUME discount.
- Bill Posting: Records are posted to their corresponding subscriber’s account after bill generation.
- Bill Printing: Printing can be distributed over various printers in the network. In addition, printing can be selective depending on the account and subscriber number.
III. Accounts & Payment
- Online Payment: Payment can be done over the counter, which is online.
- Off-line Payment: Payment can be collected manually and it can be entered into the system collectively (in batch).
- Payment Adjustment: Adjustments can be made against accounts in case of both online and off-line payment.
- Refund: System is capable of providing refunds to its customers.
- Bill Follow-up: In case of late payment, bill follow-up is necessary. The system is capable of generating reminders in the occurrence of a late payment.
IV. Systems Administration
- User Administration: This takes care of user management and their privileges.
- Number Inventory: Manages all subscriber’s and service’s number inventory.
- Subscriber Activation/Deactivation: This activity is performed through MEDUSA’s service provisioning system.
- Bill Correction/Write-off: This is a supervisory function where any bill correction and write-off is taken care of.
- Master Information: All the static information is managed through this module. Usually all system parameters are maintained here.
- High Toll Alert: System is capable of generating a high toll alert report that can help to identify fraud.
Packaging
A. Packages: This system can support the following four types of packages:
- Primary Package: This package is mainly for basic services. It contains four types of plans: one-time, deposit, recurring, and service usage time.
- Value-Added Package: This package is designed for all value-added services like call forwarding, call waiting, busy transfer, STD, ISD etc. It contains four types of plans: one-time, deposit, recurring, and service usage.
- Free Service Package: This package is designed for free minutes or units of calls only. A particular package can be attached to the customer or a specific free service can be provided.
- Discount Package: This package is designed for discount only. A particular discount package can be attached to the customer. Discount can be two types – Flat and volume.
B. Marketing Plans: Each package is attached to various plans. There are five different plans:
- One-time Charge Plan: This plan is used for one-time charges only.
- Deposit Charge Plan: This plan is used for deposit charges only
- Recurring Charge Plan: This plan is used for recurring charges only.
- Service Charge Plan: This plan is used for service charge only.
- Long Distance (National and International) Charge Plan: This plan is used for any national and international long distance call charge.
C. Rate Structures: Support for various types of rate codes and corresponding rate details.
D. Rate Calendar:
- Daily Rate Calendar: A rate calendar may be generated separately for each day of the week.
- Holiday Rate Calendar: This rate calendar is used for holidays only.
- Ad hoc Discount Calendar: This rate calendar is used for ad hoc discount.
VI. Customer Care and Administration
CARIBOU provides a single window, single view for the Customer Care Agent (CCA) to address any activity or query pertaining to subscribers that he/she is responsible. A customer calling online has to go no further to address any issue related to the service. The CCA even has access to bill images and CDR history through that single window.
A. Subscriber Registration: Registration is a quick and easy process, which may be performed both on-line as well as off-line (batch). Different marketing plans are offered to a customer such as: choice of bill date, number selection choice, and other related start-of-service options. Of course, the package allows for changes in options as many times as is required.
B. Customer Inquiry:
- Service (primary & value-added services)
- Package related information
- Tariff related information
- Bill related information
- Activation/Deactivation status
- Usage Charges
- Bill Amount
- Pending/Adjustment amount
- Credit limits information
C. Customer Complaint: CARIBOU recognizes the fact that the grade of service of telecom service network draws parameters from all possible service point. To address, track and contain/minimize faults/complaints, the system provides for a sophisticated management and tracking of technical and commercial faults/complaints.
D. Complaint Tracking: Recording a complaint is not sufficient. More often than not, a customer will follow-up on the complaint to inquire about the completion status. The system allows complaints to be recorded along with updating of the action initiated, thus enabling status tracking. Various reports can be generated on complaints and actions taken. Complaint aging reports can also be generated for MIS and evaluation of the quality of service of the network.
E. Customer Feedback: Collection of customer feedback is essential in any service. The feedback is analyzed and action is taken to improve the quality of service.
F. Emergency Service: A directory service for emergency and utility numbers and other details is provided in CARIBOU for better customer care for the network.
Description of MEDUSA
The activities handled by MEDUSA are:
- Acquisition of data from network element.
- Validation of the data, translation into intermediate form suitable for delivery and storage of the data.
- Delivery of the processed data to other applications according to a predefined format.
The system can provide various services for configuration, control, and management of the Network Elements including:
- Activation of a subscriber.
- Deactivation of a subscriber.
- Denial of service to a subscriber.
- Resumption of service to the subscriber.
- Addition of value-added services, like three-party conference and call forwarding, to the subscriber.
MEDUSA coordinates and controls the actions of the various NEs to which it connects, thus obviating the need to configure each concerned entity individually.
3.2 Competitive Comparison
Specific Value-Added Features
The OSS Telecom Technology billing system is functionally rich and modular. It supports basic services and several value-added services. Some of the special features of CARIBOU are:
- High Toll Alert: Monitor credit limits and different thresholds and generate action alarms. This feature can be configured to trigger more often to reduce network operator exposure.
- Warm Billing: Ability to generate bills on demand.
- Friends & Families: Qualifying a group of numbers for individual subscribers enabling special discounts when calling those numbers.
- Churn Analysis: Analysis of calling patterns, demographic details, and behavior of usage to predict and prevent subscriber exodus.
- Trend Analysis: Statistical analysis of usage patterns and correlation to demographic parameters to assist marketing.
- Fraud Management: Analysis of customer database and monitoring of online calls to detect and prevent possible fraud and limit network exposure.
- Loyalty Programs: Bonus programs and credit earning schemes enabling customer retention. Partnership with airlines and other such organizations in exchange of data.
- Point of Sales (POS): Sales outlets and dealer/agent/retail outlets to manage sales of services in a commodity fashion.
3.3 Technology
Today’s changing scenario of fierce competition forces telecom operators to offer multiple services. The use of information technology to effectively manage telecom operations is thus becoming a key differentiation in the drive to get a share of the market. The role of IT is not limited to “piece-meal” automation. What an operator looks for is seamless integration of his information needs and the ability to provide innovative customer services.
At the core of a telecom operator’s business is revenue billing for the service(s) that it provides. Timely and accurate billing are preconditions for a smooth operation. At the same time, an operator is largely dependent on the billing system to provide the flexibility in marketing plans that subscribers desire. Customer care is another area which is crucial to operations, and, as a result, billing solutions available in the market need to be judged on the basis of timeliness, accuracy, flexibility, and customer care administration.
OSS Telecom Technology has a well-defined process of quality assurance, which is followed and monitored rigidly. The group reports to the CEO and President, directly.
OSS Telecom Technology has initiated the process of ISO 9000 certification for its systems and procedures. The systems will be certified for our Taiwan operations. All OSS Telecom Technology engineering is being performed out of its Taiwan development center, therefore OSS Telecom Technology will initially apply for certification of those operations. With the help of external consultants, OSS Telecom Technology has completed most of its projected milestones. It is expected that OSS Telecom Technology’s Taiwan operations will achieve ISO 9000 certification by June, 2001.
3.4 Future Services
IN Pre-Paid/Calling Card Platform
Product Description
The Calling Card/Pre-Paid system shall be broadly categorized into two subsections.
- Service Management – for call processing
- Business Management – for system administration, customer care, and value card management
Call Processing
Some features for calls controlled through this platform are as follows:
- Call Setup
- Call Tracking
- Call Termination
- Credit Update
- CDR Generation
- Call Rating
Some of the functions of the Calling Card platform are mentioned below.
Dealer Management
The system has an optional dealer management module as a part of value card management.
Customer Care and Administration
The customer care portion of the product shall be flexible to incorporate the following functions, as well as the future needs of the service provider. It shall be such that the overhead on the customer care expenditures shall be kept at a minimum.
- Add/modify/delete subscriber data
- Add/modify/delete packages
- Add/modify/delete tariff tables of various other operators
Operator Assistance: Subscribers shall directly talk to the operator for any complaints, queries, and recharging.
Value Card Management
- Value Card Generation
- Value Card Inventory
- Value Card Usage
- Value Card Expiration
Recharging
DTMF support or through operator assistance
Forbidden Numbers
The administrator shall maintain the forbidden numbers list in the database so that the system checks these numbers while confirming the call setup. The customer care module will provide support to add or delete the forbidden numbers.
CDR Viewing
The system administrator shall view the details of the CDR by accessing them from the database. The customer care module will provide support for this feature.
Credit Usage Reports: The system shall generate credit usage reports for the subscribers using the CDRs.
System Administration
The system shall have a system administrator to execute the following:
- Authentication of users: The system allows the users to access various features by checking the authentication of the person logged in.
- Backups: The system will support backups of data, like CDR and value cards, when the database becomes significantly large.
Consumer Ease of Use Features
- Minimum MOC before allowing MTC (for wireless implementation)
- First call treatment
- Reminders
- Announcements
Product Road Map
This section intentionally does not depict an explicit road map for Pre-Paid IN. The features incorporated in Pre-Paid IN for CARIBOU will be driven by customer care, billing, and tariffs.
Conclusion
The OSS Telecom Technology Pre-Paid IN/Calling Card platform is conceived to be a market leader for the following reasons:
- IN node-based technology
- Value for money
- Enhanced customer care for pre-paid subscribers
- Quick response time
- Capacity limited to number of lines in the switch
3.4.1 Mini-Short Messaging Service Center
SMSC (OSS Telecom Technology’s Mini-Short Messaging Service Center)
Description of the SMSC Platform
OSS Telecom Technology has two deployments of the same product. In one approach SMSC kernel and the G/I WMSC functionality are bundled into a single entity running on one platform, whereas the conventional architecture maintains various distributed SMSC kernels connected to a G/I WMSC through a TCP/IP network. This will help the customers who would want the entire solution in one box and do not want the solution to contain separately managed entities.
The distributed SMSC kernel is mainly used for connecting SMEs that need to handle massive throughput. It is also helpful when there is a need for having SMSCs to be geographically separated.
Providing a configurable SME interface: This can configure itself from an SME protocol specification file. This file is SME vendor specific. The underlying protocol for message delivery could be either TCP/IP or X.25.
The SMSC is capable of generating the interface required to connect to different SMSCs. This will make the SMSC capable of connecting to all major existing interfaces like EMI from CMG, SEMA, etc. Most importantly, it will help SME vendors define an appropriate interface for their application that is compatible with SMSC.
Configuring the SS7 card components through the SMSC user interface. Through user interface, it is able to configure more than one kind of hardware but insulates the hardware idiosyncrasies from the user. The user will always to presented with the same abstract view of the SS7 network through the interface.
Features of the SMSC Platform:
- Supporting message concatenation
- Supporting message replacement
- Provide two different architectures for deployment
- Providing a configurable SME interface
- Configuring the SS7 card components through the SMSC user interface
- Providing diagnostic and troubleshooting sessions with managed object
- Making the SMSC available on other platforms
- Making the SMSC capable of generating its own CDRs
- Rapid implementation of VASP over SMS possible, e.g. Stock Watch, email notification and retrieval, other content provisioning interfacing the Internet, etc.
Conclusion
OSS Telecom Technology’s SMSC proves to be the best in its class because of the following features:
- Available on NT and UNIX
- Distributed computing enabling implementation on multiple machines
- Open interface for any RDBMS
- Value for money
- APIs for rapid deployment of value-added applications
3.4.2 Performance Appraisal of Networks (PAN)
PAN: Performance Appraisal of Networks (Telecom Network Performance Monitoring System)
Description of PAN
PAN offers a robust and flexible menu-driven reporting facility. Its reporting module provides both routine and customized reports. The user can specify the following for generating summary reports:
- The date of the report to be generated
- The network counters to be used for the reports
- The sort criteria (e.g. by descending utilization, etc. – highest first)
- Threshold values to select the data (e.g. more than three Erlangs traffic)
Reports on a daily, weekly, and monthly basis, on key statistics, help the network operator to consistently monitor under- or over-utilization of network resources, call pattern distribution, quality of service, etc.
PAN’s Features
- Three-dimensional graphs
- Call-key Statistics Module
- Channel Usage Analysis Module
- Network Profitability Ratio Analysis Module
- Comparative Ratio Analysis Module
- Rank of the Network
- A map of the network hierarchy
- Fault management
- ODBC-JDBC Bridge
- OMC-Switch Interface
- BSS Subsystem Planning Module
- Stores network performance for 6 to 12 months
- Reduces data storage load on the telecom network’s OMCs
- Displays multiple graphs for comparisons of various behaviors of network components
- Can be integrated with multi-vendor switch and radio equipment
- Flexible querying and display facility
- Provides indication of revenue earned and revenue lost
- Ease of use – minimum or no training required for MIS use
- Client-server architecture based on JAVA
Conclusion
PAN rides on new technology to take advantage of and keep ahead of competition. There are very few similar products in this class. PAN is better than Metrica and similar products for the following reasons:
- Runs on JAVA and is hardware independent
- More value for less money
- Internet enabled and accessible
- User customizable query builder
Market Analysis Summary
Operations Support Systems (OSS) encompasses a broad range of applications and services. Although definitions vary, OSS typically includes applications geared toward customer acquisition, service provisioning, asset management, network management, customer care, and billing. Increasingly, these applications are becoming more interdependent and carriers are beginning to realize how important world-class OSS is to effectively eliminate competition.
Telecommunications OSS
The OSS segment of the telecommunications industry is experiencing tremendous growth. The increasingly competitive telecommunications market, both wireline and wireless, has increased carriers’ awareness of the importance of OSS. As a result, companies are investing millions of dollars in their OSS in order to improve operations and create a competitive advantage.
In terms of aggregate spending on OSS, projections differ, mainly because there is no consensus on the exact definition of OSS. Nevertheless, the Yankee Group, an internationally recognized leader in research and consulting services, predicts that the OSS market will grow to almost $60 billion worldwide in 2001 before falling off slightly. The slight decrease in spending is the result of more companies choosing to build, rather than buy, certain components of their OSS.
Customer Care & Billing Overview
OSS Telecom Technology currently focuses on one aspect of OSS, customer care and billing (CCB) systems. At its highest level, a CCB system provides a carrier with the means to bill its customers for service. However, bill generation is but one aspect of a complete CCB application. The data captured by the billing system provides valuable information to both the carrier and the customer on how services are used, what additional services are necessary, how services can be used more efficiently, or even how effective particular promotions or operations have been. Today’s CCB systems collect, collate, manage, and report this valuable information to management, usually in real time.
CCB systems are also vital in terms of customer service and satisfaction. By having real time access to customer information, customer service representatives can better respond to customer needs in a timely and efficient manner. In addition, modern CCB systems can turn the monthly bill into an invaluable marketing tool; this is important since the customer’s bill is the only regular contact a company has with its customers. As a result, a great deal of attention is typically place on a company’s CCB applications.
4.1 Market Segmentation
Telecommunications Customer Care & Billing Market Segments
To better understand the market for CCB applications and services, it is useful to consider the market by segments. With respect to OSS Telecom Technology, three main criteria for market segmentation are particularly important: geographic, technological, and subscriber. Within these segments, the number of operators will be examined, since it is operators who buy and use CCB systems.
Geographical Market Segments
The available market for CCB products is not limited to a single country. The market for CCB applications and services is indeed global. Literally every country on earth has some type of telecommunications infrastructure in place. However, the degree of teledensity within countries and the number of competitors within countries varies greatly. Therefore, it is useful to segment the available CCB market into global regions.
OSS Telecom Technology has identified five individual regions: Europe, North America, Latin America, Africa, and Asia. Together, these regions account for the entire world, and OSS Telecom Technology’s potential customers.
Technological Market Segments
Another useful way to look at the overall market is through technology. In this case, the total market was segmented based on whether the operator is a wireless service provider, a wireline service provider, or a provider of both. The number of wireless operators is greater than that of wireline operators. This is to be expected given that in many developing countries wireless is the most cost-effective type of infrastructure. In addition, competition has been active in the wireless market longer than it has been in the wireline market.
Subscriber-Based Market Segments
The last type of market segmentation to consider is subscriber-based. The distinction by subscriber size is important because operators’ needs, with respect to CCB applications, typically change with subscriber levels. Tier 1 operators would typically tend toward in-house development of their CCB applications. Tier 2 operators and Tier 3 operators are more likely to opt for a third party CCB application. OSS Telecom Technology’s primary focus is on Tier 3 operators, which represent the vast majority of available operators.

| Market Analysis | |||||||
| 2000 | 2001 | 2002 | 2003 | 2004 | |||
| Potential Customers | Growth | CAGR | |||||
| Tier 2 Telecom Operators | 8% | 481 | 519 | 561 | 606 | 654 | 7.98% |
| Tier 3 Telecom Operators | 6% | 2,011 | 2,132 | 2,260 | 2,396 | 2,540 | 6.01% |
| Other | 0% | 0 | 0 | 0 | 0 | 0 | 0.00% |
| Total | 6.40% | 2,492 | 2,651 | 2,821 | 3,002 | 3,194 | 6.40% |
4.2 Target Market Segment Strategy
Post-paid Customer Care and Billing
The total available market for Customer Care and Billing (CCB) systems worldwide is projected to be $6.9 billion per year in 2004.
A measurement of total available market is the compilation of the number of telecom operators that will replace their billing system and the number of new billing systems coming online each year. Half of all billing systems are replaced on average every four years. With over 3,500 Tier 2 and Tier 3 telephone operators currently in operation, and a projected 1,500 new Tier 2 and Tier 3 operators coming online over five years, this means that over 4,300 billing systems will be needed in the next five years.
Prepaid Intelligent Networking (IN)
OSS Telecom Technology has projected three primary products in its forecast:
- Post-paid CCB
- Prepaid IN systems
- Consulting Services projects
The post-paid CCB systems will be sold to the number of Tier 2 and Tier 3 operators listed above, specifically, new operators and those who are choosing to replace their current system. Prepaid IN systems have a much broader market opportunity given the small penetration of Prepaid IN in Tier 2 and 3 providers. Operators in developing countries project that over 50% of all calls will eventually be prepaid, while developed countries may reach 35%. This growth, coupled with the fact Prepaid IN is an add-on, increases the number of new systems operators will purchase.
Current prepaid solutions (non-IN based) are expensive, require duplicate switch fabric, and will not be built out to support such a high level of subscriber base. In addition, the operator must support Intelligent Networking capability to support IN functionality over the long term to maintain competitive advantage. All GSM operators currently support IN functionality, and all other operators will certainly implement IN by the year 2005. Very few of the Tier 2 and Tier 3 prepaid solutions today are IN based. This means that the entire Tier 2 and Tier 3 operator base is a potential market for Prepaid IN over the next five years, with over 5,000 operators expected to be in operation by the year 2005. The average price for a Prepaid IN solution for Tier 2 and 3 operators will be $1 million.
OSS Telecom Technology Target Customers
Within OSS Telecom Technology’s stated primary and secondary markets, OSS Telecom Technology has developed a “Stepped Target Market Strategy.” This strategy is based on two key elements:
- Telecom operators have a strong desire to purchase from a vendor with installations similar to their own, and
- That larger CCB vendors are moving upscale to larger operators as they gain more experience and as IT resources continue to become scarce. The primary market of this type of CCB vendors is Tier 1 operators.
OSS Telecom Technology’s first installation base consists primarily of GSM operators in the range of 25,000 subscribers and under. Through a stepped strategy, OSS Telecom Technology is moving in three directions:
- Using this install base to move up to the next band of subscribers within the GSM market,
- Leveraging GSM wireless experience to penetrate other wireless types in the same subscriber bands, and
- Working with GSM operators to provide convergent services such as cable, Internet, and wireline, and therefore gaining experience in these disciplines.
This strategy currently puts OSS Telecom Technology in the Tier 3 (less than 100,000 subscribers) market, with each step carefully planned to be sure we do not overreach. It is key to this strategy to maintain all customers as long-term partners and referenceable sites. We want to under-commit and over-deliver in each step of this strategy.
By repeating this strategy, OSS Telecom Technology, over a five-year period, will offer a wide variety of convergent solutions to Tier 3 and then Tier 2 (100,000 to one million subscribers) telecom operators.
4.2.1 Market Needs
The outlook for the future appears positive. Telecom markets will continue to deregulate and the number of operators will continue to grow to 5,500 in 2004, representing an additional 1,700 when compared to 1998.
With the increase in operators, the demand for OSS has also increased. OSS are the systems on which the telecom operator’s business runs. At the core of OSS is billing for telecom services, which is provided by Customer Care and Billing Systems (CCB). CCB systems enable accurate, timely, flexible, feature-rich billing of services. The additional competition in the marketplace has made OSS and CCB systems, in particular, a key source of competitive advantage for many players. CCB systems have become increasingly sophisticated, incorporating features such as hot-billing (where users receive billing information on demand), Internet billing (billing data disseminated over the Internet), multi-service billing, loyalty programs, and “friends and family” type services.
4.2.2 Geographic Market
Geographic Market
The Stepped Target Market Strategy has been used to develop geographic markets by first developing the geographic market closest to home and expanding as one develops experience. With a large center of excellence in Asia, this was the first market to utilize. Asia and Europe are predominately GSM. As a result, moving from Asia to Europe makes perfect sense. Latin America is expanding the installed base of GSM systems. Therefore, OSS Telecom Technology has made its first step in Latin America and will move forward from there. In addition to Asia, the U.S. and Europe were early targets for consulting services because much of the technology and new solutions are developed in these regions.
OSS Telecom Technology’s target market is focused on providing OSS solutions to both Tier 3 and Tier 2 operator worldwide. The priority of issues which drive the purchase decision for Tier 3 operators is slightly different than for Tier 1 operators. Understanding these priorities is key to developing the OSS Telecom Technology value proposition within its target market. A list of drivers is given below to compare Tier 3 priorities against Tier 1 priorities as part of the selection criteria for selecting a vendor. These priorities are important to consider when differentiating OSS Telecom Technology from Tier 1 CCB vendors.
OSS Telecom Technology’s position relative to these drivers:
- Price: OSS Telecom Technology will maintain a price that is 20% less than Tier 1 market vendors for licenses, and 40% less for services. The service price is significant because it is often 50% or more of the purchase amount for many CCB vendors.
- Features: Within the given product module, OSS Telecom Technology will offer features that meet or exceed Tier 1 vendors. OSS Telecom Technology will also maintain a robust product road map that is discussed and approved by vendors in a user group format.
- Service offering: While service offerings to Tier 3 operators from other CCB vendors are either shrinking or are too expensive, OSS Telecom Technology will offer a complete package of services at affordable prices.
- Product flexibility: OSS Telecom Technology will strive to maintain a lead in the ability of the operator to easily add schemes and re-configure the system. In addition, OSS Telecom Technology will maintain an open environment.
- Scalability: OSS Telecom Technology will continue to engineer scalability into its product. This will entail commitment to multi-rating engines and porting to more robust operating systems like UNIX.
- Vendor experience: OSS Telecom Technology will follow a stepped strategy to be sure we under-commit and over-deliver to our customers.
This positioning strategy differentiates OSS Telecom Technology from Tier 1 CCB vendors. This leaves a number of other CCB vendors which are targeting Tier 3 vendors. The approach of these vendors is to lead with price and minimize service functionality. OSS Telecom Technology believes that most Tier 3 operators desire a full service vendor or a partnership at an affordable price. OSS Telecom Technology intends to be that vendor
4.3 Service Business Analysis
The economics of the telecommunication, Internet, and cable markets support thousands of companies. These companies include direct service providers, hardware suppliers, software suppliers, consultants, and numerous other supporting organizations. However, for the purposes of this report, it is useful to focus only on the companies that provide CCB applications and services.This industry segment is the main focus of OSS Telecom Technology.
4.3.1 Distributing a Service
Channels
Products will be sold through direct and indirect channels. The mix is split evenly between the two. Indirect channels include:
- System Integrators
- Computer Suppliers
- Switch Vendors
- Multi-Tier Operators
OSS Telecom Technology is currently developing relationships with indirect channels including:
- Vertical Matrix
- Compaq
- GemPlus
- CMG
- Harris
- Keppel
- Siemens
- IBM
- Bellcore
- Unysis
Quota Assumptions
The following are quota assumptions for Direct and Indirect Channels per salesperson. As OSS Telecom Technology develops more experience and presence in marketing, our efficiency in sales will increase.
Lead Development
One of the key responsibilities of marketing is lead generation. The following methods are used for lead generation:
- Advertising in trade journals
- Trade shows and conferences
- Telemarketing
- User group
- Direct mailing
- Targeted sales calls
- Customer referrals
4.3.2 Main Competitors
Competitor Financial Performance
The market for billing and customer care has enjoyed solid growth for the past six years. Companies that compete in this market were direct beneficiaries of this growth, as were their shareholders.
Analysis: LHS Group and Saville System
Although OSS Telecom Technology faces numerous competitors in the CCB market, two are worth a closer look. LHS Group and Saville Systems are important because their historical growth and performance mirror OSS Telecom Technology’s projections. Both of these companies focus exclusively on CCB systems and related consulting services, both derive a majority of their sales from the telecommunications industry, both are active in international markets, and both have grown their revenues to over $100 million in approximately five years. LHS Group’s market capitalization grew at a CAGR of 201% from June, 1997 to June, 1998 while Saville’s market capitalization grew at a CAGR of 119% from December, 1995 to June, 1998. The stock market, as measured by the S&P 500 stock index, only returned a Compound Annual Growth Rate (CAGR) of 30% from June, 1997 to June, 1998 and 28% from December, 1995 to June, 1998.
4.3.3 Business Participants
With the increasing demand for OSS and CCB systems, many OSS/CCB software providers have entered the market.It is estimated that there are over 50 vendors for billing and customer care systems worldwide. There is an increasing move by computer and switch vendors, system integrators, and telecom operators (e.g. IBM, Siemens, EDS, Deutsche Telekom) to develop in-house billing and OSS solutions for customers. They are formidable competitors with deep pockets, large existing customer bases, and significant influence on customer decision-making. In addition, the majority of players (both large and small) are extending product service portfolios to provide all services, i.e. Internet, mobile, cable, fixed, and convergent services. OSS Telecom Technology will compete in this market by providing high-value products and services at competitive prices.
Strategy and Implementation Summary
OSS Telecom Technology developed a marketing strategy to ensure long-term growth and success in the OSS marketplace. This strategy continues to be refined and improved and initially includes:
- Locating OSS opportunities within the telecom arena.
- Developing partnerships with telecom operators to provide these solutions.
- Determining if the solution is universal, resulting in a decision of whether or not this project could evolve into a turnkey product or repeatable consulting service.
The advantage of this strategy was threefold:
- As a partner in the project, OSS Telecom Technology gained valuable experience and first hand operator knowledge.
- As a partner, the operator would take a keen interest in the project’s success and set high expectations.
- The solution would be tested in the marketplace, providing important market intelligence.
5.1 Competitive Edge
OSS Telecom Technology will strive to intimately understand the customer in order to provide solutions that match their specific needs.To be successful, OSS Telecom Technology will develop long term relationships and choose customers that share this model.
In the best-selling publication “Discipline of Market Leaders,” customer excellence is defined as “specializing in satisfying unique needs.” These unique needs are recognizable only by a vendor with a close relationship and intimate knowledge of the customer.
For a comprehensive definition of the model for customer excellence, OSS Telecom Technology’s plan includes:
- Develop long-term relationships with our customers.
- Avoid clients who do not have long-term potential.
- Avoid pure transactions or one-time deals.
- Do whatever it takes to please the customer.
- Educate employees to be adaptable, flexible, and multi-talented.
- Create an unmatched value proposition of best total solution for our clients.
- Search for new areas of mutual cooperation.
- To constantly improve our value model, develop a value proposition around solutions, and aggressively evolve and improve each solution.
- Develop an operating model dedicated to delivering unmatched value.
5.2 Marketing Strategy
Within OSS Telecom Technology’s stated primary and secondary markets, OSS Telecom Technology has developed a “Stepped Target Market Strategy.” This strategy is based on two key elements:
- Telecom operators have a strong desire to purchase from a vendor with installations similar to their own, and
- That larger CCB vendors are moving upscale to larger operators as they gain more experience and as IT resources continue to become scarce. The primary market of this type of CCB vendors is Tier 1 operators.
OSS Telecom Technology’s first installation base consists primarily of GSM operators in the range of 25,000 subscribers and under. Through a stepped strategy, OSS Telecom Technology is moving in three directions:
- Using this install base to move up to the next band of subscribers within the GSM market
- Leveraging GSM wireless experience to penetrate other wireless types in the same subscriber bands
- Working with GSM operators to provide convergent services such as cable, Internet, and wireline, and therefore gaining experience in these disciplines.
This strategy currently puts OSS Telecom Technology in the Tier 3 (less than 100,000 subscribers) market, with each step carefully planned to be sure we do not overreach. It is key to this strategy to maintain all customers as long-term partners and referenceable sites. We want to under-commit and over-deliver in each step of this strategy.
5.2.1 Promotion Strategy
One of the key responsibilities of marketing is lead generation. The following methods are used for lead generation:
- Advertising in Trade Journals
- Trade Shows and Conferences
- Telemarketing
- User Group Direct Mailing
5.2.2 Pricing Strategy
Our pricing strategy for products is to maintain a 30% to 40% advantage below Tier 1 CCB vendors for total installation cost which includes license fees, installation services and custom services. Coupled with our strong product road map, OSS Telecom Technology believes that this forms the core of a very strong value proposition.
Post-Warranty Customer Service Pricing
OSS Telecom Technology offers two customer service packages to meet the needs of various operator requirements:
Extended Customer Service
- 24×7 Technical Support Desk
- Problem Solving
- Maintenance Releases
- On-site Support
Business Partner 2000
- 24×7 Technical Support Desk
- Problem Solving
- Maintenance Releases
- On-Site Support
- Proactive Operational Visits
- Software Upgrades
- New modules within the CARIBOU suite
5.3 Sales Strategy
The OSS Telecom Technology sales model is solution-based and a team sale.This sales team will encompass Field Marketing, Program Management, Support, and Product Management as needed.The five groups which form the team are listed below:
- Field Sales will develop and maintain relationships.
- Field Marketing will define local requirements, develop PR campaigns, and support the local sales effort.
- Program Management will be the portal into OSS Telecom Technology operations and will be the primary contact for sales and the customer concerning project status.
- Product Management will define in detail the functional specifications for the product development group.
- These specifications will be derived from Field Marketing requirements. Product Management manages all the product release processes to the field, and will be the keeper of the three-year product road map and will offer expertise as needed.
- Field and Customer Support will help maintain the relationship throughout the life of the install.
5.3.1 Sales Forecast
Revenues are calculated separately for each product and for maintenance and Consulting Services. In addition, product revenue is broken out between New Sales and Upgrade Sales. New Sales and Upgrade Sales are further broken down into License, Installation, and Customization revenue. The products included in this forecast are Customer Care and Billing (CCB) products, Prepaid IN (PPIN) products, and the Short Messaging (SMSC) product. Each product and service revenue assumption is detailed below.
Pricing assumptions for licenses include a 10% discount from list for direct sales and 30% from list for indirect sales. Sales are forecast at 50% direct and 50% indirect resulting in a weighted average discount of 20%. Pricing for licenses stays constant over the five year period. OSS Telecom Technology does not increase license pricing while significantly increasing feature set to maintain competitive pricing advantage over the five-year period.

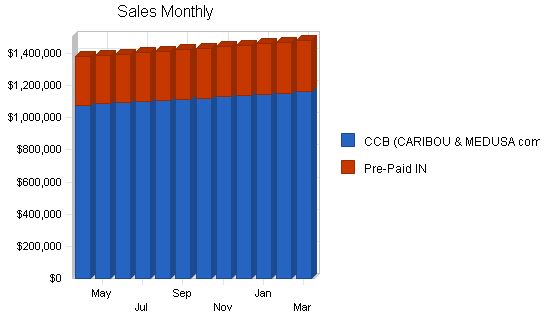
| Sales Forecast | |||
| FY 2001 | FY 2002 | FY 2003 | |
| Sales | |||
| CCB (CARIBOU & MEDUSA combined) | $13,432,825 | $19,857,900 | $30,434,900 |
| Pre-Paid IN | $3,715,905 | $7,136,300 | $10,317,800 |
| Total Sales | $17,148,730 | $26,994,200 | $40,752,700 |
| Direct Cost of Sales | FY 2001 | FY 2002 | FY 2003 |
| CCB (CARIBOU & MEDUSA combined) | $1,679,105 | $2,482,238 | $3,804,363 |
| Pre-Paid IN | $464,488 | $892,038 | $1,289,725 |
| Subtotal Direct Cost of Sales | $2,143,593 | $3,374,276 | $5,094,088 |
5.4 Milestones
One of the benefits of having a large engineering team is the ability to develop solutions for our customers that are comprehensive and extend our target markets stepwise into additional service operators. In this sense, we will engage our customers in user groups and develop a comprehensive product road map. Half of the product road map will contain items directly requested by our customers. The remainder of the product road map will be based on strategic market analysis.
OSS Telecom Technology has initiated the process of ISO 9000 certification for its systems and procedures. The systems will be certified for our Taiwan operations. All OSS Telecom Technology engineering is being performed out of its Taiwan development center, therefore OSS Telecom Technology will initially apply for certification of those operations. OSS Telecom Technology has completed most milestones. It is expected that OSS Telecom Technology’s Taiwan operations will achieve ISO 9000 certification by June, 2001.

| Milestones | |||||
| Milestone | Start Date | End Date | Budget | Manager | Department |
| CCB (CARIBOU & MEDUSA) – Convergent Billing | 4/1/2000 | 3/31/2001 | $875,000 | K. Jones | Product Development |
| CCB (CARIBOU & MEDUSA) – Tier 2 Operators | 4/1/2001 | 3/31/2002 | $810,000 | K. Jones | Product Development |
| CCB (CARIBOU & MEDUSA) – Multi-Service One Number Billing | 4/1/2002 | 3/31/2003 | $795,000 | K. Jones | Product Development |
| Pre-Paid IN / Calling Card – IN-Node APIs | 4/1/2000 | 3/31/2001 | $720,000 | K. Jones | Product Development |
| Pre-Paid IN / Calling Card – ISO 9000 | 4/1/2000 | 3/31/2001 | $1,235,000 | K. Jones | Product Development |
| Pre-Paid IN / Calling Card – Convergent Billing | 4/1/2001 | 3/31/2002 | $680,000 | K. Jones | Product Development |
| Pre-Paid IN / Calling Card – Tier 2 Operators | 4/1/2002 | 3/31/2003 | $745,000 | K. Jones | Product Development |
| Totals | $5,860,000 | ||||
Management Summary
OSS Telecom Technology has assembled a staff of professionals with extensive experience in both the IT and telephony industries. Executive management personnel average more than 20 years of experience. Other key management personnel average more than 10 years of experience, demonstrating a highly-qualified team.
6.1 Management Team
Executive Officers and Key Management
Victor Smith, President and Chief Executive Officer
Mr. Smith oversees all sales, marketing, technical and financial areas of the company. He has over 25 years of international and domestic telecom experience with primary focus on telephony and data service companies and concentrated efforts on international sales, marketing, and product development. Mr. Smith spent the last 12 years as Vice President of Technical Operations and Chief Operating Officer with Atlas Telecom where he was instrumental in the significant success of developing a company from start-up to a $70 million enterprise. Additionally, he was Executive Vice President of Sidereal Corporation, responsible for technical support, development, manufacturing, and customer support. In this role, he guided the design and manufacture of telecommunications equipment ranging from low-cost single-user terminals to multiple-switch government installations. Mr. Smith also spent several years with Tektronix.
Kenneth Jones, Executive Vice President
Product Management and Program Management
Mr. Jones is responsible for all product management and program management that includes the areas of market research, strategic planning, competitive analysis, product definition, proposal development, and project management. Mr. Jones has 25 years experience in the telecom industry, primarily in areas relating to engineering, customer support, and product definition. These areas of expertise include product documentation and integration, network operations and network management applications, data communication protocols, technical support, field support, and customer installations. Previous positions held by Mr. Jones include Vice President of Support Services, Director of Engineering and Manager of Software Development for the firms of Atlas Telecom, NCR Corporation and Harris Corporation.
James Jackson, Executive Vice President, Global Marketing
Mr. Jackson joined OSS Telecom Technology from Technology Control Services, a leading international provider of prepaid card solutions and services to Tier one and Tier two Telecom operators, where he was Executive Vice President of Sales and Marketing. He has had 20 years experience of the international computer software and telecommunications industries has included positions at Atlas Telecom, Mosaics, Lotus Development Corporation, IBM and the MITRE Corporation.
Ken Smithe, Executive Vice President, Technical Services
Mr. Smithe has 30 years experience in Information Systems and Technology and has spent the last 10 years in the telecommunications industry. He has held Senior Management positions at MIDCOM Communications, Premier Cruises, U.S. Intelco Networks, and Westin Hotels & Resorts.
6.2 Personnel Plan
The following table lists all personnel, classified by function.
| Personnel Plan | |||
| FY 2001 | FY 2002 | FY 2003 | |
| Production Personnel | |||
| Technical Services Management | $406,800 | $447,500 | $492,300 |
| Technical Services Personnel | $306,000 | $336,600 | $370,300 |
| Other | $0 | $0 | $0 |
| Subtotal | $712,800 | $784,100 | $862,600 |
| Sales and Marketing Personnel | |||
| Sales Management | $480,000 | $528,000 | $580,800 |
| Account Executives | $1,710,000 | $2,430,000 | $3,330,000 |
| Marketing Personnel | $2,940,000 | $3,840,000 | $5,280,000 |
| Marketing Management | $456,000 | $501,600 | $551,760 |
| Subtotal | $5,586,000 | $7,299,600 | $9,742,560 |
| General and Administrative Personnel | |||
| Administration | $538,800 | $592,700 | $652,000 |
| Human Resources & Training Personnel | $693,600 | $763,000 | $839,300 |
| Financial Management | $346,800 | $381,500 | $419,700 |
| Finance & Accounting Personnel | $802,800 | $883,100 | $971,400 |
| Subtotal | $2,382,000 | $2,620,300 | $2,882,400 |
| Other Personnel | |||
| Product Development Management | $428,400 | $471,300 | $518,400 |
| Product Development Personnel | $1,002,000 | $1,102,200 | $1,212,500 |
| Other | $0 | $0 | $0 |
| Subtotal | $1,430,400 | $1,573,500 | $1,730,900 |
| Total People | 548 | 798 | 1011 |
| Total Payroll | $10,111,200 | $12,277,500 | $15,218,460 |
Financial Plan
The market and related entry strategy mentioned earlier in this Business Plan is reflected in the assumptions used to build the financial model and corresponding pro-forma financial statements.The management of OSS Telecom Technology, Inc. believes these projections to be on the conservative side and, therefore, very attainable.
7.1 Important Assumptions
Income Statement
The income statement presented here demonstrates the projected results of operations for the period FY 1999 through FY 2004 on a consolidated basis for OSS Telecom Technology and OSS Telecom Technology Taiwan.
Sources & Uses of Funds
There are two sources and uses of funds presented:
- Assuming no cash infusion, a minimum cash requirement is calculated demonstrating the shortfall.
- Assuming needed cash is raised in an initial private placement, what the cash position would be in each of the years.
Balance Sheet
There are two balance sheets presented which accompany the two above mentioned sources and uses of funds statements.
- Related to the scenario of no cash infusion, a negative impact on the balance sheet creates a company that cannot survive under the current aggressive growth plan.
- The balance sheet related to the projection of a $20 million private placement occurring in the first quarter of Fiscal Year (FY) 2001. This represents a company able to meet projections based upon its planned growth targets.
| General Assumptions | |||
| FY 2001 | FY 2002 | FY 2003 | |
| Plan Month | 1 | 2 | 3 |
| Current Interest Rate | 10.00% | 10.00% | 10.00% |
| Long-term Interest Rate | 10.00% | 10.00% | 10.00% |
| Tax Rate | 25.00% | 25.00% | 25.00% |
| Other | 0 | 0 | 0 |
7.2 Key Financial Indicators
The following chart focuses on the key financial indicators of the company.

7.3 Break-even Analysis
The following chart and table illustrate the break-even requirements for the company.

| Break-even Analysis | |
| Monthly Revenue Break-even | $1,336,343 |
| Assumptions: | |
| Average Percent Variable Cost | 13% |
| Estimated Monthly Fixed Cost | $1,169,300 |
7.4 Projected Profit and Loss
The income statement presented here demonstrates the projected results of operations for the period FY 2001 through FY 2003 on a consolidated basis for OSS Telecom Technology and OSS Telecom Technology Taiwan.
License revenues consist of license fees for the company’s software. Service revenues consist of fees for customer-defined customization, installation, and product support services. In addition, other lesser service revenues are for maintenance fees and training fees. After establishing the necessary infrastructure in the first two years, Net Profit/Sales will grow in FY 2003.
Revenue recognition for the various sources of fees is as follows:
- License revenues for one-time license sales without customization are recognized upon delivery of the software to the customer.
- License revenues for license sales, which require customization of the software, are recognized over the estimated term of the installation of such software based on the percentage of completion method of accounting.
- Maintenance fees are recognized ratably over the term of the maintenance contract.
- Training fees are recognized as the training is performed.
- Service revenues performed for customization and installation of both the initial system and subsequent upgrades are accounted for over the estimated term of such services based on the percentage of completion method of accounting.
Revenues are projected to grow significantly from FY 1999 that ends on March 31, 1999, through FY 2003. This represents a comfortable growth rate through FY 2003. Revenues are broken down into two major classifications:
- License Sales
- Services
License revenues are classified as new license sales and upgrade license sales. These are further broken down between current Customer Care and Billing (CCB) solutions and planned new products of Prepaid IN and Short Message Service.
Cost of Goods Sold (COGS) consists primarily of salaries and related labor loadings associated with installation, customization, and product support activities. It also includes third party costs associated with system integrators and, to a lesser extent, costs related to providing software maintenance and end-user training to customers. COGS are expected to be a decreasing percentage of revenues in FY 2000 through FY 2003 as the number of subscribers per license sale grows and there is a corresponding decrease in the cost per subscriber.
Gross margin is projected to stay high from FY 1999 onward and grow in FY 2003 as the company attains economy of scale. The compound annual growth rate for gross margin in FY 2004 will outpace revenue growth.
Other Income and Expense are associated with debt service, amortization of excess acquisition costs and interest income.


| Pro Forma Profit and Loss | |||
| FY 2001 | FY 2002 | FY 2003 | |
| Sales | $17,148,730 | $26,994,200 | $40,752,700 |
| Direct Cost of Sales | $2,143,593 | $3,374,276 | $5,094,088 |
| Production Payroll | $712,800 | $784,100 | $862,600 |
| Other | $0 | $0 | $0 |
| Total Cost of Sales | $2,856,393 | $4,158,376 | $5,956,688 |
| Gross Margin | $14,292,337 | $22,835,824 | $34,796,012 |
| Gross Margin % | 83.34% | 84.60% | 85.38% |
| Operating Expenses | |||
| Sales and Marketing Expenses | |||
| Sales and Marketing Payroll | $5,586,000 | $7,299,600 | $9,742,560 |
| Advertising/Promotion | $946,800 | $1,098,000 | $1,185,000 |
| Travel | $3,060,000 | $3,186,000 | $3,297,000 |
| Total Sales and Marketing Expenses | $9,592,800 | $11,583,600 | $14,224,560 |
| Sales and Marketing % | 55.94% | 42.91% | 34.90% |
| General and Administrative Expenses | |||
| General and Administrative Payroll | $2,382,000 | $2,620,300 | $2,882,400 |
| Sales and Marketing and Other Expenses | $0 | $0 | $0 |
| Depreciation | $26,400 | $27,500 | $28,700 |
| Rent | $54,000 | $59,000 | $64,000 |
| Depreciation | $276,000 | $316,000 | $398,000 |
| Leased Equipment | $158,400 | $159,700 | $164,300 |
| Utilities | $27,600 | $28,400 | $29,600 |
| Payroll Taxes | $0 | $0 | $0 |
| Total General and Administrative Expenses | $2,924,400 | $3,210,900 | $3,567,000 |
| General and Administrative % | 17.05% | 11.89% | 8.75% |
| Other Expenses: | |||
| Other Payroll | $1,430,400 | $1,573,500 | $1,730,900 |
| Contract/Consultants | $84,000 | $78,000 | $69,000 |
| Total Other Expenses | $1,514,400 | $1,651,500 | $1,799,900 |
| Other % | 8.83% | 6.12% | 4.42% |
| Total Operating Expenses | $14,031,600 | $16,446,000 | $19,591,460 |
| Profit Before Interest and Taxes | $260,737 | $6,389,824 | $15,204,552 |
| EBITDA | $287,137 | $6,417,324 | $15,233,252 |
| Interest Expense | $97,584 | $88,000 | $78,000 |
| Taxes Incurred | $40,788 | $1,575,456 | $3,781,638 |
| Net Profit | $122,365 | $4,726,368 | $11,344,914 |
| Net Profit/Sales | 0.71% | 17.51% | 27.84% |
7.5 Projected Cash Flow
The primary assumption on the Sources and Uses Statement is that cash would be raised in an initial private placement.

| Pro Forma Cash Flow | |||
| FY 2001 | FY 2002 | FY 2003 | |
| Cash Received | |||
| Cash from Operations | |||
| Cash Sales | $4,287,183 | $6,748,550 | $10,188,175 |
| Cash from Receivables | $12,538,878 | $18,995,975 | $28,818,173 |
| Subtotal Cash from Operations | $16,826,060 | $25,744,525 | $39,006,348 |
| Additional Cash Received | |||
| Sales Tax, VAT, HST/GST Received | $0 | $0 | $0 |
| New Current Borrowing | $0 | $0 | $0 |
| New Other Liabilities (interest-free) | $0 | $0 | $0 |
| New Long-term Liabilities | $0 | $0 | $0 |
| Sales of Other Current Assets | $0 | $0 | $0 |
| Sales of Long-term Assets | $0 | $0 | $0 |
| New Investment Received | $20,000,000 | $0 | $0 |
| Subtotal Cash Received | $36,826,060 | $25,744,525 | $39,006,348 |
| Expenditures | FY 2001 | FY 2002 | FY 2003 |
| Expenditures from Operations | |||
| Cash Spending | $10,111,200 | $12,277,500 | $15,218,460 |
| Bill Payments | $8,432,054 | $9,715,680 | $13,815,602 |
| Subtotal Spent on Operations | $18,543,254 | $21,993,180 | $29,034,062 |
| Additional Cash Spent | |||
| Sales Tax, VAT, HST/GST Paid Out | $0 | $0 | $0 |
| Principal Repayment of Current Borrowing | $0 | $0 | $0 |
| Other Liabilities Principal Repayment | $0 | $0 | $0 |
| Long-term Liabilities Principal Repayment | $100,000 | $100,000 | $100,000 |
| Purchase Other Current Assets | $0 | $0 | $0 |
| Purchase Long-term Assets | $0 | $0 | $0 |
| Dividends | $0 | $0 | $0 |
| Subtotal Cash Spent | $18,643,254 | $22,093,180 | $29,134,062 |
| Net Cash Flow | $18,182,806 | $3,651,345 | $9,872,287 |
| Cash Balance | $1,410,806 | $5,062,151 | $14,934,438 |
7.6 Projected Balance Sheet
The Balance Sheet presented accompanies the above mentioned sources and uses of funds statement, with the assumption of a projection of a $20 million private placement occurring in the first quarter of FY 2001. This represents a company able to meet projections based upon its planned growth targets.
| Pro Forma Balance Sheet | |||
| FY 2001 | FY 2002 | FY 2003 | |
| Assets | |||
| Current Assets | |||
| Cash | $1,410,806 | $5,062,151 | $14,934,438 |
| Accounts Receivable | $2,176,670 | $3,426,345 | $5,172,696 |
| Other Current Assets | $1,511,000 | $1,511,000 | $1,511,000 |
| Total Current Assets | $5,098,476 | $9,999,496 | $21,618,134 |
| Long-term Assets | |||
| Long-term Assets | $8,917,000 | $8,917,000 | $8,917,000 |
| Accumulated Depreciation | $1,720,400 | $1,747,900 | $1,776,600 |
| Total Long-term Assets | $7,196,600 | $7,169,100 | $7,140,400 |
| Total Assets | $12,295,076 | $17,168,596 | $28,758,534 |
| Liabilities and Capital | FY 2001 | FY 2002 | FY 2003 |
| Current Liabilities | |||
| Accounts Payable | $571,711 | $818,863 | $1,163,887 |
| Current Borrowing | $0 | $0 | $0 |
| Other Current Liabilities | $0 | $0 | $0 |
| Subtotal Current Liabilities | $571,711 | $818,863 | $1,163,887 |
| Long-term Liabilities | $930,000 | $830,000 | $730,000 |
| Total Liabilities | $1,501,711 | $1,648,863 | $1,893,887 |
| Paid-in Capital | $21,667,000 | $21,667,000 | $21,667,000 |
| Retained Earnings | ($10,996,000) | ($10,873,635) | ($6,147,267) |
| Earnings | $122,365 | $4,726,368 | $11,344,914 |
| Total Capital | $10,793,365 | $15,519,733 | $26,864,647 |
| Total Liabilities and Capital | $12,295,076 | $17,168,596 | $28,758,534 |
| Net Worth | $10,793,365 | $15,519,733 | $26,864,647 |
7.7 Business Ratios
The following is a summarized list of key business ratios for the company. The final column of the table, Industry Profiles, shows important ratios from the communications services industry, as defined by the Standard Industry Classification (SIC) Index code 4899, Communications Services, NEC (not elsewhere classified).
| Ratio Analysis | ||||
| FY 2001 | FY 2002 | FY 2003 | Industry Profile | |
| Sales Growth | 48.95% | 57.41% | 50.97% | 5.92% |
| Percent of Total Assets | ||||
| Accounts Receivable | 17.70% | 19.96% | 17.99% | 18.27% |
| Other Current Assets | 12.29% | 8.80% | 5.25% | 41.72% |
| Total Current Assets | 41.47% | 58.24% | 75.17% | 63.98% |
| Long-term Assets | 58.53% | 41.76% | 24.83% | 36.02% |
| Total Assets | 100.00% | 100.00% | 100.00% | 100.00% |
| Current Liabilities | 4.65% | 4.77% | 4.05% | 26.17% |
| Long-term Liabilities | 7.56% | 4.83% | 2.54% | 25.88% |
| Total Liabilities | 12.21% | 9.60% | 6.59% | 52.05% |
| Net Worth | 87.79% | 90.40% | 93.41% | 47.95% |
| Percent of Sales | ||||
| Sales | 100.00% | 100.00% | 100.00% | 100.00% |
| Gross Margin | 83.34% | 84.60% | 85.38% | 54.99% |
| Selling, General & Administrative Expenses | 84.55% | 66.91% | 56.20% | 34.50% |
| Advertising Expenses | 5.11% | 3.64% | 2.50% | 1.31% |
| Profit Before Interest and Taxes | 1.52% | 23.67% | 37.31% | 2.80% |
| Main Ratios | ||||
| Current | 8.92 | 12.21 | 18.57 | 1.89 |
| Quick | 8.92 | 12.21 | 18.57 | 1.53 |
| Total Debt to Total Assets | 12.21% | 9.60% | 6.59% | 63.38% |
| Pre-tax Return on Net Worth | 1.51% | 40.61% | 56.31% | 3.49% |
| Pre-tax Return on Assets | 1.33% | 36.71% | 52.60% | 9.54% |
| Additional Ratios | FY 2001 | FY 2002 | FY 2003 | |
| Net Profit Margin | 0.71% | 17.51% | 27.84% | n.a |
| Return on Equity | 1.13% | 30.45% | 42.23% | n.a |
| Activity Ratios | ||||
| Accounts Receivable Turnover | 5.91 | 5.91 | 5.91 | n.a |
| Collection Days | 59 | 51 | 51 | n.a |
| Accounts Payable Turnover | 12.05 | 12.17 | 12.17 | n.a |
| Payment Days | 36 | 25 | 26 | n.a |
| Total Asset Turnover | 1.39 | 1.57 | 1.42 | n.a |
| Debt Ratios | ||||
| Debt to Net Worth | 0.14 | 0.11 | 0.07 | n.a |
| Current Liab. to Liab. | 0.38 | 0.50 | 0.61 | n.a |
| Liquidity Ratios | ||||
| Net Working Capital | $4,526,765 | $9,180,633 | $20,454,247 | n.a |
| Interest Coverage | 2.67 | 72.61 | 194.93 | n.a |
| Additional Ratios | ||||
| Assets to Sales | 0.72 | 0.64 | 0.71 | n.a |
| Current Debt/Total Assets | 5% | 5% | 4% | n.a |
| Acid Test | 5.11 | 8.03 | 14.13 | n.a |
| Sales/Net Worth | 1.59 | 1.74 | 1.52 | n.a |
| Dividend Payout | 0.00 | 0.00 | 0.00 | n.a |
Appendix
| Personnel Plan | |||||||||||||
| Apr | May | Jun | Jul | Aug | Sep | Oct | Nov | Dec | Jan | Feb | Mar | ||
| Production Personnel | |||||||||||||
| Technical Services Management | $33,900 | $33,900 | $33,900 | $33,900 | $33,900 | $33,900 | $33,900 | $33,900 | $33,900 | $33,900 | $33,900 | $33,900 | |
| Technical Services Personnel | $25,500 | $25,500 | $25,500 | $25,500 | $25,500 | $25,500 | $25,500 | $25,500 | $25,500 | $25,500 | $25,500 | $25,500 | |
| Other | $0 | $0 | $0 | $0 | $0 | $0 | $0 | $0 | $0 | $0 | $0 | $0 | |
| Subtotal | $59,400 | $59,400 | $59,400 | $59,400 | $59,400 | $59,400 | $59,400 | $59,400 | $59,400 | $59,400 | $59,400 | $59,400 | |
| Sales and Marketing Personnel | |||||||||||||
| Sales Management | $40,000 | $40,000 | $40,000 | $40,000 | $40,000 | $40,000 | $40,000 | $40,000 | $40,000 | $40,000 | $40,000 | $40,000 | |
| Account Executives | $142,500 | $142,500 | $142,500 | $142,500 | $142,500 | $142,500 | $142,500 | $142,500 | $142,500 | $142,500 | $142,500 | $142,500 | |
| Marketing Personnel | $245,000 | $245,000 | $245,000 | $245,000 | $245,000 | $245,000 | $245,000 | $245,000 | $245,000 | $245,000 | $245,000 | $245,000 | |
| Marketing Management | $38,000 | $38,000 | $38,000 | $38,000 | $38,000 | $38,000 | $38,000 | $38,000 | $38,000 | $38,000 | $38,000 | $38,000 | |
| Subtotal | $465,500 | $465,500 | $465,500 | $465,500 | $465,500 | $465,500 | $465,500 | $465,500 | $465,500 | $465,500 | $465,500 | $465,500 | |
| General and Administrative Personnel | |||||||||||||
| Administration | $44,900 | $44,900 | $44,900 | $44,900 | $44,900 | $44,900 | $44,900 | $44,900 | $44,900 | $44,900 | $44,900 | $44,900 | |
| Human Resources & Training Personnel | $57,800 | $57,800 | $57,800 | $57,800 | $57,800 | $57,800 | $57,800 | $57,800 | $57,800 | $57,800 | $57,800 | $57,800 | |
| Financial Management | $28,900 | $28,900 | $28,900 | $28,900 | $28,900 | $28,900 | $28,900 | $28,900 | $28,900 | $28,900 | $28,900 | $28,900 | |
| Finance & Accounting Personnel | $66,900 | $66,900 | $66,900 | $66,900 | $66,900 | $66,900 | $66,900 | $66,900 | $66,900 | $66,900 | $66,900 | $66,900 | |
| Subtotal | $198,500 | $198,500 | $198,500 | $198,500 | $198,500 | $198,500 | $198,500 | $198,500 | $198,500 | $198,500 | $198,500 | $198,500 | |
| Other Personnel | |||||||||||||
| Product Development Management | $35,700 | $35,700 | $35,700 | $35,700 | $35,700 | $35,700 | $35,700 | $35,700 | $35,700 | $35,700 | $35,700 | $35,700 | |
| Product Development Personnel | $83,500 | $83,500 | $83,500 | $83,500 | $83,500 | $83,500 | $83,500 | $83,500 | $83,500 | $83,500 | $83,500 | $83,500 | |
| Other | $0 | $0 | $0 | $0 | $0 | $0 | $0 | $0 | $0 | $0 | $0 | $0 | |
| Subtotal | $119,200 | $119,200 | $119,200 | $119,200 | $119,200 | $119,200 | $119,200 | $119,200 | $119,200 | $119,200 | $119,200 | $119,200 | |
| Total People | 397 | 411 | 425 | 439 | 453 | 467 | 481 | 495 | 509 | 523 | 537 | 548 | |
| Total Payroll | $842,600 | $842,600 | $842,600 | $842,600 | $842,600 | $842,600 | $842,600 | $842,600 | $842,600 | $842,600 | $842,600 | $842,600 | |
| General Assumptions | |||||||||||||
| Apr | May | Jun | Jul | Aug | Sep | Oct | Nov | Dec | Jan | Feb | Mar | ||
| Plan Month | 1 | 2 | 3 | 4 | 5 | 6 | 7 | 8 | 9 | 10 | 11 | 12 | |
| Current Interest Rate | 10.00% | 10.00% | 10.00% | 10.00% | 10.00% | 10.00% | 10.00% | 10.00% | 10.00% | 10.00% | 10.00% | 10.00% | |
| Long-term Interest Rate | 10.00% | 10.00% | 10.00% | 10.00% | 10.00% | 10.00% | 10.00% | 10.00% | 10.00% | 10.00% | 10.00% | 10.00% | |
| Tax Rate | 25.00% | 25.00% | 25.00% | 25.00% | 25.00% | 25.00% | 25.00% | 25.00% | 25.00% | 25.00% | 25.00% | 25.00% | |
| Other | 0 | 0 | 0 | 0 | 0 | 0 | 0 | 0 | 0 | 0 | 0 | 0 | |
| Pro Forma Profit and Loss | |||||||||||||
| Apr | May | Jun | Jul | Aug | Sep | Oct | Nov | Dec | Jan | Feb | Mar | ||
| Sales | $1,378,850 | $1,387,850 | $1,396,740 | $1,405,790 | $1,414,910 | $1,424,080 | $1,433,310 | $1,442,620 | $1,451,965 | $1,461,360 | $1,470,855 | $1,480,400 | |
| Direct Cost of Sales | $172,357 | $173,481 | $174,593 | $175,724 | $176,863 | $178,010 | $179,164 | $180,328 | $181,496 | $182,670 | $183,857 | $185,050 | |
| Production Payroll | $59,400 | $59,400 | $59,400 | $59,400 | $59,400 | $59,400 | $59,400 | $59,400 | $59,400 | $59,400 | $59,400 | $59,400 | |
| Other | $0 | $0 | $0 | $0 | $0 | $0 | $0 | $0 | $0 | $0 | $0 | $0 | |
| Total Cost of Sales | $231,757 | $232,881 | $233,993 | $235,124 | $236,263 | $237,410 | $238,564 | $239,728 | $240,896 | $242,070 | $243,257 | $244,450 | |
| Gross Margin | $1,147,093 | $1,154,969 | $1,162,747 | $1,170,666 | $1,178,647 | $1,186,670 | $1,194,746 | $1,202,892 | $1,211,069 | $1,219,290 | $1,227,598 | $1,235,950 | |
| Gross Margin % | 83.19% | 83.22% | 83.25% | 83.27% | 83.30% | 83.33% | 83.36% | 83.38% | 83.41% | 83.44% | 83.46% | 83.49% | |
| Operating Expenses | |||||||||||||
| Sales and Marketing Expenses | |||||||||||||
| Sales and Marketing Payroll | $465,500 | $465,500 | $465,500 | $465,500 | $465,500 | $465,500 | $465,500 | $465,500 | $465,500 | $465,500 | $465,500 | $465,500 | |
| Advertising/Promotion | $78,900 | $78,900 | $78,900 | $78,900 | $78,900 | $78,900 | $78,900 | $78,900 | $78,900 | $78,900 | $78,900 | $78,900 | |
| Travel | $255,000 | $255,000 | $255,000 | $255,000 | $255,000 | $255,000 | $255,000 | $255,000 | $255,000 | $255,000 | $255,000 | $255,000 | |
| Total Sales and Marketing Expenses | $799,400 | $799,400 | $799,400 | $799,400 | $799,400 | $799,400 | $799,400 | $799,400 | $799,400 | $799,400 | $799,400 | $799,400 | |
| Sales and Marketing % | 57.98% | 57.60% | 57.23% | 56.86% | 56.50% | 56.13% | 55.77% | 55.41% | 55.06% | 54.70% | 54.35% | 54.00% | |
| General and Administrative Expenses | |||||||||||||
| General and Administrative Payroll | $198,500 | $198,500 | $198,500 | $198,500 | $198,500 | $198,500 | $198,500 | $198,500 | $198,500 | $198,500 | $198,500 | $198,500 | |
| Sales and Marketing and Other Expenses | $0 | $0 | $0 | $0 | $0 | $0 | $0 | $0 | $0 | $0 | $0 | $0 | |
| Depreciation | $2,200 | $2,200 | $2,200 | $2,200 | $2,200 | $2,200 | $2,200 | $2,200 | $2,200 | $2,200 | $2,200 | $2,200 | |
| Rent | $4,500 | $4,500 | $4,500 | $4,500 | $4,500 | $4,500 | $4,500 | $4,500 | $4,500 | $4,500 | $4,500 | $4,500 | |
| Depreciation | $23,000 | $23,000 | $23,000 | $23,000 | $23,000 | $23,000 | $23,000 | $23,000 | $23,000 | $23,000 | $23,000 | $23,000 | |
| Leased Equipment | $13,200 | $13,200 | $13,200 | $13,200 | $13,200 | $13,200 | $13,200 | $13,200 | $13,200 | $13,200 | $13,200 | $13,200 | |
| Utilities | 15% | $2,300 | $2,300 | $2,300 | $2,300 | $2,300 | $2,300 | $2,300 | $2,300 | $2,300 | $2,300 | $2,300 | $2,300 |
| Payroll Taxes | 15% | $0 | $0 | $0 | $0 | $0 | $0 | $0 | $0 | $0 | $0 | $0 | $0 |
| Total General and Administrative Expenses | $243,700 | $243,700 | $243,700 | $243,700 | $243,700 | $243,700 | $243,700 | $243,700 | $243,700 | $243,700 | $243,700 | $243,700 | |
| General and Administrative % | 17.67% | 17.56% | 17.45% | 17.34% | 17.22% | 17.11% | 17.00% | 16.89% | 16.78% | 16.68% | 16.57% | 16.46% | |
| Other Expenses: | |||||||||||||
| Other Payroll | $119,200 | $119,200 | $119,200 | $119,200 | $119,200 | $119,200 | $119,200 | $119,200 | $119,200 | $119,200 | $119,200 | $119,200 | |
| Contract/Consultants | $7,000 | $7,000 | $7,000 | $7,000 | $7,000 | $7,000 | $7,000 | $7,000 | $7,000 | $7,000 | $7,000 | $7,000 | |
| Total Other Expenses | $126,200 | $126,200 | $126,200 | $126,200 | $126,200 | $126,200 | $126,200 | $126,200 | $126,200 | $126,200 | $126,200 | $126,200 | |
| Other % | 9.15% | 9.09% | 9.04% | 8.98% | 8.92% | 8.86% | 8.80% | 8.75% | 8.69% | 8.64% | 8.58% | 8.52% | |
| Total Operating Expenses | $1,169,300 | $1,169,300 | $1,169,300 | $1,169,300 | $1,169,300 | $1,169,300 | $1,169,300 | $1,169,300 | $1,169,300 | $1,169,300 | $1,169,300 | $1,169,300 | |
| Profit Before Interest and Taxes | ($22,207) | ($14,331) | ($6,553) | $1,366 | $9,347 | $17,370 | $25,446 | $33,592 | $41,769 | $49,990 | $58,298 | $66,650 | |
| EBITDA | ($20,007) | ($12,131) | ($4,353) | $3,566 | $11,547 | $19,570 | $27,646 | $35,792 | $43,969 | $52,190 | $60,498 | $68,850 | |
| Interest Expense | $8,514 | $8,444 | $8,375 | $8,306 | $8,236 | $8,167 | $8,097 | $8,028 | $7,958 | $7,889 | $7,819 | $7,750 | |
| Taxes Incurred | ($7,680) | ($5,694) | ($3,732) | ($1,735) | $278 | $2,301 | $4,337 | $6,391 | $8,453 | $10,525 | $12,620 | $14,725 | |
| Net Profit | ($23,041) | ($17,082) | ($11,196) | ($5,205) | $833 | $6,902 | $13,012 | $19,173 | $25,358 | $31,576 | $37,859 | $44,175 | |
| Net Profit/Sales | -1.67% | -1.23% | -0.80% | -0.37% | 0.06% | 0.48% | 0.91% | 1.33% | 1.75% | 2.16% | 2.57% | 2.98% | |
| Pro Forma Cash Flow | |||||||||||||
| Apr | May | Jun | Jul | Aug | Sep | Oct | Nov | Dec | Jan | Feb | Mar | ||
| Cash Received | |||||||||||||
| Cash from Operations | |||||||||||||
| Cash Sales | $344,713 | $346,963 | $349,185 | $351,448 | $353,728 | $356,020 | $358,328 | $360,655 | $362,991 | $365,340 | $367,714 | $370,100 | |
| Cash from Receivables | $927,000 | $961,471 | $1,034,363 | $1,041,110 | $1,047,781 | $1,054,571 | $1,061,412 | $1,068,291 | $1,075,215 | $1,082,199 | $1,089,209 | $1,096,257 | |
| Subtotal Cash from Operations | $1,271,713 | $1,308,434 | $1,383,548 | $1,392,557 | $1,401,509 | $1,410,591 | $1,419,739 | $1,428,946 | $1,438,207 | $1,447,539 | $1,456,922 | $1,466,357 | |
| Additional Cash Received | |||||||||||||
| Sales Tax, VAT, HST/GST Received | 0.00% | $0 | $0 | $0 | $0 | $0 | $0 | $0 | $0 | $0 | $0 | $0 | $0 |
| New Current Borrowing | $0 | $0 | $0 | $0 | $0 | $0 | $0 | $0 | $0 | $0 | $0 | $0 | |
| New Other Liabilities (interest-free) | $0 | $0 | $0 | $0 | $0 | $0 | $0 | $0 | $0 | $0 | $0 | $0 | |
| New Long-term Liabilities | $0 | $0 | $0 | $0 | $0 | $0 | $0 | $0 | $0 | $0 | $0 | $0 | |
| Sales of Other Current Assets | $0 | $0 | $0 | $0 | $0 | $0 | $0 | $0 | $0 | $0 | $0 | $0 | |
| Sales of Long-term Assets | $0 | $0 | $0 | $0 | $0 | $0 | $0 | $0 | $0 | $0 | $0 | $0 | |
| New Investment Received | $20,000,000 | $0 | $0 | $0 | $0 | $0 | $0 | $0 | $0 | $0 | $0 | $0 | |
| Subtotal Cash Received | $21,271,713 | $1,308,434 | $1,383,548 | $1,392,557 | $1,401,509 | $1,410,591 | $1,419,739 | $1,428,946 | $1,438,207 | $1,447,539 | $1,456,922 | $1,466,357 | |
| Expenditures | Apr | May | Jun | Jul | Aug | Sep | Oct | Nov | Dec | Jan | Feb | Mar | |
| Expenditures from Operations | |||||||||||||
| Cash Spending | $842,600 | $842,600 | $842,600 | $842,600 | $842,600 | $842,600 | $842,600 | $842,600 | $842,600 | $842,600 | $842,600 | $842,600 | |
| Bill Payments | $2,133,570 | $557,192 | $560,232 | $563,238 | $566,297 | $569,380 | $572,482 | $575,603 | $578,752 | $581,913 | $585,091 | $588,304 | |
| Subtotal Spent on Operations | $2,976,170 | $1,399,792 | $1,402,832 | $1,405,838 | $1,408,897 | $1,411,980 | $1,415,082 | $1,418,203 | $1,421,352 | $1,424,513 | $1,427,691 | $1,430,904 | |
| Additional Cash Spent | |||||||||||||
| Sales Tax, VAT, HST/GST Paid Out | $0 | $0 | $0 | $0 | $0 | $0 | $0 | $0 | $0 | $0 | $0 | $0 | |
| Principal Repayment of Current Borrowing | $0 | $0 | $0 | $0 | $0 | $0 | $0 | $0 | $0 | $0 | $0 | $0 | |
| Other Liabilities Principal Repayment | $0 | $0 | $0 | $0 | $0 | $0 | $0 | $0 | $0 | $0 | $0 | $0 | |
| Long-term Liabilities Principal Repayment | $8,333 | $8,333 | $8,333 | $8,333 | $8,333 | $8,333 | $8,333 | $8,333 | $8,333 | $8,333 | $8,333 | $8,337 | |
| Purchase Other Current Assets | $0 | $0 | $0 | $0 | $0 | $0 | $0 | $0 | $0 | $0 | $0 | $0 | |
| Purchase Long-term Assets | $0 | $0 | $0 | $0 | $0 | $0 | $0 | $0 | $0 | $0 | $0 | $0 | |
| Dividends | $0 | $0 | $0 | $0 | $0 | $0 | $0 | $0 | $0 | $0 | $0 | $0 | |
| Subtotal Cash Spent | $2,984,503 | $1,408,125 | $1,411,165 | $1,414,171 | $1,417,230 | $1,420,313 | $1,423,415 | $1,426,536 | $1,429,685 | $1,432,846 | $1,436,024 | $1,439,241 | |
| Net Cash Flow | $18,287,210 | ($99,691) | ($27,617) | ($21,614) | ($15,722) | ($9,723) | ($3,675) | $2,409 | $8,521 | $14,693 | $20,898 | $27,117 | |
| Cash Balance | $1,515,210 | $1,415,519 | $1,387,901 | $1,366,288 | $1,350,566 | $1,340,843 | $1,337,168 | $1,339,577 | $1,348,099 | $1,362,791 | $1,383,689 | $1,410,806 | |
| Pro Forma Balance Sheet | |||||||||||||
| Apr | May | Jun | Jul | Aug | Sep | Oct | Nov | Dec | Jan | Feb | Mar | ||
| Assets | Starting Balances | ||||||||||||
| Current Assets | |||||||||||||
| Cash | ($16,772,000) | $1,515,210 | $1,415,519 | $1,387,901 | $1,366,288 | $1,350,566 | $1,340,843 | $1,337,168 | $1,339,577 | $1,348,099 | $1,362,791 | $1,383,689 | $1,410,806 |
| Accounts Receivable | $1,854,000 | $1,961,138 | $2,040,554 | $2,053,746 | $2,066,979 | $2,080,380 | $2,093,870 | $2,107,441 | $2,121,115 | $2,134,873 | $2,148,695 | $2,162,627 | $2,176,670 |
| Other Current Assets | $1,511,000 | $1,511,000 | $1,511,000 | $1,511,000 | $1,511,000 | $1,511,000 | $1,511,000 | $1,511,000 | $1,511,000 | $1,511,000 | $1,511,000 | $1,511,000 | $1,511,000 |
| Total Current Assets | ($13,407,000) | $4,987,347 | $4,967,072 | $4,952,648 | $4,944,267 | $4,941,946 | $4,945,713 | $4,955,608 | $4,971,692 | $4,993,972 | $5,022,486 | $5,057,317 | $5,098,476 |
| Long-term Assets | |||||||||||||
| Long-term Assets | $8,917,000 | $8,917,000 | $8,917,000 | $8,917,000 | $8,917,000 | $8,917,000 | $8,917,000 | $8,917,000 | $8,917,000 | $8,917,000 | $8,917,000 | $8,917,000 | $8,917,000 |
| Accumulated Depreciation | $1,694,000 | $1,696,200 | $1,698,400 | $1,700,600 | $1,702,800 | $1,705,000 | $1,707,200 | $1,709,400 | $1,711,600 | $1,713,800 | $1,716,000 | $1,718,200 | $1,720,400 |
| Total Long-term Assets | $7,223,000 | $7,220,800 | $7,218,600 | $7,216,400 | $7,214,200 | $7,212,000 | $7,209,800 | $7,207,600 | $7,205,400 | $7,203,200 | $7,201,000 | $7,198,800 | $7,196,600 |
| Total Assets | ($6,184,000) | $12,208,147 | $12,185,672 | $12,169,048 | $12,158,467 | $12,153,946 | $12,155,513 | $12,163,208 | $12,177,092 | $12,197,172 | $12,223,486 | $12,256,117 | $12,295,076 |
| Liabilities and Capital | Apr | May | Jun | Jul | Aug | Sep | Oct | Nov | Dec | Jan | Feb | Mar | |
| Current Liabilities | |||||||||||||
| Accounts Payable | $2,115,000 | $538,521 | $541,461 | $544,365 | $547,322 | $550,301 | $553,298 | $556,315 | $559,359 | $562,413 | $565,485 | $568,590 | $571,711 |
| Current Borrowing | $0 | $0 | $0 | $0 | $0 | $0 | $0 | $0 | $0 | $0 | $0 | $0 | $0 |
| Other Current Liabilities | $0 | $0 | $0 | $0 | $0 | $0 | $0 | $0 | $0 | $0 | $0 | $0 | $0 |
| Subtotal Current Liabilities | $2,115,000 | $538,521 | $541,461 | $544,365 | $547,322 | $550,301 | $553,298 | $556,315 | $559,359 | $562,413 | $565,485 | $568,590 | $571,711 |
| Long-term Liabilities | $1,030,000 | $1,021,667 | $1,013,334 | $1,005,001 | $996,668 | $988,335 | $980,002 | $971,669 | $963,336 | $955,003 | $946,670 | $938,337 | $930,000 |
| Total Liabilities | $3,145,000 | $1,560,188 | $1,554,795 | $1,549,366 | $1,543,990 | $1,538,636 | $1,533,300 | $1,527,984 | $1,522,695 | $1,517,416 | $1,512,155 | $1,506,927 | $1,501,711 |
| Paid-in Capital | $1,667,000 | $21,667,000 | $21,667,000 | $21,667,000 | $21,667,000 | $21,667,000 | $21,667,000 | $21,667,000 | $21,667,000 | $21,667,000 | $21,667,000 | $21,667,000 | $21,667,000 |
| Retained Earnings | ($10,996,000) | ($10,996,000) | ($10,996,000) | ($10,996,000) | ($10,996,000) | ($10,996,000) | ($10,996,000) | ($10,996,000) | ($10,996,000) | ($10,996,000) | ($10,996,000) | ($10,996,000) | ($10,996,000) |
| Earnings | $0 | ($23,041) | ($40,122) | ($51,318) | ($56,523) | ($55,690) | ($48,787) | ($35,776) | ($16,603) | $8,755 | $40,331 | $78,190 | $122,365 |
| Total Capital | ($9,329,000) | $10,647,959 | $10,630,878 | $10,619,682 | $10,614,477 | $10,615,310 | $10,622,213 | $10,635,224 | $10,654,397 | $10,679,755 | $10,711,331 | $10,749,190 | $10,793,365 |
| Total Liabilities and Capital | ($6,184,000) | $12,208,147 | $12,185,672 | $12,169,048 | $12,158,467 | $12,153,946 | $12,155,513 | $12,163,208 | $12,177,092 | $12,197,172 | $12,223,486 | $12,256,117 | $12,295,076 |
| Net Worth | ($9,329,000) | $10,647,959 | $10,630,878 | $10,619,682 | $10,614,477 | $10,615,310 | $10,622,213 | $10,635,224 | $10,654,397 | $10,679,755 | $10,711,331 | $10,749,190 | $10,793,365 |
| Sales Forecast | |||||||||||||
| Apr | May | Jun | Jul | Aug | Sep | Oct | Nov | Dec | Jan | Feb | Mar | ||
| Sales | |||||||||||||
| CCB (CARIBOU & MEDUSA combined) | 0% | $1,078,940 | $1,086,105 | $1,093,350 | $1,100,645 | $1,107,995 | $1,115,385 | $1,122,830 | $1,130,325 | $1,137,870 | $1,145,465 | $1,153,110 | $1,160,805 |
| Pre-Paid IN | 0% | $299,910 | $301,745 | $303,390 | $305,145 | $306,915 | $308,695 | $310,480 | $312,295 | $314,095 | $315,895 | $317,745 | $319,595 |
| Total Sales | $1,378,850 | $1,387,850 | $1,396,740 | $1,405,790 | $1,414,910 | $1,424,080 | $1,433,310 | $1,442,620 | $1,451,965 | $1,461,360 | $1,470,855 | $1,480,400 | |
| Direct Cost of Sales | Apr | May | Jun | Jul | Aug | Sep | Oct | Nov | Dec | Jan | Feb | Mar | |
| CCB (CARIBOU & MEDUSA combined) | $134,868 | $135,763 | $136,669 | $137,581 | $138,499 | $139,423 | $140,354 | $141,291 | $142,234 | $143,183 | $144,139 | $145,101 | |
| Pre-Paid IN | $37,489 | $37,718 | $37,924 | $38,143 | $38,364 | $38,587 | $38,810 | $39,037 | $39,262 | $39,487 | $39,718 | $39,949 | |
| Subtotal Direct Cost of Sales | $172,357 | $173,481 | $174,593 | $175,724 | $176,863 | $178,010 | $179,164 | $180,328 | $181,496 | $182,670 | $183,857 | $185,050 | |

