
Telespace, Inc.
Executive Summary
The telecommunications revolution has arrived: Personal communications and unified messaging systems are at the vanguard of this technological phenomenon. Dating from the 1984 deregulation of local and long distance telephone service, competition has accelerated and sought out every nook and cranny of telecom products and services for both consumers and businesses. From that day only 15 years ago, when consumers were tied to a fixed phone with its fixed phone number, mobile and cellular phones have proliferated to meet the demand for communication anytime, anywhere in the world. Companies that have not foreseen change–or kept up–are quickly consigned to the technological and financial graveyard, Iridium being just the latest example. Financial muscle has been displaced by quality and depth of management and speed of execution as the final arbiter in the marketplace. AT&T finally realized this and brought in a technology-savvy CEO who could pull the trigger on needed change; Iridium did not and paid the price.
TeleSpace is well positioned to become the market leader in personal communications and unified messaging. Now that business and the consumer have telecommunications mobility with numerous phone and fax numbers, pagers, and email, they are demanding simplicity and speed: One identifier for their complex business and personal lives that will find them anytime, anywhere, and deliver their communications. They want and need MyLine.
MyLine has been an operating system for over five years and has a loyal, though small, core of customers. The technology is clean, elegant and maintainable. The system has a complex array of features, some critical, most not. MyLine has had limited success because it was engineered and marketed like the pocket knife of the early TV ads: Rather than the sleek cutting tool the consumer wanted, the early knife had a corkscrew, screwdrivers, awl, key chain, etc. It weighed twice as much as it had to, and came with instructions, instructions for a pocket knife! Consumers knew they were in trouble before they even used the product.
Internal market research has shown what the consumer wants, and MyLine has it! There are five primary target markets, three of which will be discussed below, starting with the businessman and consumer who just wants to get phone calls no matter where: In the office, in a car, in a plane, playing golf, wherever. If the customer is on earth, MyLine will find him/her. Then there’s the Soccer/Sports Mom, totally mobile and often just as totally unreachable-except with our toll-free, 800 MyLine. And the military market, for both professional and personal use, is inviting. They demand mobile, reliable, and confidential communications–MyLine is ready and able to enlist.
The overall telecommunications market is huge, well over $200 billion. The personal communications and unified messaging sub-industry, with its hundreds of millions of actual/potential users, is difficult to quantify at this stage. Management estimates that projected sales of about $40 million in the third year, with sales running at the rate of $5 million per month by the end of that year, would still be only approximately a one percent market share. To become the market leader, a five to ten percent market share would probably be needed. Management plans to achieve this within five years.
1.1 Objectives
TeleSpace’s primary corporate objectives are:
- To become the market leader in personal communications and unified messaging products and services within five years.
- To become the lowest cost provider and drive an aggressive pricing model through the industry.
- To have the best and most responsive customer service by year-end Year 1.
1.2 Mission
MyLine is already the most technologically-superior personal communications system in the world. TeleSpace management will build on MyLine’s brand and technical reputation to become the market leader in personal and business communications, and unified messaging systems within five years.
1.3 Keys to Success
There are three keys to success for TeleSpace:
- Marketing must generate sufficient sales volume to drive an aggressive pricing model while still achieving planned profitability projections.
- Strategic partners must be found to private label MyLine and promote it through their distribution channels.
- Equity capital must be secured at a reasonable valuation.
Company Summary
TeleSpace, Inc. develops and markets programmable personal communications and unified messaging services for individuals and businesses. The company was incorporated in early Year 1, and operates as a wholly-owned subsidiary of AmericomUSA, Inc., a public reporting company. In response to overtures from AmericomUSA senior management, TeleSpace management has proposed a leveraged buyout of the company from Americom and has incorporated this proposal in a Letter of Intent (LOI) sent to Americom. A copy of this LOI is included in the plan appendix. Briefly, the proposal calls for TeleSpace management to purchase 81% of TeleSpace common stock from Americom, with an option to acquire an additional 10% within two years. Americom will deliver all rights and ownership of the MyLine technology and customer base and cease active association with the company. They will not be represented on the Board of Directors. Management expects this negotiation to be completed by the end of October, Year 1, when management will actively pursue equity capital to finalize the acquisition and fund corporate operations.
*Attachments are not included in this sample plan.
2.1 Company Ownership
TeleSpace, Inc. is a wholly-owned subsidiary of AmericomUSA, Inc., a public reporting company. Mr. Robert Cezar, Chief Executive Officer of AmericomUSA, Inc., owns approximately 58% of the common stock of AmericomUSA.
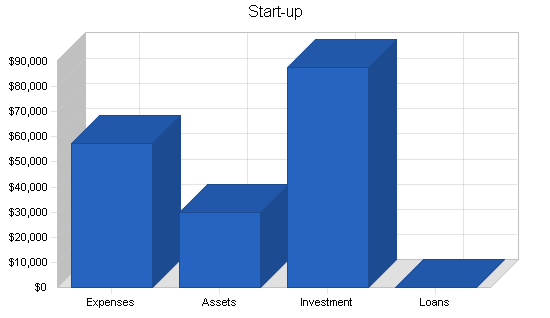
2.2 Start-up Summary
Start-up costs, shown below (exclusive of salaries), are comprised mostly of legal fees, marketing collateral, advertising, and consulting fees. Start-up costs are being financed by the parent company, AmericomUSA.
| Start-up Funding | |
| Start-up Expenses to Fund | $57,500 |
| Start-up Assets to Fund | $30,000 |
| Total Funding Required | $87,500 |
| Assets | |
| Non-cash Assets from Start-up | $30,000 |
| Cash Requirements from Start-up | $0 |
| Additional Cash Raised | $0 |
| Cash Balance on Starting Date | $0 |
| Total Assets | $30,000 |
| Liabilities and Capital | |
| Liabilities | |
| Current Borrowing | $0 |
| Long-term Liabilities | $0 |
| Accounts Payable (Outstanding Bills) | $0 |
| Other Current Liabilities (interest-free) | $0 |
| Total Liabilities | $0 |
| Capital | |
| Planned Investment | |
| Americom USA | $87,500 |
| Other | $0 |
| Additional Investment Requirement | $0 |
| Total Planned Investment | $87,500 |
| Loss at Start-up (Start-up Expenses) | ($57,500) |
| Total Capital | $30,000 |
| Total Capital and Liabilities | $30,000 |
| Total Funding | $87,500 |
| Start-up | |
| Requirements | |
| Start-up Expenses | |
| Legal | $5,000 |
| Stationery etc. | $2,500 |
| Brochures | $5,000 |
| Consultants | $10,000 |
| Advertising | $20,000 |
| Expensed equipment | $5,000 |
| Other | $10,000 |
| Total Start-up Expenses | $57,500 |
| Start-up Assets | |
| Cash Required | $0 |
| Start-up Inventory | $20,000 |
| Other Current Assets | $10,000 |
| Long-term Assets | $0 |
| Total Assets | $30,000 |
| Total Requirements | $87,500 |
2.3 Company Locations and Facilities
TeleSpace corporate offices are located in Arroyo Grande, CA. Existing space of 900 square feet is adequate for existing staff, but new facilities have to be leased when sales representatives are hired.
Products and Services
TeleSpace, Inc. develops and markets programmable personal communications and unified messaging services for individuals and businesses. The MyLine system can best be described as a personal communications platform, a remotely programmable “telocation” service which allows the user to access MyLine services from any telephone device or personal computer anywhere in the world.
3.1 Product and Service Description
The MyLine system can best be described as a personal communications platform, a remotely programmable “telocation” service which allows the user to access MyLine services from any telephone device or personal computer anywhere in the world. MyLine is a virtual telephone number which allows the user to control inbound telephone, fax, and data calls and receive them anywhere, but only on demand. MyLine is the only telephone number users will ever need. They receive every telephone call, fax, or email sent to their MyLine number in real time or stored for later use. Or they can screen and elect not to receive any particular communication, delete or divert for later handling. MyLine includes a proprietary security system to prevent unauthorized access and has real-time billing and accounting capabilities. The latter can generate, using a telephone or personal computer, comprehensive billing records by project and/or general ledger account.

3.2 Sales Literature
Initial radio and Internet ads and sales collateral will be developed by the company’s marketing, advertising, and public relations agency in Silicon Valley. This is a well-known firm specializing in high-tech clients.
3.3 Competitive Comparison
In 1992, AT&T launched their Easy Reach service which, although simplistic in design and use, signified the need for a universal telocation virtual number and thus found immediate acceptance. MCI reacted by introducing its Personal 800 Follow Me Service. These services today require users to subscribe to their networks, lack a broad range of integrated services, and offer limited remote control capability.
There is one striking difference between MyLine and competing technologies: The competition has not integrated all means of communication. Some offer voice mail and follow me technology, others offer this, and other features, on a piece meal basis, not totally integrated. MyLine is the only totally integrated voice, fax, data, and email system on the market.
3.4 Fulfillment
The company now maintains its servers locally for supporting MyLine. As volume grows, management plans to co-locate at Above.Net’s facilities in San Jose, CA. A strategic marketing partner will also be sought, especially for the toll-free, 800 number.
3.5 Technology
The MyLine hardware platform is a state-of-the-art digital industry standard, and its design provides unique redundancy and flexibility. The MyLine system places the user on an electronic highway of digital call processing, operating on a Novell Local Area Network (LAN), integrating computer and telephone information into computer telephony technology. The LAN is connected to the Public Switch Network with the capability of using the ISDN/DSL features provided by the long distance carriers.
MyLine users have a personal communications exchange as a zero-blocking private global network providing voice, fax, and data transfer between themselves and any other MyLine or non-MyLine user. MyLine overlays and utilizes the Public Switched Telephone Network (PSTN) or the Public Switched Data Network, providing access to anyone with a MyLine number. The network routes all incoming and outgoing requests and data to a central hub for distribution to external routers, the Internet if needed, or delivers the request directly to local destinations.
The MyLine switching center provides the telephonic connection to the PSTN, which the network utilizes as its gateway. The MyLine system utilizes a Novell Netware Global Messaging Service which operates on Novell Netware file servers, providing a standardized platform and format for global message distribution to other Novell Netware servers, compatible applications and Internet addresses. Thus, access to the MyLine system is virtually unlimited. All communications within the network are encrypted, either with public/private key algorithms or with the proprietary MyLine rotational encryption algorithms.
3.6 Future Products and Services
MyLine features can be summarized in the following categories. A comprehensive feature set is available upon request by potential investors.
- Call forwarding.
- Selective call screening.
- Automatic callback.
- Wake-up services.
- Conference calling.
- Call waiting.
- Call wonferencing (integrating call waiting and conferencing).
- Voice messaging.
- Paging.
- Real time billing/accounting.
- Information on demand.
- Number referral.
- Fax store and forward.
- Email.
Market Analysis Summary
Dun and Bradstreet estimates that 1999 sales of the U.S. telecommunications market will be over $150 billion, of which the personal communications and unified messaging market is three percent, or $4 billion. If the company can achieve a one percent market share within three years, its sales would be $40 million in a market growing eight percent per year. These estimates are conservative, given the accelerating growth rate of telecommunications and unified messaging in particular. There is ample space for the company, and many competitors, in this huge and fast-growing marketplace.
4.1 Market Segmentation
TeleSpace has targeted five primary market segments:
- General consumer and business market.
- Sports Mom toll-free.
- Domestic Traveler/Calling Card.
- International Traveler.
- Military.

| Market Analysis | |||||||
| Year 1 | Year 2 | Year 3 | Year 4 | Year 5 | |||
| Potential Customers | Growth | CAGR | |||||
| MyLine General | 6% | 150 | 159 | 169 | 179 | 190 | 6.09% |
| Sports Mom/Toll Free | 9% | 12 | 13 | 14 | 15 | 16 | 7.46% |
| Domestic Traveler/Calling Card | 12% | 60 | 67 | 75 | 84 | 94 | 11.88% |
| International Traveler | 2% | 1 | 1 | 1 | 1 | 1 | 0.00% |
| Military | 0% | 1 | 1 | 1 | 1 | 1 | -8.07% |
| Total | 7.71% | 224 | 241 | 260 | 280 | 302 | 7.71% |
4.2 Target Market Segment Strategy
The company will market its products to customer segments that require the basic mobile telecommunication services (such as voice messaging, fax, and email) in a single solution. Other features will be specific to each customer segment. The company will spend substantial marketing efforts in determining which set of features are the most attractive to each customer segment. Offering customized quality product to each customer segment at a competitive price level will be one of the marketing goals of TeleSpace.
4.2.1 Market Needs
All customer segments that we target seek reliable communications that are easy to use. However, feature preferences vary in between the segments. ‘Soccer moms’ that spend so much time driving their kids around are in need of an ‘always on’ accessibility. A permanent 800 number is what they covet. Business travelers, on the other hand, have a strong need for a universal communications portal that will take care of all their communication needs. In this respect, TeleSpace will specifically tailor its market offering to each customer segment.
4.3 Service Business Analysis
TeleSpace is part of the telecommunications industry, including the following sub-industries:
- National and international carriers (AT&T) which dominate the long distance market and offer unified messaging system (UMS) to their customers.
- Regional operating companies (Pacific Bell, GTE) which provide local service and switch long distance traffic to the carriers and CLECs. They also offer UMS to their customers.
- Competitive local exchange carriers (CLECs) provide both local and long distance service and market UMS to their customers.
- Resellers aggregate traffic and provide discount long distance service and UMS to their customers.
- Unified messaging and personal communications service providers with in-house switching capability, such as TeleSpace, that offer MyLine and similar services to all consumers and businesses.
4.3.1 Business Participants
The personal telecommunications and unified messaging system sub-industry of the overall telecommunications market is a new, technology-driven, and immature industry characterized by a high growth rate, low barriers to entry, several large, and many small, competitors. The industry evolved during the last ten years as a spin-off the the telecommunications de-regulation, and subsequent explosion in competition and technological innovation. Overall industry sales should continue to accelerate for at least the next three years as consumers learn they can have their own unique local and 800 phone numbers for anyone to find them anytime, anywhere. Several industry leaders have emerged including:
- AT&T: The overall industry leader is expanding both vertically and horizontally into new markets and technologies and will probably have an impressive UMS.
- Excel Communications, Inc. is a wholly-owned subsidiary of Teleglobe, Inc., a large public telecommunications company. Excel is aggressively marketing its UMS.
- Linx Communications, Inc.is a leading national communications service provider which recently received venture capital financing. See Competitors, Section 4.3.3.
- Nextel Communications, Inc. is a large public company providing digital and analog wireless communications services throughout the U. S. See Competitors, Section 4.3.3.
- Sprint PCS offers a wide variety of UMS services marketed primarily to its long distance customers.
- Voice Mobility, Inc. is a public company offering UMS for CLECs, wireless and other communication providers. They offer a MyLine clone to providers who re-market to their consumers.
There are numerous small competitors, the primary of which are described in the competitor section.
4.3.2 Competition and Buying Patterns
The primary buying factors in personal telecommunication systems are price, accessibility, and ease of use. There is significant brand loyalty based on the company’s experience with its current customer base. Once an individual has acclimated to the MyLine system and memorized the access routine, he tends to be reluctant to switch to another service. Very much the same attitude prevails in consumer long distance, where demonstrable savings fail to sway a large segment of the population to switch carriers. AT&T still has over 60% of the market even though they are the highest cost carrier in a commodity business. Powerful branding and advertising, even with premium pricing, will create a significant barrier to competitors taking our customers. Being the market leader, like AT&T, will strengthen the company’s branding position and also make it more difficult for the competition.
Management feels the primary competition will be other well-branded companies like Nextel and Linx Communications, which have deep advertising pockets, feature-rich and competitive services, and an established brand. All the major telecommunications companies, including the Baby Bells, are moving into UMS because they have the infrastructure to support it and the brand to promote it. They will have the initial advantage in branding and marketing muscle, but their services to date are inferior. The marketplace is big enough to support all this competition and then some.
4.3.3 Main Competitors
Our main competitors include both telecommunications and unified messaging companies, most of whom have deep financial pockets, and all of whom appear to be competent at packaging and marketing their products. They are shown below with brief descriptions of the company and product(s):
- Webley Systems offers a UMS called the personal assistant, which Small Business Computing and Communications Magazine has rated the most sophisticated product they have rated. The personal assistant provides subscribers with a phone number where you can leave faxes and voice messages. Messages may be accessed either through a password-protected website or by phone, where you can listen to voice mail or have email or fax headers read. It also supports fax forwarding and broadcasting and offers an effective voice recognition engine to navigate through menu choices. The assistant will notify you by pager when new messages arrive and can also screen and selectively forward calls to any phone number you designate. You can also load your contact list into the assistant and have it place calls for you while on the road, including conference calls. However, the assistant only supports one email account at a time.
- StarTouch International, Ltd. entered the UMS arena in July, 1996 with its Electronic Secretarial Administrator (ESA). ESA offers a switch-based service including call answering, forwarding, voice mail, fax, broadcasting, and conference calling. The company claims to be debt-free and to own their own switch. Overall, ESA is impressive and competitive, though sign-up is difficult and rates confusing.
- Nextel Communications, Inc. is a large public company offering a digital, nationwide service competing with other cellular service providers such as GTE, Cellular One and AT&T. Nextel operates on radio taxi frequencies, and their system is based on radio “walkie talkie” style communications for short-range communications. The service is thus tied to the range of their wireless transmission system. Within that range they do offer many features including caller ID, paging, voice mail, call waiting and forwarding, and conference calling. Nextel offers a national system within their transmission range with unlimited long distance. For example, a national account with 1,000 minutes costs $135/month with an additional $.10 per minute for call forwarding.
- Linx Communications, Inc. offers a Web-based unified communications platform called LinxWeb, a personal Web portal that manages personal daily communications including phone calls from any landline or mobile phone, messages, pages, and faxes. LinxWeb is very similar to MyLine. Linx has teamed with Focal Communications to co-locate their switches in Focal facilities across the U.S.
- JFAX.COM unified messaging provides a single phone number in one of 60 cities world-wide allowing faxes, emails, and phone calls to be managed via your email account. The system is accessible via phone but best accessed through computer.
Strategy and Implementation Summary
MyLine has an impressive array of features that will quickly overwhelm the typical prospect, unless the sales presentation is focused on the key features that especially appeal to the particular target market. The feature set is so rich, in fact, that many potential customers have admitted they decided MyLine is too much for their needs, that the system is overqualified. Management has decided to focus on a few features that have the broadest appeal and aggressively market these features to our five target markets.
Management will emphasize speed in penetrating selected markets and implementing advertising and public relations campaigns. Financial results will be compiled and reported weekly so that gross and net margins can be reviewed and benchmarked against the competition. Marketing will be continually monitored and adjusted as needed to maximize market penetration and profitability. Cost control and brand management will be critical to the overall strategy.
5.1 Competitive Edge
One of TeleSpace’s major competitive advantages is its technological lead over the major competitors. None of the incumbent companies has managed to seamlessly integrate the voice, fax, and data communications needed by the target market. At the same time, the company boasts a superior management team with decades of experience in the telecommunications industry. These people have a track record of capitalizing on the technology market and have all the means to make TeleSpace another success.
5.2 Marketing Strategy
The strategy used in the past by GST for MyLine was an evident failure because MyLine was presented as being all things to all people but nothing critical to anyone. Almost no one will use even 90% of the system’s capabilities, so why try to market MyLine that way? The potential market is so huge, segmenting markets AND the Myline feature set would seem a viable marriage and be the foundation for a viable business model. So, for example, marketing the unique 800 number service to several tightly focused market segments such as “soccer moms” and the general military population seems feasible. The former market has a critical need for the 800 service and can be migrated to the long distance services; the latter is a prime mobile market that can be sold MyLine as a unique add-on to their basic service.
MyLine or its predecessors has been available for over a decade. These systems have had limited success in the marketplace but overall have not lived up to their potential and achieved the market penetration they should have. The primary target market has been the so-called “road warrior” as this market is large, well-defined, relatively affluent, and well-educated, the very definition of an early adopter market. MyLine, though, is difficult to understand if the prospect is shown most or all of the features and capabilities at once. To the new and/or unsophisticated user, MyLine is simply overwhelming in its complexity and capability. Any successful marketing strategy must focus on the core features of the system and treat other features as “icing on the cake:” Nice if you can use them but not a reason to buy.
The key to selling MyLine is the ability to identify a singular market and its unique needs, develop channels to these markets, so configure the MyLine system, and market that particular feature set to that market. This strategy has the distinct advantage, critical with a potentially complex product, of a focused and simple sales message.
5.2.1 Promotion Strategy
A company has been retained to coordinate the marketing, advertising and promotion strategy, which will rely heavily on radio and print advertising for MyLine and trade shows for CLEC, carrier, and business prospects. This firm has already begun organizing focus groups to determine the best feature set and pricing for the present MyLine service.
5.2.2 Pricing Strategy
TeleSpace will have the lowest cost structure in the industry, but premium pricing based on its uniquely rich feature set and quality service. The company will be the pricing leader, manage both the TeleSpace and MyLine brands for this identification and do whatever it takes to maintain this leadership. As a well-known telecom CEO once said, being the lowest-cost provider covers a lot of sins. MyLine services will be priced to match significant competitors, such as Pacific Bell or Excel Communications.
5.3 Sales Strategy
Sales strategies will vary depending on the target market and the result of focus group marketing research currently underway, managed by our marketing relations firm in Silicon Valley. Trone Miller and Matt van Steenwyk will present to close carriers, CLECs, and corporate prospects identified from personal contacts and trade show leads. The marketing firm is also developing the sales strategy for the consumer markets, which will rely heavily on radio and print advertising.
5.3.1 Sales Forecast
The sales forecast for the first three years, beginning with the July first fiscal year, is shown in the following table. Even if this forecast is achieved, the company will still have less than one percent of market share. There is substantial room for high sales growth and industry competition.


| Sales Forecast | |||
| Year 1 | Year 2 | Year 3 | |
| Sales | |||
| MyLine General | $183,000 | $420,000 | $635,000 |
| Sports Mom Toll Free | $210,000 | $10,100,000 | $30,300,000 |
| Domestic Travelers/Calling Cards | $42,550 | $1,300,000 | $5,600,000 |
| International Travelers | $84,000 | $1,400,000 | $1,500,000 |
| Military | $317,800 | $2,100,000 | $4,200,000 |
| Total Sales | $837,350 | $15,320,000 | $42,235,000 |
| Direct Cost of Sales | Year 1 | Year 2 | Year 3 |
| MyLine General | $0 | $0 | $0 |
| Sports Mom Toll Free | $0 | $0 | $0 |
| Domestic Travelers/Calling Cards | $0 | $0 | $0 |
| International Travelers | $0 | $0 | $0 |
| Military | $0 | $0 | $0 |
| Subtotal Direct Cost of Sales | $0 | $0 | $0 |
5.3.2 Sales Programs
TeleSpace will utilize five primary sales programs:
- Direct Sales: This will be done by the CEO, Director of Marketing and Sales Channel Managers, all of whom have extensive contacts in the industry and have already been invited by several key prospects to present MyLine and other company services.
- Radio advertising: This will be the main entree to the consumer market, which the company will approach on a target market basis. Personal endorsements by celebrities will be emphasized.
- Print advertising: This will be used primarily for MyLine and placed in magazines and newspapers targeted to amateur sports and military officers and enlisted personnel, probably with endorsements by our contracted endorsers.
- Trade shows: Will be used to promote MyLine, mostly to businesses, CLECs, and small carriers.
- Web advertising: The company is now developing ads to be run on customer websites of its sister company, AdCast, Inc., which markets advertising delivery systems for the Internet.
5.4 Milestones
The following table lists important corporate milestones, with completion dates, budgets and responsible executive for each. This milestone schedule indicates our emphasis on planning for implementation.
| Milestones | |||||
| Milestone | Start Date | End Date | Budget | Manager | Department |
| Retain IBW Company | 11/1/1999 | 11/1/1999 | $10,000 | Matt | Sales |
| Set up focus group program | 12/1/1999 | 12/1/1999 | $10,000 | Matt | Marketing |
| Secure equity funding | 12/31/1999 | 12/31/1999 | $50,000 | Phil | Finance |
| Hire initial employees | 1/1/2000 | 1/1/2000 | $1,000 | Betty | Admin |
| Complete trade secrets/patent review | 1/1/2000 | 1/1/2000 | $5,000 | Trone | Corporate |
| Implement advertising program | 11/15/1999 | 11/15/1999 | $20,000 | Matt | Marketing |
| Retain Rob Dunaway | 9/1/1999 | 9/1/1999 | $5,000 | Phil | Corporate |
| Retain Alliance Ventures Group | 11/15/1999 | 11/15/1999 | $0 | Phil | Corporate |
| Secure/equip MyLine network | 9/15/1999 | 9/15/1999 | $1,000 | Russ | Operations |
| Finalize buyout agreement | 10/31/1999 | 10/31/1999 | $0 | Trone | Corporate |
| Close strategic investor | 12/15/1999 | 12/15/1999 | $0 | Phil | Corporate |
| Complete MyLine 2000 | 7/1/2000 | 7/1/2000 | $0 | Russ | Corporate |
| Other | 1/1/2000 | 1/1/2000 | $0 | ABC | Department |
| Totals | $102,000 | ||||
Management Summary
TeleSpace’s management philosophy is to outsource all possible non-critical corporate functions and to focus on building a telecommunications marketing and sales internal team, accelerating MyLine sales penetration into our target markets, and completing the MyLine 2000 upgrade.
The company now has four executives and will be hiring a Sales Channel Manager in January, 2000.
6.1 Organizational Structure
TeleSpace is organized into three primary functional disciplines: Marketing and sales, operations and product development and finance and administration. Each is managed by a senior executive who reports to the Chief Executive Officer.
TeleSpace, Inc. is now a wholly-owned subsidiary of AmericomUSA, Inc., a public reporting company. When the management buyout is complete, Telespace’s current board of directors will be replaced by Trone Miller, Chairman and Chief Executive Officer, Phil ErkenBrack, the Chief Financial Officer, and an investor representative.
6.2 Management Team
Mr. Trone Miller is the founding Chairman and CEO of TeleSpace. **Personal information has been removed for confidentiality.
Mr. Phillip ErkenBrack, Jr. is the Chief Financial Officer, Director and a co-founder. **Personal information has been removed for confidentiality.
Mr. Russell Rish is the Vice President of Operations. **Personal information has been removed for confidentiality.
Mr. Matthew van Steenwyk is the Vice President of Marketing and Business Development. **Personal information has been removed for confidentiality.
6.3 Management Team Gaps
The company will be hiring a Sales Channel Manager in the near term. This will complete the management team for the first year.
6.4 Personnel Plan
There are four executives now and a Sales Channel Manager will be hired shortly. Two sales representatives will be hired shortly after the advertising program starts, completing the hiring for the first year.
| Personnel Plan | |||
| Year 1 | Year 2 | Year 3 | |
| Production Personnel | |||
| VP of Operations-Russ Fish | $78,400 | $100,000 | $130,000 |
| Sr. Systems Engineer-Dana Gilliam | $54,400 | $65,000 | $75,000 |
| Systems Engineer-David Gabler | $45,600 | $55,000 | $60,000 |
| Subtotal | $178,400 | $220,000 | $265,000 |
| Sales and Marketing Personnel | |||
| VP of Mkg.& Bus.Dev’t-M.van Steenwyk | $78,000 | $100,000 | $130,000 |
| Sales Channel Managers | $40,000 | $120,000 | $150,000 |
| Resource Analyst-Amber Higgins | $36,975 | $45,000 | $50,000 |
| Account Manager-Brenda Thomasi | $36,375 | $45,000 | $50,000 |
| Sales Representatives | $12,500 | $230,000 | $550,000 |
| Subtotal | $203,850 | $540,000 | $930,000 |
| General and Administrative Personnel | |||
| CEO-Trone Miller | $112,998 | $150,000 | $180,000 |
| CFO-Phil ErkenBrack | $103,002 | $130,000 | $150,000 |
| Controller | $0 | $60,000 | $70,000 |
| Billing Supervisor-Hector Padilla | $43,500 | $50,000 | $55,000 |
| Accountants | $26,000 | $150,000 | $300,000 |
| Administration Manager-Betty Benedix | $37,000 | $45,000 | $50,000 |
| Asst. Manager | $9,000 | $30,000 | $35,000 |
| Receptionist | $4,500 | $25,000 | $30,000 |
| Human Resources Clerk | $0 | $30,000 | $35,000 |
| Subtotal | $336,000 | $670,000 | $905,000 |
| Other Personnel | |||
| Name or title | $0 | $0 | $0 |
| Other | $0 | $0 | $0 |
| Subtotal | $0 | $0 | $0 |
| Total People | 17 | 26 | 36 |
| Total Payroll | $718,250 | $1,430,000 | $2,100,000 |
Financial Plan
TeleSpace, Inc. seeks a seed round of equity capital to initiate corporate operations, secure office and engineering space, hire the executive staff and initial employees, and initiate billing and customer service for the core MyLine customers. The company seeks start-up equity financing to accelerate market penetration through a multi-media national advertising campaign, hire additional sales, marketing, customer service and engineering personnel, and upgrade the operational hardware and software capability of the existing MyLine system. There is also a need to invest over the next year in hardware infrastructure. This capital investment will be sufficient to take the company to profitability and ongoing positive cash flow until the acquisition of the company, or initial public offering of common stock.
The company is offering 20% of its fully-diluted common stock, on a post-funding basis, for this investment, which can be Series A convertible preferred stock or any reasonable form the investor prefers. The company has also reserved one seat on its Board of Directors for the investor(s) or his representative.
The financial exit strategy would preferably be through acquisition by a public competitor or potential competitor. The company plans to be generating sales at a “high run rate” within three years, with comenserate gross margins and net margins. We should be an attractive stock acquisition for a large company contemplating the time and cost of competing against an established brand and experienced and successful management team. Management will naturally assess the viability of the public stock markets with its investment banker and will take the company public through an initial offering of its common stock if that vehicle offers superior returns to our investors at that time.
The following financial plan details the staffing plan and pro forma income statement, cash flow, balance sheet and other financial analysis over the next three years. Management assumes that its present owner, AmericomUSA, Inc., will pay all costs and expenses through 1999. The sale of the company is assumed to be effective January 1, 2000. Profitability should be achieved by June, 2000 and positive cash flow by September, 2000.
7.1 Important Assumptions
The financial plan depends on important assumptions, most of which are shown below. The key underlying assumptions are:
- A stable U.S. and world economy, with no worse than an average cyclical recession in the next year.
- As unified messaging technology continues to evolve, no new proprietary technology obsolesces the MyLine technology.
- The federal government does not significantly alter the regulatory climate and continues to allow the evolution of telecommunications into a more competitive industry.
| General Assumptions | |||
| Year 1 | Year 2 | Year 3 | |
| Plan Month | 1 | 2 | 3 |
| Current Interest Rate | 10.00% | 10.00% | 10.00% |
| Long-term Interest Rate | 9.00% | 9.00% | 9.00% |
| Tax Rate | 25.42% | 25.00% | 25.42% |
| Other | 0 | 0 | 0 |
7.2 Key Financial Indicators
The key financial performance measures for TeleSpace are:
- Sales growth: The company must demonstrate steady and accelerating growth to establish market presence in this huge marketplace.
- Gross margins must remain high to provide the internal growth capital needed.
- Productivity as measured by sales per employee must be at least $130,000 by the end of the first year and should approach $1 million by the end of year three.

7.3 Break-even Analysis
The break-even analysis shows that the company has a good balance of steadily increasing operating costs and sales, and where the break-even point will be reached in monthly sales.

| Break-even Analysis | |
| Monthly Revenue Break-even | $96,546 |
| Assumptions: | |
| Average Percent Variable Cost | 0% |
| Estimated Monthly Fixed Cost | $96,546 |
7.4 Projected Profit and Loss
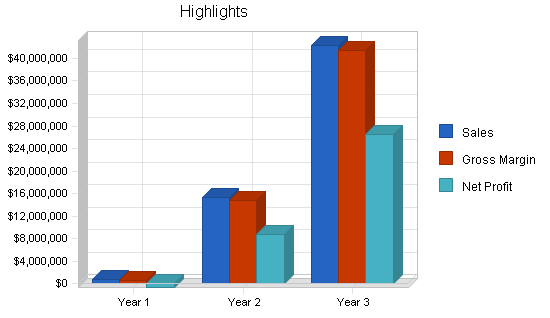
Profitability will be reached in June, 2000 resulting in a loss for the first year. Consistent high gross profit margins and net margins will be achieved within one year.


| Pro Forma Profit and Loss | |||
| Year 1 | Year 2 | Year 3 | |
| Sales | $837,350 | $15,320,000 | $42,235,000 |
| Direct Cost of Sales | $0 | $0 | $0 |
| Production Payroll | $178,400 | $220,000 | $265,000 |
| Network expense | $120,000 | $250,000 | $500,000 |
| Total Cost of Sales | $298,400 | $470,000 | $765,000 |
| Gross Margin | $538,950 | $14,850,000 | $41,470,000 |
| Gross Margin % | 64.36% | 96.93% | 98.19% |
| Operating Expenses | |||
| Sales and Marketing Expenses | |||
| Sales and Marketing Payroll | $203,850 | $540,000 | $930,000 |
| Advertising/Promotion | $270,000 | $1,000,000 | $2,000,000 |
| Trade Shows | $10,000 | $30,000 | $60,000 |
| Travel | $36,000 | $100,000 | $200,000 |
| Marketing Collateral & Supplies | $21,000 | $75,000 | $150,000 |
| Publications | $6,500 | $20,000 | $40,000 |
| Demos and Samples | $10,000 | $50,000 | $100,000 |
| Total Sales and Marketing Expenses | $557,350 | $1,815,000 | $3,480,000 |
| Sales and Marketing % | 66.56% | 11.85% | 8.24% |
| General and Administrative Expenses | |||
| General and Administrative Payroll | $336,000 | $670,000 | $905,000 |
| Sales and Marketing and Other Expenses | $0 | $0 | $0 |
| Depreciation | $36,000 | $290,000 | $790,000 |
| Leased Equipment | $17,000 | $35,000 | $75,000 |
| Utilities | $9,000 | $20,000 | $40,000 |
| Insurance | $12,000 | $25,000 | $50,000 |
| Rent | $26,000 | $50,000 | $100,000 |
| Other | $0 | $0 | $0 |
| Payroll Taxes | $165,198 | $328,900 | $483,000 |
| Other General and Administrative Expenses | $0 | $0 | $0 |
| Total General and Administrative Expenses | $601,198 | $1,418,900 | $2,443,000 |
| General and Administrative % | 71.80% | 9.26% | 5.78% |
| Other Expenses: | |||
| Other Payroll | $0 | $0 | $0 |
| Consultants | $0 | $0 | $0 |
| Contract/Consultants | $0 | $0 | $0 |
| Total Other Expenses | $0 | $0 | $0 |
| Other % | 0.00% | 0.00% | 0.00% |
| Total Operating Expenses | $1,158,548 | $3,233,900 | $5,923,000 |
| Profit Before Interest and Taxes | ($619,598) | $11,616,100 | $35,547,000 |
| EBITDA | ($583,598) | $11,906,100 | $36,337,000 |
| Interest Expense | $22,625 | $9,500 | $0 |
| Taxes Incurred | $0 | $2,901,650 | $9,034,863 |
| Net Profit | ($642,223) | $8,704,950 | $26,512,137 |
| Net Profit/Sales | -76.70% | 56.82% | 62.77% |
7.5 Projected Cash Flow
Management expects that equity capital will be required to take the company to permanent positive cash flow by September, 2000.

| Pro Forma Cash Flow | |||
| Year 1 | Year 2 | Year 3 | |
| Cash Received | |||
| Cash from Operations | |||
| Cash Sales | $41,868 | $766,000 | $2,111,750 |
| Cash from Receivables | $397,018 | $7,662,226 | $27,315,367 |
| Subtotal Cash from Operations | $438,885 | $8,428,226 | $29,427,117 |
| Additional Cash Received | |||
| Sales Tax, VAT, HST/GST Received | $0 | $0 | $0 |
| New Current Borrowing | $350,000 | $0 | $0 |
| New Other Liabilities (interest-free) | $0 | $0 | $0 |
| New Long-term Liabilities | $0 | $0 | $0 |
| Sales of Other Current Assets | $0 | $0 | $0 |
| Sales of Long-term Assets | $0 | $0 | $0 |
| New Investment Received | $1,250,000 | $1,500,000 | $0 |
| Subtotal Cash Received | $2,038,885 | $9,928,226 | $29,427,117 |
| Expenditures | Year 1 | Year 2 | Year 3 |
| Expenditures from Operations | |||
| Cash Spending | $718,250 | $1,430,000 | $2,100,000 |
| Bill Payments | $660,561 | $4,557,479 | $12,180,440 |
| Subtotal Spent on Operations | $1,378,811 | $5,987,479 | $14,280,440 |
| Additional Cash Spent | |||
| Sales Tax, VAT, HST/GST Paid Out | $0 | $0 | $0 |
| Principal Repayment of Current Borrowing | $160,000 | $190,000 | $0 |
| Other Liabilities Principal Repayment | $0 | $0 | $0 |
| Long-term Liabilities Principal Repayment | $0 | $0 | $0 |
| Purchase Other Current Assets | $0 | $0 | $0 |
| Purchase Long-term Assets | $360,000 | $1,000,000 | $2,000,000 |
| Dividends | $0 | $0 | $0 |
| Subtotal Cash Spent | $1,898,811 | $7,177,479 | $16,280,440 |
| Net Cash Flow | $140,074 | $2,750,747 | $13,146,677 |
| Cash Balance | $140,074 | $2,890,822 | $16,037,499 |
7.6 Projected Balance Sheet
The balance sheet projects substantial growth in net worth by the end of fiscal year 2002.
| Pro Forma Balance Sheet | |||
| Year 1 | Year 2 | Year 3 | |
| Assets | |||
| Current Assets | |||
| Cash | $140,074 | $2,890,822 | $16,037,499 |
| Accounts Receivable | $398,465 | $7,290,239 | $20,098,122 |
| Inventory | $20,000 | $20,000 | $20,000 |
| Other Current Assets | $10,000 | $10,000 | $10,000 |
| Total Current Assets | $568,539 | $10,211,060 | $36,165,621 |
| Long-term Assets | |||
| Long-term Assets | $360,000 | $1,360,000 | $3,360,000 |
| Accumulated Depreciation | $36,000 | $326,000 | $1,116,000 |
| Total Long-term Assets | $324,000 | $1,034,000 | $2,244,000 |
| Total Assets | $892,539 | $11,245,060 | $38,409,621 |
| Liabilities and Capital | Year 1 | Year 2 | Year 3 |
| Current Liabilities | |||
| Accounts Payable | $64,762 | $402,333 | $1,054,756 |
| Current Borrowing | $190,000 | $0 | $0 |
| Other Current Liabilities | $0 | $0 | $0 |
| Subtotal Current Liabilities | $254,762 | $402,333 | $1,054,756 |
| Long-term Liabilities | $0 | $0 | $0 |
| Total Liabilities | $254,762 | $402,333 | $1,054,756 |
| Paid-in Capital | $1,337,500 | $2,837,500 | $2,837,500 |
| Retained Earnings | ($57,500) | ($699,723) | $8,005,228 |
| Earnings | ($642,223) | $8,704,950 | $26,512,137 |
| Total Capital | $637,777 | $10,842,728 | $37,354,865 |
| Total Liabilities and Capital | $892,539 | $11,245,060 | $38,409,621 |
| Net Worth | $637,778 | $10,842,728 | $37,354,865 |
7.7 Business Ratios
Standard financial ratios are shown below and indicate a plan for manageable yet aggressive growth. Industry profile ratios based on the Standard Industrial Classification (SIC) code 4899, Communications Services, nec., are shown for comparison.
| Ratio Analysis | ||||
| Year 1 | Year 2 | Year 3 | Industry Profile | |
| Sales Growth | 0.00% | 1729.58% | 175.69% | 4.80% |
| Percent of Total Assets | ||||
| Accounts Receivable | 44.64% | 64.83% | 52.33% | 14.30% |
| Inventory | 2.24% | 0.18% | 0.05% | 2.50% |
| Other Current Assets | 1.12% | 0.09% | 0.03% | 46.50% |
| Total Current Assets | 63.70% | 90.80% | 94.16% | 63.30% |
| Long-term Assets | 36.30% | 9.20% | 5.84% | 36.70% |
| Total Assets | 100.00% | 100.00% | 100.00% | 100.00% |
| Current Liabilities | 28.54% | 3.58% | 2.75% | 43.60% |
| Long-term Liabilities | 0.00% | 0.00% | 0.00% | 26.30% |
| Total Liabilities | 28.54% | 3.58% | 2.75% | 69.90% |
| Net Worth | 71.46% | 96.42% | 97.25% | 30.10% |
| Percent of Sales | ||||
| Sales | 100.00% | 100.00% | 100.00% | 100.00% |
| Gross Margin | 64.36% | 96.93% | 98.19% | 57.80% |
| Selling, General & Administrative Expenses | 141.99% | 40.24% | 35.13% | 35.50% |
| Advertising Expenses | 32.24% | 6.53% | 4.74% | 1.00% |
| Profit Before Interest and Taxes | -74.00% | 75.82% | 84.16% | 1.90% |
| Main Ratios | ||||
| Current | 2.23 | 25.38 | 34.29 | 1.17 |
| Quick | 2.15 | 25.33 | 34.27 | 0.95 |
| Total Debt to Total Assets | 28.54% | 3.58% | 2.75% | 69.90% |
| Pre-tax Return on Net Worth | -100.70% | 107.05% | 95.16% | 4.20% |
| Pre-tax Return on Assets | -71.95% | 103.22% | 92.55% | 14.00% |
| Additional Ratios | Year 1 | Year 2 | Year 3 | |
| Net Profit Margin | -76.70% | 56.82% | 62.77% | n.a |
| Return on Equity | -100.70% | 80.28% | 70.97% | n.a |
| Activity Ratios | ||||
| Accounts Receivable Turnover | 2.00 | 2.00 | 2.00 | n.a |
| Collection Days | 51 | 96 | 125 | n.a |
| Inventory Turnover | 0.00 | 0.00 | 0.00 | n.a |
| Accounts Payable Turnover | 11.20 | 12.17 | 12.17 | n.a |
| Payment Days | 27 | 17 | 21 | n.a |
| Total Asset Turnover | 0.94 | 1.36 | 1.10 | n.a |
| Debt Ratios | ||||
| Debt to Net Worth | 0.40 | 0.04 | 0.03 | n.a |
| Current Liab. to Liab. | 1.00 | 1.00 | 1.00 | n.a |
| Liquidity Ratios | ||||
| Net Working Capital | $313,778 | $9,808,728 | $35,110,865 | n.a |
| Interest Coverage | -27.39 | 1,222.75 | 0.00 | n.a |
| Additional Ratios | ||||
| Assets to Sales | 1.07 | 0.73 | 0.91 | n.a |
| Current Debt/Total Assets | 29% | 4% | 3% | n.a |
| Acid Test | 0.59 | 7.21 | 15.21 | n.a |
| Sales/Net Worth | 1.31 | 1.41 | 1.13 | n.a |
| Dividend Payout | 0.00 | 0.00 | 0.00 | n.a |
Appendix
| Sales Forecast | |||||||||||||
| Month 1 | Month 2 | Month 3 | Month 4 | Month 5 | Month 6 | Month 7 | Month 8 | Month 9 | Month 10 | Month 11 | Month 12 | ||
| Sales | |||||||||||||
| MyLine General | 0% | $0 | $9,000 | $10,500 | $12,000 | $13,500 | $15,000 | $16,500 | $18,000 | $19,500 | $21,000 | $22,500 | $25,500 |
| Sports Mom Toll Free | 0% | $0 | $0 | $2,100 | $4,200 | $6,300 | $8,400 | $10,500 | $17,500 | $24,500 | $31,500 | $45,500 | $59,500 |
| Domestic Travelers/Calling Cards | 0% | $0 | $0 | $0 | $0 | $0 | $0 | $0 | $0 | $0 | $1,850 | $11,100 | $29,600 |
| International Travelers | 0% | $0 | $0 | $0 | $0 | $0 | $0 | $0 | $0 | $0 | $12,000 | $24,000 | $48,000 |
| Military | 0% | $0 | $0 | $700 | $1,400 | $2,100 | $2,800 | $16,800 | $30,800 | $44,800 | $58,800 | $72,800 | $86,800 |
| Total Sales | $0 | $9,000 | $13,300 | $17,600 | $21,900 | $26,200 | $43,800 | $66,300 | $88,800 | $125,150 | $175,900 | $249,400 | |
| Direct Cost of Sales | Month 1 | Month 2 | Month 3 | Month 4 | Month 5 | Month 6 | Month 7 | Month 8 | Month 9 | Month 10 | Month 11 | Month 12 | |
| MyLine General | $0 | $0 | $0 | $0 | $0 | $0 | $0 | $0 | $0 | $0 | $0 | $0 | |
| Sports Mom Toll Free | $0 | $0 | $0 | $0 | $0 | $0 | $0 | $0 | $0 | $0 | $0 | $0 | |
| Domestic Travelers/Calling Cards | $0 | $0 | $0 | $0 | $0 | $0 | $0 | $0 | $0 | $0 | $0 | $0 | |
| International Travelers | $0 | $0 | $0 | $0 | $0 | $0 | $0 | $0 | $0 | $0 | $0 | $0 | |
| Military | $0 | $0 | $0 | $0 | $0 | $0 | $0 | $0 | $0 | $0 | $0 | $0 | |
| Subtotal Direct Cost of Sales | $0 | $0 | $0 | $0 | $0 | $0 | $0 | $0 | $0 | $0 | $0 | $0 | |
| Personnel Plan | |||||||||||||
| Month 1 | Month 2 | Month 3 | Month 4 | Month 5 | Month 6 | Month 7 | Month 8 | Month 9 | Month 10 | Month 11 | Month 12 | ||
| Production Personnel | |||||||||||||
| VP of Operations-Russ Fish | $1,400 | $7,000 | $7,000 | $7,000 | $7,000 | $7,000 | $7,000 | $7,000 | $7,000 | $7,000 | $7,000 | $7,000 | |
| Sr. Systems Engineer-Dana Gilliam | $4,200 | $4,200 | $4,600 | $4,600 | $4,600 | $4,600 | $4,600 | $4,600 | $4,600 | $4,600 | $4,600 | $4,600 | |
| Systems Engineer-David Gabler | $3,800 | $3,800 | $3,800 | $3,800 | $3,800 | $3,800 | $3,800 | $3,800 | $3,800 | $3,800 | $3,800 | $3,800 | |
| Subtotal | $9,400 | $15,000 | $15,400 | $15,400 | $15,400 | $15,400 | $15,400 | $15,400 | $15,400 | $15,400 | $15,400 | $15,400 | |
| Sales and Marketing Personnel | |||||||||||||
| VP of Mkg.& Bus.Dev’t-M.van Steenwyk | $6,000 | $6,000 | $6,000 | $6,000 | $6,000 | $6,000 | $7,000 | $7,000 | $7,000 | $7,000 | $7,000 | $7,000 | |
| Sales Channel Managers | $0 | $0 | $0 | $0 | $0 | $0 | $2,500 | $5,000 | $7,500 | $7,500 | $7,500 | $10,000 | |
| Resource Analyst-Amber Higgins | $2,600 | $3,125 | $3,125 | $3,125 | $3,125 | $3,125 | $3,125 | $3,125 | $3,125 | $3,125 | $3,125 | $3,125 | |
| Account Manager-Brenda Thomasi | $2,000 | $3,125 | $3,125 | $3,125 | $3,125 | $3,125 | $3,125 | $3,125 | $3,125 | $3,125 | $3,125 | $3,125 | |
| Sales Representatives | $0 | $0 | $0 | $0 | $0 | $0 | $0 | $0 | $0 | $2,500 | $5,000 | $5,000 | |
| Subtotal | $10,600 | $12,250 | $12,250 | $12,250 | $12,250 | $12,250 | $15,750 | $18,250 | $20,750 | $23,250 | $25,750 | $28,250 | |
| General and Administrative Personnel | |||||||||||||
| CEO-Trone Miller | $8,000 | $8,000 | $8,000 | $8,000 | $8,000 | $8,000 | $10,833 | $10,833 | $10,833 | $10,833 | $10,833 | $10,833 | |
| CFO-Phil ErkenBrack | $8,000 | $8,000 | $8,000 | $8,000 | $8,000 | $8,000 | $9,167 | $9,167 | $9,167 | $9,167 | $9,167 | $9,167 | |
| Controller | $0 | $0 | $0 | $0 | $0 | $0 | $0 | $0 | $0 | $0 | $0 | $0 | |
| Billing Supervisor-Hector Padilla | $3,500 | $3,500 | $3,500 | $3,500 | $3,500 | $3,500 | $3,500 | $3,500 | $3,500 | $4,000 | $4,000 | $4,000 | |
| Accountants | $0 | $0 | $0 | $0 | $0 | $0 | $2,000 | $4,000 | $4,000 | $4,000 | $6,000 | $6,000 | |
| Administration Manager-Betty Benedix | $3,000 | $3,000 | $3,000 | $3,000 | $3,000 | $3,000 | $3,000 | $3,000 | $3,000 | $3,000 | $3,500 | $3,500 | |
| Asst. Manager | $0 | $0 | $0 | $0 | $0 | $0 | $0 | $1,000 | $2,000 | $2,000 | $2,000 | $2,000 | |
| Receptionist | $0 | $0 | $0 | $0 | $0 | $0 | $0 | $900 | $900 | $900 | $900 | $900 | |
| Human Resources Clerk | $0 | $0 | $0 | $0 | $0 | $0 | $0 | $0 | $0 | $0 | $0 | $0 | |
| Subtotal | $22,500 | $22,500 | $22,500 | $22,500 | $22,500 | $22,500 | $28,500 | $32,400 | $33,400 | $33,900 | $36,400 | $36,400 | |
| Other Personnel | |||||||||||||
| Name or title | $0 | $0 | $0 | $0 | $0 | $0 | $0 | $0 | $0 | $0 | $0 | $0 | |
| Other | $0 | $0 | $0 | $0 | $0 | $0 | $0 | $0 | $0 | $0 | $0 | $0 | |
| Subtotal | $0 | $0 | $0 | $0 | $0 | $0 | $0 | $0 | $0 | $0 | $0 | $0 | |
| Total People | 10 | 10 | 10 | 10 | 10 | 10 | 12 | 15 | 15 | 16 | 17 | 17 | |
| Total Payroll | $42,500 | $49,750 | $50,150 | $50,150 | $50,150 | $50,150 | $59,650 | $66,050 | $69,550 | $72,550 | $77,550 | $80,050 | |
| General Assumptions | |||||||||||||
| Month 1 | Month 2 | Month 3 | Month 4 | Month 5 | Month 6 | Month 7 | Month 8 | Month 9 | Month 10 | Month 11 | Month 12 | ||
| Plan Month | 1 | 2 | 3 | 4 | 5 | 6 | 7 | 8 | 9 | 10 | 11 | 12 | |
| Current Interest Rate | 10.00% | 10.00% | 10.00% | 10.00% | 10.00% | 10.00% | 10.00% | 10.00% | 10.00% | 10.00% | 10.00% | 10.00% | |
| Long-term Interest Rate | 9.00% | 9.00% | 9.00% | 9.00% | 9.00% | 9.00% | 9.00% | 9.00% | 9.00% | 9.00% | 9.00% | 9.00% | |
| Tax Rate | 30.00% | 25.00% | 25.00% | 25.00% | 25.00% | 25.00% | 25.00% | 25.00% | 25.00% | 25.00% | 25.00% | 25.00% | |
| Other | 0 | 0 | 0 | 0 | 0 | 0 | 0 | 0 | 0 | 0 | 0 | 0 | |
| Pro Forma Profit and Loss | |||||||||||||
| Month 1 | Month 2 | Month 3 | Month 4 | Month 5 | Month 6 | Month 7 | Month 8 | Month 9 | Month 10 | Month 11 | Month 12 | ||
| Sales | $0 | $9,000 | $13,300 | $17,600 | $21,900 | $26,200 | $43,800 | $66,300 | $88,800 | $125,150 | $175,900 | $249,400 | |
| Direct Cost of Sales | $0 | $0 | $0 | $0 | $0 | $0 | $0 | $0 | $0 | $0 | $0 | $0 | |
| Production Payroll | $9,400 | $15,000 | $15,400 | $15,400 | $15,400 | $15,400 | $15,400 | $15,400 | $15,400 | $15,400 | $15,400 | $15,400 | |
| Network expense | $10,000 | $10,000 | $10,000 | $10,000 | $10,000 | $10,000 | $10,000 | $10,000 | $10,000 | $10,000 | $10,000 | $10,000 | |
| Total Cost of Sales | $19,400 | $25,000 | $25,400 | $25,400 | $25,400 | $25,400 | $25,400 | $25,400 | $25,400 | $25,400 | $25,400 | $25,400 | |
| Gross Margin | ($19,400) | ($16,000) | ($12,100) | ($7,800) | ($3,500) | $800 | $18,400 | $40,900 | $63,400 | $99,750 | $150,500 | $224,000 | |
| Gross Margin % | 0.00% | -177.78% | -90.98% | -44.32% | -15.98% | 3.05% | 42.01% | 61.69% | 71.40% | 79.70% | 85.56% | 89.82% | |
| Operating Expenses | |||||||||||||
| Sales and Marketing Expenses | |||||||||||||
| Sales and Marketing Payroll | $10,600 | $12,250 | $12,250 | $12,250 | $12,250 | $12,250 | $15,750 | $18,250 | $20,750 | $23,250 | $25,750 | $28,250 | |
| Advertising/Promotion | $0 | $0 | $0 | $0 | $10,000 | $10,000 | $50,000 | $45,000 | $65,000 | $40,000 | $30,000 | $20,000 | |
| Trade Shows | $0 | $0 | $0 | $0 | $0 | $0 | $10,000 | $0 | $0 | $0 | $0 | $0 | |
| Travel | $0 | $0 | $0 | $0 | $3,000 | $3,000 | $5,000 | $5,000 | $5,000 | $5,000 | $5,000 | $5,000 | |
| Marketing Collateral & Supplies | $0 | $0 | $0 | $0 | $1,500 | $1,500 | $3,000 | $3,000 | $3,000 | $3,000 | $3,000 | $3,000 | |
| Publications | $0 | $0 | $0 | $0 | $0 | $0 | $6,500 | $0 | $0 | $0 | $0 | $0 | |
| Demos and Samples | $0 | $0 | $0 | $0 | $1,000 | $1,000 | $1,000 | $1,000 | $1,000 | $1,000 | $2,000 | $2,000 | |
| Total Sales and Marketing Expenses | $10,600 | $12,250 | $12,250 | $12,250 | $27,750 | $27,750 | $91,250 | $72,250 | $94,750 | $72,250 | $65,750 | $58,250 | |
| Sales and Marketing % | 0.00% | 136.11% | 92.11% | 69.60% | 126.71% | 105.92% | 208.33% | 108.97% | 106.70% | 57.73% | 37.38% | 23.36% | |
| General and Administrative Expenses | |||||||||||||
| General and Administrative Payroll | $22,500 | $22,500 | $22,500 | $22,500 | $22,500 | $22,500 | $28,500 | $32,400 | $33,400 | $33,900 | $36,400 | $36,400 | |
| Sales and Marketing and Other Expenses | $0 | $0 | $0 | $0 | $0 | $0 | $0 | $0 | $0 | $0 | $0 | $0 | |
| Depreciation | $0 | $0 | $0 | $0 | $1,000 | $2,000 | $3,000 | $4,000 | $5,000 | $6,000 | $7,000 | $8,000 | |
| Leased Equipment | $1,000 | $1,000 | $1,000 | $1,000 | $1,000 | $1,000 | $1,000 | $2,000 | $2,000 | $2,000 | $2,000 | $2,000 | |
| Utilities | $500 | $500 | $500 | $500 | $500 | $500 | $1,000 | $1,000 | $1,000 | $1,000 | $1,000 | $1,000 | |
| Insurance | $1,000 | $1,000 | $1,000 | $1,000 | $1,000 | $1,000 | $1,000 | $1,000 | $1,000 | $1,000 | $1,000 | $1,000 | |
| Rent | $2,000 | $2,000 | $2,000 | $2,000 | $2,000 | $2,000 | $2,000 | $2,000 | $2,000 | $2,000 | $3,000 | $3,000 | |
| Other | $0 | $0 | $0 | $0 | $0 | $0 | $0 | $0 | $0 | $0 | $0 | $0 | |
| Payroll Taxes | 23% | $9,775 | $11,443 | $11,535 | $11,535 | $11,535 | $11,535 | $13,720 | $15,192 | $15,997 | $16,687 | $17,837 | $18,412 |
| Other General and Administrative Expenses | $0 | $0 | $0 | $0 | $0 | $0 | $0 | $0 | $0 | $0 | $0 | $0 | |
| Total General and Administrative Expenses | $36,775 | $38,443 | $38,535 | $38,535 | $39,535 | $40,535 | $50,220 | $57,592 | $60,397 | $62,587 | $68,237 | $69,812 | |
| General and Administrative % | 0.00% | 427.14% | 289.73% | 218.95% | 180.52% | 154.71% | 114.66% | 86.87% | 68.01% | 50.01% | 38.79% | 27.99% | |
| Other Expenses: | |||||||||||||
| Other Payroll | $0 | $0 | $0 | $0 | $0 | $0 | $0 | $0 | $0 | $0 | $0 | $0 | |
| Consultants | $0 | $0 | $0 | $0 | $0 | $0 | $0 | $0 | $0 | $0 | $0 | $0 | |
| Contract/Consultants | $0 | $0 | $0 | $0 | $0 | $0 | $0 | $0 | $0 | $0 | $0 | $0 | |
| Total Other Expenses | $0 | $0 | $0 | $0 | $0 | $0 | $0 | $0 | $0 | $0 | $0 | $0 | |
| Other % | 0.00% | 0.00% | 0.00% | 0.00% | 0.00% | 0.00% | 0.00% | 0.00% | 0.00% | 0.00% | 0.00% | 0.00% | |
| Total Operating Expenses | $47,375 | $50,693 | $50,785 | $50,785 | $67,285 | $68,285 | $141,470 | $129,842 | $155,147 | $134,837 | $133,987 | $128,062 | |
| Profit Before Interest and Taxes | ($66,775) | ($66,693) | ($62,885) | ($58,585) | ($70,785) | ($67,485) | ($123,070) | ($88,942) | ($91,747) | ($35,087) | $16,514 | $95,939 | |
| EBITDA | ($66,775) | ($66,693) | ($62,885) | ($58,585) | ($69,785) | ($65,485) | ($120,070) | ($84,942) | ($86,747) | ($29,087) | $23,514 | $103,939 | |
| Interest Expense | $625 | $1,375 | $1,875 | $2,583 | $2,458 | $2,333 | $2,208 | $2,083 | $1,958 | $1,833 | $1,708 | $1,583 | |
| Taxes Incurred | $0 | $0 | $0 | $0 | $0 | $0 | $0 | $0 | $0 | $0 | $0 | $0 | |
| Net Profit | ($67,400) | ($68,068) | ($64,760) | ($61,168) | ($73,243) | ($69,818) | ($125,278) | ($91,025) | ($93,705) | ($36,920) | $14,805 | $94,355 | |
| Net Profit/Sales | 0.00% | -756.31% | -486.91% | -347.54% | -334.44% | -266.48% | -286.02% | -137.29% | -105.52% | -29.50% | 8.42% | 37.83% | |
| Pro Forma Cash Flow | |||||||||||||
| Month 1 | Month 2 | Month 3 | Month 4 | Month 5 | Month 6 | Month 7 | Month 8 | Month 9 | Month 10 | Month 11 | Month 12 | ||
| Cash Received | |||||||||||||
| Cash from Operations | |||||||||||||
| Cash Sales | $0 | $450 | $665 | $880 | $1,095 | $1,310 | $2,190 | $3,315 | $4,440 | $6,258 | $8,795 | $12,470 | |
| Cash from Receivables | $0 | $0 | $285 | $8,686 | $12,771 | $16,856 | $20,941 | $25,447 | $42,323 | $63,698 | $85,511 | $120,500 | |
| Subtotal Cash from Operations | $0 | $450 | $950 | $9,566 | $13,866 | $18,166 | $23,131 | $28,762 | $46,763 | $69,955 | $94,306 | $132,970 | |
| Additional Cash Received | |||||||||||||
| Sales Tax, VAT, HST/GST Received | 0.00% | $0 | $0 | $0 | $0 | $0 | $0 | $0 | $0 | $0 | $0 | $0 | $0 |
| New Current Borrowing | $75,000 | $100,000 | $75,000 | $100,000 | $0 | $0 | $0 | $0 | $0 | $0 | $0 | $0 | |
| New Other Liabilities (interest-free) | $0 | $0 | $0 | $0 | $0 | $0 | $0 | $0 | $0 | $0 | $0 | $0 | |
| New Long-term Liabilities | $0 | $0 | $0 | $0 | $0 | $0 | $0 | $0 | $0 | $0 | $0 | $0 | |
| Sales of Other Current Assets | $0 | $0 | $0 | $0 | $0 | $0 | $0 | $0 | $0 | $0 | $0 | $0 | |
| Sales of Long-term Assets | $0 | $0 | $0 | $0 | $0 | $0 | $0 | $0 | $0 | $0 | $0 | $0 | |
| New Investment Received | $0 | $0 | $0 | $0 | $250,000 | $250,000 | $0 | $250,000 | $250,000 | $0 | $250,000 | $0 | |
| Subtotal Cash Received | $75,000 | $100,450 | $75,950 | $109,566 | $263,866 | $268,166 | $23,131 | $278,762 | $296,763 | $69,955 | $344,306 | $132,970 | |
| Expenditures | Month 1 | Month 2 | Month 3 | Month 4 | Month 5 | Month 6 | Month 7 | Month 8 | Month 9 | Month 10 | Month 11 | Month 12 | |
| Expenditures from Operations | |||||||||||||
| Cash Spending | $42,500 | $49,750 | $50,150 | $50,150 | $50,150 | $50,150 | $59,650 | $66,050 | $69,550 | $72,550 | $77,550 | $80,050 | |
| Bill Payments | $830 | $24,981 | $27,337 | $27,933 | $29,130 | $43,989 | $45,953 | $105,789 | $87,964 | $107,140 | $83,287 | $76,226 | |
| Subtotal Spent on Operations | $43,330 | $74,731 | $77,487 | $78,083 | $79,280 | $94,139 | $105,603 | $171,839 | $157,514 | $179,690 | $160,837 | $156,277 | |
| Additional Cash Spent | |||||||||||||
| Sales Tax, VAT, HST/GST Paid Out | $0 | $0 | $0 | $0 | $0 | $0 | $0 | $0 | $0 | $0 | $0 | $0 | |
| Principal Repayment of Current Borrowing | $0 | $10,000 | $15,000 | $15,000 | $15,000 | $15,000 | $15,000 | $15,000 | $15,000 | $15,000 | $15,000 | $15,000 | |
| Other Liabilities Principal Repayment | $0 | $0 | $0 | $0 | $0 | $0 | $0 | $0 | $0 | $0 | $0 | $0 | |
| Long-term Liabilities Principal Repayment | $0 | $0 | $0 | $0 | $0 | $0 | $0 | $0 | $0 | $0 | $0 | $0 | |
| Purchase Other Current Assets | $0 | $0 | $0 | $0 | $0 | $0 | $0 | $0 | $0 | $0 | $0 | $0 | |
| Purchase Long-term Assets | $0 | $0 | $0 | $0 | $45,000 | $45,000 | $45,000 | $45,000 | $45,000 | $45,000 | $45,000 | $45,000 | |
| Dividends | $0 | $0 | $0 | $0 | $0 | $0 | $0 | $0 | $0 | $0 | $0 | $0 | |
| Subtotal Cash Spent | $43,330 | $84,731 | $92,487 | $93,083 | $139,280 | $154,139 | $165,603 | $231,839 | $217,514 | $239,690 | $220,837 | $216,277 | |
| Net Cash Flow | $31,670 | $15,719 | ($16,537) | $16,483 | $124,586 | $114,028 | ($142,472) | $46,923 | $79,248 | ($169,735) | $123,469 | ($83,307) | |
| Cash Balance | $31,670 | $47,389 | $30,852 | $47,335 | $171,921 | $285,949 | $143,477 | $190,400 | $269,648 | $99,913 | $223,381 | $140,074 | |
| Pro Forma Balance Sheet | |||||||||||||
| Month 1 | Month 2 | Month 3 | Month 4 | Month 5 | Month 6 | Month 7 | Month 8 | Month 9 | Month 10 | Month 11 | Month 12 | ||
| Assets | Starting Balances | ||||||||||||
| Current Assets | |||||||||||||
| Cash | $0 | $31,670 | $47,389 | $30,852 | $47,335 | $171,921 | $285,949 | $143,477 | $190,400 | $269,648 | $99,913 | $223,381 | $140,074 |
| Accounts Receivable | $0 | $0 | $8,550 | $20,900 | $28,934 | $36,968 | $45,002 | $65,670 | $103,208 | $145,246 | $200,441 | $282,034 | $398,465 |
| Inventory | $20,000 | $20,000 | $20,000 | $20,000 | $20,000 | $20,000 | $20,000 | $20,000 | $20,000 | $20,000 | $20,000 | $20,000 | $20,000 |
| Other Current Assets | $10,000 | $10,000 | $10,000 | $10,000 | $10,000 | $10,000 | $10,000 | $10,000 | $10,000 | $10,000 | $10,000 | $10,000 | $10,000 |
| Total Current Assets | $30,000 | $61,670 | $85,939 | $81,752 | $106,269 | $238,889 | $360,950 | $239,147 | $323,608 | $444,893 | $330,353 | $535,416 | $568,539 |
| Long-term Assets | |||||||||||||
| Long-term Assets | $0 | $0 | $0 | $0 | $0 | $45,000 | $90,000 | $135,000 | $180,000 | $225,000 | $270,000 | $315,000 | $360,000 |
| Accumulated Depreciation | $0 | $0 | $0 | $0 | $0 | $1,000 | $3,000 | $6,000 | $10,000 | $15,000 | $21,000 | $28,000 | $36,000 |
| Total Long-term Assets | $0 | $0 | $0 | $0 | $0 | $44,000 | $87,000 | $129,000 | $170,000 | $210,000 | $249,000 | $287,000 | $324,000 |
| Total Assets | $30,000 | $61,670 | $85,939 | $81,752 | $106,269 | $282,889 | $447,950 | $368,147 | $493,608 | $654,893 | $579,353 | $822,416 | $892,539 |
| Liabilities and Capital | Month 1 | Month 2 | Month 3 | Month 4 | Month 5 | Month 6 | Month 7 | Month 8 | Month 9 | Month 10 | Month 11 | Month 12 | |
| Current Liabilities | |||||||||||||
| Accounts Payable | $0 | $24,070 | $26,407 | $26,979 | $27,664 | $42,526 | $42,406 | $102,880 | $84,366 | $104,356 | $80,736 | $73,993 | $64,762 |
| Current Borrowing | $0 | $75,000 | $165,000 | $225,000 | $310,000 | $295,000 | $280,000 | $265,000 | $250,000 | $235,000 | $220,000 | $205,000 | $190,000 |
| Other Current Liabilities | $0 | $0 | $0 | $0 | $0 | $0 | $0 | $0 | $0 | $0 | $0 | $0 | $0 |
| Subtotal Current Liabilities | $0 | $99,070 | $191,407 | $251,979 | $337,664 | $337,526 | $322,406 | $367,880 | $334,366 | $339,356 | $300,736 | $278,993 | $254,762 |
| Long-term Liabilities | $0 | $0 | $0 | $0 | $0 | $0 | $0 | $0 | $0 | $0 | $0 | $0 | $0 |
| Total Liabilities | $0 | $99,070 | $191,407 | $251,979 | $337,664 | $337,526 | $322,406 | $367,880 | $334,366 | $339,356 | $300,736 | $278,993 | $254,762 |
| Paid-in Capital | $87,500 | $87,500 | $87,500 | $87,500 | $87,500 | $337,500 | $587,500 | $587,500 | $837,500 | $1,087,500 | $1,087,500 | $1,337,500 | $1,337,500 |
| Retained Earnings | ($57,500) | ($57,500) | ($57,500) | ($57,500) | ($57,500) | ($57,500) | ($57,500) | ($57,500) | ($57,500) | ($57,500) | ($57,500) | ($57,500) | ($57,500) |
| Earnings | $0 | ($67,400) | ($135,468) | ($200,227) | ($261,395) | ($334,638) | ($404,456) | ($529,733) | ($620,758) | ($714,463) | ($751,383) | ($736,578) | ($642,223) |
| Total Capital | $30,000 | ($37,400) | ($105,468) | ($170,227) | ($231,395) | ($54,638) | $125,545 | $267 | $159,242 | $315,537 | $278,617 | $543,422 | $637,777 |
| Total Liabilities and Capital | $30,000 | $61,670 | $85,939 | $81,752 | $106,269 | $282,889 | $447,950 | $368,147 | $493,608 | $654,893 | $579,353 | $822,416 | $892,539 |
| Net Worth | $30,000 | ($37,400) | ($105,467) | ($170,227) | ($231,395) | ($54,638) | $125,545 | $267 | $159,242 | $315,537 | $278,617 | $543,422 | $637,778 |


