
Center for Technology and Investment
Executive Summary
The Center for Technology and Investment (CTI) is a company devoted to bringing investment in technology within reach of rural small business owners. The company is founded on evidence that there are tremendous amount of underserved rural small businesses that are in need of technological consulting and experience, but that don’t have the revenue to hire large multinational firms to do the work.
Through innovative funding sources, including grants and charitable contributions made by the owner’s company and by individuals who are interested in helping rural Oregon develop economically, CTI will become an innovative new force in rural Oregon.
CTI’s management team consists of one individual, Bill Franklin. Mr. Franklin has developed technology in the Silicon Valley for over 35 years, and was one of the first Electrical Engineers to work at the Stanford Research Institute (SRI). Mr. Franklin is a leading expert in the general field of technological advancement, and has owned several businesses during his lifetime, including two that he sold for a profit.
The market for CTI’s services are not limited to rural Oregon, and if the business expands, it is likely to expand further into the rural West. There are over 45,000 rural “mom and pop” businesses operating in the Western United States, and of these, a high percentage have little or no experience with high technology and know very little about seeking alternative funding sources.
The purpose of this investment business plan is to help formalize the business strategy, as well as to provide evidence that CTI is a worthy investment for a $10,000 open line of credit from X bank. This open line of credit is designed to begin with a loan of $10,000, and to help manage cash flow after the first month CTI is a going concern.

1.1 Objectives
The Center for Technology and Investment will serve the needs of approximately 500 clients by Month 4 of Year 1. Of these clients, at least 50% will have purchased one or more products from the organization, and 100% will have purchased services.
Financial goals are listed below:
- Within the first year achieve a 25% contribution margin on books, software, academic materials, and other products.
- Keep cost of revenue on service to below 20%.
- Net revenue increase of 350% from Month 1 to Month 12.
- Net revenue margin of 30% in Year 1, 35% by Year 2.
1.2 Mission
The Center for Technology and Investment is a nonprofit organization that was created to help rural small business owners use technology more effectively. The company’s charter is based on evidence that many rural small business owners simply don’t have the resources or connections to use technology wisely. Our mission is to bridge that gap through training and by educating the small business owner in how to utilize the resources they have, and leverage the technology available to get the most out of their businesses.
The organization will have fulfilled its mission when all of its clients have achieved growth rates above 20% combined.
1.3 Keys to Success
Here are a few important keys to success:
- Focus on the target market: Drill down into several layers of demographics.
- High detail planning and execution: Quarterly seminars must be thoroughly researched, costs accurately understood, and content kept both fresh and consistent.
- Retainer consulting must remain at a low cost to the rural business owner, and must be a very small percentage of any funding the business owner receives as a result of technology grants and other SBA programs. CTI must maintain itself not as a broker for SBA or other funding, but simply as a consultant with the knowledge to help clients reach high-level technology funding.
- Financials must be kept above the highest standards due to nonprofit status in a largely for-profit industry.
Organization Summary
The Center for Technology and Investment is a start-up nonprofit. The nonprofit was the brainchild of Bill Franklin, sole proprietor.
The company has its headquarters in Baker City, Oregon. This location was chosen due to its proximity to small business empowerment zones, and rural development zones that tend to receive preferential treatment under the SBA’s SBIR/STTR funding initiatives.
The Center for Technology and Investment is a 501(c)(3) nonprofit corporation, and most revenue is collected through grants and other fundraising efforts, while a small percentage of funding arrives through the company’s client base of rural and semi-rural small businesses.
2.1 Legal Entity
The Center for Technology and Investment is a nonprofit company incorporated in Oregon.
The board of Directors is made up of several high profile business professors and professionals living in and around the Eugene/Portland Metro area. The board holds its meeting every August in Cannon Beach, Oregon.
2.2 Start-up Summary
The company begins as a going concern with very little debt, and a lot of liquid capital – cash. The idea behind this type of start-up plan is to keep overhead at a bare minimum so that the service business can thrive on the knowledge and expertise of Bill Franklin. The second largest expense upon startup, and the largest ongoing expense affecting free cash flow is simply the lease payment on the office space in Baker City, OR.
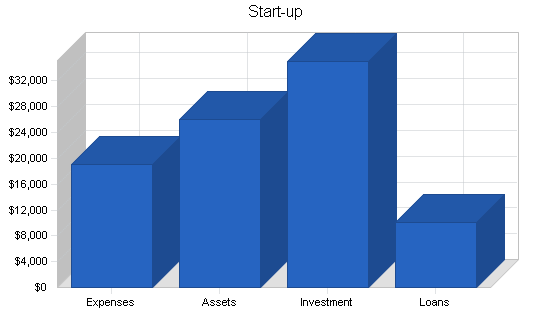
| Start-up Funding | |
| Start-up Expenses to Fund | $19,050 |
| Start-up Assets to Fund | $25,950 |
| Total Funding Required | $45,000 |
| Assets | |
| Non-cash Assets from Start-up | $10,000 |
| Cash Requirements from Start-up | $15,950 |
| Additional Cash Raised | $0 |
| Cash Balance on Starting Date | $15,950 |
| Total Assets | $25,950 |
| Liabilities and Capital | |
| Liabilities | |
| Current Borrowing | $10,000 |
| Long-term Liabilities | $0 |
| Accounts Payable (Outstanding Bills) | $0 |
| Other Current Liabilities (interest-free) | $0 |
| Total Liabilities | $10,000 |
| Capital | |
| Planned Investment | |
| Bill Franklin | $35,000 |
| Other | $0 |
| Additional Investment Requirement | $0 |
| Total Planned Investment | $35,000 |
| Loss at Start-up (Start-up Expenses) | ($19,050) |
| Total Capital | $15,950 |
| Total Capital and Liabilities | $25,950 |
| Total Funding | $45,000 |
| Start-up | |
| Requirements | |
| Start-up Expenses | |
| Legal | $750 |
| Stationery etc. | $500 |
| Brochures | $1,000 |
| Insurance | $300 |
| Rent | $1,500 |
| Expensed Equipment | $15,000 |
| Total Start-up Expenses | $19,050 |
| Start-up Assets | |
| Cash Required | $15,950 |
| Start-up Inventory | $0 |
| Other Current Assets | $0 |
| Long-term Assets | $10,000 |
| Total Assets | $25,950 |
| Total Requirements | $45,000 |
Products and Services
The Center for Technology and Investment will offer the following consulting services:
- Needs Analysis: Determine what technology gaps exist in decision making process, recommend changes.
- Coaching: Guide the owner through various scenarios, help them purchase tools and technology, build on technological synergies with client’s customers, push owner to test the limits of their technological capabilities and potential.
- Procurement Sourcing: Establish long-term channels and determine technology suppliers. Manage sourcing and recommend upgrades on a quarterly basis.
- Short and inexpensive seminars designed to gather consulting leads and sell moderate small business books and other resources.
Market Analysis Summary
The target market lives and owns a business located in rural America, and may have been in business for one or more years. The clients are chosen according to their lack of knowledge in regards to technology, and their inability to reach higher levels of productivity through technological innovation of both processes and methods. These potential customers may operate companies that sell used tires or high-end garden supplies. The product is not what matters as we isolate this market, it is the processes that we are interested in fixing.
Each of our clients will reside within a SBA qualified empowerment zone. This will hold us to the parameters stipulated by the grant authorization office, and ensure that we are serving those most in need of business training and advice. It will also give us the opportunity to build ties in communities in which commerce growth could be substantial.

4.1 Market Segmentation
Our first market segment is made up of empowerment zone recipients. These clients are established in rural areas, and qualify for special SBA loans, and other government benefits. We are able to determine the geography of the empowerment zones from SBA provided data. Other resources include online data warehouses, the yellow pages, and word of mouth references.
Our two non-primary potential clients are other small businesses. These may be ongoing businesses, or start-up businesses. The growth of startups is obviously higher than that of ongoing concerns, this is due to the availability of so many “dreamers,” but due to the cruelty of the market, many of these never become “implementers.” Still, they are both important markets to CTI, and will be treated as such.

| Market Analysis | |||||||
| Year 1 | Year 2 | Year 3 | Year 4 | Year 5 | |||
| Potential Customers | Growth | CAGR | |||||
| Empowerment Zone Recipients | 12% | 750 | 840 | 941 | 1,054 | 1,180 | 12.00% |
| Other Small Business Owners (Ongoing) | 3% | 1,200 | 1,236 | 1,273 | 1,311 | 1,350 | 2.99% |
| Other Small Business Owners (Startup) | 15% | 3,500 | 4,025 | 4,629 | 5,323 | 6,121 | 15.00% |
| Total | 12.25% | 5,450 | 6,101 | 6,843 | 7,688 | 8,651 | 12.25% |
4.2 Target Market Segment Strategy
CTI’s target markets are important to our overall strategy because there are three needs that aren’t being met in rural markets:
- Technology needs: The need to develop more efficient methods for procuring products/services, training staff, automating sales, and other needs necessary to keep a business functioning well.
- Financing needs: Without financing during good times as well as bad, many small businesses would simply go out of business for want of cash, or because they could not finance and build the product.
- Connections: Many rural small businesses don’t have the capital, financial, and marketing connections that their urban counterparts enjoy. This leaves them at a distinct disadvantage in a brutally free market such as that found in the U.S.
CTI intends to meet these needs by pooling various contacts and financial resources, including grants, to help these businesses survive and thrive. The strategy is to focus on these three needs, discover which one(s) is(are) holding each company back, and follow through with actionable results and recommendations.
4.3 Service Providers Analysis
CTI’s service industry is cluttered and difficult to frame. Small Business Development Centers (SBDC) play a similar, more limited role in providing resources for a small business owner, and explaining tax laws, hosting classes and workshops, etc. Native American SBDCs aside, many of these offices are not designed around the needs of the rural business person, although they can be useful to them.
Also in this service industry are online and offline private enterprises, for-profit small business consultancies. These can range from a one person show, to a multinational conglomerate with urban offices and semi-rural branches. These for-profit companies are often classic consultancies in the sense that they assume a low level of commitment towards the client’s business, and often relies on image to prevent the owner from asking why they have not received more for their money.
4.3.1 Alternatives and Usage Patterns
Competition in CTI’s niche is very limited. As stated earlier, the SBDCs, most notably rural SBDCs, are the greatest competitors to CTI. The urban based for-profits, and community development centers that dot the landscape are not as focused on technology or systems as a component of change. They are often limited operations involving one or two experts with very limited exposure to reasonably-priced technology that will provide the highest ROI to their clients.
Price is definitely a problem for most rural businesses, and for building a client base in rural America. This is easily adapted to through the combination of funding sources sought by CTI, and the company’s funding and tax advantage as a nonprofit. Prices are subsequently kept low, as clients are rolled into the program on the basis of quantity. As each business retains its own consultant via a low monthly fee, only some businesses end up using the resources, even though it is made available to all paying clients.
Reputation is important, and CTI has built a powerful enough reputation to be generating 35% of its current income and clients through word-of-mouth (WOM) advertising.
Strategy and Implementation Summary
CTI’s strategic focus is centered around helping small rural businesses find specialized funding and helping them use that funding to enhance their business through technology. If the company will not benefit from CTI’s services, as per the evaluation, CTI will not offer its services to those clients.
5.1 Fundraising Strategy
Fundraising and revenue will be generated through a combination of SBA grants and local empowerment zone grants. In addition, clients will be expected to pay for a % of the costs involved, depending on their financial status. The largest expected revenue generator is through the Federal and State Technology (FAST) Partnership Program sponsored by the SBA. Under this program, The Center for Technology and Investment may qualify for an Oregon State grant of up to $50,000, and a matching Federal Grant of up to $125,000. In addition, smaller business development grants at the State and Federal level will help continue funding for the organization.
Federal and State grants alone, or even combined with small business client revenue is still not enough to allow the company to achieve its mission. A low cost monthly retainer fee will be required of all rural participants. Depending upon the client, this fee might range from between $50-100 monthly. In exchange for this low monthly fee, the client will have 100% access to CTI services, and they will often find that the cost savings, and revenue developed through a relationship with CTI will more than pay for the low monthly retainer. The retainer may go up or down depending on the level of funding achieved each year by CTI. Each December, an amount equal to 50% of the proceeds over and above operating costs will be sent back to the client. The other 50% will be put back into the company to encourage additional rural growth in other parts of the nation.
Additional funding will be acquired through telephone, email, and snail mail soliciting of households sympathetic to the empowerment of business owners and future business owners. This funding is contingent upon the top-level funding described in the paragraphs above.
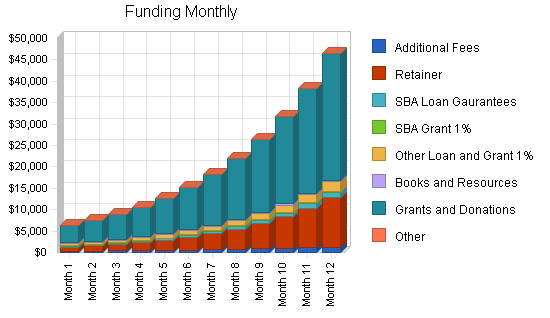
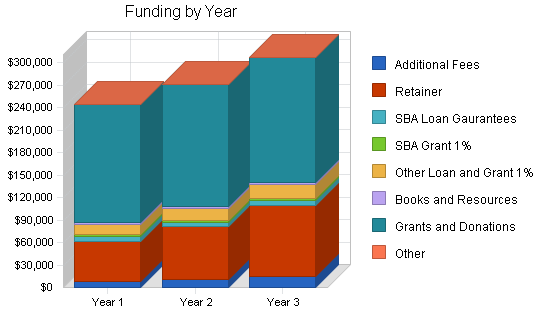
5.1.1 Funding Forecast
CTI expects retainer and donations to constitute the bulk of the funding. Modest growth in line with the market, and conservative estimates make this funding plan highly realistic in comparison to funding for similar organizations such SBDCs. In fact, CTI is hoping to achieve SBDC status itself, and earn a grant (Under “Donations”) of at least $50,000 by year two.
COGS are minimal as most costs associated with running the business reside in the P&L statement.
| Funding Forecast | |||
| Year 1 | Year 2 | Year 3 | |
| Funding | |||
| Additional Fees | $7,825 | $10,955 | $15,336 |
| Retainer | $53,915 | $70,089 | $94,621 |
| SBA Loan Gaurantees | $5,844 | $6,136 | $6,443 |
| SBA Grant 1% | $2,583 | $2,712 | $2,848 |
| Other Loan and Grant 1% | $13,828 | $15,902 | $18,288 |
| Books and Resources | $3,000 | $3,090 | $3,183 |
| Grants and Donations | $157,435 | $162,158 | $167,023 |
| Other | $0 | $0 | $0 |
| Total Funding | $244,429 | $271,042 | $307,741 |
| Direct Cost of Funding | Year 1 | Year 2 | Year 3 |
| COGS | $2,146 | $2,146 | $2,146 |
| Other | $0 | $0 | $0 |
| Subtotal Cost of Funding | $2,146 | $2,146 | $2,146 |
5.2 Competitive Edge
CTI’s competitive edge is its ability to communicate one on one through a person like Bill Franklin, someone with a deep love of technology, and rich history within the technology sector, but also a person with the skills to handle rural citizens one on one. He is someone who has lived in rural Oregon for many years, and so understands his clients and potential clients well enough to know the names of their wives, children, their hobbies, and more. Bill is a consummate communicator who fits the profile of his clients, this is the kind of advantage necessary to thrive in a rural economy. It’s as much who you know, as it is what you know.
5.3 Marketing Strategy
CTI plans to market its services through traditional WOM sources (friends, family, etc), as well as through more professional means such as mailbox flyers, door to door sales, and conference booths.
The marketing for these services is designed around how traditional, rural citizens network. The strategy is to reach these potential clients one on one, demonstrate what CTI can do for them, explain the difference in mentality between a for-profit consultancy and one that is designated nonprofit, and then build on the relationship to actively encourage to existing clients that they bring more business to CTI. At some point, this may even include a finders fee or some other financial incentive, although CTI hopes that its clients are loyal enough and happy with the service that they will recommend the organization for free.
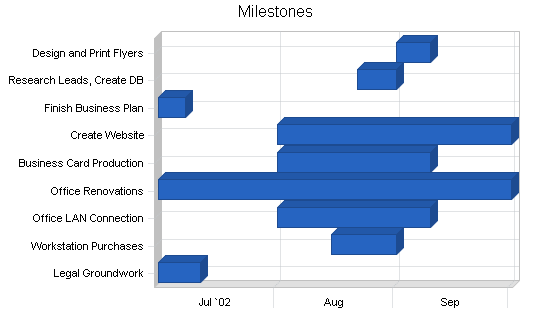
5.4 Milestones
The attached table demonstrates the milestones for CTI. Bill Franklin will oversee all of the necessary tasks, and will defer to the board in cases where the board is available to fill in for Mr. Franklin. Since Mr. Franklin will also be working with each customer individually, it is very possible that some of these tasks will be handed over to one of his board members.
| Milestones | |||||
| Milestone | Start Date | End Date | Budget | Manager | Department |
| Design and Print Flyers | 9/1/2002 | 9/10/2002 | $1,500 | Bill Franklin | CEO |
| Research Leads, Create DB | 8/22/2002 | 9/1/2002 | $250 | Bill Franklin | CEO |
| Finish Business Plan | 7/1/2002 | 7/8/2002 | $299 | Bill Franklin | CEO |
| Create Website | 8/1/2002 | 10/1/2002 | $50 | Bill Franklin | CEO |
| Business Card Production | 8/1/2002 | 9/10/2002 | $250 | Bill Franklin | CEO |
| Office Renovations | 7/1/2002 | 10/1/2002 | $2,500 | Bill Franklin | CEO |
| Office LAN Connection | 8/1/2002 | 9/10/2002 | $350 | Bill Franklin | CEO |
| Workstation Purchases | 8/15/2002 | 9/1/2002 | $3,500 | Bill Franklin | CEO |
| Legal Groundwork | 7/1/2002 | 7/12/2002 | $1,200 | Bill Franklin | CEO |
| Totals | $9,899 | ||||
Management Summary
CTI’s competitive edge is linked to Bill Franklin’s knowledge and experience in running a small rural business and making it successful. Bill took a small grocery chain located in Baker City, Oregon, and turned it into a regional powerhouse that now has offices in California and Colorado, and stores throughout the West. Bill’s expertise and knowledge of technology is unequaled in the rural communities he offers support to. He is also well respected in more urban communities such as Portland, Oregon. He is chairman of the Mayor’s Art Committee, and spends time putting together a Rose Parade float each year for the Kiwanis Club.
Mr. Franklin’s technology experience comes from his deep knowledge of Internet infrastructure gained through his early work as an engineer at the Stanford Research Institute, his deep abiding love of technology, and the potential for technology to shape the way people work and think.
Mr. Franklin received his MBA from Stanford in 1984, after receiving a Stanford BSEE in 1971.
6.1 Personnel Plan
Personnel will remain at a minimum, due to the low funding expectations, and Bill Franklin’s ability to service his clients without support. Accounting will be outsourced, as will any other necessary activity that threatens to unnecessarily burden Mr. Franklin’s time. In the second year it is expected that Mr. Franklin will need to hire an additional consultant to assist him.
| Personnel Plan | |||
| Year 1 | Year 2 | Year 3 | |
| Intern | $6,000 | $7,000 | $8,000 |
| Bill Franklin | $60,000 | $65,000 | $70,000 |
| Second Consultant | $12,000 | $55,000 | $60,000 |
| Total People | 0 | 0 | 0 |
| Total Payroll | $78,000 | $127,000 | $138,000 |
Financial Plan
Attached is CTI’s financial plan for review.
7.1 Important Assumptions
Below is a short list of some general assumptions:
- The rural economy is growing at 2.5%, much less than the 3-3.5% growth expected for urban areas.
- Due to the nonprofit status, no taxes are required.
- Short-term and long-term interest rates are based on Mr. Franklin’s credit score.
| General Assumptions | |||
| Year 1 | Year 2 | Year 3 | |
| Plan Month | 1 | 2 | 3 |
| Current Interest Rate | 5.00% | 5.00% | 5.00% |
| Long-term Interest Rate | 8.00% | 8.00% | 8.00% |
| Tax Rate | 0.00% | 0.00% | 0.00% |
| Other | 0 | 0 | 0 |
7.2 Break-even Analysis
The break-even numbers demonstrate that we will break-even at well below our minimum established for the retainer. Books and other materials are not included in the break-even analysis due to the lower margins, lower revenue projections for those materials, and the fact that the company will not remain a going concern unless it can attract a minimum number of clients on retainer.

| Break-even Analysis | |
| Monthly Revenue Break-even | $9,352 |
| Assumptions: | |
| Average Percent Variable Cost | 1% |
| Estimated Monthly Fixed Cost | $9,270 |
7.3 Projected Balance Sheet
The attached balance sheet is very straightforward.
| Pro Forma Balance Sheet | |||
| Year 1 | Year 2 | Year 3 | |
| Assets | |||
| Current Assets | |||
| Cash | $83,950 | $176,453 | $299,948 |
| Accounts Receivable | $37,592 | $41,685 | $47,329 |
| Inventory | $854 | $691 | $691 |
| Other Current Assets | $0 | $0 | $0 |
| Total Current Assets | $122,396 | $218,829 | $347,968 |
| Long-term Assets | |||
| Long-term Assets | $30,000 | $40,000 | $40,000 |
| Accumulated Depreciation | $3,600 | $3,600 | $3,600 |
| Total Long-term Assets | $26,400 | $36,400 | $36,400 |
| Total Assets | $148,796 | $255,229 | $384,368 |
| Liabilities and Capital | Year 1 | Year 2 | Year 3 |
| Current Liabilities | |||
| Accounts Payable | $2,678 | $3,114 | $3,357 |
| Current Borrowing | $0 | $0 | $0 |
| Other Current Liabilities | $0 | $0 | $0 |
| Subtotal Current Liabilities | $2,678 | $3,114 | $3,357 |
| Long-term Liabilities | $0 | $0 | $0 |
| Total Liabilities | $2,678 | $3,114 | $3,357 |
| Paid-in Capital | $35,000 | $35,000 | $35,000 |
| Accumulated Surplus/Deficit | ($19,050) | $111,119 | $217,116 |
| Surplus/Deficit | $130,169 | $105,997 | $128,895 |
| Total Capital | $146,119 | $252,116 | $381,011 |
| Total Liabilities and Capital | $148,796 | $255,229 | $384,368 |
| Net Worth | $146,119 | $252,116 | $381,011 |
7.4 Projected Surplus or Deficit
We expect to have a surplus in each of the next three years. Bill Franklin requires only a modest salary, thereby pushing up Net Surplus to a range in which the money may be reinvested into additional technology services and products for clients. This might include workstation upgrades, communication tools, demo hardware, and outsourcing of other essential business functions.


| Surplus and Deficit | |||
| Year 1 | Year 2 | Year 3 | |
| Funding | $244,429 | $271,042 | $307,741 |
| Direct Cost | $2,146 | $2,146 | $2,146 |
| Other Costs of Goods | $0 | $0 | $0 |
| Total Direct Cost | $2,146 | $2,146 | $2,146 |
| Gross Surplus | $242,284 | $268,897 | $305,595 |
| Gross Surplus % | 99.12% | 99.21% | 99.30% |
| Expenses | |||
| Payroll | $78,000 | $127,000 | $138,000 |
| Sales and Marketing and Other Expenses | $3,000 | $3,200 | $3,400 |
| Depreciation | $3,600 | $0 | $0 |
| Rent | $9,600 | $10,000 | $10,700 |
| Utilities | $1,800 | $2,000 | $2,200 |
| Insurance | $1,440 | $1,500 | $1,600 |
| Auto Lease/ Fuel | $6,000 | $6,500 | $7,000 |
| Payroll Taxes | $7,800 | $12,700 | $13,800 |
| Other | $0 | $0 | $0 |
| Total Operating Expenses | $111,240 | $162,900 | $176,700 |
| Surplus Before Interest and Taxes | $131,044 | $105,997 | $128,895 |
| EBITDA | $134,644 | $105,997 | $128,895 |
| Interest Expense | $875 | $0 | $0 |
| Taxes Incurred | $0 | $0 | $0 |
| Net Surplus | $130,169 | $105,997 | $128,895 |
| Net Surplus/Funding | 53.25% | 39.11% | 41.88% |
7.5 Projected Cash Flow
Some short-term borrowing is necessary within the first three months of operations. This is simply borrowed off of the CEO’s credit card balances in order to maintain a positive cash flow balance in the first several months. After month three or four, sales will stabilize and grow fast enough to supply ample cash for CTI.

| Pro Forma Cash Flow | |||
| Year 1 | Year 2 | Year 3 | |
| Cash Received | |||
| Cash from Operations | |||
| Cash Funding | $134,436 | $149,073 | $169,257 |
| Cash from Receivables | $72,401 | $117,876 | $132,839 |
| Subtotal Cash from Operations | $206,838 | $266,949 | $302,097 |
| Additional Cash Received | |||
| Sales Tax, VAT, HST/GST Received | $0 | $0 | $0 |
| New Current Borrowing | $15,000 | $0 | $0 |
| New Other Liabilities (interest-free) | $0 | $0 | $0 |
| New Long-term Liabilities | $0 | $0 | $0 |
| Sales of Other Current Assets | $0 | $0 | $0 |
| Sales of Long-term Assets | $0 | $0 | $0 |
| New Investment Received | $0 | $0 | $0 |
| Subtotal Cash Received | $221,838 | $266,949 | $302,097 |
| Expenditures | Year 1 | Year 2 | Year 3 |
| Expenditures from Operations | |||
| Cash Spending | $78,000 | $127,000 | $138,000 |
| Bill Payments | $30,837 | $37,446 | $40,602 |
| Subtotal Spent on Operations | $108,837 | $164,446 | $178,602 |
| Additional Cash Spent | |||
| Sales Tax, VAT, HST/GST Paid Out | $0 | $0 | $0 |
| Principal Repayment of Current Borrowing | $25,000 | $0 | $0 |
| Other Liabilities Principal Repayment | $0 | $0 | $0 |
| Long-term Liabilities Principal Repayment | $0 | $0 | $0 |
| Purchase Other Current Assets | $0 | $0 | $0 |
| Purchase Long-term Assets | $20,000 | $10,000 | $0 |
| Dividends | $0 | $0 | $0 |
| Subtotal Cash Spent | $153,837 | $174,446 | $178,602 |
| Net Cash Flow | $68,000 | $92,503 | $123,495 |
| Cash Balance | $83,950 | $176,453 | $299,948 |
7.6 Standard Ratios
Net working capital is very healthy, and interest coverage easily argues that by year two CTI could leverage itself with more borrowing if expansion is necessary. See attached table.
| Ratio Analysis | ||||
| Year 1 | Year 2 | Year 3 | Industry Profile | |
| Funding Growth | n.a. | 10.89% | 13.54% | 0.00% |
| Percent of Total Assets | ||||
| Accounts Receivable | 25.26% | 16.33% | 12.31% | 0.00% |
| Inventory | 0.57% | 0.27% | 0.18% | 0.00% |
| Other Current Assets | 0.00% | 0.00% | 0.00% | 100.00% |
| Total Current Assets | 82.26% | 85.74% | 90.53% | 100.00% |
| Long-term Assets | 17.74% | 14.26% | 9.47% | 0.00% |
| Total Assets | 100.00% | 100.00% | 100.00% | 100.00% |
| Current Liabilities | 1.80% | 1.22% | 0.87% | 0.00% |
| Long-term Liabilities | 0.00% | 0.00% | 0.00% | 0.00% |
| Total Liabilities | 1.80% | 1.22% | 0.87% | 0.00% |
| Net Worth | 98.20% | 98.78% | 99.13% | 100.00% |
| Percent of Funding | ||||
| Funding | 100.00% | 100.00% | 100.00% | 100.00% |
| Gross Surplus | 99.12% | 99.21% | 99.30% | 0.00% |
| Selling, General & Administrative Expenses | 46.00% | 60.56% | 57.82% | 0.00% |
| Advertising Expenses | 0.00% | 0.00% | 0.00% | 0.00% |
| Surplus Before Interest and Taxes | 53.61% | 39.11% | 41.88% | 0.00% |
| Main Ratios | ||||
| Current | 45.71 | 70.28 | 103.65 | 0.00 |
| Quick | 45.39 | 70.06 | 103.44 | 0.00 |
| Total Debt to Total Assets | 1.80% | 1.22% | 0.87% | 0.00% |
| Pre-tax Return on Net Worth | 89.08% | 42.04% | 33.83% | 0.00% |
| Pre-tax Return on Assets | 87.48% | 41.53% | 33.53% | 0.00% |
| Additional Ratios | Year 1 | Year 2 | Year 3 | |
| Net Surplus Margin | 53.25% | 39.11% | 41.88% | n.a |
| Return on Equity | 89.08% | 42.04% | 33.83% | n.a |
| Activity Ratios | ||||
| Accounts Receivable Turnover | 2.93 | 2.93 | 2.93 | n.a |
| Collection Days | 54 | 119 | 117 | n.a |
| Inventory Turnover | 3.10 | 2.78 | 3.10 | n.a |
| Accounts Payable Turnover | 12.52 | 12.17 | 12.17 | n.a |
| Payment Days | 27 | 28 | 29 | n.a |
| Total Asset Turnover | 1.64 | 1.06 | 0.80 | n.a |
| Debt Ratios | ||||
| Debt to Net Worth | 0.02 | 0.01 | 0.01 | n.a |
| Current Liab. to Liab. | 1.00 | 1.00 | 1.00 | n.a |
| Liquidity Ratios | ||||
| Net Working Capital | $119,719 | $215,716 | $344,611 | n.a |
| Interest Coverage | 149.76 | 0.00 | 0.00 | n.a |
| Additional Ratios | ||||
| Assets to Funding | 0.61 | 0.94 | 1.25 | n.a |
| Current Debt/Total Assets | 2% | 1% | 1% | n.a |
| Acid Test | 31.35 | 56.67 | 89.35 | n.a |
| Funding/Net Worth | 1.67 | 1.08 | 0.81 | n.a |
| Dividend Payout | 0.00 | 0.00 | 0.00 | n.a |
Appendix
| Funding Forecast | |||||||||||||
| Month 1 | Month 2 | Month 3 | Month 4 | Month 5 | Month 6 | Month 7 | Month 8 | Month 9 | Month 10 | Month 11 | Month 12 | ||
| Funding | |||||||||||||
| Additional Fees | 0% | $270 | $310 | $357 | $410 | $472 | $543 | $624 | $718 | $825 | $949 | $1,091 | $1,255 |
| Retainer | 0% | $995 | $1,243 | $1,554 | $1,943 | $2,428 | $3,035 | $3,794 | $4,743 | $5,928 | $7,410 | $9,263 | $11,579 |
| SBA Loan Gaurantees | 0% | $108 | $135 | $168 | $211 | $263 | $329 | $411 | $514 | $643 | $803 | $1,004 | $1,255 |
| SBA Grant 1% | 0% | $162 | $170 | $179 | $188 | $197 | $207 | $217 | $228 | $240 | $252 | $264 | $278 |
| Other Loan and Grant 1% | 0% | $477 | $548 | $631 | $725 | $834 | $959 | $1,103 | $1,268 | $1,459 | $1,677 | $1,929 | $2,218 |
| Books and Resources | 0% | $250 | $250 | $250 | $250 | $250 | $250 | $250 | $250 | $250 | $250 | $250 | $250 |
| Grants and Donations | 0% | $3,978 | $4,773 | $5,728 | $6,873 | $8,248 | $9,898 | $11,877 | $14,252 | $17,103 | $20,524 | $24,628 | $29,554 |
| Other | 0% | $0 | $0 | $0 | $0 | $0 | $0 | $0 | $0 | $0 | $0 | $0 | $0 |
| Total Funding | $6,239 | $7,430 | $8,867 | $10,600 | $12,692 | $15,221 | $18,277 | $21,973 | $26,447 | $31,865 | $38,430 | $46,389 | |
| Direct Cost of Funding | Month 1 | Month 2 | Month 3 | Month 4 | Month 5 | Month 6 | Month 7 | Month 8 | Month 9 | Month 10 | Month 11 | Month 12 | |
| COGS | $135 | $142 | $149 | $156 | $164 | $172 | $181 | $190 | $199 | $209 | $220 | $231 | |
| Other | $0 | $0 | $0 | $0 | $0 | $0 | $0 | $0 | $0 | $0 | $0 | $0 | |
| Subtotal Cost of Funding | $135 | $142 | $149 | $156 | $164 | $172 | $181 | $190 | $199 | $209 | $220 | $231 | |
| Personnel Plan | |||||||||||||
| Month 1 | Month 2 | Month 3 | Month 4 | Month 5 | Month 6 | Month 7 | Month 8 | Month 9 | Month 10 | Month 11 | Month 12 | ||
| Intern | 0% | $500 | $500 | $500 | $500 | $500 | $500 | $500 | $500 | $500 | $500 | $500 | $500 |
| Bill Franklin | 0% | $5,000 | $5,000 | $5,000 | $5,000 | $5,000 | $5,000 | $5,000 | $5,000 | $5,000 | $5,000 | $5,000 | $5,000 |
| Second Consultant | 0% | $0 | $0 | $0 | $0 | $0 | $0 | $0 | $0 | $0 | $4,000 | $4,000 | $4,000 |
| Total People | 0 | 0 | 0 | 0 | 0 | 0 | 0 | 0 | 0 | 0 | 0 | 0 | |
| Total Payroll | $5,500 | $5,500 | $5,500 | $5,500 | $5,500 | $5,500 | $5,500 | $5,500 | $5,500 | $9,500 | $9,500 | $9,500 | |
| General Assumptions | |||||||||||||
| Month 1 | Month 2 | Month 3 | Month 4 | Month 5 | Month 6 | Month 7 | Month 8 | Month 9 | Month 10 | Month 11 | Month 12 | ||
| Plan Month | 1 | 2 | 3 | 4 | 5 | 6 | 7 | 8 | 9 | 10 | 11 | 12 | |
| Current Interest Rate | 5.00% | 5.00% | 5.00% | 5.00% | 5.00% | 5.00% | 5.00% | 5.00% | 5.00% | 5.00% | 5.00% | 5.00% | |
| Long-term Interest Rate | 8.00% | 8.00% | 8.00% | 8.00% | 8.00% | 8.00% | 8.00% | 8.00% | 8.00% | 8.00% | 8.00% | 8.00% | |
| Tax Rate | 0.00% | 0.00% | 0.00% | 0.00% | 0.00% | 0.00% | 0.00% | 0.00% | 0.00% | 0.00% | 0.00% | 0.00% | |
| Other | 0 | 0 | 0 | 0 | 0 | 0 | 0 | 0 | 0 | 0 | 0 | 0 | |
| Surplus and Deficit | |||||||||||||
| Month 1 | Month 2 | Month 3 | Month 4 | Month 5 | Month 6 | Month 7 | Month 8 | Month 9 | Month 10 | Month 11 | Month 12 | ||
| Funding | $6,239 | $7,430 | $8,867 | $10,600 | $12,692 | $15,221 | $18,277 | $21,973 | $26,447 | $31,865 | $38,430 | $46,389 | |
| Direct Cost | $135 | $142 | $149 | $156 | $164 | $172 | $181 | $190 | $199 | $209 | $220 | $231 | |
| Other Costs of Goods | $0 | $0 | $0 | $0 | $0 | $0 | $0 | $0 | $0 | $0 | $0 | $0 | |
| Total Direct Cost | $135 | $142 | $149 | $156 | $164 | $172 | $181 | $190 | $199 | $209 | $220 | $231 | |
| Gross Surplus | $6,104 | $7,289 | $8,718 | $10,444 | $12,529 | $15,049 | $18,096 | $21,784 | $26,248 | $31,656 | $38,210 | $46,158 | |
| Gross Surplus % | 97.84% | 98.10% | 98.32% | 98.53% | 98.71% | 98.87% | 99.01% | 99.14% | 99.25% | 99.34% | 99.43% | 99.50% | |
| Expenses | |||||||||||||
| Payroll | $5,500 | $5,500 | $5,500 | $5,500 | $5,500 | $5,500 | $5,500 | $5,500 | $5,500 | $9,500 | $9,500 | $9,500 | |
| Sales and Marketing and Other Expenses | $250 | $250 | $250 | $250 | $250 | $250 | $250 | $250 | $250 | $250 | $250 | $250 | |
| Depreciation | $300 | $300 | $300 | $300 | $300 | $300 | $300 | $300 | $300 | $300 | $300 | $300 | |
| Rent | $800 | $800 | $800 | $800 | $800 | $800 | $800 | $800 | $800 | $800 | $800 | $800 | |
| Utilities | $150 | $150 | $150 | $150 | $150 | $150 | $150 | $150 | $150 | $150 | $150 | $150 | |
| Insurance | $120 | $120 | $120 | $120 | $120 | $120 | $120 | $120 | $120 | $120 | $120 | $120 | |
| Auto Lease/ Fuel | $500 | $500 | $500 | $500 | $500 | $500 | $500 | $500 | $500 | $500 | $500 | $500 | |
| Payroll Taxes | 10% | $550 | $550 | $550 | $550 | $550 | $550 | $550 | $550 | $550 | $950 | $950 | $950 |
| Other | $0 | $0 | $0 | $0 | $0 | $0 | $0 | $0 | $0 | $0 | $0 | $0 | |
| Total Operating Expenses | $8,170 | $8,170 | $8,170 | $8,170 | $8,170 | $8,170 | $8,170 | $8,170 | $8,170 | $12,570 | $12,570 | $12,570 | |
| Surplus Before Interest and Taxes | ($2,066) | ($881) | $548 | $2,274 | $4,359 | $6,879 | $9,926 | $13,614 | $18,078 | $19,086 | $25,640 | $33,588 | |
| EBITDA | ($1,766) | ($581) | $848 | $2,574 | $4,659 | $7,179 | $10,226 | $13,914 | $18,378 | $19,386 | $25,940 | $33,888 | |
| Interest Expense | $63 | $83 | $104 | $104 | $104 | $104 | $104 | $83 | $63 | $42 | $21 | $0 | |
| Taxes Incurred | $0 | $0 | $0 | $0 | $0 | $0 | $0 | $0 | $0 | $0 | $0 | $0 | |
| Net Surplus | ($2,128) | ($965) | $444 | $2,170 | $4,254 | $6,774 | $9,822 | $13,530 | $18,016 | $19,044 | $25,619 | $33,588 | |
| Net Surplus/Funding | -34.12% | -12.98% | 5.00% | 20.47% | 33.52% | 44.51% | 53.74% | 61.58% | 68.12% | 59.77% | 66.67% | 72.41% | |
| Pro Forma Cash Flow | |||||||||||||
| Month 1 | Month 2 | Month 3 | Month 4 | Month 5 | Month 6 | Month 7 | Month 8 | Month 9 | Month 10 | Month 11 | Month 12 | ||
| Cash Received | |||||||||||||
| Cash from Operations | |||||||||||||
| Cash Funding | $3,431 | $4,087 | $4,877 | $5,830 | $6,981 | $8,371 | $10,052 | $12,085 | $14,546 | $17,526 | $21,136 | $25,514 | |
| Cash from Receivables | $0 | $94 | $2,825 | $3,365 | $4,016 | $4,801 | $5,750 | $6,895 | $8,280 | $9,955 | $11,983 | $14,438 | |
| Subtotal Cash from Operations | $3,431 | $4,180 | $7,702 | $9,195 | $10,997 | $13,173 | $15,802 | $18,980 | $22,826 | $27,481 | $33,119 | $39,952 | |
| Additional Cash Received | |||||||||||||
| Sales Tax, VAT, HST/GST Received | 0.00% | $0 | $0 | $0 | $0 | $0 | $0 | $0 | $0 | $0 | $0 | $0 | $0 |
| New Current Borrowing | $5,000 | $5,000 | $5,000 | $0 | $0 | $0 | $0 | $0 | $0 | $0 | $0 | $0 | |
| New Other Liabilities (interest-free) | $0 | $0 | $0 | $0 | $0 | $0 | $0 | $0 | $0 | $0 | $0 | $0 | |
| New Long-term Liabilities | $0 | $0 | $0 | $0 | $0 | $0 | $0 | $0 | $0 | $0 | $0 | $0 | |
| Sales of Other Current Assets | $0 | $0 | $0 | $0 | $0 | $0 | $0 | $0 | $0 | $0 | $0 | $0 | |
| Sales of Long-term Assets | $0 | $0 | $0 | $0 | $0 | $0 | $0 | $0 | $0 | $0 | $0 | $0 | |
| New Investment Received | $0 | $0 | $0 | $0 | $0 | $0 | $0 | $0 | $0 | $0 | $0 | $0 | |
| Subtotal Cash Received | $8,431 | $9,180 | $12,702 | $9,195 | $10,997 | $13,173 | $15,802 | $18,980 | $22,826 | $27,481 | $33,119 | $39,952 | |
| Expenditures | Month 1 | Month 2 | Month 3 | Month 4 | Month 5 | Month 6 | Month 7 | Month 8 | Month 9 | Month 10 | Month 11 | Month 12 | |
| Expenditures from Operations | |||||||||||||
| Cash Spending | $5,500 | $5,500 | $5,500 | $5,500 | $5,500 | $5,500 | $5,500 | $5,500 | $5,500 | $9,500 | $9,500 | $9,500 | |
| Bill Payments | $114 | $3,400 | $2,454 | $2,474 | $2,474 | $2,508 | $3,441 | $2,473 | $2,453 | $2,445 | $2,844 | $3,757 | |
| Subtotal Spent on Operations | $5,614 | $8,900 | $7,954 | $7,974 | $7,974 | $8,008 | $8,941 | $7,973 | $7,953 | $11,945 | $12,344 | $13,257 | |
| Additional Cash Spent | |||||||||||||
| Sales Tax, VAT, HST/GST Paid Out | $0 | $0 | $0 | $0 | $0 | $0 | $0 | $0 | $0 | $0 | $0 | $0 | |
| Principal Repayment of Current Borrowing | $0 | $0 | $0 | $0 | $0 | $0 | $0 | $5,000 | $5,000 | $5,000 | $5,000 | $5,000 | |
| Other Liabilities Principal Repayment | $0 | $0 | $0 | $0 | $0 | $0 | $0 | $0 | $0 | $0 | $0 | $0 | |
| Long-term Liabilities Principal Repayment | $0 | $0 | $0 | $0 | $0 | $0 | $0 | $0 | $0 | $0 | $0 | $0 | |
| Purchase Other Current Assets | $0 | $0 | $0 | $0 | $0 | $0 | $0 | $0 | $0 | $0 | $0 | $0 | |
| Purchase Long-term Assets | $0 | $0 | $0 | $0 | $10,000 | $0 | $0 | $0 | $0 | $0 | $0 | $10,000 | |
| Dividends | $0 | $0 | $0 | $0 | $0 | $0 | $0 | $0 | $0 | $0 | $0 | $0 | |
| Subtotal Cash Spent | $5,614 | $8,900 | $7,954 | $7,974 | $17,974 | $8,008 | $8,941 | $12,973 | $12,953 | $16,945 | $17,344 | $28,257 | |
| Net Cash Flow | $2,817 | $280 | $4,748 | $1,221 | ($6,977) | $5,165 | $6,861 | $6,007 | $9,873 | $10,536 | $15,775 | $11,695 | |
| Cash Balance | $18,767 | $19,047 | $23,795 | $25,016 | $18,039 | $23,204 | $30,065 | $36,072 | $45,945 | $56,481 | $72,256 | $83,950 | |
| Pro Forma Balance Sheet | |||||||||||||
| Month 1 | Month 2 | Month 3 | Month 4 | Month 5 | Month 6 | Month 7 | Month 8 | Month 9 | Month 10 | Month 11 | Month 12 | ||
| Assets | Starting Balances | ||||||||||||
| Current Assets | |||||||||||||
| Cash | $15,950 | $18,767 | $19,047 | $23,795 | $25,016 | $18,039 | $23,204 | $30,065 | $36,072 | $45,945 | $56,481 | $72,256 | $83,950 |
| Accounts Receivable | $0 | $2,807 | $6,057 | $7,222 | $8,627 | $10,322 | $12,370 | $14,845 | $17,838 | $21,460 | $25,844 | $31,155 | $37,592 |
| Inventory | $0 | $865 | $724 | $575 | $419 | $255 | $1,083 | $902 | $713 | $514 | $305 | $1,085 | $854 |
| Other Current Assets | $0 | $0 | $0 | $0 | $0 | $0 | $0 | $0 | $0 | $0 | $0 | $0 | $0 |
| Total Current Assets | $15,950 | $22,440 | $25,828 | $31,592 | $34,062 | $28,616 | $36,657 | $45,812 | $54,623 | $67,918 | $82,629 | $104,495 | $122,396 |
| Long-term Assets | |||||||||||||
| Long-term Assets | $10,000 | $10,000 | $10,000 | $10,000 | $10,000 | $20,000 | $20,000 | $20,000 | $20,000 | $20,000 | $20,000 | $20,000 | $30,000 |
| Accumulated Depreciation | $0 | $300 | $600 | $900 | $1,200 | $1,500 | $1,800 | $2,100 | $2,400 | $2,700 | $3,000 | $3,300 | $3,600 |
| Total Long-term Assets | $10,000 | $9,700 | $9,400 | $9,100 | $8,800 | $18,500 | $18,200 | $17,900 | $17,600 | $17,300 | $17,000 | $16,700 | $26,400 |
| Total Assets | $25,950 | $32,140 | $35,228 | $40,692 | $42,862 | $47,116 | $54,857 | $63,712 | $72,223 | $85,218 | $99,629 | $121,195 | $148,796 |
| Liabilities and Capital | Month 1 | Month 2 | Month 3 | Month 4 | Month 5 | Month 6 | Month 7 | Month 8 | Month 9 | Month 10 | Month 11 | Month 12 | |
| Current Liabilities | |||||||||||||
| Accounts Payable | $0 | $3,318 | $2,372 | $2,392 | $2,392 | $2,392 | $3,358 | $2,392 | $2,372 | $2,351 | $2,718 | $3,664 | $2,678 |
| Current Borrowing | $10,000 | $15,000 | $20,000 | $25,000 | $25,000 | $25,000 | $25,000 | $25,000 | $20,000 | $15,000 | $10,000 | $5,000 | $0 |
| Other Current Liabilities | $0 | $0 | $0 | $0 | $0 | $0 | $0 | $0 | $0 | $0 | $0 | $0 | $0 |
| Subtotal Current Liabilities | $10,000 | $18,318 | $22,372 | $27,392 | $27,392 | $27,392 | $28,358 | $27,392 | $22,372 | $17,351 | $12,718 | $8,664 | $2,678 |
| Long-term Liabilities | $0 | $0 | $0 | $0 | $0 | $0 | $0 | $0 | $0 | $0 | $0 | $0 | $0 |
| Total Liabilities | $10,000 | $18,318 | $22,372 | $27,392 | $27,392 | $27,392 | $28,358 | $27,392 | $22,372 | $17,351 | $12,718 | $8,664 | $2,678 |
| Paid-in Capital | $35,000 | $35,000 | $35,000 | $35,000 | $35,000 | $35,000 | $35,000 | $35,000 | $35,000 | $35,000 | $35,000 | $35,000 | $35,000 |
| Accumulated Surplus/Deficit | ($19,050) | ($19,050) | ($19,050) | ($19,050) | ($19,050) | ($19,050) | ($19,050) | ($19,050) | ($19,050) | ($19,050) | ($19,050) | ($19,050) | ($19,050) |
| Surplus/Deficit | $0 | ($2,128) | ($3,093) | ($2,649) | ($480) | $3,774 | $10,549 | $20,371 | $33,901 | $51,917 | $70,961 | $96,581 | $130,169 |
| Total Capital | $15,950 | $13,822 | $12,857 | $13,301 | $15,470 | $19,724 | $26,499 | $36,321 | $49,851 | $67,867 | $86,911 | $112,531 | $146,119 |
| Total Liabilities and Capital | $25,950 | $32,140 | $35,228 | $40,692 | $42,862 | $47,116 | $54,857 | $63,712 | $72,223 | $85,218 | $99,629 | $121,195 | $148,796 |
| Net Worth | $15,950 | $13,822 | $12,857 | $13,301 | $15,470 | $19,724 | $26,499 | $36,321 | $49,851 | $67,867 | $86,911 | $112,531 | $146,119 |

