
Teacherafterschooljobs.com
Executive Summary
Teacherafterschooljobs.com is a new job search website that is designed to provide teachers with part-time or seasonal employment, supplementing their current income. The site will be effective in matching educated, mature, responsible educators with employers in need of their part-time or summer assistance. While the revenue will come from the employer listing fees, Teacherafterschooljobs.com will have two general customers, the employers as well as the employees in search of the jobs. In addition to having a robust job board on their site, Teacherafterschooljobs.com will also offer tools for the educators, often consisting of a large list of useful hyperlinks. This feature provides additionally functionality to the site encouraging more traffic which is valuable to the employers that post jobs.
The Market
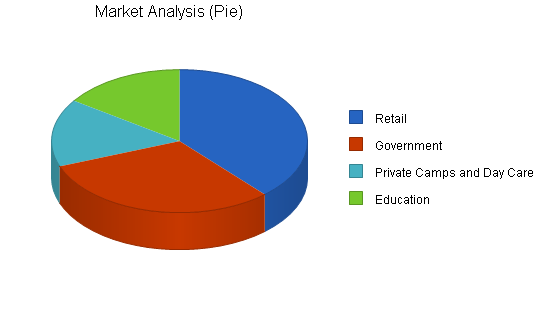
It is well known that educators are very dedicated professionals who work at below market wages. For a multitude of reasons, teachers are paid poorly in America. With this in mind, there are a high percentage of teachers that are looking for supplemental income, indicating a bountiful market. As mentioned previously, Teacherafterschooljobs.com will be receiving revenue from the employer listing fees. Four distinct market segments will be targeted. The first is retail which has an annual growth rate of 50%. Teacherafterschooljobs.com believes there to be 50 potential customers in this segment. The next group is government with also a 50% growth rate and 40 possible customers. Private daycare and camps is also a target with a 25% growth rate and 20 possible customers. The last segment targeted will be education with a 10% growth rate and 20 customers.
Competitive Edge
Teacherafterschooljobs.com has a unique pool of prospective employees, all of the employees are professional educators who have skill sets centered on education, professionalism, and the passion and dedication commonly associated with teachers. This offers a significant distinction relative to the many other online job boards such as Monster and Hotjobs since they have very disparate cross sections of job seekers. Having a strong pool of prospective employees will make it much easier to attract employers who want to post their jobs.
Management
Teacherafterschooljobs.com will be developed and run by Patrice and Rosario Cibella. Both Patrice and Rosario have been in the education industry for more than a decade. While they both were passionate teachers for many years, they recognized the huge potential of an online job board that provides part time and seasonal opportunities for educators. Patrice worked as an eleventh grade teacher for twelve years at a local district. The last four years of her tenure were as the social studies department head. As the department chairperson, Patrice strengthened her managerial and strategic focus skills as she guided the department to be recognized as one of the finest in the state. Rosario also has a background in education, however his was also mixed with administrative role as the vice principal of his school for six years. As vice principal Rosario was directly responsible for the operation of the school. This experience will be directly applied in leading Teacherafterschooljobs.com to become the premier specialized online job board.
Teacherafterschooljobs.com is poised for success by combining a solid business model with a huge market potential and a solid management team. The venture will be profitable from month one with modest gross margins for year one, increasing slightly by year three. Teacherafterschooljobs.com is forecasted to achieve a minimal gross profit by the end of year three.

1.1 Objectives
The main objectives for the company are as follows:
- Attract a minimum of 100 employers subscribing for a year of job listings.
- Attract related links to provide educators with additional reasons to access the site.
- Use the increased traffic to attract additional employers to finance expansion of the Web page offerings.
1.2 Mission
Teacherafterschooljobs.com seeks to provide a concise and reliable site for employers and teachers to fulfill mutual needs. Employers are seeking reliable employees to fill a specific need for part-time and seasonal employees. Teachers, being traditionally underpaid professionals require supplemental income in order to continue their chosen profession. The company seeks to provide a much needed resource to maintain quality educators, while at the same time increasing the profitability of retailers and service providers by reducing their turnover rates.
Company Summary
Teacherafterschooljobs.com is a new venture providing a website matching teachers seeking part-time and seasonal employment with a variety of employers seeking educated, responsible, and reliable employees to fill these vacancies. It will focus on providing a pool of employees to a pool of employers both seeking a specific niche market. As the pool of employers grows, the website can expand nationally and provide additional links to educational tools for teachers, thus increasing traffic and the appeal of the website.
2.1 Company Ownership
Teacherafterschooljobs.com will be incorporated. The shareholders will be Patrice and Rosario Cibella. Patrice and Rosario Cibella will be the principle owners and operators. As of this writing, the company has not been incorporated.
2.2 Start-up Summary
Our start-up costs are primarily Web page design, programming, and hosting charges. The start-up costs will be provided by direct owner investment. The details and assumptions are shown in the following chart and tables.

| Start-up | |
| Requirements | |
| Start-up Expenses | |
| Legal | $1,000 |
| Stationery etc. | $50 |
| Brochures | $1,000 |
| Consultants | $2,700 |
| Insurance | $500 |
| Research and Development | $1,000 |
| Domain Name Registration | $70 |
| Web Hosting | $360 |
| Other | $0 |
| Total Start-up Expenses | $6,680 |
| Start-up Assets | |
| Cash Required | $0 |
| Other Current Assets | $0 |
| Long-term Assets | $0 |
| Total Assets | $0 |
| Total Requirements | $6,680 |
| Start-up Funding | |
| Start-up Expenses to Fund | $6,680 |
| Start-up Assets to Fund | $0 |
| Total Funding Required | $6,680 |
| Assets | |
| Non-cash Assets from Start-up | $0 |
| Cash Requirements from Start-up | $0 |
| Additional Cash Raised | $0 |
| Cash Balance on Starting Date | $0 |
| Total Assets | $0 |
| Liabilities and Capital | |
| Liabilities | |
| Current Borrowing | $0 |
| Long-term Liabilities | $0 |
| Accounts Payable (Outstanding Bills) | $0 |
| Other Current Liabilities (interest-free) | $0 |
| Total Liabilities | $0 |
| Capital | |
| Planned Investment | |
| Investor 1 | $6,680 |
| Investor 2 | $0 |
| Other | $0 |
| Additional Investment Requirement | $0 |
| Total Planned Investment | $6,680 |
| Loss at Start-up (Start-up Expenses) | ($6,680) |
| Total Capital | $0 |
| Total Capital and Liabilities | $0 |
| Total Funding | $6,680 |
Services
Teacherafterschooljobs.com provides a unique site to match the part-time and seasonal job needs of teachers with employers searching for professional, reliable, and educated employees, thereby reducing turnover and its associated costs.
Market Analysis Summary
Teacherafterschooljobs.com will focus on educational institutions to provide the pool of potential employees. Schools employing teachers, as well as educational institutions training teachers, will be prime marketing targets. Given the fact that educational institutions are faced with the challenge of maintaining a quality faculty within limited salary constraints, it is extremely advantageous for them to provide a quality opportunity for teachers to supplement their income.
Our focus group to provide the income for the company will be employers who seek part-time and seasonal employees. In our current economy, nearly all employers have the need for these positions. The costs of continually hiring these employees for each need is significant. Our company will provide a unique pool of educated, stable, and professional employees. Retail establishments, food service, summer camps, park districts, and day care centers are just a few of the employers who require employees with the professional background, demeanor and, most importantly, the work schedule of teachers. The joining of these two groups provides significant benefits and savings to both groups.
4.1 Market Segmentation
Our target market is broken down into the following categories:
- Schools of all levels to provide the pool of employees.
- College Education majors to provide additional employees with the same profile.
- Retail establishments such as department and grocery stores.
- Park districts, which provide summer programs for the same children taught by our prospective employees.
- Summer camps providing programs similar to the Park Districts.

| Market Analysis | |||||||
| Year 1 | Year 2 | Year 3 | Year 4 | Year 5 | |||
| Potential Customers | Growth | CAGR | |||||
| Retail | 50% | 50 | 75 | 113 | 170 | 255 | 50.28% |
| Government | 50% | 40 | 60 | 90 | 135 | 203 | 50.09% |
| Private Camps and Day Care | 25% | 20 | 25 | 31 | 39 | 49 | 25.11% |
| Education | 10% | 20 | 22 | 24 | 26 | 29 | 9.73% |
| Total | 42.50% | 130 | 182 | 258 | 370 | 536 | 42.50% |
4.2 Target Market Segment Strategy
Focusing on these groups places the two pieces of the puzzle squarely in-line with one another. There are a number of job search sites out there. Many of these are too extensive for the needs of our focus group; our specific marketing targets fit the profile and purpose ultimately sought by our company and the employees and employers themselves. Our marketing will be focused on a concise brochure, detailing the advantages and strategy of our company and will be delivered (as much as possible) by personal contact and interview. This approach will stress both the professional and personal nature of the company.
4.3 Service Business Analysis
The significant number of job search companies forces us to focus on the unique and specialized groups we are seeking to join. Fortunately, the purpose and focus of the company is exactly the service we seek to provide.
4.3.1 Competition and Buying Patterns
The most important factor for the employer will be the reduction in advertising costs by reducing the turnover, therefore increasing the reliability and professionalism of its workforce. By providing the pool of employees we intend to target, the cost of our services will be relatively inexpensive for employers.
Passing the cost to the employers allows us to provide a cost-free service to the pool of employees, thus increasing traffic on the site.
Strategy and Implementation Summary
Teacherafterschooljobs.com will initially focus on the local market. The local market includes many national retailers leading to an easy transition to a national market. Targeting school districts also begins in the local market but lends itself to quick national expansion.
5.1 Competitive Edge
Our unique pool of employees gives us a significant advantage over the larger job search firms concentrating on different careers. Our links and appeal to teachers also gives us the ability to market related links for increased traffic. Concentrating on the professionalism, education, and dedication of teachers is essential in distinguishing our pool of employees from the general population, thus increasing the hiring appeal for our employers.
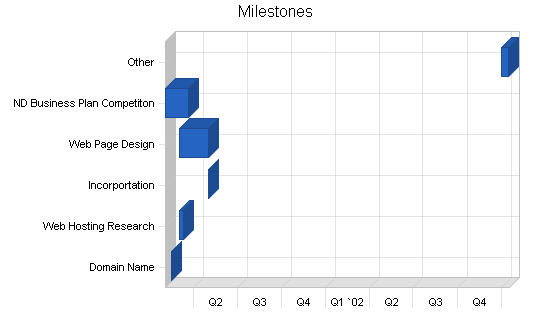
5.2 Milestones
The following table lists the important milestones we have set and achieved, and the allocation of our budget for the same. Careful planning and follow-up are essential to our plan. Monthly follow-ups will be essential to the implementation and success of our business.
| Milestones | |||||
| Milestone | Start Date | End Date | Budget | Manager | Department |
| Domain Name | 2/13/2001 | 2/13/2001 | $70 | RC | Owner |
| Web Hosting Research | 3/1/2001 | 3/10/2001 | $0 | RC | Owner |
| Incorportation | 5/1/2001 | 5/1/2001 | $125 | RC | Owner |
| Web Page Design | 3/1/2001 | 4/30/2001 | $1,400 | ZC | Webmaster |
| ND Business Plan Competiton | 2/1/2001 | 3/19/2001 | $50 | RC,PC,ZC | Owner |
| Other | 1/1/2003 | 1/15/2003 | $0 | ABC | Department |
| Totals | $1,645 | ||||
5.3 Sales Strategy
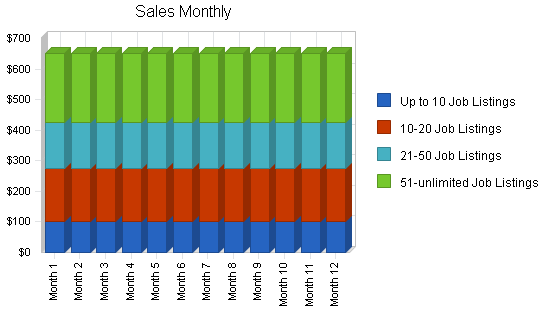
Our sales will depend on the repeat business derived from providing quality permanent, part-time, and seasonal employees. Our sales must be focused on annual contracts paid in advance. We will offer plans based on a monthly charge for job listings. A fee of $20/mo for up to 10 job listings, $35/mo for 11-20 listings, $50/mo for 21-50 listings, and $75/mo for unlimited listings. All of the sales should be attempted in person with the employer, and closed and paid on an annual basis. Follow-up of the success of the listings and contacts should be made quarterly.
5.3.1 Sales Forecast
The following chart and table show our forecasted sales. We would hope to obtain at least 60 employers at the $20/month level, 60 employers at the $35/month level, 36 employers at the $50/month level, and 36 employers at the $75/month level in the first year. We expect the number of employers to increase at the rate of 15-20% each year, with the growth of the higher-priced subscribers to increase by the end of year two with the national appeal of the local national employers. Costs should then be reduced by the end of year two with the purchase of our own server to allow captive hosting of our own website.

| Sales Forecast | |||
| Year 1 | Year 2 | Year 3 | |
| Unit Sales | |||
| Up to 10 Job Listings | 60 | 90 | 120 |
| 10-20 Job Listings | 60 | 90 | 120 |
| 21-50 Job Listings | 36 | 54 | 71 |
| 51-unlimited Job Listings | 36 | 54 | 71 |
| Total Unit Sales | 192 | 288 | 382 |
| Unit Prices | Year 1 | Year 2 | Year 3 |
| Up to 10 Job Listings | $20.00 | $30.00 | $40.00 |
| 10-20 Job Listings | $35.00 | $45.00 | $55.00 |
| 21-50 Job Listings | $50.00 | $60.00 | $70.00 |
| 51-unlimited Job Listings | $75.00 | $85.00 | $95.00 |
| Sales | |||
| Up to 10 Job Listings | $1,200 | $2,700 | $4,800 |
| 10-20 Job Listings | $2,100 | $4,050 | $6,600 |
| 21-50 Job Listings | $1,800 | $3,240 | $4,970 |
| 51-unlimited Job Listings | $2,700 | $4,590 | $6,745 |
| Total Sales | $7,800 | $14,580 | $23,115 |
| Direct Unit Costs | Year 1 | Year 2 | Year 3 |
| Up to 10 Job Listings | $6.00 | $9.00 | $12.00 |
| 10-20 Job Listings | $10.50 | $13.50 | $16.50 |
| 21-50 Job Listings | $20.00 | $18.00 | $28.00 |
| 51-unlimited Job Listings | $30.00 | $34.00 | $38.00 |
| Direct Cost of Sales | |||
| Up to 10 Job Listings | $360 | $810 | $1,440 |
| 10-20 Job Listings | $630 | $1,215 | $1,980 |
| 21-50 Job Listings | $720 | $972 | $1,988 |
| 51-unlimited Job Listings | $1,080 | $1,836 | $2,698 |
| Subtotal Direct Cost of Sales | $2,790 | $4,833 | $8,106 |
Management Summary
The initial owners will be the operators and managers. We will receive extensive technical and webmaster assistance from our son Zachary, as well as support and input from our other family members. The company hired to perform Web hosting duties will also provide technical support. As the business expands, additional sales and marketing personnel will be added.
6.1 Personnel Plan
The attached table summarizes our personnel expenditures for the first three years. Since the company is a closely-held family corporation, the compensation is closely tied to the profitability of the company.
| Personnel Plan | |||
| Year 1 | Year 2 | Year 3 | |
| Payroll | $2,400 | $3,000 | $4,000 |
| Other | $0 | $0 | $0 |
| Total People | 1 | 1 | 1 |
| Total Payroll | $2,400 | $3,000 | $4,000 |
Financial Plan
We will finance growth through the cash flow produced in the business. This strategy may force slow growth, however, establishing a stable and extensive network will take time and is the key to the success of the company.
Our sales based on a yearly contract with payment in advance would be the key to our cash flow and growth. We realize that we may have to be flexible in accepting less than one year of payment, but feel if we can get a minimum of three-month commitments from each employer, we will meet cash flow needs.
7.1 Important Assumptions
The financial plan depends on important assumptions, most of which are shown in the following table as annual assumptions. We recognize the collection of accounts receivable is critical, but one over which we have little control.
| General Assumptions | |||
| Year 1 | Year 2 | Year 3 | |
| Plan Month | 1 | 2 | 3 |
| Current Interest Rate | 10.00% | 10.00% | 10.00% |
| Long-term Interest Rate | 10.00% | 10.00% | 10.00% |
| Tax Rate | 25.42% | 25.00% | 25.42% |
| Other | 0 | 0 | 0 |
7.2 Break-even Analysis
The following chart and table summarize our break-even point. Since the cost per unit is a commission being paid to the sales persons who will initially be the owners, we are operating at the minimum, with the bulk of our costs being the compensation of the owners. We are using 25% of revenue, which is high based on the above information.

| Break-even Analysis | |
| Monthly Units Break-even | 8 |
| Monthly Revenue Break-even | $311 |
| Assumptions: | |
| Average Per-Unit Revenue | $40.63 |
| Average Per-Unit Variable Cost | $14.53 |
| Estimated Monthly Fixed Cost | $200 |
7.3 Projected Profit and Loss
Our profit and loss is shown in the following table. Our sales figures are conservative due to our start-up nature and specific target audience. We still project a small profit the first year while nearly doubling profit in each of the following years. These figures do not take into account the substantial possible profit center of Web advertising revenue from educational tool and resource suppliers, as well as linking with these same suppliers. We expect traffic to be significant enough to begin addressing this large profit center midway through year two and throughout all of three.


| Pro Forma Profit and Loss | |||
| Year 1 | Year 2 | Year 3 | |
| Sales | $7,800 | $14,580 | $23,115 |
| Direct Cost of Sales | $2,790 | $4,833 | $8,106 |
| Other | $0 | $0 | $0 |
| Total Cost of Sales | $2,790 | $4,833 | $8,106 |
| Gross Margin | $5,010 | $9,747 | $15,009 |
| Gross Margin % | 64.23% | 66.85% | 64.93% |
| Expenses | |||
| Payroll | $2,400 | $3,000 | $4,000 |
| Sales and Marketing and Other Expenses | $0 | $0 | $0 |
| Depreciation | $0 | $0 | $0 |
| Leased Equipment | $0 | $0 | $0 |
| Utilities | $0 | $0 | $0 |
| Insurance | $0 | $0 | $0 |
| Rent | $0 | $0 | $0 |
| Payroll Taxes | $0 | $0 | $0 |
| Other | $0 | $0 | $0 |
| Total Operating Expenses | $2,400 | $3,000 | $4,000 |
| Profit Before Interest and Taxes | $2,610 | $6,747 | $11,009 |
| EBITDA | $2,610 | $6,747 | $11,009 |
| Interest Expense | $0 | $0 | $0 |
| Taxes Incurred | $663 | $1,687 | $2,798 |
| Net Profit | $1,947 | $5,060 | $8,211 |
| Net Profit/Sales | 24.96% | 34.71% | 35.52% |
7.4 Projected Cash Flow
Due to our fixed Web hosting costs and the owners being the only employees, our cash flow in the following table remains positive throughout the year. The improvement in the cash flow as the subsequent years progress will allow for the continual updating and maintenance of the site to keep it fresh and viable. The low fixed cost of adding pages (flat fee of approximately $130/page) should be covered by our positive cash flow, thus allowing continuing expansion as necessary.

| Pro Forma Cash Flow | |||
| Year 1 | Year 2 | Year 3 | |
| Cash Received | |||
| Cash from Operations | |||
| Cash Sales | $7,800 | $14,580 | $23,115 |
| Subtotal Cash from Operations | $7,800 | $14,580 | $23,115 |
| Additional Cash Received | |||
| Sales Tax, VAT, HST/GST Received | $0 | $0 | $0 |
| New Current Borrowing | $0 | $0 | $0 |
| New Other Liabilities (interest-free) | $0 | $0 | $0 |
| New Long-term Liabilities | $0 | $0 | $0 |
| Sales of Other Current Assets | $0 | $0 | $0 |
| Sales of Long-term Assets | $0 | $0 | $0 |
| New Investment Received | $0 | $0 | $0 |
| Subtotal Cash Received | $7,800 | $14,580 | $23,115 |
| Expenditures | Year 1 | Year 2 | Year 3 |
| Expenditures from Operations | |||
| Cash Spending | $2,400 | $3,000 | $4,000 |
| Bill Payments | $3,176 | $6,261 | $10,544 |
| Subtotal Spent on Operations | $5,576 | $9,261 | $14,544 |
| Additional Cash Spent | |||
| Sales Tax, VAT, HST/GST Paid Out | $0 | $0 | $0 |
| Principal Repayment of Current Borrowing | $0 | $0 | $0 |
| Other Liabilities Principal Repayment | $0 | $0 | $0 |
| Long-term Liabilities Principal Repayment | $0 | $0 | $0 |
| Purchase Other Current Assets | $0 | $0 | $0 |
| Purchase Long-term Assets | $0 | $0 | $0 |
| Dividends | $0 | $0 | $0 |
| Subtotal Cash Spent | $5,576 | $9,261 | $14,544 |
| Net Cash Flow | $2,224 | $5,319 | $8,571 |
| Cash Balance | $2,224 | $7,543 | $16,114 |
7.5 Projected Balance Sheet
The balance sheet in the following table shows a small but continued growth of net worth in just three years, presenting a healthy financial picture. This growth in net worth will also be supplemented significantly with the possibility of Web page advertising and related links income that is not yet projected or contained in the figures.
| Pro Forma Balance Sheet | |||
| Year 1 | Year 2 | Year 3 | |
| Assets | |||
| Current Assets | |||
| Cash | $2,224 | $7,543 | $16,114 |
| Other Current Assets | $0 | $0 | $0 |
| Total Current Assets | $2,224 | $7,543 | $16,114 |
| Long-term Assets | |||
| Long-term Assets | $0 | $0 | $0 |
| Accumulated Depreciation | $0 | $0 | $0 |
| Total Long-term Assets | $0 | $0 | $0 |
| Total Assets | $2,224 | $7,543 | $16,114 |
| Liabilities and Capital | Year 1 | Year 2 | Year 3 |
| Current Liabilities | |||
| Accounts Payable | $277 | $536 | $896 |
| Current Borrowing | $0 | $0 | $0 |
| Other Current Liabilities | $0 | $0 | $0 |
| Subtotal Current Liabilities | $277 | $536 | $896 |
| Long-term Liabilities | $0 | $0 | $0 |
| Total Liabilities | $277 | $536 | $896 |
| Paid-in Capital | $6,680 | $6,680 | $6,680 |
| Retained Earnings | ($6,680) | ($4,733) | $327 |
| Earnings | $1,947 | $5,060 | $8,211 |
| Total Capital | $1,947 | $7,007 | $15,218 |
| Total Liabilities and Capital | $2,224 | $7,543 | $16,114 |
| Net Worth | $1,947 | $7,007 | $15,218 |
7.6 Business Ratios
The following table contains important business ratios from the education services industry, as determined by the Standard Industry Classification (SIC) Index, 8299.
| Ratio Analysis | ||||
| Year 1 | Year 2 | Year 3 | Industry Profile | |
| Sales Growth | 0.00% | 86.92% | 58.54% | 9.00% |
| Percent of Total Assets | ||||
| Other Current Assets | 0.00% | 0.00% | 0.00% | 43.90% |
| Total Current Assets | 100.00% | 100.00% | 100.00% | 73.60% |
| Long-term Assets | 0.00% | 0.00% | 0.00% | 26.40% |
| Total Assets | 100.00% | 100.00% | 100.00% | 100.00% |
| Current Liabilities | 12.47% | 7.10% | 5.56% | 43.90% |
| Long-term Liabilities | 0.00% | 0.00% | 0.00% | 21.40% |
| Total Liabilities | 12.47% | 7.10% | 5.56% | 65.30% |
| Net Worth | 87.53% | 92.90% | 94.44% | 34.70% |
| Percent of Sales | ||||
| Sales | 100.00% | 100.00% | 100.00% | 100.00% |
| Gross Margin | 64.23% | 66.85% | 64.93% | 0.00% |
| Selling, General & Administrative Expenses | 39.13% | 32.15% | 29.21% | 82.20% |
| Advertising Expenses | 0.00% | 0.00% | 0.00% | 1.10% |
| Profit Before Interest and Taxes | 33.46% | 46.28% | 47.63% | 2.40% |
| Main Ratios | ||||
| Current | 8.02 | 14.08 | 17.98 | 1.51 |
| Quick | 8.02 | 14.08 | 17.98 | 1.20 |
| Total Debt to Total Assets | 12.47% | 7.10% | 5.56% | 65.30% |
| Pre-tax Return on Net Worth | 134.08% | 96.29% | 72.34% | 4.40% |
| Pre-tax Return on Assets | 117.36% | 89.45% | 68.32% | 12.70% |
| Additional Ratios | Year 1 | Year 2 | Year 3 | |
| Net Profit Margin | 24.96% | 34.71% | 35.52% | n.a |
| Return on Equity | 100.00% | 72.22% | 53.96% | n.a |
| Activity Ratios | ||||
| Accounts Payable Turnover | 12.45 | 12.17 | 12.17 | n.a |
| Payment Days | 27 | 23 | 24 | n.a |
| Total Asset Turnover | 3.51 | 1.93 | 1.43 | n.a |
| Debt Ratios | ||||
| Debt to Net Worth | 0.14 | 0.08 | 0.06 | n.a |
| Current Liab. to Liab. | 1.00 | 1.00 | 1.00 | n.a |
| Liquidity Ratios | ||||
| Net Working Capital | $1,947 | $7,007 | $15,218 | n.a |
| Interest Coverage | 0.00 | 0.00 | 0.00 | n.a |
| Additional Ratios | ||||
| Assets to Sales | 0.29 | 0.52 | 0.70 | n.a |
| Current Debt/Total Assets | 12% | 7% | 6% | n.a |
| Acid Test | 8.02 | 14.08 | 17.98 | n.a |
| Sales/Net Worth | 4.01 | 2.08 | 1.52 | n.a |
| Dividend Payout | 0.00 | 0.00 | 0.00 | n.a |
Appendix
| Sales Forecast | |||||||||||||
| Month 1 | Month 2 | Month 3 | Month 4 | Month 5 | Month 6 | Month 7 | Month 8 | Month 9 | Month 10 | Month 11 | Month 12 | ||
| Unit Sales | |||||||||||||
| Up to 10 Job Listings | 0% | 5 | 5 | 5 | 5 | 5 | 5 | 5 | 5 | 5 | 5 | 5 | 5 |
| 10-20 Job Listings | 0% | 5 | 5 | 5 | 5 | 5 | 5 | 5 | 5 | 5 | 5 | 5 | 5 |
| 21-50 Job Listings | 0% | 3 | 3 | 3 | 3 | 3 | 3 | 3 | 3 | 3 | 3 | 3 | 3 |
| 51-unlimited Job Listings | 0% | 3 | 3 | 3 | 3 | 3 | 3 | 3 | 3 | 3 | 3 | 3 | 3 |
| Total Unit Sales | 16 | 16 | 16 | 16 | 16 | 16 | 16 | 16 | 16 | 16 | 16 | 16 | |
| Unit Prices | Month 1 | Month 2 | Month 3 | Month 4 | Month 5 | Month 6 | Month 7 | Month 8 | Month 9 | Month 10 | Month 11 | Month 12 | |
| Up to 10 Job Listings | $20.00 | $20.00 | $20.00 | $20.00 | $20.00 | $20.00 | $20.00 | $20.00 | $20.00 | $20.00 | $20.00 | $20.00 | |
| 10-20 Job Listings | $35.00 | $35.00 | $35.00 | $35.00 | $35.00 | $35.00 | $35.00 | $35.00 | $35.00 | $35.00 | $35.00 | $35.00 | |
| 21-50 Job Listings | $50.00 | $50.00 | $50.00 | $50.00 | $50.00 | $50.00 | $50.00 | $50.00 | $50.00 | $50.00 | $50.00 | $50.00 | |
| 51-unlimited Job Listings | $75.00 | $75.00 | $75.00 | $75.00 | $75.00 | $75.00 | $75.00 | $75.00 | $75.00 | $75.00 | $75.00 | $75.00 | |
| Sales | |||||||||||||
| Up to 10 Job Listings | $100 | $100 | $100 | $100 | $100 | $100 | $100 | $100 | $100 | $100 | $100 | $100 | |
| 10-20 Job Listings | $175 | $175 | $175 | $175 | $175 | $175 | $175 | $175 | $175 | $175 | $175 | $175 | |
| 21-50 Job Listings | $150 | $150 | $150 | $150 | $150 | $150 | $150 | $150 | $150 | $150 | $150 | $150 | |
| 51-unlimited Job Listings | $225 | $225 | $225 | $225 | $225 | $225 | $225 | $225 | $225 | $225 | $225 | $225 | |
| Total Sales | $650 | $650 | $650 | $650 | $650 | $650 | $650 | $650 | $650 | $650 | $650 | $650 | |
| Direct Unit Costs | Month 1 | Month 2 | Month 3 | Month 4 | Month 5 | Month 6 | Month 7 | Month 8 | Month 9 | Month 10 | Month 11 | Month 12 | |
| Up to 10 Job Listings | 0.00% | $6.00 | $6.00 | $6.00 | $6.00 | $6.00 | $6.00 | $6.00 | $6.00 | $6.00 | $6.00 | $6.00 | $6.00 |
| 10-20 Job Listings | 0.00% | $10.50 | $10.50 | $10.50 | $10.50 | $10.50 | $10.50 | $10.50 | $10.50 | $10.50 | $10.50 | $10.50 | $10.50 |
| 21-50 Job Listings | 0.00% | $20.00 | $20.00 | $20.00 | $20.00 | $20.00 | $20.00 | $20.00 | $20.00 | $20.00 | $20.00 | $20.00 | $20.00 |
| 51-unlimited Job Listings | 0.00% | $30.00 | $30.00 | $30.00 | $30.00 | $30.00 | $30.00 | $30.00 | $30.00 | $30.00 | $30.00 | $30.00 | $30.00 |
| Direct Cost of Sales | |||||||||||||
| Up to 10 Job Listings | $30 | $30 | $30 | $30 | $30 | $30 | $30 | $30 | $30 | $30 | $30 | $30 | |
| 10-20 Job Listings | $53 | $53 | $53 | $53 | $53 | $53 | $53 | $53 | $53 | $53 | $53 | $53 | |
| 21-50 Job Listings | $60 | $60 | $60 | $60 | $60 | $60 | $60 | $60 | $60 | $60 | $60 | $60 | |
| 51-unlimited Job Listings | $90 | $90 | $90 | $90 | $90 | $90 | $90 | $90 | $90 | $90 | $90 | $90 | |
| Subtotal Direct Cost of Sales | $233 | $233 | $233 | $233 | $233 | $233 | $233 | $233 | $233 | $233 | $233 | $233 | |
| Personnel Plan | |||||||||||||
| Month 1 | Month 2 | Month 3 | Month 4 | Month 5 | Month 6 | Month 7 | Month 8 | Month 9 | Month 10 | Month 11 | Month 12 | ||
| Payroll | 0% | $200 | $200 | $200 | $200 | $200 | $200 | $200 | $200 | $200 | $200 | $200 | $200 |
| Other | 0% | $0 | $0 | $0 | $0 | $0 | $0 | $0 | $0 | $0 | $0 | $0 | $0 |
| Total People | 1 | 1 | 1 | 1 | 1 | 1 | 1 | 1 | 1 | 1 | 1 | 1 | |
| Total Payroll | $200 | $200 | $200 | $200 | $200 | $200 | $200 | $200 | $200 | $200 | $200 | $200 | |
| General Assumptions | |||||||||||||
| Month 1 | Month 2 | Month 3 | Month 4 | Month 5 | Month 6 | Month 7 | Month 8 | Month 9 | Month 10 | Month 11 | Month 12 | ||
| Plan Month | 1 | 2 | 3 | 4 | 5 | 6 | 7 | 8 | 9 | 10 | 11 | 12 | |
| Current Interest Rate | 10.00% | 10.00% | 10.00% | 10.00% | 10.00% | 10.00% | 10.00% | 10.00% | 10.00% | 10.00% | 10.00% | 10.00% | |
| Long-term Interest Rate | 10.00% | 10.00% | 10.00% | 10.00% | 10.00% | 10.00% | 10.00% | 10.00% | 10.00% | 10.00% | 10.00% | 10.00% | |
| Tax Rate | 30.00% | 25.00% | 25.00% | 25.00% | 25.00% | 25.00% | 25.00% | 25.00% | 25.00% | 25.00% | 25.00% | 25.00% | |
| Other | 0 | 0 | 0 | 0 | 0 | 0 | 0 | 0 | 0 | 0 | 0 | 0 | |
| Pro Forma Profit and Loss | |||||||||||||
| Month 1 | Month 2 | Month 3 | Month 4 | Month 5 | Month 6 | Month 7 | Month 8 | Month 9 | Month 10 | Month 11 | Month 12 | ||
| Sales | $650 | $650 | $650 | $650 | $650 | $650 | $650 | $650 | $650 | $650 | $650 | $650 | |
| Direct Cost of Sales | $233 | $233 | $233 | $233 | $233 | $233 | $233 | $233 | $233 | $233 | $233 | $233 | |
| Other | $0 | $0 | $0 | $0 | $0 | $0 | $0 | $0 | $0 | $0 | $0 | $0 | |
| Total Cost of Sales | $233 | $233 | $233 | $233 | $233 | $233 | $233 | $233 | $233 | $233 | $233 | $233 | |
| Gross Margin | $418 | $418 | $418 | $418 | $418 | $418 | $418 | $418 | $418 | $418 | $418 | $418 | |
| Gross Margin % | 64.23% | 64.23% | 64.23% | 64.23% | 64.23% | 64.23% | 64.23% | 64.23% | 64.23% | 64.23% | 64.23% | 64.23% | |
| Expenses | |||||||||||||
| Payroll | $200 | $200 | $200 | $200 | $200 | $200 | $200 | $200 | $200 | $200 | $200 | $200 | |
| Sales and Marketing and Other Expenses | $0 | $0 | $0 | $0 | $0 | $0 | $0 | $0 | $0 | $0 | $0 | $0 | |
| Depreciation | $0 | $0 | $0 | $0 | $0 | $0 | $0 | $0 | $0 | $0 | $0 | $0 | |
| Leased Equipment | $0 | $0 | $0 | $0 | $0 | $0 | $0 | $0 | $0 | $0 | $0 | $0 | |
| Utilities | $0 | $0 | $0 | $0 | $0 | $0 | $0 | $0 | $0 | $0 | $0 | $0 | |
| Insurance | $0 | $0 | $0 | $0 | $0 | $0 | $0 | $0 | $0 | $0 | $0 | $0 | |
| Rent | $0 | $0 | $0 | $0 | $0 | $0 | $0 | $0 | $0 | $0 | $0 | $0 | |
| Payroll Taxes | 15% | $0 | $0 | $0 | $0 | $0 | $0 | $0 | $0 | $0 | $0 | $0 | $0 |
| Other | $0 | $0 | $0 | $0 | $0 | $0 | $0 | $0 | $0 | $0 | $0 | $0 | |
| Total Operating Expenses | $200 | $200 | $200 | $200 | $200 | $200 | $200 | $200 | $200 | $200 | $200 | $200 | |
| Profit Before Interest and Taxes | $218 | $218 | $218 | $218 | $218 | $218 | $218 | $218 | $218 | $218 | $218 | $218 | |
| EBITDA | $218 | $218 | $218 | $218 | $218 | $218 | $218 | $218 | $218 | $218 | $218 | $218 | |
| Interest Expense | $0 | $0 | $0 | $0 | $0 | $0 | $0 | $0 | $0 | $0 | $0 | $0 | |
| Taxes Incurred | $65 | $54 | $54 | $54 | $54 | $54 | $54 | $54 | $54 | $54 | $54 | $54 | |
| Net Profit | $152 | $163 | $163 | $163 | $163 | $163 | $163 | $163 | $163 | $163 | $163 | $163 | |
| Net Profit/Sales | 23.42% | 25.10% | 25.10% | 25.10% | 25.10% | 25.10% | 25.10% | 25.10% | 25.10% | 25.10% | 25.10% | 25.10% | |
| Pro Forma Cash Flow | |||||||||||||
| Month 1 | Month 2 | Month 3 | Month 4 | Month 5 | Month 6 | Month 7 | Month 8 | Month 9 | Month 10 | Month 11 | Month 12 | ||
| Cash Received | |||||||||||||
| Cash from Operations | |||||||||||||
| Cash Sales | $650 | $650 | $650 | $650 | $650 | $650 | $650 | $650 | $650 | $650 | $650 | $650 | |
| Subtotal Cash from Operations | $650 | $650 | $650 | $650 | $650 | $650 | $650 | $650 | $650 | $650 | $650 | $650 | |
| Additional Cash Received | |||||||||||||
| Sales Tax, VAT, HST/GST Received | 0.00% | $0 | $0 | $0 | $0 | $0 | $0 | $0 | $0 | $0 | $0 | $0 | $0 |
| New Current Borrowing | $0 | $0 | $0 | $0 | $0 | $0 | $0 | $0 | $0 | $0 | $0 | $0 | |
| New Other Liabilities (interest-free) | $0 | $0 | $0 | $0 | $0 | $0 | $0 | $0 | $0 | $0 | $0 | $0 | |
| New Long-term Liabilities | $0 | $0 | $0 | $0 | $0 | $0 | $0 | $0 | $0 | $0 | $0 | $0 | |
| Sales of Other Current Assets | $0 | $0 | $0 | $0 | $0 | $0 | $0 | $0 | $0 | $0 | $0 | $0 | |
| Sales of Long-term Assets | $0 | $0 | $0 | $0 | $0 | $0 | $0 | $0 | $0 | $0 | $0 | $0 | |
| New Investment Received | $0 | $0 | $0 | $0 | $0 | $0 | $0 | $0 | $0 | $0 | $0 | $0 | |
| Subtotal Cash Received | $650 | $650 | $650 | $650 | $650 | $650 | $650 | $650 | $650 | $650 | $650 | $650 | |
| Expenditures | Month 1 | Month 2 | Month 3 | Month 4 | Month 5 | Month 6 | Month 7 | Month 8 | Month 9 | Month 10 | Month 11 | Month 12 | |
| Expenditures from Operations | |||||||||||||
| Cash Spending | $200 | $200 | $200 | $200 | $200 | $200 | $200 | $200 | $200 | $200 | $200 | $200 | |
| Bill Payments | $10 | $297 | $287 | $287 | $287 | $287 | $287 | $287 | $287 | $287 | $287 | $287 | |
| Subtotal Spent on Operations | $210 | $497 | $487 | $487 | $487 | $487 | $487 | $487 | $487 | $487 | $487 | $487 | |
| Additional Cash Spent | |||||||||||||
| Sales Tax, VAT, HST/GST Paid Out | $0 | $0 | $0 | $0 | $0 | $0 | $0 | $0 | $0 | $0 | $0 | $0 | |
| Principal Repayment of Current Borrowing | $0 | $0 | $0 | $0 | $0 | $0 | $0 | $0 | $0 | $0 | $0 | $0 | |
| Other Liabilities Principal Repayment | $0 | $0 | $0 | $0 | $0 | $0 | $0 | $0 | $0 | $0 | $0 | $0 | |
| Long-term Liabilities Principal Repayment | $0 | $0 | $0 | $0 | $0 | $0 | $0 | $0 | $0 | $0 | $0 | $0 | |
| Purchase Other Current Assets | $0 | $0 | $0 | $0 | $0 | $0 | $0 | $0 | $0 | $0 | $0 | $0 | |
| Purchase Long-term Assets | $0 | $0 | $0 | $0 | $0 | $0 | $0 | $0 | $0 | $0 | $0 | $0 | |
| Dividends | $0 | $0 | $0 | $0 | $0 | $0 | $0 | $0 | $0 | $0 | $0 | $0 | |
| Subtotal Cash Spent | $210 | $497 | $487 | $487 | $487 | $487 | $487 | $487 | $487 | $487 | $487 | $487 | |
| Net Cash Flow | $440 | $153 | $163 | $163 | $163 | $163 | $163 | $163 | $163 | $163 | $163 | $163 | |
| Cash Balance | $440 | $593 | $756 | $919 | $1,082 | $1,245 | $1,408 | $1,571 | $1,735 | $1,898 | $2,061 | $2,224 | |
| Pro Forma Balance Sheet | |||||||||||||
| Month 1 | Month 2 | Month 3 | Month 4 | Month 5 | Month 6 | Month 7 | Month 8 | Month 9 | Month 10 | Month 11 | Month 12 | ||
| Assets | Starting Balances | ||||||||||||
| Current Assets | |||||||||||||
| Cash | $0 | $440 | $593 | $756 | $919 | $1,082 | $1,245 | $1,408 | $1,571 | $1,735 | $1,898 | $2,061 | $2,224 |
| Other Current Assets | $0 | $0 | $0 | $0 | $0 | $0 | $0 | $0 | $0 | $0 | $0 | $0 | $0 |
| Total Current Assets | $0 | $440 | $593 | $756 | $919 | $1,082 | $1,245 | $1,408 | $1,571 | $1,735 | $1,898 | $2,061 | $2,224 |
| Long-term Assets | |||||||||||||
| Long-term Assets | $0 | $0 | $0 | $0 | $0 | $0 | $0 | $0 | $0 | $0 | $0 | $0 | $0 |
| Accumulated Depreciation | $0 | $0 | $0 | $0 | $0 | $0 | $0 | $0 | $0 | $0 | $0 | $0 | $0 |
| Total Long-term Assets | $0 | $0 | $0 | $0 | $0 | $0 | $0 | $0 | $0 | $0 | $0 | $0 | $0 |
| Total Assets | $0 | $440 | $593 | $756 | $919 | $1,082 | $1,245 | $1,408 | $1,571 | $1,735 | $1,898 | $2,061 | $2,224 |
| Liabilities and Capital | Month 1 | Month 2 | Month 3 | Month 4 | Month 5 | Month 6 | Month 7 | Month 8 | Month 9 | Month 10 | Month 11 | Month 12 | |
| Current Liabilities | |||||||||||||
| Accounts Payable | $0 | $288 | $277 | $277 | $277 | $277 | $277 | $277 | $277 | $277 | $277 | $277 | $277 |
| Current Borrowing | $0 | $0 | $0 | $0 | $0 | $0 | $0 | $0 | $0 | $0 | $0 | $0 | $0 |
| Other Current Liabilities | $0 | $0 | $0 | $0 | $0 | $0 | $0 | $0 | $0 | $0 | $0 | $0 | $0 |
| Subtotal Current Liabilities | $0 | $288 | $277 | $277 | $277 | $277 | $277 | $277 | $277 | $277 | $277 | $277 | $277 |
| Long-term Liabilities | $0 | $0 | $0 | $0 | $0 | $0 | $0 | $0 | $0 | $0 | $0 | $0 | $0 |
| Total Liabilities | $0 | $288 | $277 | $277 | $277 | $277 | $277 | $277 | $277 | $277 | $277 | $277 | $277 |
| Paid-in Capital | $6,680 | $6,680 | $6,680 | $6,680 | $6,680 | $6,680 | $6,680 | $6,680 | $6,680 | $6,680 | $6,680 | $6,680 | $6,680 |
| Retained Earnings | ($6,680) | ($6,680) | ($6,680) | ($6,680) | ($6,680) | ($6,680) | ($6,680) | ($6,680) | ($6,680) | ($6,680) | ($6,680) | ($6,680) | ($6,680) |
| Earnings | $0 | $152 | $315 | $479 | $642 | $805 | $968 | $1,131 | $1,294 | $1,457 | $1,620 | $1,784 | $1,947 |
| Total Capital | $0 | $152 | $315 | $479 | $642 | $805 | $968 | $1,131 | $1,294 | $1,457 | $1,620 | $1,784 | $1,947 |
| Total Liabilities and Capital | $0 | $440 | $593 | $756 | $919 | $1,082 | $1,245 | $1,408 | $1,571 | $1,735 | $1,898 | $2,061 | $2,224 |
| Net Worth | $0 | $152 | $315 | $479 | $642 | $805 | $968 | $1,131 | $1,294 | $1,457 | $1,620 | $1,784 | $1,947 |


