
Jasmine Teahouse
Executive Summary
Jasmine Teahouse is a new tea room in the quaint New England town of Simsbury, Connecticut. Jasmine Teahouse is a Limited Liability Corporation, managed by its owners, Earl and Lady Grey. Earl Grey has five years of experience managing a successful boutique coffeehouse in a similar locale in Maryland. His love and knowledge of teas will make the transition to owning and running a teahouse a natural step. Lady Grey has 3 years of training as an herbalist and worked for 4 years as a teatender in Boston. She is currently training to be a nutritionist; her knowledge of the health benefits of tea will help our marketing and sales efforts.
Jasmine Teahouse will offer a full range of teas (hot and iced), as well as pastries, premium chocolates, tea accessories, and loose teas for taking home or giving as gifts. Lady Grey is a master teatender, and Earl has been learning proper brewing techniques from her for the last four months. We will train all of our teatenders in the proper storage, brewing, and serving of each kind of tea.
The American tea market is growing rapidly. Tea sales have increased 165% over the last fifteen years, with the number of tea rooms offering sit down service rising about 15% to about 1,500 shops. American interest in tea certainly owes some of its increase to the proliferation of gourmet coffee shops around the country in this same period. Most of working America has accepted the idea of expensive hot beverages as affordable luxuries, thanks to the marketing efforts of Starbucks, Seattle’s Best, and so on. At the same time, fashion is always on the move – now that fancy coffee drinks are so widely accepted, savvy consumers are looking for new, more unique treats to enjoy. Starbucks estimates that 7% of its $12 billion annual sales currently come from tea.
In Simsbury, our potential clientele is divided between local residents and tourists (roughly 100,000 per year, in all seasons). We expect to easily generate sales to existing committed tea drinkers, who will immediately recognize the quality of our products and services. Marketing to the much larger local groups who are not yet familiar with premium teas will emphasize our atmosphere (cozy, intimate, luxurious), our prestige-value (high prices, the sophistication of having a favorite “exotic” tea type), and our wide array of potential gifts (gift baskets, chocolates, loose teas and tea accessories). Sales to tourists depend on a highly-visible location, association with the quaint charm of our town, and promotional efforts in cooperation with other local businesses.
We have no direct competitors in our area. Dunkin’ Donuts and a local cafe cannot compete with our upscale approach, and the nearest Starbucks is 5 miles away. Simsbury’s growing affluence and gentrification work in our favor, as our upper-middle class customer base seeks out new status markers and mini-luxury experiences in a convenient, nearby location.
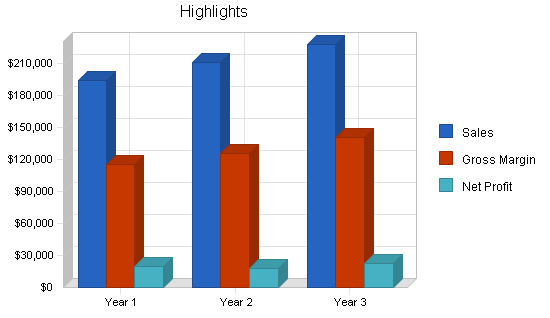
Our well-researched and conservative sales forecasts project sales over $190,000 in the first year, with continued moderate increases through year 3. We project a net profit in the first year of over $13,000, with steadily increasing net worth for the foreseeable future.
The owners are investing $10,330 of their own money into the business. Jasmine Teahouse is seeking an additional 6 year loan of $53,633 to fund our startup costs.
1.1 Mission
Our goal is to provide the finest premium teas and chocolates to residents of the Simsbury, CT area in a relaxed and fun atmosphere.
1.2 Objectives
- To operate a successful tea and chocolate store in Simsbury, employing one to two employees the first year.
- To obtain a minimum of 200 regular customers in the Simsbury market the first year of operation.
- Achieve first year sales of $190,000.
- Maintain an average gross margin of 58 percent.
- To produce a reasonable net profit by the end of the third year of operation.
1.3 Keys to Success
- Experienced Owners/Managers. Earl and Lady Grey have years of experience in this and related industries.
- Product Quality. We sell only the finest whole-leaf loose teas, pastries, and chocolates.
- Excellent Customer Service. Each customer will be treated as would an honored guest in our homes.
- No direct competition. We are the only teahouse in 20 miles.
- Enough working capital to survive the first year as we build a customer base.
- Broad cross-seasonal offerings. In addition to hot teas, we offer iced teas, chocolates, and gift baskets to cover seasonal variations in customer demand.
Company Summary
Jasmine Teahouse is a start-up business on a well-trafficked street in Simsbury, CT. Our primary focus is in the over 50 kinds of loose tea we offer, including black teas, green teas, herbal teas (infusions), and flavored teas (black or green tea plus other flavors). We serve our teas hot and iced, and sell loose teas by the ounce.
In addition, we sell premium chocolates and gift baskets, and offer daily pastries to accompany tea orders. Since we are not intending to compete with coffee giants such as Starbucks, we brew only one kind of coffee daily, as a courtesy to our customers.
About Simsbury
Simsbury is one of Connecticut’s oldest communities, incorporated in 1670. The population in Simsbury has grown from 5,000 in 1950 to today’s population of over 23,000. While Simsbury has seen some development, the town is committed to maintaining its rural environment and historic charm. Simsbury old New England appeal has also made it a popular tourist destination for residents of Hartford, Boston and New York City.
Simsbury has four State parks, several wildlife habitats, and Talcott Mountain, a great hiking destination. Tourists flock to Simsbury in all four seasons for outdoor activities, historic sightseeing, and shopping. In Summer, the Talcott Mountain Music Festival draws crowds from Hartford, and in Autumn, the city-dwelling “leaf-peepers” stop to enjoy our antiques and craft fairs. Winter brings cross-country skiiers, candlelight tours of the historic downtown, and ice skating, while Spring introduces the Simsbury Light Opera season and the River Run Road Race.
2.1 Company Ownership
As a Limited Liability Company in the State of Connecticut, ownership of Jasmine Teahouse is identified as belonging to its managers. These partners, Earl Grey and Lady Grey, each control 50% of the business.
Earl Grey has five years of experience managing a successful boutique coffeehouse in a similar locale in Maryland. His love and knowledge of teas will make the transition to owning and running a teahouse a natural step. Lady Grey has 3 years of training as an herbalist and worked for 4 years as a teatender in Boston. She is currently training to be a nutritionist; her knowledge of the health benefits of tea will help our marketing and sales efforts.
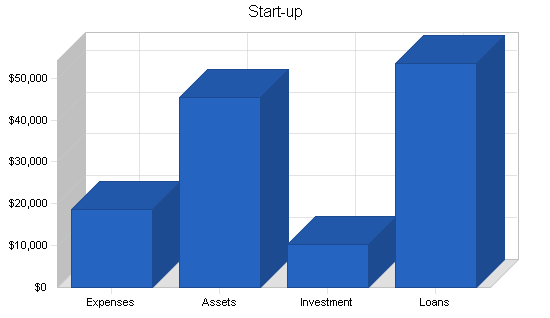
2.2 Start-up Summary
Equipment and Inventory will make up 75% of start-up requirements. Leasehold improvements and general expenses comprise the remaining 25%. The owners are contributing $10,330 of investment to the business. We need a total of $63,963, and are seeking a long-term loan of $53,633; we plan to pay this loan back in full within 6 years, at a 9.25% interest rate.
Long-term Assets, $13,808
- Refrigerated Chocolate Case: $3,500
- Tea Racks: $2,300
- Coffee Maker: $908
- Hot Water and Steam machine: $1,100
- Dishwasher: $3,000
- Other Hardware & Appliances: $3,000
Short-term Assets, $6,605

- Coffee Grinder: $564
- Iced Tea Shakers: $541
- Furniture: $5,500
Expensed Supplies, $1,200
- Napkins, Stirrers, cleaning supplies, tea-balls, tasting cups
| Start-up | |
| Requirements | |
| Start-up Expenses | |
| Legal | $750 |
| Stationery etc. | $800 |
| Brochures | $200 |
| Insurance | $500 |
| Rent | $3,000 |
| Leashold Improvements | $10,000 |
| Start-up Supplies | $1,200 |
| Dishes, Teacups, Teapots | $2,000 |
| Other | $100 |
| Total Start-up Expenses | $18,550 |
| Start-up Assets | |
| Cash Required | $15,000 |
| Start-up Inventory | $10,000 |
| Other Current Assets | $6,605 |
| Long-term Assets | $13,808 |
| Total Assets | $45,413 |
| Total Requirements | $63,963 |
| Start-up Funding | |
| Start-up Expenses to Fund | $18,550 |
| Start-up Assets to Fund | $45,413 |
| Total Funding Required | $63,963 |
| Assets | |
| Non-cash Assets from Start-up | $30,413 |
| Cash Requirements from Start-up | $15,000 |
| Additional Cash Raised | $0 |
| Cash Balance on Starting Date | $15,000 |
| Total Assets | $45,413 |
| Liabilities and Capital | |
| Liabilities | |
| Current Borrowing | $0 |
| Long-term Liabilities | $53,633 |
| Accounts Payable (Outstanding Bills) | $0 |
| Other Current Liabilities (interest-free) | $0 |
| Total Liabilities | $53,633 |
| Capital | |
| Planned Investment | |
| Owners | $10,330 |
| Other | $0 |
| Additional Investment Requirement | $0 |
| Total Planned Investment | $10,330 |
| Loss at Start-up (Start-up Expenses) | ($18,550) |
| Total Capital | ($8,220) |
| Total Capital and Liabilities | $45,413 |
| Total Funding | $63,963 |
Products and Services
Jasmine Teahouse will specialize in premium teas, fine chocolates, and gift baskets. Our full “teahouse” experience is complemented by an assortment of loose teas, premium chocolates, tea accessories and gift baskets, all suitable as souvenirs and gifts for our tourist customers. Our goal is to be a destination store for visitors, and a resource for locals seeking gifts, new experiences, and knowledge of tea.
52 kinds of tea
Our tea-tenders will know the best brewing temperature and time for each of the 52 kinds of teas we offer. These include straight black teas such as Assam, Ceylon, Darjeeling and Keemun, blends like Chai, Earl Grey, and our own creations, like “New London Garden Party,” a Ceylon/Vanilla/Jasmine blend. We will also offer a range of green teas, which are becoming more popular with the proliferation of local sushi restaurants. Jasmine Teahouse’s no-caffeine herbal infusions range from flavored rooibus to fruit blends and medicinal brews (chamomile, ginseng, etc.).
All of these teas are available hot, iced, or loose for customers to take home and brew at their leisure.
Pastries
To complement our beverages, we will offer a small selection of freshly-baked pastries from a local bakery. Our alliance with this bakery allows us to offer high-quality baked goods at a reasonable price, in exchange for co-advertising. These items are not intended as a staple of our overall profit structure, but help us to create the whole-service feeling of a real teahouse, without investing in cooks, bakers, or kitchen equipment. Based on market research, we believe that up to 2/3 of our sit-down clientele will order a cookie, piece of cake, scone, muffin, or savory croissant with their tea. Not offering such treats could lose us customers.
Chocolates
In keeping with our upscale, indulgent feeling, we will sell premium chocolates such as Godiva, Scharffen Berger, and Garrison, as well as environmentally-friendly ones like Dagoba and vegan chocolates. We will offer a limited selection of truffles and dipped chocolates (like chocolate covered cherries, orange peel, and candied ginger), and a wider array of loose bars and chocolate gift baskets.
Coffee
We are a teahouse; we focus on tea. Since we are not intending to compete with coffee giants such as Starbucks, we brew only one kind of coffee daily, to satisfy those accompanying true tea lovers on their visits to our store.
Tea paraphernalia
Tea paraphernalia includes specialty teapots, teaballs, decorative tea tins, “art of tea” books, and various small, seasonal, non-food, tea-related items.
Gift Baskets
We offer a selection of pre-made gift baskets, and will work with customers to create custom baskets for any occasion. Our tea tins come in a range of sizes and designs, and we will keep at least five colors of baskets and liners in stock at all times.
Market Analysis Summary
The Tea Market
The American tea market is growing rapidly. Tea sales have increased 165% since 1990, with the number of tea rooms offering sit down service rising about 15% to about 1,500 shops. The number of tea rooms selling loose tea and accessories rose over the same period to about 200 shops.
American interest in tea certainly owes some of its increase to the proliferation of gourmet coffee shops around the country in this same period. Most of working America has accepted the idea of expensive hot beverages as affordable luxuries, thanks to the marketing efforts of Starbucks, Seattle’s Best, and so on. At the same time, fashion is always on the move – now that fancy coffee drinks are so widely accepted, savvy consumers are looking for new, more unique treats to enjoy. Starbucks estimates that 7% of its $12 billion annual sales currently come from tea.
Spurred by studies touting tea’s health effects, and increasing familiarity with Asian and South Asian cuisine and its tea customs, American consumers have been turning towards tea as a more original, more “natural” affordable luxury. In addition, the cultural connection of tea with all things “civilized” (largely from American understandings of British high tea) has made tea knowledge, including the choice of a favorite teahouse, a mark of sophistication among many American middle class women.
Simsbury itself is a rural town getting slowly gentrified, and gradually adopting the sophisticated tastes of its tourists. Recent moves towards organic farming in several of the surrounding towns reflect the changing tastes and priorities of local residents. Local high schools have seen dramatic increases over the last 10 years in the percentage of juniors and seniors enrolled in courses for college credit – newer residents are much more concerned with education than their predecessors, as the community’s affluence grows. All of these trends bode well for the success of an upscale teahouse.
The Chocolate Market
Annually, $408 million of premium chocolates such as Godiva, Scharffen Berger, Ghirardelli and local private labels such as Garrison’s are sold throughout America. Despite the 19% per year growth rate from 1996-2002, the U.S. chocolate market has not yet matured, leaving room for continued growth. Europeans consume twice as much chocolate as Americans, with a per capita consumption of 22.4 pounds vs. 12.2 pounds. It is estimated that the premium chocolate market will grow from 408 million dollars per year in 2002 to 1.2 billion dollars per year by 2005.
Market Size
Locals
Hartford County’s population is 885,000 people, with 80,000 living within a 5 mile radius of Simsbury Center. Of these, 37%, or 30,000, are between the ages of 25 and 60 – our target age group. Given our upscale comestibles selection and prices, and based on U.S. census data for local income levels, we estimate that roughly 2/3 of these of these people have pre-existing brand loyalties or economic constraints that would discourage them from visiting our teahouse. Our local target market is therefore roughly 10,000 people.Tourists
According to a 2001 study by the Connecticut Center for Economic Analysis (U. Conn), Connecticut’s travel and tourism industry generated gross revenues in 1999 in excess of $4.9 billion, or almost 4% of Connecticut’s 1999 estimated gross state product. The same study found that travel and tourism is one of the fastest growing industries in Connecticut. Simsbury itself benefits economically from tourist visits all year round, with our combination of scenic outdoor activities and seasonal cultural events. Based on data from the Simsbury Chamber of Commerce, we estimate a potential market of at least 100,000 tourists annually for our business.
4.1 Market Segmentation
While we anticipate a split between locals and tourists, all members of our target market are between the ages of 25 and 60, and have a moderate to sizable disposable income.

| Market Analysis | |||||||
| Year 1 | Year 2 | Year 3 | Year 4 | Year 5 | |||
| Potential Customers | Growth | CAGR | |||||
| Local Residents | 5% | 10,000 | 10,500 | 11,025 | 11,576 | 12,155 | 5.00% |
| Tourists | 3% | 100,000 | 103,000 | 106,090 | 109,273 | 112,551 | 3.00% |
| Total | 3.19% | 110,000 | 113,500 | 117,115 | 120,849 | 124,706 | 3.19% |
4.2 Target Market Segment Strategy
Jasmine Teahouse will provide the local upper-middle-class community with a place to socialize, indulge themselves with fine teas and pastries, and find unique chocolates and tea for gifts. For tourists, Jasmine Teahouse will be a destination stop in their tour of the town, whether as a break from shopping, a warm-up visit after skiing, or a place to buy unique gifts as souvenirs of their holiday.
These customers will be glad to pay the price premium for our products in exchange for the high quality, great taste, and sense of prestige they receive. In fact, higher prices for some items (Assam golden tippy versus regular Assam) may encourage higher sales – these kinds of customers eagerly accept the idea that higher prices equal higher quality, and want to buy “only the best,” regardless of whether their palate is educated enough to appreciate the subtle differences.
4.3 Service Business Analysis
The tea market is relatively new in rural and suburban areas such as Simsbury. Currently, locals and more sophisticated tourists looking for a cup of coffee or tea can either go to the local Dunkin Donuts or Peaberry’s cafe, or travel up to five miles out of town to reach the nearest Starbucks. None of these options is geared toward the tea drinker, and none of them offer the convenience or upscale feeling, let alone knowledgeable service, available at Jasmine Teahouse.
Teahouses have long done well in urban areas; Tealuxe in Boston and the Russian Tea Room in New York are both internationally renowned. In smaller tourists areas, however, smaller, more eclectic teahouses have also done very well in recent years. The Berkshires, a tourist area roughly 50 miles north of Simsbury with a similar tourist base, now has over 15 specialty teahouses throughout the county. In talking with the owners of three of these establishments, we have learned that their proximity to cultural events, shopping districts and fine restaurants has brought in hundreds of walk-in tourists monthly, while advertising with local hotels and bed and breakfasts boosted their clientele only slightly. Word of mouth, visibility, and year-round tourist appeal are very important for a teahouse’s success in areas like Simsbury.
Tea Myths
- Most people do not consume tea as a morning ritual as they do with coffee.
- Tea is consumed in the afternoon and before bed.
- People drink tea only during cold weather, making the business seasonal.
- Tea is associated solely with the image of old ladies, china cups and doilies.
Tea Facts
- Tea is growing in popularity and more people are drinking tea in the mornings as a substitute for coffee.
- Tea is being consumed throughout the day; its milder caffeine effect allows for multiple cups without the “jitters.”
- Today’s tea drinkers do not limit their purchases to one season, but drink tea all year long.
- Tea has become the drink of choice for today’s baby boomer, and tea’s health effects are giving tea a more active, youthful, and healthy image.
Premium Chocolate Sales
In the Hartford area, the premium and near-premium chocolate market is made up of three major competitors: Godiva, Munson’s and Lindt. Both Godiva and Munsons sell their products out of their own stores, while Lindt’s products are sold through retailers such as Target. Lindt is beginning to expand in the market with 90 stores as of 2003, the nearest one in Westport, CT. With the higher than expected growth rate in the premium chocolates market, retailers like Godiva are expected to open new locations. Due to the nature of the business it is hard to gauge the overall net sales of these privately held companies. Godiva, owned by Campbell, has reported that their sales in the confectionary division are $484 million. Their overall sales have remained flat with the exception of their Godiva division, whose sales increased by 9.7%. With the economy on the rebound, Campbell’s expects Godiva’s sales to be much stronger in 2004. Lindt has reported that their chocolate sales world wide are expected to grow 7 to 10% a year with a high growth rate in the U.S., due to an increase in the number of stores.
According to chocolate statistics, Americans purchase 3.1 billion pounds of chocolate a year. This translates into $13.7 billion dollars. Briefly stated, these outlets fall into the following categories:
- Premium. Premium chocolate boutiques carry chocolates that are produced by the top manufacturers, such as Godiva. These companies have a small network of dealers or company owned outlets throughout the country who are chosen based on the high image of the outlet. Some outlets represent the manufacturer exclusively, others carry multiple high end chocolates. It is not unusual to find the chocolates selling for up to $2.50 per candy.
- Boxed Chocolates. A step down from the first category, made up of retailers such as Munson’s and Herbert’s chocolate. They sell chocolates targeted to low to middle market buyers. A piece of chocolate sells for about .50 cents
- Mass Market Boxed. These chocolates are sold through supermarkets, drug stores and departments stores, such as Wal-Mart. These outlets sell your mass producers chocolates such as Russell Stover. The chocolates typically sell by the box for $13.00 to $15.00 dollars.
Jasmine Teahouse offers only premium chocolates.
- Valentine’s Day still means chocolate. Americans spend $1.06 billion for Valentine’s day on candy, making it the third biggest holiday of the year for chocolates (after Christmas and Easter).
- Today, chocolate is not only for women. American men say they’d rather receive chocolate than flowers on Valentine’s Day, especially those over the age of 50, which represents about 15,000 men in Simsbury alone. Sixty-eight percent of men age 50 or older say they’d prefer receiving chocolate over flowers from their sweetheart on Valentine’s Day, while just 22% said they’d rather have flowers.
4.3.1 Competition and Buying Patterns
In the gourmet teahouse industry, competition depends on quality of teas, knowledgeable teatenders, and cultivation and education of a loyal customer base. Consumers used to Lipton teabags and other low-quality, tea-dust offerings in grocery stores are amazed at the range of tastes, textures, and fragrances from real, high quality tea. Offer them a good cup, and they will usually return for the rest of their lives. However, getting them to enter your store in the first place can be a major challenge.
Our potential customers vary in knowledge of tea, and are seeking a wide range of experiences and products.
Tea Drinkers
Tea drinkers are looking for a pleasant, relaxing place in which to indulge their love of tea, share it with friends, and learn more about tea varieties, cultivation, and health properties. Committed tea drinkers will always choose quality over price or convenience, seeking out the freshest whole-leaf and tippy varietals in the area. Friends of ours have driven 50 miles to buy quality loose teas to bring home with them. Our challenge with these consumers is getting out the word that we are here, and holding events to showcase our quality.
Local Socializers
The middle and upper-middle class women of Simsbury and surrounding towns currently have no place where they can go to be spoiled at a moderate price outside of a full restaurant. Starbucks, at 5 miles away, can be inconvenient, noisy, and overcrowded with teenagers. Local restaurants can also be noisy, and require a large chunk of time and money for an outing. This market segment is seeking a cozy, comfortable, upscale/exclusive locale with a similar clientele, where they can meet friends, have some good food and beverages, and stay as long or as short as they want. Our challenge with the socializers is to create a buzz from the very beginning that we are exclusive, pleasant, and high-quality, without generating such overcrowding that we lose our intimate feeling.
Comestible Gift Buyers
Currently, the only upscale comestibles in the Simsbury area suitable for gifts are organic meats and local cheeses from surrounding boutique farms – tasty, but certainly not romantic. Husbands and wives looking for something different from the standard bouquet can currently choose a cheap box of chocolates from the grocery store, or hoof it to the city to try to find something more indulgent. We will offer local residents a convenient, attractive, and always-satisfying gift buying experience at a reasonable price, with a bit of cachet.
Tourists
Tourists vary widely in their reasons for visiting Simsbury, but they generally share a sophisticated urban palate, a moderately high disposable income, and a desire to “discover” quaint local charm. They are seeking high-quality foods, beverages, gifts, and service. While here, they much prefer local, small-scale businesses to larger chains (like Dunkin Donuts), but want to be assured of quality. Our challenge with tourists is being visible enough to be noticed, without losing our local charm. Once such a visitor has tried our teahouse, they will definitely want to return.
Other Potential Customers:
- New Tea Drinkers (who have never tried good tea)
- Health-Food Afficionados
Strategy and Implementation Summary
We will combine heavy print advertising with special events and targeted promotions to introduce Simsbury’s residents and tourists to Jasmine Teahouse, and to premium teas in general. Repeat sales depend on consistently high quality products and service. We will thus train every part-time teatender in the proper storage, brewing, and serving of our 52 kinds of tea.
Our teas and chocolates are offered at a price premium that discourages customers seeking cheap, low-quality goods. This not only enhances the feeling of prestige customers get when patronizing our teahouse, but also ensures that customers will have similar expectations of service and quality, based on their socio-economic class. The status and sophistication indicated by suggesting an outing to Jasmine, or a gift basket with our logo on it, will soon become valuable in themselves.
5.1 Competitive Edge
Key Competitive Strengths
- Earl Grey’s experience managing a successful boutique coffeehouse in a similar locale.
- Lady Grey’s four years of experience as a teatender, and 3 years of training as an herbalist.
- We are the only full-scale teahouse within 20 miles.
- We have arranged competitive distribution contracts with high-end tea growers around the world.
- We are the only retailer offering such a wide array of premium chocolates east of the river.
- Our interior design will give Jasmine Teahouse an intimate, cozy, comfortable, and chic feeling, without reminding customers of doilies and lace.
- We are committed to providing only high-quality products and services.
Competitive Weaknesses
Our primary weakness is that we are a new business competing against established chains, for customers who may not know how great our products are. To significantly build sales, we must not just find new customers – we must take customers away from existing stores and from their coffee-drinking habits. We can accomplish this only by offering a superior selection of teas and chocolates, and focusing on high-quality service and full service delivery.
5.2 Marketing Strategy
Our marketing strategy needs to accomplish two things: first, to make potential customers aware of Jasmine Teahouse’s opening and location; second, to educate potential customers as to what a teahouse is, and why it is so wonderful. Clearly, with committed tea drinkers, the first will suffice. However, for the rest of our target market, we must strategically define ourselves as the answer to the many different things each group is seeking. Our highly visible location in the historic shopping district of downtown Simsbury will encourage walk-in traffic.
The marketing budget will not exceed 3% of our gross annual sales.
Tea Drinkers
Appeal to their gourmet palates:
- Advertisements in the “entree” and food sections of all local papers within a 30 miles radius.
- Flyers in gourmet grocery stores and coffeehouses in the same area.
- Ads in local magazines: Fairfield Review, Connecticut Magazine, Westchester Magazine.
- Review by the food writer for the Hartford Courant.
Socializers
Appeal to their sense of prestige and good taste. Within the local market, we will initially target women looking for an intimate social gathering space. A cozy chat over a cup of tea is just right for exchanging gossip, planning outings, or simply relaxing and pampering oneself.
- Advertise through local churches and women’s organizations.
- Monthly “Tea Tasting” party with a different theme each month.
- Coupons in the local papers for “free friends” pots (with your tea order, a friend gets a free pot, to try out our teas for the first time).
- Flyers in local upscale boutiques, salons, and restaurants.
Gift Buyers
Focus on our wide gourmet selection and convenient location:
- Ads in all local papers
- Press releases to local papers, including gift suggestions
Tourists
- Walk-ins: In mild weather (Spring through Autumn), our best chances are to increase the visibility of our store to encourage visits from tourists strolling through downtown. The storefront design (in our highly visible location) will include our name and logo, and we will place standing signs pointing towards our store at both nearby intersections. Our menu, prices, and hours will be posted in the windows at all times.
- Destination Visitors: We will place ads in the programs of all plays, operas, and other cultural events in Hartford County throughout the year, billing ourselves as a “mini-getaway” from the pace of urban life. We will provide brochures in every local historical site, visitor’s center, and state park information booth.
- Alliances with local Inns: Each guest staying at a local inn or bed & breakfast will receive a coupon for a half-price pot of tea at Jasmine Teahouse, along with a brochure.
5.3 Sales Strategy
Because Jasmine Teahouse is a new entity, we understand that we will have to prove our company’s worth to upscale tea and chocolate buyers in order to earn their respect and business. Our Sales Forecast depends on establishing a loyal customer base who visits our teahouse at least once every month; we expect a few committed tea drinking “regulars” who will come in more than once a week. In order to achieve this kind of repeat business, every customer, whether on the first visit or their hundredth, will be treated graciously and with respect.
Part of our mission is to educate our customers about tea and tea brewing; however, this must only be done in a respectful fashion. Our knowledge is a resource, and must never be used to make a customer feel uncomfortable or ignorant.
Tea Profiles
In addition to our extensive menu describing all 52 teas, the Greys have developed a “Tea Profile” card for new tea drinkers, or customers looking to broaden their tea experience. These cards include questions about taste preferences which will help our teatenders guide the customer to a tea they will enjoy. Our teas vary widely in taste, aroma, smokiness, fruit, and pungency, and very few people will enjoy them all equally. A customer who finds his or her personal tastes met is much more likely to be a repeat customer than one who simply orders a popular tea.
“Tea Tasting” Plates
Every week we will offer a different selection of our teas as a “tasting:” 4 to 5 small cups of different teas, labeled and described, with appropriate pastry accompaniments. These plates will allow customers to try new kinds of tea without committing to a full pot. These tastings will be priced at 1 1/2 times the price of a regular pot.
Special Events
In addition to our monthly tea tasting parties, Jasmine Teahouse will offer customers the option of reserving the entire teahouse for a party or special event. We anticipate business for bridal and baby showers, as well as a few children’s birthday parties.
5.3.1 Sales Forecast
The following table and chart give a highlight of our forecasted sales. We expect sales to start off conservatively and increase extensively during the Christmas, Valentine’s Day, Easter and Mother’s Day holidays.
Jasmine teahouse expects average sales of just over $16,000 per month for the first year, as we build name recognition and status in the community. In the second and third year we look to see increased sales of roughly 10% per year, as we gain a larger percentage of the market share and increase our customer base beyond Simsbury and into the connecting towns.
Pricing
- Hot Tea: We offer two sizes of sit-down hot tea: small pots, at $3.50 each, and large pots, at $5.25 each (for two people). For customers wishing to take tea with them, we offer a flat rate of $2.50 for a 16oz. cup or a customer’s own mug.
- Iced Tea: Iced Teas are served in 12oz. or 16oz. cups, at $2.00 and $3.00, respectively.
- Pastries: Our pastry prices range from $1.25 for a lavender-lemon sugar cookie to $4.00 for a slice of cake. Prices depend on our daily cost of such items from the local bakery, and should be only 25 to 30 cents higher than the price of that item sold in the bakery itself.
- Chocolates: Chocolate prices vary widely, from $85 cents for a chocolate covered piece of candied ginger, to $4.00 for large truffles.
- Gift Baskets: Gift baskets start at $15, and can range up to $150 for the largest chocolate and tea selection combinations at holidays. We expect the average gift basket sale will be about $25.


| Sales Forecast | |||
| Year 1 | Year 2 | Year 3 | |
| Sales | |||
| Hot Teas | $52,400 | $62,000 | $66,000 |
| Iced Teas | $22,400 | $24,000 | $25,500 |
| Pastries | $14,400 | $15,000 | $16,000 |
| Chocolate | $88,000 | $92,000 | $100,000 |
| Tea Paraphernalia | $3,000 | $3,200 | $3,400 |
| Gift Baskets | $3,895 | $4,000 | $4,200 |
| Loose Teas | $10,150 | $10,920 | $13,104 |
| Total Sales | $194,245 | $211,120 | $228,204 |
| Direct Cost of Sales | Year 1 | Year 2 | Year 3 |
| Hot Teas | $15,720 | $18,600 | $18,480 |
| Iced Teas | $7,168 | $7,680 | $7,650 |
| Pastries | $9,504 | $9,900 | $10,240 |
| Chocolate | $39,600 | $41,400 | $43,000 |
| Tea Paraphernalia | $1,500 | $1,600 | $1,666 |
| Gift Baskets | $1,558 | $1,600 | $1,596 |
| Loose Teas | $4,060 | $4,368 | $4,980 |
| Subtotal Direct Cost of Sales | $79,110 | $85,148 | $87,612 |
Management Summary
We are a small company owned and operated by Earl and Lady Grey, husband and wife, as a Limited Liability Corporation. Lady is the designer and marketer of the products, and Earl manages the store. As mentioned above, both partners have extensive experience in this and related industries, and will be leveraging their knowledge of tea purchasing, brewing, and marketing, as well as knowledge of running small upscale beverage business, to create success for Jasmine Teahouse.
Our management style reflects the participation of the owners; we are not very hierarchical, and encourage all employees to learn as much as possible about all aspects of the business. The company respects its community of co-workers, and will treat all workers well. As a family business, we understand that our teatenders, cleaners, and other help are not just workers; they are people with their own lives, personalities, and hopes. In such a small town, it is likely that many customers will know our part-time teatenders (probably local students and housewives) personally, so it is important to us that they enjoy their jobs and feel well-rewarded for their work.
6.1 Personnel Plan
The Personnel Plan chronicles the growth of the organization to approximately 4 employees in the first 3 years. Future years may require a few additional people besides those indicated, depending on the growth of the company.
| Personnel Plan | |||
| Year 1 | Year 2 | Year 3 | |
| Earl Grey | $24,000 | $30,000 | $35,000 |
| Lady Grey | $6,000 | $12,000 | $14,000 |
| Part-time tea-tenders | $13,600 | $14,000 | $14,500 |
| Total People | 4 | 4 | 4 |
| Total Payroll | $43,600 | $56,000 | $63,500 |
Financial Plan
Our Financial Plan is based on sound research into similar businesses in similar communities, and cost estimates obtained for equipment, rent, and other operating expenses. As an owner-operated business, we have some leeway in adjusting our own compensation if sales are low in a given month, but our forecasts are conservative. Our top financial priorities in the first three years are repaying our long-term loan, paying our employees fairly, covering our expenses on time, and generating a modest profit.
We are opening this shop because we love tea, we love tea drinkers, and we will enjoy all the hard work we must do to maintain the business. We do not expect to get rich doing this, but we do anticipate steadily increasing profits and net worth as Jasmine Teahouse becomes well-known and establishes a loyal clientele.
Sales growth will be aggressive the first 18 months as we sharpen our merchandise assortment, size scales, and stock levels to better meet our customer’s requirements. We anticipate a sales increase of roughly 10% during our second year of operation.
Marketing expenses are budgeted at approximately 3% of total sales.
We will invest residual profits into reducing debt.
Company expansion, while not a necessity, will be an option if sales projections are met and/or exceeded. The location we have chosen contains an additional area we can annex for extra seating if and when it becomes necessary, for a small additional rental charge.
7.1 Important Assumptions
Tax and interest rate assumptions for this plan are on the following table. In addition, there are some non-financial assumptions guiding our forecasts. We assume:
- No other teahouses opening in Simsbury in the next year. (A safe assumption)
- A continued gradual increase in the population and socio-economic class of the Simsbury area.
- Continued tourist interest in our area.
- Increasing consumer interest in tea and other “health” foods.
- That premium chocolates will continue to symbolize luxury and romance as gift choices.
| General Assumptions | |||
| Year 1 | Year 2 | Year 3 | |
| Plan Month | 1 | 2 | 3 |
| Current Interest Rate | 9.50% | 9.50% | 9.50% |
| Long-term Interest Rate | 9.25% | 9.25% | 9.25% |
| Tax Rate | 30.00% | 30.00% | 30.00% |
| Other | 0 | 0 | 0 |
7.2 Break-even Analysis
Our break-even analysis is based on our cost and price structure for the first year. As we grow, the fixed costs will grow in proportion to the number of employees. We should surpass our Break-even point early on.

| Break-even Analysis | |
| Monthly Revenue Break-even | $11,612 |
| Assumptions: | |
| Average Percent Variable Cost | 41% |
| Estimated Monthly Fixed Cost | $6,883 |
7.3 Projected Profit and Loss
The following table shows our profit and loss projections for the next three years. We will become profitable early in the first year, with net profits continuing to rise as sales increase. Sales and Marketing expenses include the costs of all advertisements, plus promotions like the monthly tastings and 1/2 off coupons for tourists. Depreciation reflects a straight-line depreciation of our long-term assets over 10 years.


| Pro Forma Profit and Loss | |||
| Year 1 | Year 2 | Year 3 | |
| Sales | $194,245 | $211,120 | $228,204 |
| Direct Cost of Sales | $79,110 | $85,148 | $87,612 |
| Other Costs of Goods | $0 | $0 | $0 |
| Total Cost of Sales | $79,110 | $85,148 | $87,612 |
| Gross Margin | $115,135 | $125,972 | $140,592 |
| Gross Margin % | 59.27% | 59.67% | 61.61% |
| Expenses | |||
| Payroll | $43,600 | $56,000 | $63,500 |
| Marketing/Promotion | $5,400 | $6,000 | $6,000 |
| Depreciation | $1,380 | $1,380 | $1,380 |
| Rent | $18,000 | $19,000 | $20,000 |
| Utilities | $8,010 | $8,200 | $8,600 |
| Monthly disposable supplies | $1,200 | $1,200 | $1,200 |
| Insurance | $5,000 | $5,000 | $5,000 |
| Payroll Taxes | $0 | $0 | $0 |
| Other | $0 | $0 | $0 |
| Total Operating Expenses | $82,590 | $96,780 | $105,680 |
| Profit Before Interest and Taxes | $32,545 | $29,192 | $34,912 |
| EBITDA | $33,925 | $30,572 | $36,292 |
| Interest Expense | $4,513 | $3,721 | $2,894 |
| Taxes Incurred | $8,410 | $7,641 | $9,606 |
| Net Profit | $19,622 | $17,830 | $22,413 |
| Net Profit/Sales | 10.10% | 8.45% | 9.82% |
7.4 Projected Cash Flow
Our projected cash flow is outlined in the following chart and table. The table shows our planned loan principal repayment. We will be responsible for collecting and repaying sales tax at the 6% rate charged by Connecticut.

| Pro Forma Cash Flow | |||
| Year 1 | Year 2 | Year 3 | |
| Cash Received | |||
| Cash from Operations | |||
| Cash Sales | $194,245 | $211,120 | $228,204 |
| Subtotal Cash from Operations | $194,245 | $211,120 | $228,204 |
| Additional Cash Received | |||
| Sales Tax, VAT, HST/GST Received | $11,655 | $12,667 | $13,692 |
| New Current Borrowing | $0 | $0 | $0 |
| New Other Liabilities (interest-free) | $0 | $0 | $0 |
| New Long-term Liabilities | $0 | $0 | $0 |
| Sales of Other Current Assets | $0 | $0 | $0 |
| Sales of Long-term Assets | $0 | $0 | $0 |
| New Investment Received | $0 | $0 | $0 |
| Subtotal Cash Received | $205,900 | $223,787 | $241,896 |
| Expenditures | Year 1 | Year 2 | Year 3 |
| Expenditures from Operations | |||
| Cash Spending | $43,600 | $56,000 | $63,500 |
| Bill Payments | $117,261 | $135,040 | $140,758 |
| Subtotal Spent on Operations | $160,861 | $191,040 | $204,258 |
| Additional Cash Spent | |||
| Sales Tax, VAT, HST/GST Paid Out | $11,655 | $12,667 | $13,692 |
| Principal Repayment of Current Borrowing | $0 | $0 | $0 |
| Other Liabilities Principal Repayment | $0 | $0 | $0 |
| Long-term Liabilities Principal Repayment | $8,938 | $8,938 | $8,938 |
| Purchase Other Current Assets | $0 | $0 | $0 |
| Purchase Long-term Assets | $0 | $0 | $0 |
| Dividends | $0 | $0 | $0 |
| Subtotal Cash Spent | $181,453 | $212,645 | $226,888 |
| Net Cash Flow | $24,446 | $11,142 | $15,008 |
| Cash Balance | $39,446 | $50,589 | $65,597 |
7.5 Projected Balance Sheet
All of our tables will be updated monthly to reflect past performance and future assumptions. Future assumptions will not be based on past performance but rather economic cycle activity, regional industry strength, and future cash flow possibilities. We expect solid growth in Jasmine Teahouse beyond the year 2005.
The accompanying pro forma Balance Sheet shows our steadily increasing net worth, as we pay off our loans.
| Pro Forma Balance Sheet | |||
| Year 1 | Year 2 | Year 3 | |
| Assets | |||
| Current Assets | |||
| Cash | $39,446 | $50,589 | $65,597 |
| Inventory | $7,400 | $7,964 | $8,195 |
| Other Current Assets | $6,605 | $6,605 | $6,605 |
| Total Current Assets | $53,451 | $65,158 | $80,397 |
| Long-term Assets | |||
| Long-term Assets | $13,808 | $13,808 | $13,808 |
| Accumulated Depreciation | $1,380 | $2,760 | $4,140 |
| Total Long-term Assets | $12,428 | $11,048 | $9,668 |
| Total Assets | $65,879 | $76,206 | $90,065 |
| Liabilities and Capital | Year 1 | Year 2 | Year 3 |
| Current Liabilities | |||
| Accounts Payable | $9,782 | $11,217 | $11,601 |
| Current Borrowing | $0 | $0 | $0 |
| Other Current Liabilities | $0 | $0 | $0 |
| Subtotal Current Liabilities | $9,782 | $11,217 | $11,601 |
| Long-term Liabilities | $44,695 | $35,757 | $26,819 |
| Total Liabilities | $54,477 | $46,974 | $38,420 |
| Paid-in Capital | $10,330 | $10,330 | $10,330 |
| Retained Earnings | ($18,550) | $1,072 | $18,902 |
| Earnings | $19,622 | $17,830 | $22,413 |
| Total Capital | $11,402 | $29,232 | $51,645 |
| Total Liabilities and Capital | $65,879 | $76,206 | $90,065 |
| Net Worth | $11,402 | $29,232 | $51,645 |
7.6 Business Ratios
Business ratios for the next three years are shown below. Industry profile ratios based on the Standard Industrial Classification (SIC) code 5812, Eating Places (including cafes and tearooms), are shown for comparison.
The following table outlines some of the more important ratios from the Eating Places industry. The final column, Industry Profile, details specific ratios based on the industry as it is classified by the Standard Industry Classification (SIC) code, 5812.
| Ratio Analysis | ||||
| Year 1 | Year 2 | Year 3 | Industry Profile | |
| Sales Growth | 0.00% | 8.69% | 8.09% | 5.24% |
| Percent of Total Assets | ||||
| Inventory | 11.23% | 10.45% | 9.10% | 2.72% |
| Other Current Assets | 10.03% | 8.67% | 7.33% | 32.59% |
| Total Current Assets | 81.14% | 85.50% | 89.27% | 41.88% |
| Long-term Assets | 18.86% | 14.50% | 10.73% | 58.12% |
| Total Assets | 100.00% | 100.00% | 100.00% | 100.00% |
| Current Liabilities | 14.85% | 14.72% | 12.88% | 21.75% |
| Long-term Liabilities | 67.84% | 46.92% | 29.78% | 29.17% |
| Total Liabilities | 82.69% | 61.64% | 42.66% | 50.92% |
| Net Worth | 17.31% | 38.36% | 57.34% | 49.08% |
| Percent of Sales | ||||
| Sales | 100.00% | 100.00% | 100.00% | 100.00% |
| Gross Margin | 59.27% | 59.67% | 61.61% | 55.74% |
| Selling, General & Administrative Expenses | 52.78% | 52.47% | 50.50% | 37.46% |
| Advertising Expenses | 0.00% | 0.00% | 0.00% | 2.06% |
| Profit Before Interest and Taxes | 16.75% | 13.83% | 15.30% | 1.50% |
| Main Ratios | ||||
| Current | 5.46 | 5.81 | 6.93 | 0.81 |
| Quick | 4.71 | 5.10 | 6.22 | 0.51 |
| Total Debt to Total Assets | 82.69% | 61.64% | 42.66% | 53.68% |
| Pre-tax Return on Net Worth | 245.84% | 87.13% | 62.00% | 2.39% |
| Pre-tax Return on Assets | 42.55% | 33.42% | 35.55% | 5.16% |
| Additional Ratios | Year 1 | Year 2 | Year 3 | |
| Net Profit Margin | 10.10% | 8.45% | 9.82% | n.a |
| Return on Equity | 172.09% | 60.99% | 43.40% | n.a |
| Activity Ratios | ||||
| Inventory Turnover | 10.67 | 11.08 | 10.84 | n.a |
| Accounts Payable Turnover | 12.99 | 12.17 | 12.17 | n.a |
| Payment Days | 27 | 28 | 30 | n.a |
| Total Asset Turnover | 2.95 | 2.77 | 2.53 | n.a |
| Debt Ratios | ||||
| Debt to Net Worth | 4.78 | 1.61 | 0.74 | n.a |
| Current Liab. to Liab. | 0.18 | 0.24 | 0.30 | n.a |
| Liquidity Ratios | ||||
| Net Working Capital | $43,669 | $53,941 | $68,796 | n.a |
| Interest Coverage | 7.21 | 7.85 | 12.06 | n.a |
| Additional Ratios | ||||
| Assets to Sales | 0.34 | 0.36 | 0.39 | n.a |
| Current Debt/Total Assets | 15% | 15% | 13% | n.a |
| Acid Test | 4.71 | 5.10 | 6.22 | n.a |
| Sales/Net Worth | 17.04 | 7.22 | 4.42 | n.a |
| Dividend Payout | 0.00 | 0.00 | 0.00 | n.a |
Appendix
| Sales Forecast | |||||||||||||
| Month 1 | Month 2 | Month 3 | Month 4 | Month 5 | Month 6 | Month 7 | Month 8 | Month 9 | Month 10 | Month 11 | Month 12 | ||
| Sales | |||||||||||||
| Hot Teas | 0% | $1,500 | $2,500 | $3,000 | $3,000 | $3,200 | $4,000 | $6,000 | $6,200 | $6,500 | $6,000 | $5,500 | $5,000 |
| Iced Teas | 0% | $2,500 | $3,000 | $3,800 | $3,400 | $2,000 | $1,400 | $800 | $600 | $500 | $900 | $1,500 | $2,000 |
| Pastries | 0% | $1,200 | $1,200 | $1,200 | $1,200 | $1,200 | $1,200 | $1,200 | $1,200 | $1,200 | $1,200 | $1,200 | $1,200 |
| Chocolate | 0% | $3,000 | $5,000 | $8,000 | $7,000 | $7,000 | $7,000 | $7,000 | $7,000 | $14,000 | $7,000 | $9,000 | $7,000 |
| Tea Paraphernalia | 0% | $250 | $250 | $250 | $250 | $250 | $250 | $250 | $250 | $250 | $250 | $250 | $250 |
| Gift Baskets | 0% | $200 | $220 | $225 | $250 | $300 | $300 | $800 | $200 | $600 | $200 | $400 | $200 |
| Loose Teas | 0% | $600 | $500 | $500 | $600 | $700 | $950 | $1,100 | $1,000 | $1,000 | $1,100 | $1,000 | $1,100 |
| Total Sales | $9,250 | $12,670 | $16,975 | $15,700 | $14,650 | $15,100 | $17,150 | $16,450 | $24,050 | $16,650 | $18,850 | $16,750 | |
| Direct Cost of Sales | Month 1 | Month 2 | Month 3 | Month 4 | Month 5 | Month 6 | Month 7 | Month 8 | Month 9 | Month 10 | Month 11 | Month 12 | |
| Hot Teas | $450 | $750 | $900 | $900 | $960 | $1,200 | $1,800 | $1,860 | $1,950 | $1,800 | $1,650 | $1,500 | |
| Iced Teas | $800 | $960 | $1,216 | $1,088 | $640 | $448 | $256 | $192 | $160 | $288 | $480 | $640 | |
| Pastries | $792 | $792 | $792 | $792 | $792 | $792 | $792 | $792 | $792 | $792 | $792 | $792 | |
| Chocolate | $1,350 | $2,250 | $3,600 | $3,150 | $3,150 | $3,150 | $3,150 | $3,150 | $6,300 | $3,150 | $4,050 | $3,150 | |
| Tea Paraphernalia | $125 | $125 | $125 | $125 | $125 | $125 | $125 | $125 | $125 | $125 | $125 | $125 | |
| Gift Baskets | $80 | $88 | $90 | $100 | $120 | $120 | $320 | $80 | $240 | $80 | $160 | $80 | |
| Loose Teas | $240 | $200 | $200 | $240 | $280 | $380 | $440 | $400 | $400 | $440 | $400 | $440 | |
| Subtotal Direct Cost of Sales | $3,837 | $5,165 | $6,923 | $6,395 | $6,067 | $6,215 | $6,883 | $6,599 | $9,967 | $6,675 | $7,657 | $6,727 | |
| Personnel Plan | |||||||||||||
| Month 1 | Month 2 | Month 3 | Month 4 | Month 5 | Month 6 | Month 7 | Month 8 | Month 9 | Month 10 | Month 11 | Month 12 | ||
| Earl Grey | 0% | $2,000 | $2,000 | $2,000 | $2,000 | $2,000 | $2,000 | $2,000 | $2,000 | $2,000 | $2,000 | $2,000 | $2,000 |
| Lady Grey | 0% | $500 | $500 | $500 | $500 | $500 | $500 | $500 | $500 | $500 | $500 | $500 | $500 |
| Part-time tea-tenders | 0% | $1,000 | $1,000 | $1,000 | $1,000 | $1,000 | $1,400 | $1,400 | $1,000 | $1,400 | $1,000 | $1,400 | $1,000 |
| Total People | 3 | 3 | 3 | 3 | 3 | 4 | 4 | 3 | 4 | 3 | 4 | 4 | |
| Total Payroll | $3,500 | $3,500 | $3,500 | $3,500 | $3,500 | $3,900 | $3,900 | $3,500 | $3,900 | $3,500 | $3,900 | $3,500 | |
| General Assumptions | |||||||||||||
| Month 1 | Month 2 | Month 3 | Month 4 | Month 5 | Month 6 | Month 7 | Month 8 | Month 9 | Month 10 | Month 11 | Month 12 | ||
| Plan Month | 1 | 2 | 3 | 4 | 5 | 6 | 7 | 8 | 9 | 10 | 11 | 12 | |
| Current Interest Rate | 9.50% | 9.50% | 9.50% | 9.50% | 9.50% | 9.50% | 9.50% | 9.50% | 9.50% | 9.50% | 9.50% | 9.50% | |
| Long-term Interest Rate | 9.25% | 9.25% | 9.25% | 9.25% | 9.25% | 9.25% | 9.25% | 9.25% | 9.25% | 9.25% | 9.25% | 9.25% | |
| Tax Rate | 30.00% | 30.00% | 30.00% | 30.00% | 30.00% | 30.00% | 30.00% | 30.00% | 30.00% | 30.00% | 30.00% | 30.00% | |
| Other | 0 | 0 | 0 | 0 | 0 | 0 | 0 | 0 | 0 | 0 | 0 | 0 | |
| Pro Forma Profit and Loss | |||||||||||||
| Month 1 | Month 2 | Month 3 | Month 4 | Month 5 | Month 6 | Month 7 | Month 8 | Month 9 | Month 10 | Month 11 | Month 12 | ||
| Sales | $9,250 | $12,670 | $16,975 | $15,700 | $14,650 | $15,100 | $17,150 | $16,450 | $24,050 | $16,650 | $18,850 | $16,750 | |
| Direct Cost of Sales | $3,837 | $5,165 | $6,923 | $6,395 | $6,067 | $6,215 | $6,883 | $6,599 | $9,967 | $6,675 | $7,657 | $6,727 | |
| Other Costs of Goods | $0 | $0 | $0 | $0 | $0 | $0 | $0 | $0 | $0 | $0 | $0 | $0 | |
| Total Cost of Sales | $3,837 | $5,165 | $6,923 | $6,395 | $6,067 | $6,215 | $6,883 | $6,599 | $9,967 | $6,675 | $7,657 | $6,727 | |
| Gross Margin | $5,413 | $7,505 | $10,052 | $9,305 | $8,583 | $8,885 | $10,267 | $9,851 | $14,083 | $9,975 | $11,193 | $10,023 | |
| Gross Margin % | 58.52% | 59.23% | 59.22% | 59.27% | 58.59% | 58.84% | 59.87% | 59.88% | 58.56% | 59.91% | 59.38% | 59.84% | |
| Expenses | |||||||||||||
| Payroll | $3,500 | $3,500 | $3,500 | $3,500 | $3,500 | $3,900 | $3,900 | $3,500 | $3,900 | $3,500 | $3,900 | $3,500 | |
| Marketing/Promotion | $1,500 | $300 | $300 | $300 | $300 | $300 | $600 | $300 | $600 | $300 | $300 | $300 | |
| Depreciation | $115 | $115 | $115 | $115 | $115 | $115 | $115 | $115 | $115 | $115 | $115 | $115 | |
| Rent | $1,500 | $1,500 | $1,500 | $1,500 | $1,500 | $1,500 | $1,500 | $1,500 | $1,500 | $1,500 | $1,500 | $1,500 | |
| Utilities | $621 | $621 | $621 | $621 | $621 | $621 | $621 | $621 | $621 | $621 | $900 | $900 | |
| Monthly disposable supplies | $100 | $100 | $100 | $100 | $100 | $100 | $100 | $100 | $100 | $100 | $100 | $100 | |
| Insurance | $417 | $417 | $417 | $417 | $417 | $417 | $417 | $417 | $417 | $417 | $417 | $417 | |
| Payroll Taxes | 20% | $0 | $0 | $0 | $0 | $0 | $0 | $0 | $0 | $0 | $0 | $0 | $0 |
| Other | $0 | $0 | $0 | $0 | $0 | $0 | $0 | $0 | $0 | $0 | $0 | $0 | |
| Total Operating Expenses | $7,753 | $6,553 | $6,553 | $6,553 | $6,553 | $6,953 | $7,253 | $6,553 | $7,253 | $6,553 | $7,232 | $6,832 | |
| Profit Before Interest and Taxes | ($2,340) | $952 | $3,499 | $2,752 | $2,030 | $1,932 | $3,014 | $3,298 | $6,830 | $3,422 | $3,961 | $3,191 | |
| EBITDA | ($2,225) | $1,067 | $3,614 | $2,867 | $2,145 | $2,047 | $3,129 | $3,413 | $6,945 | $3,537 | $4,076 | $3,306 | |
| Interest Expense | $408 | $402 | $396 | $390 | $385 | $379 | $373 | $367 | $362 | $356 | $350 | $345 | |
| Taxes Incurred | ($824) | $165 | $931 | $709 | $494 | $466 | $792 | $879 | $1,941 | $920 | $1,083 | $854 | |
| Net Profit | ($1,923) | $385 | $2,172 | $1,653 | $1,152 | $1,087 | $1,849 | $2,052 | $4,528 | $2,146 | $2,528 | $1,993 | |
| Net Profit/Sales | -20.79% | 3.04% | 12.80% | 10.53% | 7.86% | 7.20% | 10.78% | 12.47% | 18.83% | 12.89% | 13.41% | 11.90% | |
| Pro Forma Cash Flow | |||||||||||||
| Month 1 | Month 2 | Month 3 | Month 4 | Month 5 | Month 6 | Month 7 | Month 8 | Month 9 | Month 10 | Month 11 | Month 12 | ||
| Cash Received | |||||||||||||
| Cash from Operations | |||||||||||||
| Cash Sales | $9,250 | $12,670 | $16,975 | $15,700 | $14,650 | $15,100 | $17,150 | $16,450 | $24,050 | $16,650 | $18,850 | $16,750 | |
| Subtotal Cash from Operations | $9,250 | $12,670 | $16,975 | $15,700 | $14,650 | $15,100 | $17,150 | $16,450 | $24,050 | $16,650 | $18,850 | $16,750 | |
| Additional Cash Received | |||||||||||||
| Sales Tax, VAT, HST/GST Received | 6.00% | $555 | $760 | $1,019 | $942 | $879 | $906 | $1,029 | $987 | $1,443 | $999 | $1,131 | $1,005 |
| New Current Borrowing | $0 | $0 | $0 | $0 | $0 | $0 | $0 | $0 | $0 | $0 | $0 | $0 | |
| New Other Liabilities (interest-free) | $0 | $0 | $0 | $0 | $0 | $0 | $0 | $0 | $0 | $0 | $0 | $0 | |
| New Long-term Liabilities | $0 | $0 | $0 | $0 | $0 | $0 | $0 | $0 | $0 | $0 | $0 | $0 | |
| Sales of Other Current Assets | $0 | $0 | $0 | $0 | $0 | $0 | $0 | $0 | $0 | $0 | $0 | $0 | |
| Sales of Long-term Assets | $0 | $0 | $0 | $0 | $0 | $0 | $0 | $0 | $0 | $0 | $0 | $0 | |
| New Investment Received | $0 | $0 | $0 | $0 | $0 | $0 | $0 | $0 | $0 | $0 | $0 | $0 | |
| Subtotal Cash Received | $9,805 | $13,430 | $17,994 | $16,642 | $15,529 | $16,006 | $18,179 | $17,437 | $25,493 | $17,649 | $19,981 | $17,755 | |
| Expenditures | Month 1 | Month 2 | Month 3 | Month 4 | Month 5 | Month 6 | Month 7 | Month 8 | Month 9 | Month 10 | Month 11 | Month 12 | |
| Expenditures from Operations | |||||||||||||
| Cash Spending | $3,500 | $3,500 | $3,500 | $3,500 | $3,500 | $3,900 | $3,900 | $3,500 | $3,900 | $3,500 | $3,900 | $3,500 | |
| Bill Payments | $124 | $3,870 | $8,353 | $13,013 | $9,840 | $9,544 | $10,222 | $11,969 | $10,762 | $18,814 | $7,471 | $13,279 | |
| Subtotal Spent on Operations | $3,624 | $7,370 | $11,853 | $16,513 | $13,340 | $13,444 | $14,122 | $15,469 | $14,662 | $22,314 | $11,371 | $16,779 | |
| Additional Cash Spent | |||||||||||||
| Sales Tax, VAT, HST/GST Paid Out | $555 | $760 | $1,019 | $942 | $879 | $906 | $1,029 | $987 | $1,443 | $999 | $1,131 | $1,005 | |
| Principal Repayment of Current Borrowing | $0 | $0 | $0 | $0 | $0 | $0 | $0 | $0 | $0 | $0 | $0 | $0 | |
| Other Liabilities Principal Repayment | $0 | $0 | $0 | $0 | $0 | $0 | $0 | $0 | $0 | $0 | $0 | $0 | |
| Long-term Liabilities Principal Repayment | $745 | $745 | $745 | $745 | $745 | $745 | $745 | $745 | $745 | $745 | $745 | $745 | |
| Purchase Other Current Assets | $0 | $0 | $0 | $0 | $0 | $0 | $0 | $0 | $0 | $0 | $0 | $0 | |
| Purchase Long-term Assets | $0 | $0 | $0 | $0 | $0 | $0 | $0 | $0 | $0 | $0 | $0 | $0 | |
| Dividends | $0 | $0 | $0 | $0 | $0 | $0 | $0 | $0 | $0 | $0 | $0 | $0 | |
| Subtotal Cash Spent | $4,924 | $8,875 | $13,616 | $18,199 | $14,964 | $15,094 | $15,896 | $17,201 | $16,850 | $24,057 | $13,247 | $18,528 | |
| Net Cash Flow | $4,881 | $4,555 | $4,377 | ($1,557) | $565 | $912 | $2,283 | $236 | $8,643 | ($6,408) | $6,734 | ($773) | |
| Cash Balance | $19,881 | $24,436 | $28,814 | $27,256 | $27,822 | $28,733 | $31,016 | $31,252 | $39,895 | $33,486 | $40,220 | $39,446 | |
| Pro Forma Balance Sheet | |||||||||||||
| Month 1 | Month 2 | Month 3 | Month 4 | Month 5 | Month 6 | Month 7 | Month 8 | Month 9 | Month 10 | Month 11 | Month 12 | ||
| Assets | Starting Balances | ||||||||||||
| Current Assets | |||||||||||||
| Cash | $15,000 | $19,881 | $24,436 | $28,814 | $27,256 | $27,822 | $28,733 | $31,016 | $31,252 | $39,895 | $33,486 | $40,220 | $39,446 |
| Inventory | $10,000 | $6,163 | $5,682 | $7,615 | $7,035 | $6,674 | $6,837 | $7,571 | $7,259 | $10,964 | $7,343 | $8,423 | $7,400 |
| Other Current Assets | $6,605 | $6,605 | $6,605 | $6,605 | $6,605 | $6,605 | $6,605 | $6,605 | $6,605 | $6,605 | $6,605 | $6,605 | $6,605 |
| Total Current Assets | $31,605 | $32,649 | $36,723 | $43,034 | $40,896 | $41,100 | $42,175 | $45,192 | $45,116 | $57,463 | $47,434 | $55,248 | $53,451 |
| Long-term Assets | |||||||||||||
| Long-term Assets | $13,808 | $13,808 | $13,808 | $13,808 | $13,808 | $13,808 | $13,808 | $13,808 | $13,808 | $13,808 | $13,808 | $13,808 | $13,808 |
| Accumulated Depreciation | $0 | $115 | $230 | $345 | $460 | $575 | $690 | $805 | $920 | $1,035 | $1,150 | $1,265 | $1,380 |
| Total Long-term Assets | $13,808 | $13,693 | $13,578 | $13,463 | $13,348 | $13,233 | $13,118 | $13,003 | $12,888 | $12,773 | $12,658 | $12,543 | $12,428 |
| Total Assets | $45,413 | $46,342 | $50,301 | $56,497 | $54,244 | $54,333 | $55,293 | $58,195 | $58,004 | $70,236 | $60,092 | $67,791 | $65,879 |
| Liabilities and Capital | Month 1 | Month 2 | Month 3 | Month 4 | Month 5 | Month 6 | Month 7 | Month 8 | Month 9 | Month 10 | Month 11 | Month 12 | |
| Current Liabilities | |||||||||||||
| Accounts Payable | $0 | $3,597 | $7,915 | $12,684 | $9,523 | $9,205 | $9,822 | $11,620 | $10,122 | $18,571 | $7,025 | $12,941 | $9,782 |
| Current Borrowing | $0 | $0 | $0 | $0 | $0 | $0 | $0 | $0 | $0 | $0 | $0 | $0 | $0 |
| Other Current Liabilities | $0 | $0 | $0 | $0 | $0 | $0 | $0 | $0 | $0 | $0 | $0 | $0 | $0 |
| Subtotal Current Liabilities | $0 | $3,597 | $7,915 | $12,684 | $9,523 | $9,205 | $9,822 | $11,620 | $10,122 | $18,571 | $7,025 | $12,941 | $9,782 |
| Long-term Liabilities | $53,633 | $52,888 | $52,143 | $51,399 | $50,654 | $49,909 | $49,164 | $48,419 | $47,674 | $46,930 | $46,185 | $45,440 | $44,695 |
| Total Liabilities | $53,633 | $56,485 | $60,059 | $64,083 | $60,176 | $59,114 | $58,986 | $60,040 | $57,796 | $65,501 | $53,210 | $58,381 | $54,477 |
| Paid-in Capital | $10,330 | $10,330 | $10,330 | $10,330 | $10,330 | $10,330 | $10,330 | $10,330 | $10,330 | $10,330 | $10,330 | $10,330 | $10,330 |
| Retained Earnings | ($18,550) | ($18,550) | ($18,550) | ($18,550) | ($18,550) | ($18,550) | ($18,550) | ($18,550) | ($18,550) | ($18,550) | ($18,550) | ($18,550) | ($18,550) |
| Earnings | $0 | ($1,923) | ($1,538) | $634 | $2,288 | $3,440 | $4,527 | $6,376 | $8,427 | $12,955 | $15,102 | $17,629 | $19,622 |
| Total Capital | ($8,220) | ($10,143) | ($9,758) | ($7,586) | ($5,932) | ($4,780) | ($3,693) | ($1,844) | $207 | $4,735 | $6,882 | $9,409 | $11,402 |
| Total Liabilities and Capital | $45,413 | $46,342 | $50,301 | $56,497 | $54,244 | $54,333 | $55,293 | $58,195 | $58,004 | $70,236 | $60,092 | $67,791 | $65,879 |
| Net Worth | ($8,220) | ($10,143) | ($9,758) | ($7,586) | ($5,932) | ($4,780) | ($3,693) | ($1,844) | $207 | $4,735 | $6,882 | $9,409 | $11,402 |


