
Tablature Tattoo
Executive Summary
Tablature Tattoo will open a small tattoo parlor in suburban Greenwood, NJ, where both tattoo newbies and collectors will be able to work with two established, talented artists. The business will provide small, introductory tattoos from existing designs, basic tattoos that can be executed in one hour, and full half-day sessions with the artists. The artists can offer extended consultations and custom design work with the customers as needed. The business will also sell a wide range of clothing items and posters featuring designs created by the two artists at the business. The founders, husband and wife Jake and Julie Hunt (a tattoo artist and retail administrator), seek a $10,000, three-year loan to launch the business.
The business needs only $22,200 to launch, due to the low capital requirements of the business and the intention to use low-cost marketing techniques and direct selling to find initial customers. This low startup cost and the high margins on tattoo work (around 75%) will lead to positive cash flow within 6 months and the ability to repay this loan easily, as well as provide impressive dividends to the owners and a generous salary to the additional freelance artist contracted by the business. Sales will exceed $300,000 by the third year based on the full-time work of these three individuals.

Objectives
Tablature Tattoo will meet the following objectives over its first three years of operation:
- Reach annual revenues of approximately $330,000 in year three
- Successfully create 5446 tattoos over three years
- Earn net profits for the owners, for significant total compensation to the two owners including salaries and dividends
Mission
Tablature Tattoo will create safe, impressive tattoo art for customers in the Greenwood, NJ area both through tattoos and through other products featuring art by the shop’s tattoo artists. The business seeks to create a full-time livelihood for Jack and Julie Hunt, the owners, while sharing revenue generously with an additional employed artist who will help to build the business.
Keys to Success
Keys to success in the tattoo shop business include:
- Encouraging repeat customers (collectors) who return again and again for full sessions with artists they love
- Making the health and care of customers and tattoos a top priority to ensure the safety of the customers, employees, and business
- Working with talented artists and encouraging their expression and freedom
Company Summary
Tablature Tattoo, to be located in Greenwood, New Jersey within a centrally-located major route strip mall, will be launched in 2010. The business will be founded and run by Jake Hunt, an experienced tattoo artist, and his wife, Julie Hunt, who has retail administrative experience. A second tattoo artist will be hired to expand the options for customers and to make better use of the company’s resources. The business will provide color tattoos both from original designs by the artists and basic public domain designs. Original designs which are considered the best by the artists and the customers will be printed onto t-shirts, posters, and other resale items and sold through the shop as well with Tablature Tattoo branding and signatures by the artists. Customers will include both those new to tattoos and tattoo collectors, all predominantly between the ages of 20 and 40.
Company Ownership
The business is established as a limited liability partnership between Jake and Julie Hunt with 51% ownership by Jake Hunt and 49% ownership by Julie Hunt.
Start-up Summary
Start-up expenses for Tablature Tattoo are limited. Licenses and permits include a building permit for renovation on the space, business licenses, health department permit, occupancy permit, and signage permit. Business cards and flyers include enough business cards for two years for the two tattoo artists and flyers advertising the grand opening to be distributed and posted in the area. Insurance will be secured from Tribal Ink-surance or another tattoo shop insurance provider. This offers liability of $500,000, property of $10,000, and additional insurance for the landlord. Rent is for one month for renovation of the location prior to opening. The location will be in a strip mall in Greenwood and will feature an open space for reception, waiting room and two tattoo stations, a sterilization room, a small office space, and a single bathroom. The owners will seek a space requiring minimal or no renovation to achieve this layout.
Computer software includes a basic calendar/scheduling program, inventory program, and accounting software (basic QuickBooks). Website development is for the creation of a basic website and grand opening advertisements include small ads in local papers in the weeks preceding the opening. Tattoo supplies include chemicals (sterilizers, antiseptics, disinfectants, ointments and soap), paper products, linens, towels, gloves, and skin marking supplies (thermofax, stencil paper, pens, skin scribes).
Assets required include the cash needed to reach cash flow break-even. Start-up inventory includes the inks and dyes needed to stock the store for launch. Other current assets includes a security deposit for the shop location.
Long-term assets include signage for the exterior of the shop, reception area items (a reception desk, chair, laptop, credit card reader, cash register, phone), tattoo station equipment (two tattoo chairs, mirrors, lights, tool box, sharps container, covered trash bin), waiting area furniture (loveseat, coffee table, two binders for flash art), a sound system (speakers and iPod dock), a digital camera, office equipment (printer/scanner/copier, phone), and sterilization room equipment (ultrasonic unit, autoclave, sterilization pouches).

| Start-up | |
| Requirements | |
| Start-up Expenses | |
| Licenses and Permits | $2,000 |
| Business Cards and Flyers | $1,000 |
| Insurance | $1,200 |
| Rent | $1,500 |
| Computer Software | $500 |
| Website Development | $1,000 |
| Grand Opening Advertisements | $500 |
| Tattoo Supplies | $1,000 |
| Total Start-up Expenses | $8,700 |
| Start-up Assets | |
| Cash Required | $9,800 |
| Start-up Inventory | $2,000 |
| Other Current Assets | $1,500 |
| Long-term Assets | $5,000 |
| Total Assets | $18,300 |
| Total Requirements | $27,000 |
Products and Services
Tablature Tattoo will provide the following services to customers:
- Introductory/shop-minimum tattoos
- Basic tattoos (~1 hour session)
- Full sessions (2-6 hour sessions)
Introductory tattoos are for those who are new to tattoos. They are basic, small designs by the artists or standard public-domain designs. Custom designs cannot be provided as an introductory tattoo. These tattoos can generally be finished in 45 minutes and with a minimum amount of consultation with the client. For many customers who get a small tattoo, it may be the only tattoo they ever receive. Some do convert to get more tattoos in the future. Those who are more adventurous and who intend to collect tattoos will often choose the other services. The price for an introductory tattoo will be $60 at launch.
Basic tattoos offer some consultation with the client, a wider number of colors, and about an hour of work with an artist. These are not generally custom-designed tattoos, but may include some customization of existing designs. The price for this service will be $100 at launch.
Full sessions allow creative freedom for the artist to create customization of a design or an original design for a customer and freedom for the customer to know that there is a ceiling on the price he or she will pay. The price for these sessions will be $300 at launch.
Clients can view binders of the flash art (photos and images of designs by the artists and public domain designs they can work from) while sitting on the couch in the shop’s waiting area. Julie can discuss options and prices with the customers if the artists are working with customers at the moment.

Tablature Tattoo will also sell branded products in the store with designs created by the shop’s tattoo artists. These include t-shirts, hoodies, bags, caps, posters, and potentially other items. The artists will choose their best and most popular designs four times a year and have runs of these items printed. Short runs will be printed, allowing the business to respond to customer preference based on what sells (both the types of items and the types of designs). The items will be sold for an average of $20, which will vary depending on the type of item. Each item will contain the Tablature Tattoo logo and can be signed by the tattoo artist if desired.
Market Analysis Summary
Tattoos are no longer sought out only by fringes of the market. A fall 2006 survey by the Pew Research Center found that 36% of Americans aged 18 to 25, and 40% of those ages 26 to 40, have at least one tattoo. In a working-class town like Greenwood, NJ, these numbers may be higher.
Some other statistics about the market:
- The National Geographic News stated in April 2000 that 15% of all Americans were tattooed (or approximately 40 million people)
- Esquire Magazine estimated in March 2002 that 1 in 8 Americans (12%) was tattooed.
- A 2003 Harris Poll found that 16% of all adults have at least one tattoo.
- The highest incidence of tattoos was found among the gay, lesbian and bisexual population (31%) and among Americans ages 25 to 29 years (36%) and 30 to 39 years (28%). Regionally, people living in the West (20%) are more likely to have tattoos.
- Democrats are more likely to have tattoos (18%) than Republicans (14%) and Independents (12%) while nearly equal percentages of males (16%) and females (15%) have tattoos.
The market is segmented into:
- Tattoo newbies or dabblers (those who get one tattoo)
- Tattoo collectors (those who get numerous tattoos)
Market Segmentation
The market segments in the Greenwood, NJ area include residents of Greenwood and surrounding towns who may travel to Tablature Tattoo. Collectors who like the work of the artists featured at Tablature Tattoo are especially likely to do this, making this number 10,000 individuals.
Tattoo newbies: May seek out a tattoo for the experience of receiving it, to simply say they’ve done it, to commemorate a specific relationship or affiliation, or for the danger associated with it or with those who have tattoos. These individuals may become tattoo collectors, but most simply get one tattoo in their life, especially in their younger years (late teens or twenties). The popularity of tattoos among celebrities also further encourages this group to get tattoos.
Tattoo collectors: This group connects with the lifestyle associated with having tattoos. Many seek to cover large portions of their body with tattoos. This group will appreciate the work of specific artists and seek them out again. This group will seek custom designs, eschew standard, simple designs, and become used to the pain or discomfort involved.

| Market Analysis | |||||||
| Year 1 | Year 2 | Year 3 | Year 4 | Year 5 | |||
| Potential Customers | Growth | CAGR | |||||
| Tattoo Newbies | 4% | 30,000 | 31,200 | 32,448 | 33,746 | 35,096 | 4.00% |
| Tatoo Collectors | 4% | 10,000 | 10,400 | 10,816 | 11,249 | 11,699 | 4.00% |
| Total | 4.00% | 40,000 | 41,600 | 43,264 | 44,995 | 46,795 | 4.00% |
Target Market Segment Strategy
Tablature Tattoo will seek to serve both of these key market segments in order to remain viable. Serving tattoo collectors alone may not yield a large enough market. Furthermore, it is difficult to inspire new tattoo collectors in the area without first serving tattoo newbies with introductory tattoos. The business will seek out both markets by advertising both its introductory designs and the elaborate design work they are capable of. The shop will be appropriate for tattoo collectors, with entertaining music playing and products available for sale.
Service Business Analysis
There are an estimated 20,000+ parlors operating in the United States, according to a U.S. News & World Report article, which said, on the average, an establishment is being added in the country every day. This translates into a tattoo parlor for at least every 10,000 adult Americans. The article ranked tattooing as the sixth fastest growing retail venture of the 1990s, right behind Internet, paging services, bagels, computer and cellular phone service.
Tattoo shops are generally independent ventures run by tattoo artists. Some feature just one artist and some feature a number of them (three or four is common). Generally, tattoo artists do not want to work for owners who are not artists themselves. The artists are generally freelance contractors working on 1099 and controlling their own hours and schedules, which is in keeping with the freedom they desire. However, tattoo studios are under increasing legal pressure from tax authorities to reclassify these artists as employees as most work primarily in one studio. $100 is a standard market rate for one hour with a tattoo artist and the artist generally makes 40-50% of that amount per hour. Customers are attracted through internet advertising and their websites, referrals and word-of-mouth.
In the Greenwood, NJ area, Tablature Tattoo will compete with:
- Target Tattoo: This shop is located in an area mall and focused on introductory tattoos and short sessions. It features a revolving door of artists, as artists generally have higher aspirations than working at a shop like this. However, its price of $50 for a basic tattoo is competitive.
- Rat-a-tat-tat: This shop features three successful artists focusing on tribal styles. This limitation of the store gives it a successful niche, but turns away customers who are interested in a wider range of styles.
Competition and Buying Patterns
In choosing between competitors, those seeking tattoos consider:
- The body of work of the artist – Beginning with the tattoos on the body of the artist (if a customer doesn’t like these designs and the taste of the artist, he or she may have second thoughts) and including the flash art created by the artist
- Comfort talking to the artist – Customers want to know that their wishes are understood and that the artist will work towards the goal they want and not their own ends.
- Price – Customers are often bargain hunters, and it is up to the tattoo artist to explain the safety precautions taken and experience he or she has which explains the price charged. When customers understand that a higher price sometimes means no shortcuts are being taken, they may feel more comfortable and price becomes less of a concern. Of these concerns, price is more of a concern for tattoo newbies than collectors.
Strategy and Implementation Summary
Tablature Tattoo seeks to follow a strategy of appealing to both new tattoo customers and tattoo collectors by creating an environment and products/services desirable to both groups. Through this strategy, the business intends to convert local customers who may only seek one tattoo initially to become repeat customers. The business will do this by:
- Offering competitively-priced introductory tattoos to encourage “tattoo newbies”
- Retaining high-quality artists to retain tattoo collectors
- Offering a wide range of custom designs in different styles to broaden appeal
- Selling additional products with designs by the tattoo artists to build an additional revenue stream
Competitive Edge
Tablature Tattoo will create a competitive edge through the cultivation and retention of its most valuable assets – its artists. Jake Hunt will be tied to the business as an owner and the second artist will be well rewarded for his or her work through open-ended shares in revenues generated through his or her designed products and commissions on tattoos. By not having to worry about overhead, rent, establishing a brand, purchasing basic supplies, or other business concerns, this will be a perfect situation for a tattoo artist who wants to focus on his or her art, establish job security and establish a client base with limited risk.
Marketing Strategy
The marketing strategy of the business involves marketing to a wide range of potential customers in the Greenwood area. The following tactics will be used prior to launch:
- Print 1,000 flyers advertising the grand opening of the business to post in the area of the shop, at local establishments and hand out at events and on the street in the preceding week.
- Create a basic website with contact information and directions, the prices for services, pages with galleries of art of the two artists, and images of products for sale in the shop and prices
- List the website on search engines, local business databases, tattoo shop databases and the Yellow Pages
- The principals and additional artist handing out business cards and wearing Tablature Tattoo shirts to promote the opening
- Running ads in the local papers about the grand opening
- The artists calling their rolodexes of previous clients (collectors) to tell them about the new business and encourage them to come back
The grand opening, a five-day event, will consist of a promotion giving introductory tattoos at 25% off ($45).
Ongoing marketing work will include:
- Continuing to hand out business cards
- Printing flyers periodically promoting discounts and new products and posting them in the area
- Maintaining the website with new products and art
Sales Strategy
Sales will be encouraged through word-of-mouth. Clients will be given a few business cards to hand out to friends when they talk about their new tattoo and client information will be retained. The artists will also remind customers about products featuring their designs which are being offered and can give these products for discounts or free to collectors who return for a number of tattoos.
Beyond in-store sales efforts, the artists will promote their work at parties, events, and while on the street, by wearing Tablature Tattoo shirts often and handing out business cards to people they meet.
Ensuring health and customer satisfaction will also be a sales strategy. Each customer will be called by the receptionist after a week to check in on how the tattoo is healing and to thank them again.
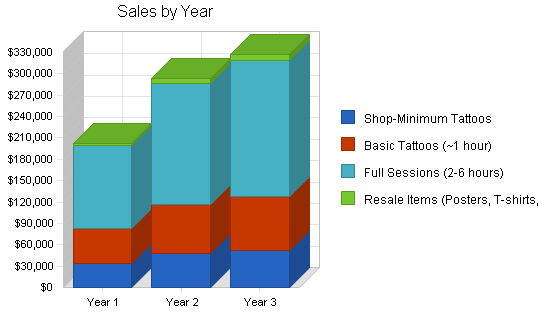
Sales Forecast
The cost of sales for the services offered is 8% for shop-minimum tattoos, 7% for basic tattoos, and 6% for full sessions, as ink and supplies becomes less of a cost as the longer sessions involve more preliminary design work and less “ink per hour.” Resale items are projected at 40% cost of sales on average. Cost of sales will also include a pamphlet on tattoo care given to each customer. This pamphlet will be purchased from an industry provider.
Resale items are not expected to sell until after tattoo business begins, as buyers will be those who have had tattoos from the artists and appreciate their designs. Full sessions will grow faster than other areas as the artists gain reputation in the community for more elaborate work.
The sales forecast represents an amount of work that is reasonable for two full-time artists, while allowing time for them to work on flash art, create designs for other resale items, and manage and market the business.

| Sales Forecast | |||
| Year 1 | Year 2 | Year 3 | |
| Unit Sales | |||
| Shop-Minimum Tattoos | 558 | 756 | 794 |
| Basic Tattoos (~1 hour) | 492 | 655 | 688 |
| Full Sessions (2-6 hours) | 387 | 539 | 577 |
| Resale Items (Posters, T-shirts, etc.) | 184 | 340 | 357 |
| Total Unit Sales | 1,621 | 2,290 | 2,416 |
| Unit Prices | Year 1 | Year 2 | Year 3 |
| Shop-Minimum Tattoos | $60.00 | $63.00 | $66.15 |
| Basic Tattoos (~1 hour) | $100.00 | $105.00 | $110.25 |
| Full Sessions (2-6 hours) | $300.00 | $315.00 | $330.75 |
| Resale Items (Posters, T-shirts, etc.) | $20.00 | $21.00 | $22.05 |
| Sales | |||
| Shop-Minimum Tattoos | $33,480 | $47,628 | $52,510 |
| Basic Tattoos (~1 hour) | $49,200 | $68,796 | $75,848 |
| Full Sessions (2-6 hours) | $116,100 | $169,873 | $190,853 |
| Resale Items (Posters, T-shirts, etc.) | $3,681 | $7,137 | $7,868 |
| Total Sales | $202,461 | $293,434 | $327,078 |
| Direct Unit Costs | Year 1 | Year 2 | Year 3 |
| Shop-Minimum Tattoos | $4.80 | $5.04 | $5.29 |
| Basic Tattoos (~1 hour) | $7.00 | $7.35 | $7.72 |
| Full Sessions (2-6 hours) | $18.00 | $18.90 | $19.85 |
| Resale Items (Posters, T-shirts, etc.) | $8.00 | $8.40 | $8.82 |
| Direct Cost of Sales | |||
| Shop-Minimum Tattoos | $2,678 | $3,810 | $4,201 |
| Basic Tattoos (~1 hour) | $3,444 | $4,816 | $5,309 |
| Full Sessions (2-6 hours) | $6,966 | $10,192 | $11,451 |
| Resale Items (Posters, T-shirts, etc.) | $1,472 | $2,855 | $3,147 |
| Subtotal Direct Cost of Sales | $14,561 | $21,673 | $24,109 |
Milestones
The milestones table details the marketing activities described in the marketing strategy summary. These activities are undertaken with a high focus on using low-cost or free marketing methods to promote the launch of the business. Julie Hunt will manage all marketing activities and Jake Hunt will promote the business directly by contacting clients, networking, and posting/handing out flyers and business cards.

| Milestones | |||||
| Milestone | Start Date | End Date | Budget | Manager | Department |
| Print Flyers | 2/1/2010 | 2/15/2010 | $500 | Julie | Marketing |
| Create Ads | 2/1/2010 | 2/15/2010 | $0 | Julie | Marketing |
| Create Website | 2/1/2010 | 2/28/2010 | $0 | Julie | Marketing |
| Print Business Cards | 2/1/2010 | 2/15/2010 | $500 | Julie | Marketing |
| List Website | 3/1/2010 | 3/15/2010 | $1,000 | Julie | Marketing |
| Run Ads | 3/1/2010 | 3/15/2010 | $500 | Julie | Marketing |
| Post Flyers | 3/1/2010 | 3/15/2010 | $0 | Jake | Sales |
| Heavy Pre-Opening Promotion (Calls and Networking) | 3/15/2010 | 3/21/2010 | $0 | Jake | Sales |
| Grand Opening | 3/22/2010 | 3/26/2010 | $0 | Jake & Julie | Marketing |
| Regular Operations Begin | 3/29/2010 | 3/29/2010 | $0 | Julie | Operations |
| Totals | $2,500 | ||||
Management Summary
Jake Hunt will be CEO of Tablature Tattoo. He will be responsible for strategy, direct sales efforts, contracting and working with the employed second tattoo artist, and half of the tattoo services provided. He will be the final say on choosing designs for additional products.
Julie Hunt will be operations manager. She will be responsible for managing reception, purchasing supplies and managing inventory, answering phone and email inquiries, marketing efforts, bookkeeping and accounting, payroll, insurance, and other administrative requirements. She will order resale products from suppliers. She will work at the reception desk and in the office of the business as needed. Jake Hunt will fill in at reception when business is slow and Julie needs to work in the office, where the printer/copier is located.
Personnel Plan
Jake and Julie Hunt will both be compensated as employees for their work (Jake as tattoo artist and manager of products and Julie as administrator, financial officer, and head of marketing). Salaries shown for the principals include benefits.
The second tattoo artist brought into the company will start work at part-time hours and move quickly to full-time hours, but will have his or her pay tied directly to services rendered and received 40% commission on tattoos provided and designed products sold. Wages listed below for the second artist are based on an assumption of splitting the tattoo and design work equally between Jake and the second artist.
Jake Hunt will manage this artist and will seek an established artist with a body of work and clientele who values the ability to not have to deal with the overhead and business concerns which the Hunts will handle.
| Personnel Plan | |||
| Year 1 | Year 2 | Year 3 | |
| Jake Hunt | $49,500 | $55,000 | $60,500 |
| Julie Hunt | $46,200 | $49,500 | $52,800 |
| Second Artist | $40,492 | $58,687 | $65,416 |
| Total People | 3 | 3 | 3 |
| Total Payroll | $136,192 | $163,187 | $178,716 |
Financial Plan
The financial plan for Tablature Tattoo is to raise $27,000 from a combination of personal savings, a long-term loan, and short-term borrowing to launch the business. The business will achieve cash flow and profit break-even in the seventh month of operation and net profit will be achieved in the first year, allowing for dividends to be paid to the owners beyond their salaries starting in year two.
Start-up Funding
The start-up funding will be primarily from investment by the co-owners and founders, Julie and Jake Hunt, who will each contribute $7,500. They will borrow $2,000 on credit cards and seek a three-year loan of $10,000 for the remaining cash, with their home equity as collateral. This will cover the required $27,000 in funding needed to launch.
| Start-up Funding | |
| Start-up Expenses to Fund | $8,700 |
| Start-up Assets to Fund | $18,300 |
| Total Funding Required | $27,000 |
| Assets | |
| Non-cash Assets from Start-up | $8,500 |
| Cash Requirements from Start-up | $9,800 |
| Additional Cash Raised | $0 |
| Cash Balance on Starting Date | $9,800 |
| Total Assets | $18,300 |
| Liabilities and Capital | |
| Liabilities | |
| Current Borrowing | $2,000 |
| Long-term Liabilities | $10,000 |
| Accounts Payable (Outstanding Bills) | $0 |
| Other Current Liabilities (interest-free) | $0 |
| Total Liabilities | $12,000 |
| Capital | |
| Planned Investment | |
| Jake Hunt | $7,500 |
| Julie Hunt | $7,500 |
| Additional Investment Requirement | $0 |
| Total Planned Investment | $15,000 |
| Loss at Start-up (Start-up Expenses) | ($8,700) |
| Total Capital | $6,300 |
| Total Capital and Liabilities | $18,300 |
| Total Funding | $27,000 |
Important Assumptions
The table below presents assumptions used in the financial calculations of the business plan.
Break-even Analysis
The monthly break-even is shown below. The units break-even represents an average between the different business services and products and is not as helpful as a target.

| Break-even Analysis | |
| Monthly Units Break-even | 131 |
| Monthly Revenue Break-even | $16,386 |
| Assumptions: | |
| Average Per-Unit Revenue | $124.90 |
| Average Per-Unit Variable Cost | $8.98 |
| Estimated Monthly Fixed Cost | $15,207 |
Projected Profit and Loss
Gross margins will improve slightly as sales of full sessions increase relative to other services.
The marketing budget includes $150 per month to cover website hosting and maintenance and periodic runs of flyers or new business cards. Depreciation is for the long-term assets of the business over three years. Rent is $1,500 per month and utilities $150 per month (electricity, phone and internet). Insurance is not expected to rise significantly as the business will stay within its insurance bracket during this period. Payroll taxes of 15% and employee benefits of 10% (health insurance) are applied to payroll for the Hunts and the second artist’s wages. Tattoo supplies of $100 per month are anticipated to replenish items purchased before the launch. Inflationary increases are applied to most items and to prices charged to customers.


| Pro Forma Profit and Loss | |||
| Year 1 | Year 2 | Year 3 | |
| Sales | $202,461 | $293,434 | $327,078 |
| Direct Cost of Sales | $14,561 | $21,673 | $24,109 |
| Other | $0 | $0 | $0 |
| Total Cost of Sales | $14,561 | $21,673 | $24,109 |
| Gross Margin | $187,900 | $271,761 | $302,970 |
| Gross Margin % | 92.81% | 92.61% | 92.63% |
| Expenses | |||
| Payroll | $136,192 | $163,187 | $178,716 |
| Marketing/Promotion | $1,800 | $1,890 | $1,985 |
| Depreciation | $1,866 | $2,466 | $3,466 |
| Rent | $18,000 | $18,540 | $19,096 |
| Utilities | $1,800 | $1,854 | $1,910 |
| Insurance | $1,200 | $1,236 | $1,273 |
| Payroll Taxes | $20,429 | $24,478 | $26,807 |
| Tattoo Supplies | $1,200 | $1,200 | $1,200 |
| Total Operating Expenses | $182,487 | $214,851 | $234,452 |
| Profit Before Interest and Taxes | $5,413 | $56,910 | $68,517 |
| EBITDA | $7,279 | $59,376 | $71,983 |
| Interest Expense | $932 | $500 | $167 |
| Taxes Incurred | $1,344 | $16,923 | $20,505 |
| Net Profit | $3,137 | $39,487 | $47,846 |
| Net Profit/Sales | 1.55% | 13.46% | 14.63% |
Projected Cash Flow
The business will reach cash flow break-even mid-year, and be able to pay dividends in year two while keeping a cash balance of around $20,000 for unexpected needs. The short-term debt will be paid off in the first year and the long-term loan will be paid off over the first three years of operation. Some additional long-term assets (replacements of equipment and additional tools) will be purchased over these years as well.

| Pro Forma Cash Flow | |||
| Year 1 | Year 2 | Year 3 | |
| Cash Received | |||
| Cash from Operations | |||
| Cash Sales | $202,461 | $293,434 | $327,078 |
| Subtotal Cash from Operations | $202,461 | $293,434 | $327,078 |
| Additional Cash Received | |||
| Sales Tax, VAT, HST/GST Received | $16,197 | $23,475 | $26,166 |
| New Current Borrowing | $0 | $0 | $0 |
| New Other Liabilities (interest-free) | $0 | $0 | $0 |
| New Long-term Liabilities | $0 | $0 | $0 |
| Sales of Other Current Assets | $0 | $0 | $0 |
| Sales of Long-term Assets | $0 | $0 | $0 |
| New Investment Received | $0 | $0 | $0 |
| Subtotal Cash Received | $218,658 | $316,909 | $353,245 |
| Expenditures | Year 1 | Year 2 | Year 3 |
| Expenditures from Operations | |||
| Cash Spending | $136,192 | $163,187 | $178,716 |
| Bill Payments | $53,597 | $89,359 | $95,998 |
| Subtotal Spent on Operations | $189,790 | $252,546 | $274,714 |
| Additional Cash Spent | |||
| Sales Tax, VAT, HST/GST Paid Out | $16,197 | $23,475 | $26,166 |
| Principal Repayment of Current Borrowing | $2,000 | $0 | $0 |
| Other Liabilities Principal Repayment | $0 | $0 | $0 |
| Long-term Liabilities Principal Repayment | $3,336 | $3,333 | $3,331 |
| Purchase Other Current Assets | $0 | $0 | $0 |
| Purchase Long-term Assets | $600 | $1,200 | $1,200 |
| Dividends | $0 | $30,000 | $40,000 |
| Subtotal Cash Spent | $211,922 | $310,554 | $345,411 |
| Net Cash Flow | $6,736 | $6,355 | $7,833 |
| Cash Balance | $16,536 | $22,891 | $30,724 |
Projected Balance Sheet
The business will create a healthier position as it pays off its long-term and short-term debt, even while accounts payable will increase due to a greater volume of sales.
| Pro Forma Balance Sheet | |||
| Year 1 | Year 2 | Year 3 | |
| Assets | |||
| Current Assets | |||
| Cash | $16,536 | $22,891 | $30,724 |
| Inventory | $1,624 | $2,746 | $2,283 |
| Other Current Assets | $1,500 | $1,500 | $1,500 |
| Total Current Assets | $19,659 | $27,136 | $34,506 |
| Long-term Assets | |||
| Long-term Assets | $5,600 | $6,800 | $8,000 |
| Accumulated Depreciation | $1,866 | $4,332 | $7,798 |
| Total Long-term Assets | $3,734 | $2,468 | $202 |
| Total Assets | $23,393 | $29,604 | $34,708 |
| Liabilities and Capital | Year 1 | Year 2 | Year 3 |
| Current Liabilities | |||
| Accounts Payable | $7,292 | $7,349 | $7,939 |
| Current Borrowing | $0 | $0 | $0 |
| Other Current Liabilities | $0 | $0 | $0 |
| Subtotal Current Liabilities | $7,292 | $7,349 | $7,939 |
| Long-term Liabilities | $6,664 | $3,331 | $0 |
| Total Liabilities | $13,956 | $10,680 | $7,939 |
| Paid-in Capital | $15,000 | $15,000 | $15,000 |
| Retained Earnings | ($8,700) | ($35,563) | ($36,076) |
| Earnings | $3,137 | $39,487 | $47,846 |
| Total Capital | $9,437 | $18,924 | $26,770 |
| Total Liabilities and Capital | $23,393 | $29,604 | $34,708 |
| Net Worth | $9,437 | $18,924 | $26,770 |
Business Ratios
The business ratios here are compared against “other personal care services,” NAICS 812199, which includes tattoo parlors.
| Ratio Analysis | ||||
| Year 1 | Year 2 | Year 3 | Industry Profile | |
| Sales Growth | n.a. | 44.93% | 11.47% | -6.55% |
| Percent of Total Assets | ||||
| Inventory | 6.94% | 9.28% | 6.58% | 3.80% |
| Other Current Assets | 6.41% | 5.07% | 4.32% | 45.54% |
| Total Current Assets | 84.04% | 91.66% | 99.42% | 55.32% |
| Long-term Assets | 15.96% | 8.34% | 0.58% | 44.68% |
| Total Assets | 100.00% | 100.00% | 100.00% | 100.00% |
| Current Liabilities | 31.17% | 24.82% | 22.87% | 20.71% |
| Long-term Liabilities | 28.49% | 11.25% | 0.00% | 74.98% |
| Total Liabilities | 59.66% | 36.08% | 22.87% | 95.69% |
| Net Worth | 40.34% | 63.92% | 77.13% | 4.31% |
| Percent of Sales | ||||
| Sales | 100.00% | 100.00% | 100.00% | 100.00% |
| Gross Margin | 92.81% | 92.61% | 92.63% | 75.39% |
| Selling, General & Administrative Expenses | 91.26% | 79.16% | 78.00% | 30.08% |
| Advertising Expenses | 0.89% | 0.64% | 0.61% | 2.46% |
| Profit Before Interest and Taxes | 2.67% | 19.39% | 20.95% | 6.21% |
| Main Ratios | ||||
| Current | 2.70 | 3.69 | 4.35 | 1.46 |
| Quick | 2.47 | 3.32 | 4.06 | 1.28 |
| Total Debt to Total Assets | 59.66% | 36.08% | 22.87% | 95.69% |
| Pre-tax Return on Net Worth | 47.49% | 298.09% | 255.33% | 476.96% |
| Pre-tax Return on Assets | 19.16% | 190.55% | 196.93% | 20.53% |
| Additional Ratios | Year 1 | Year 2 | Year 3 | |
| Net Profit Margin | 1.55% | 13.46% | 14.63% | n.a |
| Return on Equity | 33.24% | 208.66% | 178.73% | n.a |
| Activity Ratios | ||||
| Inventory Turnover | 11.75 | 9.92 | 9.59 | n.a |
| Accounts Payable Turnover | 8.35 | 12.17 | 12.17 | n.a |
| Payment Days | 27 | 30 | 29 | n.a |
| Total Asset Turnover | 8.65 | 9.91 | 9.42 | n.a |
| Debt Ratios | ||||
| Debt to Net Worth | 1.48 | 0.56 | 0.30 | n.a |
| Current Liab. to Liab. | 0.52 | 0.69 | 1.00 | n.a |
| Liquidity Ratios | ||||
| Net Working Capital | $12,367 | $19,787 | $26,568 | n.a |
| Interest Coverage | 5.81 | 113.88 | 411.39 | n.a |
| Additional Ratios | ||||
| Assets to Sales | 0.12 | 0.10 | 0.11 | n.a |
| Current Debt/Total Assets | 31% | 25% | 23% | n.a |
| Acid Test | 2.47 | 3.32 | 4.06 | n.a |
| Sales/Net Worth | 21.45 | 15.51 | 12.22 | n.a |
| Dividend Payout | 0.00 | 0.76 | 0.84 | n.a |
Appendix
| Sales Forecast | |||||||||||||
| Month 1 | Month 2 | Month 3 | Month 4 | Month 5 | Month 6 | Month 7 | Month 8 | Month 9 | Month 10 | Month 11 | Month 12 | ||
| Unit Sales | |||||||||||||
| Shop-Minimum Tattoos | 35 | 37 | 39 | 41 | 43 | 45 | 47 | 49 | 51 | 54 | 57 | 60 | |
| Basic Tattoos (~1 hour) | 30 | 32 | 34 | 36 | 38 | 40 | 42 | 44 | 46 | 48 | 50 | 52 | |
| Full Sessions (2-6 hours) | 25 | 26 | 27 | 28 | 29 | 30 | 32 | 34 | 36 | 38 | 40 | 42 | |
| Resale Items (Posters, T-shirts, etc.) | 2 | 3 | 5 | 10 | 12 | 16 | 19 | 21 | 21 | 23 | 25 | 27 | |
| Total Unit Sales | 92 | 98 | 105 | 115 | 122 | 131 | 140 | 148 | 154 | 163 | 172 | 181 | |
| Unit Prices | Month 1 | Month 2 | Month 3 | Month 4 | Month 5 | Month 6 | Month 7 | Month 8 | Month 9 | Month 10 | Month 11 | Month 12 | |
| Shop-Minimum Tattoos | $60.00 | $60.00 | $60.00 | $60.00 | $60.00 | $60.00 | $60.00 | $60.00 | $60.00 | $60.00 | $60.00 | $60.00 | |
| Basic Tattoos (~1 hour) | $100.00 | $100.00 | $100.00 | $100.00 | $100.00 | $100.00 | $100.00 | $100.00 | $100.00 | $100.00 | $100.00 | $100.00 | |
| Full Sessions (2-6 hours) | $300.00 | $300.00 | $300.00 | $300.00 | $300.00 | $300.00 | $300.00 | $300.00 | $300.00 | $300.00 | $300.00 | $300.00 | |
| Resale Items (Posters, T-shirts, etc.) | $20.00 | $20.00 | $20.00 | $20.00 | $20.00 | $20.00 | $20.00 | $20.00 | $20.00 | $20.00 | $20.00 | $20.00 | |
| Sales | |||||||||||||
| Shop-Minimum Tattoos | $2,100 | $2,220 | $2,340 | $2,460 | $2,580 | $2,700 | $2,820 | $2,940 | $3,060 | $3,240 | $3,420 | $3,600 | |
| Basic Tattoos (~1 hour) | $3,000 | $3,200 | $3,400 | $3,600 | $3,800 | $4,000 | $4,200 | $4,400 | $4,600 | $4,800 | $5,000 | $5,200 | |
| Full Sessions (2-6 hours) | $7,500 | $7,800 | $8,100 | $8,400 | $8,700 | $9,000 | $9,600 | $10,200 | $10,800 | $11,400 | $12,000 | $12,600 | |
| Resale Items (Posters, T-shirts, etc.) | $40 | $60 | $100 | $200 | $244 | $310 | $381 | $412 | $427 | $463 | $503 | $539 | |
| Total Sales | $12,640 | $13,280 | $13,940 | $14,660 | $15,324 | $16,010 | $17,001 | $17,952 | $18,887 | $19,903 | $20,923 | $21,939 | |
| Direct Unit Costs | Month 1 | Month 2 | Month 3 | Month 4 | Month 5 | Month 6 | Month 7 | Month 8 | Month 9 | Month 10 | Month 11 | Month 12 | |
| Shop-Minimum Tattoos | 8.00% | $4.80 | $4.80 | $4.80 | $4.80 | $4.80 | $4.80 | $4.80 | $4.80 | $4.80 | $4.80 | $4.80 | $4.80 |
| Basic Tattoos (~1 hour) | 7.00% | $7.00 | $7.00 | $7.00 | $7.00 | $7.00 | $7.00 | $7.00 | $7.00 | $7.00 | $7.00 | $7.00 | $7.00 |
| Full Sessions (2-6 hours) | 6.00% | $18.00 | $18.00 | $18.00 | $18.00 | $18.00 | $18.00 | $18.00 | $18.00 | $18.00 | $18.00 | $18.00 | $18.00 |
| Resale Items (Posters, T-shirts, etc.) | 40.00% | $8.00 | $8.00 | $8.00 | $8.00 | $8.00 | $8.00 | $8.00 | $8.00 | $8.00 | $8.00 | $8.00 | $8.00 |
| Direct Cost of Sales | |||||||||||||
| Shop-Minimum Tattoos | $168 | $178 | $187 | $197 | $206 | $216 | $226 | $235 | $245 | $259 | $274 | $288 | |
| Basic Tattoos (~1 hour) | $210 | $224 | $238 | $252 | $266 | $280 | $294 | $308 | $322 | $336 | $350 | $364 | |
| Full Sessions (2-6 hours) | $450 | $468 | $486 | $504 | $522 | $540 | $576 | $612 | $648 | $684 | $720 | $756 | |
| Resale Items (Posters, T-shirts, etc.) | $16 | $24 | $40 | $80 | $98 | $124 | $152 | $165 | $171 | $185 | $201 | $216 | |
| Subtotal Direct Cost of Sales | $844 | $894 | $951 | $1,033 | $1,092 | $1,160 | $1,248 | $1,320 | $1,386 | $1,464 | $1,545 | $1,624 | |
| Personnel Plan | |||||||||||||
| Month 1 | Month 2 | Month 3 | Month 4 | Month 5 | Month 6 | Month 7 | Month 8 | Month 9 | Month 10 | Month 11 | Month 12 | ||
| Jake Hunt | $4,125 | $4,125 | $4,125 | $4,125 | $4,125 | $4,125 | $4,125 | $4,125 | $4,125 | $4,125 | $4,125 | $4,125 | |
| Julie Hunt | $3,850 | $3,850 | $3,850 | $3,850 | $3,850 | $3,850 | $3,850 | $3,850 | $3,850 | $3,850 | $3,850 | $3,850 | |
| Second Artist | 0% | $2,528 | $2,656 | $2,788 | $2,932 | $3,065 | $3,202 | $3,400 | $3,590 | $3,777 | $3,981 | $4,185 | $4,388 |
| Total People | 3 | 3 | 3 | 3 | 3 | 3 | 3 | 3 | 3 | 3 | 3 | 3 | |
| Total Payroll | $10,503 | $10,631 | $10,763 | $10,907 | $11,040 | $11,177 | $11,375 | $11,565 | $11,752 | $11,956 | $12,160 | $12,363 | |
| Pro Forma Profit and Loss | |||||||||||||
| Month 1 | Month 2 | Month 3 | Month 4 | Month 5 | Month 6 | Month 7 | Month 8 | Month 9 | Month 10 | Month 11 | Month 12 | ||
| Sales | $12,640 | $13,280 | $13,940 | $14,660 | $15,324 | $16,010 | $17,001 | $17,952 | $18,887 | $19,903 | $20,923 | $21,939 | |
| Direct Cost of Sales | $844 | $894 | $951 | $1,033 | $1,092 | $1,160 | $1,248 | $1,320 | $1,386 | $1,464 | $1,545 | $1,624 | |
| Other | $0 | $0 | $0 | $0 | $0 | $0 | $0 | $0 | $0 | $0 | $0 | $0 | |
| Total Cost of Sales | $844 | $894 | $951 | $1,033 | $1,092 | $1,160 | $1,248 | $1,320 | $1,386 | $1,464 | $1,545 | $1,624 | |
| Gross Margin | $11,796 | $12,386 | $12,989 | $13,627 | $14,232 | $14,850 | $15,753 | $16,632 | $17,502 | $18,439 | $19,378 | $20,316 | |
| Gross Margin % | 93.32% | 93.27% | 93.18% | 92.95% | 92.87% | 92.75% | 92.66% | 92.65% | 92.66% | 92.64% | 92.62% | 92.60% | |
| Expenses | |||||||||||||
| Payroll | $10,503 | $10,631 | $10,763 | $10,907 | $11,040 | $11,177 | $11,375 | $11,565 | $11,752 | $11,956 | $12,160 | $12,363 | |
| Marketing/Promotion | $150 | $150 | $150 | $150 | $150 | $150 | $150 | $150 | $150 | $150 | $150 | $150 | |
| Depreciation | $139 | $139 | $139 | $139 | $139 | $139 | $172 | $172 | $172 | $172 | $172 | $172 | |
| Rent | $1,500 | $1,500 | $1,500 | $1,500 | $1,500 | $1,500 | $1,500 | $1,500 | $1,500 | $1,500 | $1,500 | $1,500 | |
| Utilities | $150 | $150 | $150 | $150 | $150 | $150 | $150 | $150 | $150 | $150 | $150 | $150 | |
| Insurance | $0 | $0 | $0 | $0 | $0 | $0 | $0 | $0 | $0 | $0 | $0 | $1,200 | |
| Payroll Taxes | 15% | $1,575 | $1,595 | $1,614 | $1,636 | $1,656 | $1,677 | $1,706 | $1,735 | $1,763 | $1,793 | $1,824 | $1,854 |
| Tattoo Supplies | $100 | $100 | $100 | $100 | $100 | $100 | $100 | $100 | $100 | $100 | $100 | $100 | |
| Total Operating Expenses | $14,117 | $14,265 | $14,416 | $14,582 | $14,735 | $14,893 | $15,153 | $15,372 | $15,587 | $15,821 | $16,056 | $17,489 | |
| Profit Before Interest and Taxes | ($2,321) | ($1,878) | ($1,428) | ($955) | ($503) | ($43) | $600 | $1,260 | $1,914 | $2,618 | $3,323 | $2,826 | |
| EBITDA | ($2,182) | ($1,739) | ($1,289) | ($816) | ($364) | $96 | $772 | $1,432 | $2,086 | $2,790 | $3,495 | $2,998 | |
| Interest Expense | $104 | $99 | $94 | $89 | $84 | $79 | $75 | $70 | $65 | $60 | $58 | $56 | |
| Taxes Incurred | ($727) | ($593) | ($456) | ($313) | ($176) | ($37) | $157 | $357 | $555 | $767 | $979 | $831 | |
| Net Profit | ($1,697) | ($1,384) | ($1,065) | ($731) | ($411) | ($85) | $367 | $833 | $1,295 | $1,790 | $2,285 | $1,940 | |
| Net Profit/Sales | -13.43% | -10.42% | -7.64% | -4.98% | -2.68% | -0.53% | 2.16% | 4.64% | 6.85% | 8.99% | 10.92% | 8.84% | |
| Pro Forma Cash Flow | |||||||||||||
| Month 1 | Month 2 | Month 3 | Month 4 | Month 5 | Month 6 | Month 7 | Month 8 | Month 9 | Month 10 | Month 11 | Month 12 | ||
| Cash Received | |||||||||||||
| Cash from Operations | |||||||||||||
| Cash Sales | $12,640 | $13,280 | $13,940 | $14,660 | $15,324 | $16,010 | $17,001 | $17,952 | $18,887 | $19,903 | $20,923 | $21,939 | |
| Subtotal Cash from Operations | $12,640 | $13,280 | $13,940 | $14,660 | $15,324 | $16,010 | $17,001 | $17,952 | $18,887 | $19,903 | $20,923 | $21,939 | |
| Additional Cash Received | |||||||||||||
| Sales Tax, VAT, HST/GST Received | 8.00% | $1,011 | $1,062 | $1,115 | $1,173 | $1,226 | $1,281 | $1,360 | $1,436 | $1,511 | $1,592 | $1,674 | $1,755 |
| New Current Borrowing | $0 | $0 | $0 | $0 | $0 | $0 | $0 | $0 | $0 | $0 | $0 | $0 | |
| New Other Liabilities (interest-free) | $0 | $0 | $0 | $0 | $0 | $0 | $0 | $0 | $0 | $0 | $0 | $0 | |
| New Long-term Liabilities | $0 | $0 | $0 | $0 | $0 | $0 | $0 | $0 | $0 | $0 | $0 | $0 | |
| Sales of Other Current Assets | $0 | $0 | $0 | $0 | $0 | $0 | $0 | $0 | $0 | $0 | $0 | $0 | |
| Sales of Long-term Assets | $0 | $0 | $0 | $0 | $0 | $0 | $0 | $0 | $0 | $0 | $0 | $0 | |
| New Investment Received | $0 | $0 | $0 | $0 | $0 | $0 | $0 | $0 | $0 | $0 | $0 | $0 | |
| Subtotal Cash Received | $13,651 | $14,342 | $15,055 | $15,833 | $16,550 | $17,291 | $18,361 | $19,388 | $20,398 | $21,495 | $22,597 | $23,695 | |
| Expenditures | Month 1 | Month 2 | Month 3 | Month 4 | Month 5 | Month 6 | Month 7 | Month 8 | Month 9 | Month 10 | Month 11 | Month 12 | |
| Expenditures from Operations | |||||||||||||
| Cash Spending | $10,503 | $10,631 | $10,763 | $10,907 | $11,040 | $11,177 | $11,375 | $11,565 | $11,752 | $11,956 | $12,160 | $12,363 | |
| Bill Payments | $95 | $2,877 | $3,649 | $4,170 | $4,433 | $4,623 | $4,858 | $5,184 | $5,463 | $5,745 | $6,075 | $6,425 | |
| Subtotal Spent on Operations | $10,598 | $13,508 | $14,412 | $15,077 | $15,473 | $15,800 | $16,233 | $16,749 | $17,216 | $17,701 | $18,234 | $18,788 | |
| Additional Cash Spent | |||||||||||||
| Sales Tax, VAT, HST/GST Paid Out | $1,011 | $1,062 | $1,115 | $1,173 | $1,226 | $1,281 | $1,360 | $1,436 | $1,511 | $1,592 | $1,674 | $1,755 | |
| Principal Repayment of Current Borrowing | $200 | $200 | $200 | $200 | $200 | $200 | $200 | $200 | $200 | $200 | $0 | $0 | |
| Other Liabilities Principal Repayment | $0 | $0 | $0 | $0 | $0 | $0 | $0 | $0 | $0 | $0 | $0 | $0 | |
| Long-term Liabilities Principal Repayment | $278 | $278 | $278 | $278 | $278 | $278 | $278 | $278 | $278 | $278 | $278 | $278 | |
| Purchase Other Current Assets | $0 | $0 | $0 | $0 | $0 | $0 | $0 | $0 | $0 | $0 | $0 | $0 | |
| Purchase Long-term Assets | $0 | $0 | $0 | $0 | $0 | $0 | $100 | $100 | $100 | $100 | $100 | $100 | |
| Dividends | $0 | $0 | $0 | $0 | $0 | $0 | $0 | $0 | $0 | $0 | $0 | $0 | |
| Subtotal Cash Spent | $12,087 | $15,049 | $16,005 | $16,727 | $17,176 | $17,559 | $18,172 | $18,763 | $19,305 | $19,871 | $20,286 | $20,921 | |
| Net Cash Flow | $1,564 | ($706) | ($950) | ($895) | ($626) | ($268) | $190 | $625 | $1,094 | $1,624 | $2,311 | $2,773 | |
| Cash Balance | $11,364 | $10,657 | $9,707 | $8,813 | $8,187 | $7,918 | $8,108 | $8,733 | $9,827 | $11,451 | $13,762 | $16,536 | |
| Pro Forma Balance Sheet | |||||||||||||
| Month 1 | Month 2 | Month 3 | Month 4 | Month 5 | Month 6 | Month 7 | Month 8 | Month 9 | Month 10 | Month 11 | Month 12 | ||
| Assets | Starting Balances | ||||||||||||
| Current Assets | |||||||||||||
| Cash | $9,800 | $11,364 | $10,657 | $9,707 | $8,813 | $8,187 | $7,918 | $8,108 | $8,733 | $9,827 | $11,451 | $13,762 | $16,536 |
| Inventory | $2,000 | $1,156 | $894 | $951 | $1,033 | $1,092 | $1,160 | $1,248 | $1,320 | $1,386 | $1,464 | $1,545 | $1,624 |
| Other Current Assets | $1,500 | $1,500 | $1,500 | $1,500 | $1,500 | $1,500 | $1,500 | $1,500 | $1,500 | $1,500 | $1,500 | $1,500 | $1,500 |
| Total Current Assets | $13,300 | $14,020 | $13,051 | $12,159 | $11,346 | $10,779 | $10,578 | $10,856 | $11,553 | $12,713 | $14,416 | $16,807 | $19,659 |
| Long-term Assets | |||||||||||||
| Long-term Assets | $5,000 | $5,000 | $5,000 | $5,000 | $5,000 | $5,000 | $5,000 | $5,100 | $5,200 | $5,300 | $5,400 | $5,500 | $5,600 |
| Accumulated Depreciation | $0 | $139 | $278 | $417 | $556 | $695 | $834 | $1,006 | $1,178 | $1,350 | $1,522 | $1,694 | $1,866 |
| Total Long-term Assets | $5,000 | $4,861 | $4,722 | $4,583 | $4,444 | $4,305 | $4,166 | $4,094 | $4,022 | $3,950 | $3,878 | $3,806 | $3,734 |
| Total Assets | $18,300 | $18,881 | $17,773 | $16,742 | $15,790 | $15,084 | $14,744 | $14,950 | $15,575 | $16,663 | $18,294 | $20,613 | $23,393 |
| Liabilities and Capital | Month 1 | Month 2 | Month 3 | Month 4 | Month 5 | Month 6 | Month 7 | Month 8 | Month 9 | Month 10 | Month 11 | Month 12 | |
| Current Liabilities | |||||||||||||
| Accounts Payable | $0 | $2,756 | $3,510 | $4,022 | $4,279 | $4,462 | $4,686 | $5,002 | $5,272 | $5,543 | $5,862 | $6,174 | $7,292 |
| Current Borrowing | $2,000 | $1,800 | $1,600 | $1,400 | $1,200 | $1,000 | $800 | $600 | $400 | $200 | $0 | $0 | $0 |
| Other Current Liabilities | $0 | $0 | $0 | $0 | $0 | $0 | $0 | $0 | $0 | $0 | $0 | $0 | $0 |
| Subtotal Current Liabilities | $2,000 | $4,556 | $5,110 | $5,422 | $5,479 | $5,462 | $5,486 | $5,602 | $5,672 | $5,743 | $5,862 | $6,174 | $7,292 |
| Long-term Liabilities | $10,000 | $9,722 | $9,444 | $9,166 | $8,888 | $8,610 | $8,332 | $8,054 | $7,776 | $7,498 | $7,220 | $6,942 | $6,664 |
| Total Liabilities | $12,000 | $14,278 | $14,554 | $14,588 | $14,367 | $14,072 | $13,818 | $13,656 | $13,448 | $13,241 | $13,082 | $13,116 | $13,956 |
| Paid-in Capital | $15,000 | $15,000 | $15,000 | $15,000 | $15,000 | $15,000 | $15,000 | $15,000 | $15,000 | $15,000 | $15,000 | $15,000 | $15,000 |
| Retained Earnings | ($8,700) | ($8,700) | ($8,700) | ($8,700) | ($8,700) | ($8,700) | ($8,700) | ($8,700) | ($8,700) | ($8,700) | ($8,700) | ($8,700) | ($8,700) |
| Earnings | $0 | ($1,697) | ($3,081) | ($4,146) | ($4,877) | ($5,288) | ($5,373) | ($5,006) | ($4,173) | ($2,878) | ($1,088) | $1,197 | $3,137 |
| Total Capital | $6,300 | $4,603 | $3,219 | $2,154 | $1,423 | $1,012 | $927 | $1,294 | $2,127 | $3,422 | $5,212 | $7,497 | $9,437 |
| Total Liabilities and Capital | $18,300 | $18,881 | $17,773 | $16,742 | $15,790 | $15,084 | $14,744 | $14,950 | $15,575 | $16,663 | $18,294 | $20,613 | $23,393 |
| Net Worth | $6,300 | $4,603 | $3,219 | $2,154 | $1,423 | $1,012 | $927 | $1,294 | $2,127 | $3,422 | $5,212 | $7,497 | $9,437 |

