
Tropical Tan
Executive Summary
Tropical Tan is a start up company seeking financing. Tropical Tan has an experienced management team, excellent location, and sound business strategy. This business plan will highlight Tropical Tan’s needs, market, sales plan, and financial statements.
Tropical Tan will be located in Chino Hills, CA. This is a market area of 160,000 individuals. The location is in a high traffic strip mall with national chains. The business’ main service will be offering tanning booths to individuals. Tropical Tan will offer six high quality tanning beds and limited retail sales of tanning lotion, bathing suits/swimwear, and sunglasses.
The objective of this business plan is to acquire $50,000 in additional funding. This money will be used to purchase inventory, tanning beds, and other expenses as noted in the Start-up table.
1.1 Objectives
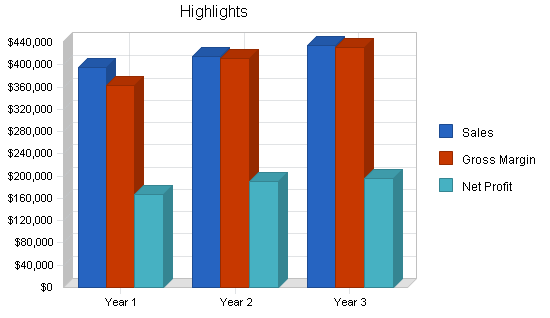
- Sales of $380,000 in Year 1 and $425,000 by the end of Year 3.
- Net Profit higher than 40%.
- Net income more than 10% of sales by Year 3.
1.2 Mission
Tropical Tan will offer our clients the highest quality indoor tanning experience, with top-of-the-line beds and tanning accelerators. Tropical Tan will set itself apart from the competition by making customer satisfaction a top priority. Employees will be treated with dignity, and will be provided with special benefits such as moderate health insurance coverage, free tanning sessions, and a special company picnic once a year. Employees are the public face of Tropical Tan, and their health and goodwill is integral to the success of the business.
1.3 Keys to Success
- Location – being located in a high traffic strip mall and across the street from a health club.
- Convenience – with quick tan beds less time is spent in the bed, and extended business hours.
- Customer Service – focus on our customers’ comfort and needs.
Company Summary
Tropical Tan will, upon commencement of operations, provide the service of tanning booth rentals. We will provide an upscale, sanitary environment, along with quality lotions, swimwear, and sunglasses. Superior customer service and high quality tanning equipment will set Tropical Tan apart from the competition.
2.1 Company Ownership
Tropical Tan will be created as a Sole Proprietorship based in Chino Hills owned by its principal investors and principal operators.
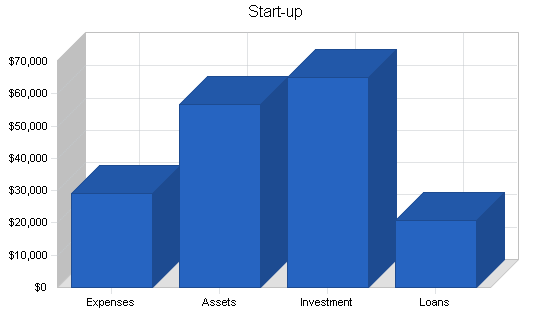
2.2 Start-up Summary
Keith and Shelly Harwood have $65,000 to invest in the business and are looking to finance an additional $50,000 for the build out and start up of their salon. The funds will be used to finance start-up costs, remodel the location, purchase the equipment, and initial inventory. The funds will be repaid through earnings.
| Start-up | |
| Requirements | |
| Start-up Expenses | |
| Legal | $250 |
| Stationery etc. | $100 |
| Brochures | $0 |
| Consultants | $0 |
| Insurance | $100 |
| Rent | $1,817 |
| Research and Development | $0 |
| Expensed Equipment | $27,000 |
| Other | $0 |
| Total Start-up Expenses | $29,267 |
| Start-up Assets | |
| Cash Required | $29,333 |
| Start-up Inventory | $250 |
| Other Current Assets | $0 |
| Long-term Assets | $27,000 |
| Total Assets | $56,583 |
| Total Requirements | $85,850 |
| Start-up Funding | |
| Start-up Expenses to Fund | $29,267 |
| Start-up Assets to Fund | $56,583 |
| Total Funding Required | $85,850 |
| Assets | |
| Non-cash Assets from Start-up | $27,250 |
| Cash Requirements from Start-up | $29,333 |
| Additional Cash Raised | $0 |
| Cash Balance on Starting Date | $29,333 |
| Total Assets | $56,583 |
| Liabilities and Capital | |
| Liabilities | |
| Current Borrowing | $0 |
| Long-term Liabilities | $20,000 |
| Accounts Payable (Outstanding Bills) | $850 |
| Other Current Liabilities (interest-free) | $0 |
| Total Liabilities | $20,850 |
| Capital | |
| Planned Investment | |
| Keith Harwood | $40,000 |
| Shelly Harwood | $25,000 |
| Other | $0 |
| Additional Investment Requirement | $0 |
| Total Planned Investment | $65,000 |
| Loss at Start-up (Start-up Expenses) | ($29,267) |
| Total Capital | $35,733 |
| Total Capital and Liabilities | $56,583 |
| Total Funding | $85,850 |
Products and Services
Tropical Tan will provide the service of tanning booth rentals to individuals. The company relies on seven SunQuest Pro brand tanning beds. Each bed includes 24 Wolff tanning lamps. Sessions range from 20-30 minutes each. Session costs are listed in the sales forecast summary.
Tropical Tan will also retail a line of tanning lotions, bathing suits/swimwear, and sunglasses.
Strategy and Implementation Summary
The main priorities of Tropical upon start up are the following:
- To maintain positive cash flow and aggressively limit expenses to match the projected financial statements.
- To differentiate the brand and product from the competition by supporting and encouraging a unique customer experience.
- To outsource important management activities so that any management team gaps are minimized.
By keeping these priorities in mind throughout the start-up process, the implementation team (management team) will maintain a course of action that will lead to solid results.
4.1 Competitive Edge
Tropical Tan’s competitive edge lies with the way in which customers are pampered. We will provide extra perks that our competition doesn’t such as bottled water after their session, free lattes and other perks described below:
Twice yearly client fashion show – The salon will close for several hours on a weekend and the fashion show will introduce a new line of swimwear. Tropical Tan clients will be encouraged to participate as the models for the new swimwear. The top male and female models will receive a year’s worth of tanning each.
Weekly drawings – Giveaways of everything from tanning products to free monthly passes to area restaurant giveaways.
Auto-payment for individual sessions – Clients who prefer individual sessions to package plans will be able to roll their sessions over into packages if they reach the allotted session amount/month.
4.2 Sales Strategy
Those customers who sign up for an initial tanning session (ITS) will receive special discounts on future tans and tanning programs. All returning customers will have access to special tanning plans specifically designed for their needs.
The tanning salon industry recommends that clients tan no more often than every other day. State and Federal regulations recommend no more than once every 24 hours. Tropical Tan recommends to clients that they discontinue tanning temporarily if skin is inappropriately tanned. The company will offer vouchers to clients that agree to discontinue under such circumstances, and reserves the right to refuse service to any client in cases where tanning abuse becomes a problem.
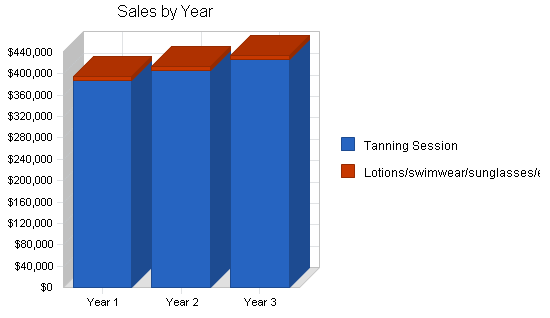
4.2.1 Sales Forecast
The following table and charts give a run down on forecasted sales. This projection is based on six quick tan tanning beds, $10.00 per tanning session, and approximately 200 clients per day. Half of those clients paying on a monthly basis therefore bringing their session cost down to $2.00 ($50.00 per month). Also sales increase in the late spring and early summer and begin to taper off in September.

| Sales Forecast | |||
| Year 1 | Year 2 | Year 3 | |
| Sales | |||
| Tanning Session | $387,072 | $406,426 | $426,747 |
| Lotions/swimwear/sunglasses/etc. | $7,272 | $7,635 | $8,017 |
| Total Sales | $394,344 | $414,061 | $434,764 |
| Direct Cost of Sales | Year 1 | Year 2 | Year 3 |
| Lotions/swimwear/sunglasses/etc. | $3,100 | $3,500 | $3,800 |
| Other | $0 | $0 | $0 |
| Subtotal Direct Cost of Sales | $3,100 | $3,500 | $3,800 |
Management Summary
The initial management team will consist of Keith & Shelly Harwood (owners). As we grow an additional management member will be added. Keith and Shelly have owned and sold several businesses in the last 15 years including a small convenience store, a plumbing contractor business, and a doggie day care business. They are experienced entrepreneurs with years of small business accounting, finance, marketing, and management experience.
5.1 Personnel Plan
The personnel plan calls for 2 part-time employees while one or both owners will be there full time. During the busier months, May, June, and July an additional part-time employee will be added.
| Personnel Plan | |||
| Year 1 | Year 2 | Year 3 | |
| Part-time Help | $7,740 | $7,740 | $7,740 |
| Part-time Help | $7,740 | $7,740 | $7,740 |
| Part-time Help | $1,935 | $1,935 | $1,935 |
| Owners | $48,000 | $60,000 | $72,000 |
| Total People | 3 | 0 | 0 |
| Total Payroll | $65,415 | $77,415 | $89,415 |

Financial Plan
Tropical Tan expects a profit margin of over 40% starting with year one. By year two, that number should slowly increase as the law of diminishing costs takes hold and the day-to-day activities of the business become less expensive.
Sales are expected to grow 15% per year. Total owner financing of $65,000 will become a return on equity paid in the form of dividends to the owners.
6.1 Important Assumptions
After researching the tanning industry in and around Chino Hills, the following assumptions have been made:
- Consumers are not happy with the two existing tanning salons’ equipment, so by bringing in top-of-the-line products we can provide a higher quality service as well as more clients per hour.
- Being located across the street from a popular gym we can assume a high amount of foot traffic resulting in higher sales.
| General Assumptions | |||
| Year 1 | Year 2 | Year 3 | |
| Plan Month | 1 | 2 | 3 |
| Current Interest Rate | 10.00% | 10.00% | 10.00% |
| Long-term Interest Rate | 10.00% | 10.00% | 10.00% |
| Tax Rate | 30.00% | 30.00% | 30.00% |
| Other | 0 | 0 | 0 |
6.2 Break-even Analysis
The following chart and table summarize our break-even analysis. With fixed costs of $10,332 per month at the outset (a bare minimum), we need to sell 1,041 monthly tanning sessions at $10.00 to break even to cover our costs.

| Break-even Analysis | |
| Monthly Revenue Break-even | $10,414 |
| Assumptions: | |
| Average Percent Variable Cost | 1% |
| Estimated Monthly Fixed Cost | $10,332 |
6.3 Projected Profit and Loss
Our projected profit and loss is shown on the following table and charts. From our research of the tanning industry our annual projections are quite realistic. The detailed monthly projections are included in the appendix.


| Pro Forma Profit and Loss | |||
| Year 1 | Year 2 | Year 3 | |
| Sales | $394,344 | $414,061 | $434,764 |
| Direct Cost of Sales | $3,100 | $3,500 | $3,800 |
| Other Costs of Sales | $27,996 | $0 | $0 |
| Total Cost of Sales | $31,096 | $3,500 | $3,800 |
| Gross Margin | $363,248 | $410,561 | $430,964 |
| Gross Margin % | 92.11% | 99.15% | 99.13% |
| Expenses | |||
| Payroll | $65,415 | $77,415 | $89,415 |
| Sales and Marketing and Other Expenses | $600 | $600 | $600 |
| Depreciation | $0 | $0 | $0 |
| Rent | $21,804 | $21,804 | $21,804 |
| Utilities | $4,200 | $4,200 | $4,200 |
| Insurance | $1,200 | $1,200 | $1,200 |
| Payroll Taxes | $9,812 | $11,612 | $13,412 |
| Loan Repayment | $11,952 | $11,952 | $11,952 |
| Janitorial Service | $3,000 | $3,000 | $3,000 |
| Other | $6,000 | $6,000 | $6,000 |
| Total Operating Expenses | $123,983 | $137,783 | $151,583 |
| Profit Before Interest and Taxes | $239,265 | $272,778 | $279,381 |
| EBITDA | $239,265 | $272,778 | $279,381 |
| Interest Expense | $1,626 | $965 | $310 |
| Taxes Incurred | $71,291 | $81,544 | $83,721 |
| Net Profit | $166,347 | $190,269 | $195,350 |
| Net Profit/Sales | 42.18% | 45.95% | 44.93% |
6.4 Projected Cash Flow
The monthly cash flow is shown in the illustration, with one bar representing the cash flow per month, and the other the monthly cash balance. The annual cash flow figures are included here and the detailed monthly numbers are included in the appendix.

| Pro Forma Cash Flow | |||
| Year 1 | Year 2 | Year 3 | |
| Cash Received | |||
| Cash from Operations | |||
| Cash Sales | $394,344 | $414,061 | $434,764 |
| Subtotal Cash from Operations | $394,344 | $414,061 | $434,764 |
| Additional Cash Received | |||
| Sales Tax, VAT, HST/GST Received | $0 | $0 | $0 |
| New Current Borrowing | $0 | $0 | $0 |
| New Other Liabilities (interest-free) | $0 | $0 | $0 |
| New Long-term Liabilities | $0 | $0 | $0 |
| Sales of Other Current Assets | $0 | $0 | $0 |
| Sales of Long-term Assets | $0 | $0 | $0 |
| New Investment Received | $0 | $0 | $0 |
| Subtotal Cash Received | $394,344 | $414,061 | $434,764 |
| Expenditures | Year 1 | Year 2 | Year 3 |
| Expenditures from Operations | |||
| Cash Spending | $65,415 | $77,415 | $89,415 |
| Bill Payments | $152,361 | $146,453 | $149,816 |
| Subtotal Spent on Operations | $217,776 | $223,868 | $239,231 |
| Additional Cash Spent | |||
| Sales Tax, VAT, HST/GST Paid Out | $0 | $0 | $0 |
| Principal Repayment of Current Borrowing | $6,900 | $6,900 | $6,200 |
| Other Liabilities Principal Repayment | $0 | $0 | $0 |
| Long-term Liabilities Principal Repayment | $0 | $0 | $0 |
| Purchase Other Current Assets | $0 | $0 | $0 |
| Purchase Long-term Assets | $0 | $0 | $0 |
| Dividends | $0 | $0 | $0 |
| Subtotal Cash Spent | $224,676 | $230,768 | $245,431 |
| Net Cash Flow | $169,668 | $183,293 | $189,333 |
| Cash Balance | $199,001 | $382,294 | $571,626 |
6.5 Projected Balance Sheet
The balance sheet table shows managed but sufficient growth of net worth, and a sufficiently healthy financial position. The monthly estimates are included in the appendix.
| Pro Forma Balance Sheet | |||
| Year 1 | Year 2 | Year 3 | |
| Assets | |||
| Current Assets | |||
| Cash | $199,001 | $382,294 | $571,626 |
| Inventory | $1,150 | $1,298 | $1,410 |
| Other Current Assets | $0 | $0 | $0 |
| Total Current Assets | $200,151 | $383,592 | $573,036 |
| Long-term Assets | |||
| Long-term Assets | $27,000 | $27,000 | $27,000 |
| Accumulated Depreciation | $0 | $0 | $0 |
| Total Long-term Assets | $27,000 | $27,000 | $27,000 |
| Total Assets | $227,151 | $410,592 | $600,036 |
| Liabilities and Capital | Year 1 | Year 2 | Year 3 |
| Current Liabilities | |||
| Accounts Payable | $11,971 | $12,043 | $12,338 |
| Current Borrowing | ($6,900) | ($13,800) | ($20,000) |
| Other Current Liabilities | $0 | $0 | $0 |
| Subtotal Current Liabilities | $5,071 | ($1,757) | ($7,662) |
| Long-term Liabilities | $20,000 | $20,000 | $20,000 |
| Total Liabilities | $25,071 | $18,243 | $12,338 |
| Paid-in Capital | $65,000 | $65,000 | $65,000 |
| Retained Earnings | ($29,267) | $137,080 | $327,349 |
| Earnings | $166,347 | $190,269 | $195,350 |
| Total Capital | $202,080 | $392,349 | $587,698 |
| Total Liabilities and Capital | $227,151 | $410,592 | $600,036 |
| Net Worth | $202,080 | $392,349 | $587,698 |
6.6 Business Ratios
Business ratios for the years of this plan are shown below. Industry profile ratios based on the Standard Industrial Classification (SIC) code 7299.0105, Tanning salon, are shown for comparison. We expect to maintain healthy ratios for profitability, risk, and return.
| Ratio Analysis | ||||
| Year 1 | Year 2 | Year 3 | Industry Profile | |
| Sales Growth | 0.00% | 5.00% | 5.00% | 8.15% |
| Percent of Total Assets | ||||
| Inventory | 0.51% | 0.32% | 0.23% | 4.93% |
| Other Current Assets | 0.00% | 0.00% | 0.00% | 35.03% |
| Total Current Assets | 88.11% | 93.42% | 95.50% | 55.79% |
| Long-term Assets | 11.89% | 6.58% | 4.50% | 44.21% |
| Total Assets | 100.00% | 100.00% | 100.00% | 100.00% |
| Current Liabilities | 2.23% | -0.43% | -1.28% | 25.11% |
| Long-term Liabilities | 8.80% | 4.87% | 3.33% | 22.00% |
| Total Liabilities | 11.04% | 4.44% | 2.06% | 47.11% |
| Net Worth | 88.96% | 95.56% | 97.94% | 52.89% |
| Percent of Sales | ||||
| Sales | 100.00% | 100.00% | 100.00% | 100.00% |
| Gross Margin | 92.11% | 99.15% | 99.13% | 100.00% |
| Selling, General & Administrative Expenses | 48.03% | 51.39% | 52.54% | 77.99% |
| Advertising Expenses | 2.00% | 0.00% | 0.00% | 1.85% |
| Profit Before Interest and Taxes | 60.67% | 65.88% | 64.26% | 3.35% |
| Main Ratios | ||||
| Current | 39.47 | -218.35 | -74.79 | 1.73 |
| Quick | 39.24 | -217.61 | -74.60 | 1.30 |
| Total Debt to Total Assets | 11.04% | 4.44% | 2.06% | 6.16% |
| Pre-tax Return on Net Worth | 117.60% | 69.28% | 47.49% | 59.92% |
| Pre-tax Return on Assets | 104.62% | 66.20% | 46.51% | 15.38% |
| Additional Ratios | Year 1 | Year 2 | Year 3 | |
| Net Profit Margin | 42.18% | 45.95% | 44.93% | n.a |
| Return on Equity | 82.32% | 48.49% | 33.24% | n.a |
| Activity Ratios | ||||
| Inventory Turnover | 3.90 | 2.86 | 2.81 | n.a |
| Accounts Payable Turnover | 13.66 | 12.17 | 12.17 | n.a |
| Payment Days | 27 | 30 | 30 | n.a |
| Total Asset Turnover | 1.74 | 1.01 | 0.72 | n.a |
| Debt Ratios | ||||
| Debt to Net Worth | 0.12 | 0.05 | 0.02 | n.a |
| Current Liab. to Liab. | 0.20 | -0.10 | -0.62 | n.a |
| Liquidity Ratios | ||||
| Net Working Capital | $195,080 | $385,349 | $580,698 | n.a |
| Interest Coverage | 147.13 | 282.67 | 901.23 | n.a |
| Additional Ratios | ||||
| Assets to Sales | 0.58 | 0.99 | 1.38 | n.a |
| Current Debt/Total Assets | 2% | 0% | -1% | n.a |
| Acid Test | 39.24 | 0.00 | 0.00 | n.a |
| Sales/Net Worth | 1.95 | 1.06 | 0.74 | n.a |
| Dividend Payout | 0.00 | 0.00 | 0.00 | n.a |
Appendix
| Sales Forecast | |||||||||||||
| Month 1 | Month 2 | Month 3 | Month 4 | Month 5 | Month 6 | Month 7 | Month 8 | Month 9 | Month 10 | Month 11 | Month 12 | ||
| Sales | |||||||||||||
| Tanning Session | 0% | $32,400 | $34,224 | $38,928 | $42,800 | $38,032 | $31,760 | $28,848 | $25,520 | $26,672 | $27,376 | $29,296 | $31,216 |
| Lotions/swimwear/sunglasses/etc. | 0% | $500 | $612 | $675 | $702 | $621 | $603 | $585 | $549 | $507 | $603 | $633 | $684 |
| Total Sales | $32,900 | $34,836 | $39,603 | $43,502 | $38,653 | $32,363 | $29,433 | $26,069 | $27,179 | $27,979 | $29,929 | $31,900 | |
| Direct Cost of Sales | Month 1 | Month 2 | Month 3 | Month 4 | Month 5 | Month 6 | Month 7 | Month 8 | Month 9 | Month 10 | Month 11 | Month 12 | |
| Lotions/swimwear/sunglasses/etc. | $250 | $250 | $300 | $300 | $250 | $250 | $250 | $250 | $250 | $250 | $250 | $250 | |
| Other | $0 | $0 | $0 | $0 | $0 | $0 | $0 | $0 | $0 | $0 | $0 | $0 | |
| Subtotal Direct Cost of Sales | $250 | $250 | $300 | $300 | $250 | $250 | $250 | $250 | $250 | $250 | $250 | $250 | |
| Personnel Plan | |||||||||||||
| Month 1 | Month 2 | Month 3 | Month 4 | Month 5 | Month 6 | Month 7 | Month 8 | Month 9 | Month 10 | Month 11 | Month 12 | ||
| Part-time Help | 0% | $645 | $645 | $645 | $645 | $645 | $645 | $645 | $645 | $645 | $645 | $645 | $645 |
| Part-time Help | 0% | $645 | $645 | $645 | $645 | $645 | $645 | $645 | $645 | $645 | $645 | $645 | $645 |
| Part-time Help | 0% | $0 | $0 | $645 | $645 | $645 | $0 | $0 | $0 | $0 | $0 | $0 | $0 |
| Owners | 0% | $4,000 | $4,000 | $4,000 | $4,000 | $4,000 | $4,000 | $4,000 | $4,000 | $4,000 | $4,000 | $4,000 | $4,000 |
| Total People | 3 | 3 | 4 | 4 | 4 | 3 | 3 | 3 | 3 | 3 | 3 | 3 | |
| Total Payroll | $5,290 | $5,290 | $5,935 | $5,935 | $5,935 | $5,290 | $5,290 | $5,290 | $5,290 | $5,290 | $5,290 | $5,290 | |
| General Assumptions | |||||||||||||
| Month 1 | Month 2 | Month 3 | Month 4 | Month 5 | Month 6 | Month 7 | Month 8 | Month 9 | Month 10 | Month 11 | Month 12 | ||
| Plan Month | 1 | 2 | 3 | 4 | 5 | 6 | 7 | 8 | 9 | 10 | 11 | 12 | |
| Current Interest Rate | 10.00% | 10.00% | 10.00% | 10.00% | 10.00% | 10.00% | 10.00% | 10.00% | 10.00% | 10.00% | 10.00% | 10.00% | |
| Long-term Interest Rate | 10.00% | 10.00% | 10.00% | 10.00% | 10.00% | 10.00% | 10.00% | 10.00% | 10.00% | 10.00% | 10.00% | 10.00% | |
| Tax Rate | 30.00% | 30.00% | 30.00% | 30.00% | 30.00% | 30.00% | 30.00% | 30.00% | 30.00% | 30.00% | 30.00% | 30.00% | |
| Other | 0 | 0 | 0 | 0 | 0 | 0 | 0 | 0 | 0 | 0 | 0 | 0 | |
| Pro Forma Profit and Loss | |||||||||||||
| Month 1 | Month 2 | Month 3 | Month 4 | Month 5 | Month 6 | Month 7 | Month 8 | Month 9 | Month 10 | Month 11 | Month 12 | ||
| Sales | $32,900 | $34,836 | $39,603 | $43,502 | $38,653 | $32,363 | $29,433 | $26,069 | $27,179 | $27,979 | $29,929 | $31,900 | |
| Direct Cost of Sales | $250 | $250 | $300 | $300 | $250 | $250 | $250 | $250 | $250 | $250 | $250 | $250 | |
| Other Costs of Sales | $27,996 | $0 | $0 | $0 | $0 | $0 | $0 | $0 | $0 | $0 | $0 | $0 | |
| Total Cost of Sales | $28,246 | $250 | $300 | $300 | $250 | $250 | $250 | $250 | $250 | $250 | $250 | $250 | |
| Gross Margin | $4,654 | $34,586 | $39,303 | $43,202 | $38,403 | $32,113 | $29,183 | $25,819 | $26,929 | $27,729 | $29,679 | $31,650 | |
| Gross Margin % | 14.15% | 99.28% | 99.24% | 99.31% | 99.35% | 99.23% | 99.15% | 99.04% | 99.08% | 99.11% | 99.16% | 99.22% | |
| Expenses | |||||||||||||
| Payroll | $5,290 | $5,290 | $5,935 | $5,935 | $5,935 | $5,290 | $5,290 | $5,290 | $5,290 | $5,290 | $5,290 | $5,290 | |
| Sales and Marketing and Other Expenses | $50 | $50 | $50 | $50 | $50 | $50 | $50 | $50 | $50 | $50 | $50 | $50 | |
| Depreciation | $0 | $0 | $0 | $0 | $0 | $0 | $0 | $0 | $0 | $0 | $0 | $0 | |
| Rent | $1,817 | $1,817 | $1,817 | $1,817 | $1,817 | $1,817 | $1,817 | $1,817 | $1,817 | $1,817 | $1,817 | $1,817 | |
| Utilities | $350 | $350 | $350 | $350 | $350 | $350 | $350 | $350 | $350 | $350 | $350 | $350 | |
| Insurance | $100 | $100 | $100 | $100 | $100 | $100 | $100 | $100 | $100 | $100 | $100 | $100 | |
| Payroll Taxes | 15% | $794 | $794 | $890 | $890 | $890 | $794 | $794 | $794 | $794 | $794 | $794 | $794 |
| Loan Repayment | $996 | $996 | $996 | $996 | $996 | $996 | $996 | $996 | $996 | $996 | $996 | $996 | |
| Janitorial Service | 15% | $250 | $250 | $250 | $250 | $250 | $250 | $250 | $250 | $250 | $250 | $250 | $250 |
| Other | $500 | $500 | $500 | $500 | $500 | $500 | $500 | $500 | $500 | $500 | $500 | $500 | |
| Total Operating Expenses | $10,147 | $10,147 | $10,888 | $10,888 | $10,888 | $10,147 | $10,147 | $10,147 | $10,147 | $10,147 | $10,147 | $10,147 | |
| Profit Before Interest and Taxes | ($5,493) | $24,439 | $28,415 | $32,314 | $27,515 | $21,966 | $19,036 | $15,672 | $16,782 | $17,582 | $19,532 | $21,503 | |
| EBITDA | ($5,493) | $24,439 | $28,415 | $32,314 | $27,515 | $21,966 | $19,036 | $15,672 | $16,782 | $17,582 | $19,532 | $21,503 | |
| Interest Expense | $162 | $157 | $152 | $148 | $143 | $138 | $133 | $128 | $124 | $119 | $114 | $109 | |
| Taxes Incurred | ($1,696) | $7,285 | $8,479 | $9,650 | $8,212 | $6,549 | $5,671 | $4,663 | $4,998 | $5,239 | $5,826 | $6,418 | |
| Net Profit | ($3,958) | $16,998 | $19,784 | $22,516 | $19,160 | $15,280 | $13,232 | $10,881 | $11,661 | $12,224 | $13,593 | $14,976 | |
| Net Profit/Sales | -12.03% | 48.79% | 49.96% | 51.76% | 49.57% | 47.21% | 44.96% | 41.74% | 42.91% | 43.69% | 45.42% | 46.95% | |
| Pro Forma Cash Flow | |||||||||||||
| Month 1 | Month 2 | Month 3 | Month 4 | Month 5 | Month 6 | Month 7 | Month 8 | Month 9 | Month 10 | Month 11 | Month 12 | ||
| Cash Received | |||||||||||||
| Cash from Operations | |||||||||||||
| Cash Sales | $32,900 | $34,836 | $39,603 | $43,502 | $38,653 | $32,363 | $29,433 | $26,069 | $27,179 | $27,979 | $29,929 | $31,900 | |
| Subtotal Cash from Operations | $32,900 | $34,836 | $39,603 | $43,502 | $38,653 | $32,363 | $29,433 | $26,069 | $27,179 | $27,979 | $29,929 | $31,900 | |
| Additional Cash Received | |||||||||||||
| Sales Tax, VAT, HST/GST Received | 0.00% | $0 | $0 | $0 | $0 | $0 | $0 | $0 | $0 | $0 | $0 | $0 | $0 |
| New Current Borrowing | $0 | $0 | $0 | $0 | $0 | $0 | $0 | $0 | $0 | $0 | $0 | $0 | |
| New Other Liabilities (interest-free) | $0 | $0 | $0 | $0 | $0 | $0 | $0 | $0 | $0 | $0 | $0 | $0 | |
| New Long-term Liabilities | $0 | $0 | $0 | $0 | $0 | $0 | $0 | $0 | $0 | $0 | $0 | $0 | |
| Sales of Other Current Assets | $0 | $0 | $0 | $0 | $0 | $0 | $0 | $0 | $0 | $0 | $0 | $0 | |
| Sales of Long-term Assets | $0 | $0 | $0 | $0 | $0 | $0 | $0 | $0 | $0 | $0 | $0 | $0 | |
| New Investment Received | $0 | $0 | $0 | $0 | $0 | $0 | $0 | $0 | $0 | $0 | $0 | $0 | |
| Subtotal Cash Received | $32,900 | $34,836 | $39,603 | $43,502 | $38,653 | $32,363 | $29,433 | $26,069 | $27,179 | $27,979 | $29,929 | $31,900 | |
| Expenditures | Month 1 | Month 2 | Month 3 | Month 4 | Month 5 | Month 6 | Month 7 | Month 8 | Month 9 | Month 10 | Month 11 | Month 12 | |
| Expenditures from Operations | |||||||||||||
| Cash Spending | $5,290 | $5,290 | $5,935 | $5,935 | $5,935 | $5,290 | $5,290 | $5,290 | $5,290 | $5,290 | $5,290 | $5,290 | |
| Bill Payments | $1,927 | $31,651 | $12,341 | $13,656 | $15,669 | $13,249 | $11,514 | $10,660 | $10,626 | $9,986 | $10,234 | $10,849 | |
| Subtotal Spent on Operations | $7,217 | $36,941 | $18,276 | $19,591 | $21,604 | $18,539 | $16,804 | $15,950 | $15,916 | $15,276 | $15,524 | $16,139 | |
| Additional Cash Spent | |||||||||||||
| Sales Tax, VAT, HST/GST Paid Out | $0 | $0 | $0 | $0 | $0 | $0 | $0 | $0 | $0 | $0 | $0 | $0 | |
| Principal Repayment of Current Borrowing | $575 | $575 | $575 | $575 | $575 | $575 | $575 | $575 | $575 | $575 | $575 | $575 | |
| Other Liabilities Principal Repayment | $0 | $0 | $0 | $0 | $0 | $0 | $0 | $0 | $0 | $0 | $0 | $0 | |
| Long-term Liabilities Principal Repayment | $0 | $0 | $0 | $0 | $0 | $0 | $0 | $0 | $0 | $0 | $0 | $0 | |
| Purchase Other Current Assets | $0 | $0 | $0 | $0 | $0 | $0 | $0 | $0 | $0 | $0 | $0 | $0 | |
| Purchase Long-term Assets | $0 | $0 | $0 | $0 | $0 | $0 | $0 | $0 | $0 | $0 | $0 | $0 | |
| Dividends | $0 | $0 | $0 | $0 | $0 | $0 | $0 | $0 | $0 | $0 | $0 | $0 | |
| Subtotal Cash Spent | $7,792 | $37,516 | $18,851 | $20,166 | $22,179 | $19,114 | $17,379 | $16,525 | $16,491 | $15,851 | $16,099 | $16,714 | |
| Net Cash Flow | $25,108 | ($2,680) | $20,752 | $23,335 | $16,474 | $13,249 | $12,054 | $9,544 | $10,688 | $12,128 | $13,830 | $15,186 | |
| Cash Balance | $54,441 | $51,761 | $72,512 | $95,848 | $112,322 | $125,571 | $137,625 | $147,169 | $157,857 | $169,985 | $183,815 | $199,001 | |
| Pro Forma Balance Sheet | |||||||||||||
| Month 1 | Month 2 | Month 3 | Month 4 | Month 5 | Month 6 | Month 7 | Month 8 | Month 9 | Month 10 | Month 11 | Month 12 | ||
| Assets | Starting Balances | ||||||||||||
| Current Assets | |||||||||||||
| Cash | $29,333 | $54,441 | $51,761 | $72,512 | $95,848 | $112,322 | $125,571 | $137,625 | $147,169 | $157,857 | $169,985 | $183,815 | $199,001 |
| Inventory | $250 | $1,000 | $750 | $450 | $1,150 | $900 | $650 | $400 | $1,150 | $900 | $650 | $400 | $1,150 |
| Other Current Assets | $0 | $0 | $0 | $0 | $0 | $0 | $0 | $0 | $0 | $0 | $0 | $0 | $0 |
| Total Current Assets | $29,583 | $55,441 | $52,511 | $72,962 | $96,998 | $113,222 | $126,221 | $138,025 | $148,319 | $158,757 | $170,635 | $184,215 | $200,151 |
| Long-term Assets | |||||||||||||
| Long-term Assets | $27,000 | $27,000 | $27,000 | $27,000 | $27,000 | $27,000 | $27,000 | $27,000 | $27,000 | $27,000 | $27,000 | $27,000 | $27,000 |
| Accumulated Depreciation | $0 | $0 | $0 | $0 | $0 | $0 | $0 | $0 | $0 | $0 | $0 | $0 | $0 |
| Total Long-term Assets | $27,000 | $27,000 | $27,000 | $27,000 | $27,000 | $27,000 | $27,000 | $27,000 | $27,000 | $27,000 | $27,000 | $27,000 | $27,000 |
| Total Assets | $56,583 | $82,441 | $79,511 | $99,962 | $123,998 | $140,222 | $153,221 | $165,025 | $175,319 | $185,757 | $197,635 | $211,215 | $227,151 |
| Liabilities and Capital | Month 1 | Month 2 | Month 3 | Month 4 | Month 5 | Month 6 | Month 7 | Month 8 | Month 9 | Month 10 | Month 11 | Month 12 | |
| Current Liabilities | |||||||||||||
| Accounts Payable | $850 | $31,241 | $11,888 | $13,131 | $15,226 | $12,864 | $11,158 | $10,305 | $10,293 | $9,645 | $9,874 | $10,436 | $11,971 |
| Current Borrowing | $0 | ($575) | ($1,150) | ($1,725) | ($2,300) | ($2,875) | ($3,450) | ($4,025) | ($4,600) | ($5,175) | ($5,750) | ($6,325) | ($6,900) |
| Other Current Liabilities | $0 | $0 | $0 | $0 | $0 | $0 | $0 | $0 | $0 | $0 | $0 | $0 | $0 |
| Subtotal Current Liabilities | $850 | $30,666 | $10,738 | $11,406 | $12,926 | $9,989 | $7,708 | $6,280 | $5,693 | $4,470 | $4,124 | $4,111 | $5,071 |
| Long-term Liabilities | $20,000 | $20,000 | $20,000 | $20,000 | $20,000 | $20,000 | $20,000 | $20,000 | $20,000 | $20,000 | $20,000 | $20,000 | $20,000 |
| Total Liabilities | $20,850 | $50,666 | $30,738 | $31,406 | $32,926 | $29,989 | $27,708 | $26,280 | $25,693 | $24,470 | $24,124 | $24,111 | $25,071 |
| Paid-in Capital | $65,000 | $65,000 | $65,000 | $65,000 | $65,000 | $65,000 | $65,000 | $65,000 | $65,000 | $65,000 | $65,000 | $65,000 | $65,000 |
| Retained Earnings | ($29,267) | ($29,267) | ($29,267) | ($29,267) | ($29,267) | ($29,267) | ($29,267) | ($29,267) | ($29,267) | ($29,267) | ($29,267) | ($29,267) | ($29,267) |
| Earnings | $0 | ($3,958) | $13,039 | $32,823 | $55,339 | $74,500 | $89,779 | $103,012 | $113,892 | $125,554 | $137,778 | $151,371 | $166,347 |
| Total Capital | $35,733 | $31,775 | $48,772 | $68,556 | $91,072 | $110,233 | $125,512 | $138,745 | $149,625 | $161,287 | $173,511 | $187,104 | $202,080 |
| Total Liabilities and Capital | $56,583 | $82,441 | $79,511 | $99,962 | $123,998 | $140,222 | $153,221 | $165,025 | $175,319 | $185,757 | $197,635 | $211,215 | $227,151 |
| Net Worth | $35,733 | $31,775 | $48,772 | $68,556 | $91,072 | $110,233 | $125,512 | $138,745 | $149,625 | $161,287 | $173,511 | $187,104 | $202,080 |


