
Bottlieb Innovations
Executive Summary
Introduction
Bottlieb Innovations, Inc., is a start-up company that manufactures a product that will revolutionize the land assessment industry. Bottlieb’s Digital Geographer product is a simple device which, through patented technology, computes the area of a walked perimeter.
The marketing and financial strategies presented in this plan serve as a set of guidelines for management as the start-up company enters its first year of production. The most conservative possible numbers and projections are used throughout the plan.
The Company
Bottlieb Innovations, Inc. is located in an industrial district of Escondido, CA. The approximately 1,500 square-foot, freeway-close facility includes office, workshop, and assembly space, as well as ample parking.
George S. Bottlieb, president and CEO, is responsible for product design, development, sales, and overall business management. Jay Rosenburg, Jr., vice-president, shares the responsibility for business management, with a particular focus on operations, marketing, and finance. Since the company is very small, both the president and VP will initially have to focus on tasks such as product assembly, packaging, order processing, and shipping. Other management personnel will be added as the company grows. Production personnel will initially be contracted from temporary employment agencies to eliminate the overhead associated with benefits.
The company will institute an aggressive bonus plan, linked to exceptional company performance. The bonus plan, coupled with the opportunity to work for a company that has such tremendous growth potential, should help attract and retain key personnel.
The Product
The company has developed, and is preparing to manufacture, a simple device, the Digital Geographer, which will compute the area of a walked perimeter in a fraction of the time required by current area measurement techniques, which rely on distance measuring wheel technology. Because the Digital Geographer contains few components, its manufacturing process is expected to be relatively simple.
No fair comparisons can be made between the functionality of Bottlieb’s Digital Geographer and the distance wheels offered by a range of other manufacturers. The Digital Geographer transforms complex area measurements into a simple task. What used to require several measurements, a large degree of estimation, and a lot of geometric calculations, now only requires the abilities to walk and push a button. The importance of accurate area measurement is well known by contractors. Better knowing the scope of a job can help to eliminate the costs associated with underestimating in a competitive market.
Bottlieb Innovations, Inc. assembles its own products, using local vendors for materials and services. The company owns molds for making plastic components such as the wheel and encoder box.
Plans for a follow on product, the DG-3000, are already underway. The DG-3000 will use two wheels and a differential-based system, instead of an electronic compass, for determining directional changes. Bottlieb Innovations is also developing plans for future products that include software interfaces, as well as future iterations of the DG-3000 which may utilize a Global Positioning Satellite (GPS) system.
The Market
Analysis has shown that the annual global revenue from the sales of measuring wheels is roughly $100M, with the average price about $50 (U.S. dollars). This implies that approximately two million distance wheels are sold annually worldwide. Bottlieb Innovations conservatively estimates that within this market, one-third of the demand is generated due to customer need to calculate area and distance versus distance measurement only. If this estimate is reasonable, there is potential demand for 600,000+ units per year in the area measurement segment.
If Bottlieb Innovations can capture 1% of this segment, the company will sell 6,000 units per year. As long as the market recognizes and values the superiority of the Digital Geographer and customer buying habits can be changed, the market potential is very strong.
There are three basic market segments in the current distance-wheel market:
- Construction, including appraising, engineering, and small-scale surveying.
- Agricultural, including large-scale surveying.
- Niche.
Bottlieb Innovations will target current buyers of 10″ to 18″ distance wheels in the construction, appraising, small-scale surveying industries. More specifically, the Digital Geographer is targeted specifically at buyers who use their distance wheels to measure area. The majority of Bottlieb’s initial sales will be directly to customers in California’s fast-growing construction industry, but the company plans to swiftly expand its domestic and worldwide sales.
Since Bottlieb’s product represents a leap in technology, there are no direct competitors for the Digital Geographer product. However, Bottlieb expects to sell the Digital Geographer to a significant portion of the current distance wheel market. The current distance wheel market: Rollertape, Measure Man, TruMeasure, and Rollersure can be considered Bottlieb’s competitors.
Competitors in the distance wheel market typically sell through tool distributors. Some of the larger wheels are sold through agricultural supply distributors. Distributors handle the burden of product placement issues as well as the issues encountered in dealing with individual customers. Distance wheels are also sold at large retail home improvement chains (e.g. Home Depot).
Current measuring wheel industry growth is difficult to forecast because of the large number of privately-owned companies that operate in the industry. Although worldwide growth in construction is a strong indicator that the market is growing, Bottlieb Innovations does not necessarily anticipate a unit sales growth in the measuring wheel industry over the next few years because it expects to gain market share from the existing market. Bottlieb’s growth is not as dependent upon the entire market size growing as it is upon generating interest, awareness, and excitement for the Digital Geographer product.
Bottlieb expects direct marketing and product reputation, as well as sales through major distributors and home improvement stores, to briskly expand market demand throughout the state, region, and nation within the next five years. Initial domestic success and favorable Web-based sales will determine whether Bottlieb Innovations will be able to focus on global expansion within this period.
Financial Projections
Bottlieb Innovations’ sales forecast assumes constant, non-seasonal growth and an average revenue of $425 per unit. Since volume requirements will drive production, and our suppliers have substantial discounts associated with larger volumes, it is possible that we will lower the price of the Digital Geographer if the sales volume increases substantially. However, we will not allow the price decrease to cut into our profit margin.
It is difficult to know how many of our customers will pay in the neighborhood of $600 for a Digital Geographer, but we expect to ramp up to 100 units per month within the first year. If demand for the product turns out to be greater than expected, the facility in Escondido is capable of producing up to 500 units per month. The company expects to make excellently large profits on sales by Year 2.

1.1 Objectives
Bottlieb’s management seeks to make the business profitable within one year of the start of production, scheduled to begin early in the third quarter of Year 1. Production capacity can quickly ramp up as needed. It may be increased to as many as 500 units per month in the current facility if demand is sufficient.

Management’s challenge is to generate enough interest for the product in local and regional distance-wheel markets to reach sales of 100 units per month by the last month of Year1. This will ensure that the profitability goal is met, and will allow for further expansion into national and global markets.
1.2 Mission
Bottlieb Innovations strives “through relentless innovation and creativity, to extend the overwhelming power of technology to practical, accurate, time-saving devices that enable increases in customer productivity.” The company’s mission statement reflects the blend of creativity and pragmatism that Bottlieb’s management believes is necessary to successfully invent, market, produce, and sell breakthrough products.
Although the Digital Geographer is Bottlieb Innovations’ first and only product, the founder and management are constantly evaluating the market feasibility of a wide range of breakthrough product ideas. The anticipated revenues generated by the Digital Geographer product will be used to improve future iterations of the product, as well as to fund research and development of future innovative products, possibly in unrelated fields.
1.3 Keys to Success
- Since Bottlieb’s Digital Geographer product is so revolutionary, it essentially creates a new, segmented market. Bottlieb’s management has targeted existing distance-wheel buyers, and needs to convince these customers of the Digital Geographer’s added value.
- Product quality must be exceptional, since the company’s reputation will initially be driven by the experiences of users as well as word of mouth advertising.
- Accurate production planning, cost controlling, and accurate budgeting are needed to ensure the financial health of the business.
- The temptation to concentrate only on growth, while neglecting profitability, must be avoided.
Company Summary
George S. Bottlieb founded Bottlieb Innovations, Inc. The Escondido, California-based company has developed, and is preparing to manufacture, a simple device which will compute the area of a walked perimeter. Bottlieb’s patented Digital Geographer product accurately computes area in a fraction of the time required by current area measurement techniques which rely on distance measuring wheel technology.
Development of Bottlieb’s Digital Geographer product is complete, and the manufacturing component of the business is well into the planning stages. Because the Digital Geographer contains few components, its manufacturing process is expected to be relatively simple.
The majority of Bottlieb’s initial sales will be directly to customers in California’s fast-growing construction industry, but the company plans to swiftly expand its domestic and worldwide sales.
2.1 Company Ownership
Bottlieb Innovations is a privately held corporation, registered in the state of California. Ownership is broken down as follows:
70%: George Bottlieb – founder, president and CEO.
10%: Jay Rosenburg, Jr.–vice-president.
10%: Britney Bottlieb – CFO.
10%: Albert Bottlieb.
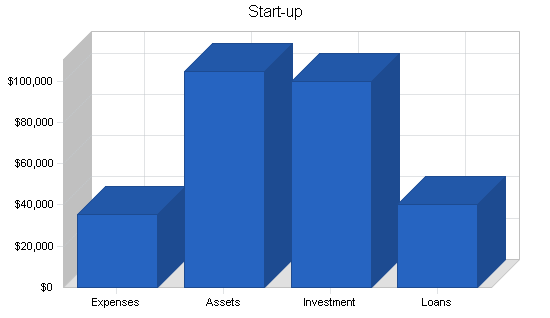
2.1.1 Start-up Summary
Bottlieb Innovations’ start-up expenses are illustrated in the following chart and table. The molds required to manufacture the plastic wheel and encoder box represent the largest single start-up expense.
100 shares of company stock were issued at a price of $50 per share. The sale of stock, combined with an interest free short-term loan, satisfied the start-up funding requirements.
| Start-up | |
| Requirements | |
| Start-up Expenses | |
| Legal | $800 |
| Insurance (8 mos.) | $800 |
| Back Rent (8 mos.) | $5,600 |
| Production Equipment – Benches / Tools | $2,000 |
| Plastic Molds – Wheel / Encoder Box | $20,000 |
| Office Furniture | $1,000 |
| Office Computers / Software / Equipment | $5,000 |
| Other | $0 |
| Total Start-up Expenses | $35,200 |
| Start-up Assets | |
| Cash Required | $97,000 |
| Start-up Inventory | $6,000 |
| Other Current Assets | $1,800 |
| Long-term Assets | $0 |
| Total Assets | $104,800 |
| Total Requirements | $140,000 |
| Start-up Funding | |
| Start-up Expenses to Fund | $35,200 |
| Start-up Assets to Fund | $104,800 |
| Total Funding Required | $140,000 |
| Assets | |
| Non-cash Assets from Start-up | $7,800 |
| Cash Requirements from Start-up | $97,000 |
| Additional Cash Raised | $0 |
| Cash Balance on Starting Date | $97,000 |
| Total Assets | $104,800 |
| Liabilities and Capital | |
| Liabilities | |
| Current Borrowing | $0 |
| Long-term Liabilities | $0 |
| Accounts Payable (Outstanding Bills) | $0 |
| Other Current Liabilities (interest-free) | $40,000 |
| Total Liabilities | $40,000 |
| Capital | |
| Planned Investment | |
| Company Stock Sale | $100,000 |
| Other | $0 |
| Additional Investment Requirement | $0 |
| Total Planned Investment | $100,000 |
| Loss at Start-up (Start-up Expenses) | ($35,200) |
| Total Capital | $64,800 |
| Total Capital and Liabilities | $104,800 |
| Total Funding | $140,000 |
2.2 Company Locations and Facilities
Bottlieb Innovations, Inc. is located in an industrial district of Escondido, CA. The approximately 1,500 square-foot, freeway-close facility includes office, workshop, and assembly space, as well as ample parking.
In terms of capital equipment, manufacturing is not heavily automated. Product assembly requires minimal skills and tools. The company owns several well-lighted workbenches and ample tools required for assembly. Additionally, the company owns four networked computers with a DSL connection to the Internet, as well as financial and CAD software packages.
Contact Information:
Bottlieb Innovations, Inc.
1800 Simpleton Way #404
Escondido, CA 92029
Products
The Digital Geographer product is what makes Bottlieb Innovations a unique business. The product contains the power to revolutionize all industries that require accurate land-based area measurement. When properly marketed, the patented Digital Geographer has the potential to quickly transform Bottlieb Innovations into a very successful business.
No fair comparisons can be made between the functionality of Bottlieb’s Digital Geographer and the distance wheels offered by a range of other manufacturers. The Digital Geographer transforms complex area measurements into a simple task. What used to require several measurements, a large degree of estimation, and a lot of geometric calculations, now only requires the abilities to walk and push a button.
3.1 Product Description
As of December 2000, Bottlieb Innovations has a single Digital Geographer product, the DG-2000. The professional grade product is constructed of high-quality plastic and metal components.
An excerpt from the Web page:
Bottlieb Innovations, Inc. has created a new type of land survey equipment that will revolutionize the industry. Our newest device, the Digital Geographer, DG-2000, has the look and feel of a traditional distance wheel – but with one amazing new feature. When wheeled around the perimeter of ANY area, the DG-2000 will calculate the area inside!
The DG-2000 eliminates all of the problems and inconveniences associated with current area estimation methods. Before the DG-2000, an estimator had to somehow break odd-shaped areas into simple geometric shapes (squares, triangles, circles, etc.) and add up the areas of those shapes. The result was usually both inaccurate and time-consuming.
The importance of accurate area measurement is well known by contractors. Better knowing the scope of a job can help to eliminate the costs associated with underestimating in a competitive market.
The DG-2000 is the perfect tool to help with that next driveway, patio, roof, or landscaping job. It can display results in square feet, square yards, or square meters at the touch of a button. The DG-2000 can also be used as a traditional distance wheel, offering results in feet, yards, or meters.
3.2 Competitive Comparison
Since the Digital Geographer is a breakthrough product, it currently has no direct competition.
The Digital Geographer is expected to segment and take a portion of market share from companies that manufacture distance wheels. Every major distance wheel manufacturer has excellent distribution and product support structures in place.
The following table gives a brief summary of the largest worldwide distance-wheel manufacturers:
|
Company |
HQ |
Founded |
Est. Sales* |
URL Product Link |
|
Rollertape |
Washington, USA |
1950 |
$45,000 |
www.Rollertape.com |
|
Measure Man |
Minnesota, USA |
1963 |
$25,000 |
www.meter-man.com/dmwindex.html |
|
TruMeasure.com |
UK |
1937 |
$20,000 |
www.TruMeasure |
|
Rollersure |
South Africa |
1975 |
$9,000 |
www.Rollersure.com |
* Estimated Sales reported annually, worldwide and in thousands of U.S. dollars.
3.3 Sales Literature
Online product ordering and sales capabilities will be added to the company website as soon as product is available.
3.4 Sourcing
Bottlieb Innovations, Inc. assembles its own products, using local vendors for materials and services. The company owns molds for making plastic components such as the wheel and encoder box.
Most other components, including the LCD display, printed-circuit board, microprocessor and other electronic components are available from multiple distributors and manufacturers. Bottlieb Innovations currently has an excellent working relationship with Cartwright Plastics and American Distributors, key suppliers of parts for the Digital Geographer. The current Digital Geographer product, the DG-2000, contains an electronic compass integrated circuit. The electronic compass device is manufactured exclusively by Precise Notation, Inc. Bottlieb Innovations is working to establish a relationship with Precise Notation.
3.5 Technology
Bottlieb Innovations has filed for a U.S. patent on “ground-contact area measurement devices.” This patent is pending.
3.6 Future Products
Plans for the DG-3000 product are already underway. The DG-3000 will use two wheels and a differential-based system, instead of an electronic compass, for determining directional changes.
Bottlieb Innovations is also developing plans for personal computer software and Palm Pilot interfaces to the Digital Geographer products. These products from Bottlieb Innovations will allow customers to transfer information stored in the Digital Geographer to common standardized systems with more powerful processing and graphical display capabilities. The software algorithm used in the DG-2000 product is applicable to the DG-3000, as well as any future iterations of the product which may utilize a Global Positioning Satellite (GPS) system.
Market Analysis Summary
Analysis has shown that the annual global revenue from the sales of measuring wheels is roughly $100M, spread among four major competitors, with the average price about $50 (U.S. dollars). This implies that approximately two million distance wheels are sold annually worldwide. Bottlieb Innovations conservatively estimates that within this market, one-third of the demand is generated due to customer need to calculate area and distance versus distance measurement only. If this estimate is reasonable, there is potential demand for 600,000+ units per year in the area measurement segment.
If Bottlieb Innovations can capture 1% of this segment, the company will sell 6,000 units per year. As long as the market recognizes and values the superiority of the Digital Geographer and customer buying habits can be changed, the market potential is very strong.
4.1 Market Segmentation
There are three basic market segments in the current distance-wheel market:
- Construction, including appraising, engineering, and small-scale surveying.
- Agricultural, including large-scale surveying.
- Niche.
TSM offers the Model 100 Measuring Wheel and is an excellent example of a company that fills a local niche market. The TSM wheel is specifically designed for cable TV strand mappers, to be primarily operated from a vehicle, and claims superior wheel bearing durability and life over competitors. TSM’s primary customer currently appears to be its own TSM Cable TV business.
Dandy focuses on professionals in the agriculture and land management industries, with minimal emphasis on other industries such as construction. Dandy’s customers generally need to calculate distance and area of large sites one acre plus, and are not a major factor in the market in comparison to the other four. Dandy hesitantly related that their sales per year in the professional agricultural and land management segment was “under 2,000 units.”
Rollertape, Measure Man, TruMeasure, and Rollersure all focus primarily on professionals in construction, engineering/surveying, and assessment industries (real estate, insurance, etc.). The greatest customer demand is in the professional market segment and probably accounts for over 90% of distance-wheel sales. Rollertape quoted a surprising yearly revenue from measuring wheel sales at $20-25M nationally (U.S. dollars) and another $20-25M internationally.
Since Bottlieb’s product represents a leap in technology, there are no direct competitors for the Digital Geographer product. However, Bottlieb expects to sell the Digital Geographer to a significant portion of the current distance wheel market. The current distance wheel market: Rollertape, Measure Man, TruMeasure, and Rollersure can be considered Bottlieb’s competitors.
Current distance wheels are a largely homogeneous product, so Bottlieb’s competitors do not enjoy much differentiation based upon individual product uniqueness. Each competitor offers a product line of several wheels with different diameters and tire treads designed for use over various surfaces and distances. The competitors do, however, seek to differentiate their products based on superior accuracy, reliability, and service.
The small-diameter (4″-10″) distance wheels are typically designed for measurement of shorter distances over paved ground. They offer excellent precision and are easy to carry because of their small size. For added convenience and portability, Meter-Man sells hard carrying cases for their small diameter distance wheels. Competing distance-wheel manufacturers have designed and positioned their small-diameter wheels for use by decorators, appraisers, painters, realtors, insurance agents, and other related professions in mind.
The large-diameter (18″-25″) wheels are better-suited to uneven terrain and longer distances. They do not have the pinpoint accuracy of the smaller wheels, but they typically do not need it. Typically, they have tires designed for traction over rough terrain or mud. Competing manufacturers position the large-diameter wheels for use by big contractors, fencing companies, irrigation contractors, and anyone else who needs to take large-scale outdoor measurements. “Tractor pull operators” is one of the more amusing specific professional applications listed on one manufacturer’s large-distance wheel information Web page.
In addition to the small and large-diameter wheels, competing distance wheel manufacturers offer a more flexible line of wheels with diameters between 10″ and 18″. These wheels are a good compromise between the small and large diameter wheels and cover a very wide range of applications, including general construction, athletic fields, and landscapers. The mid-range diameter wheels represent the broadest range of applications and, consequently, the largest number of sales for distance wheel manufacturers.
Wheels with simple analog distance counters are typically priced between $30-70 (U.S. dollars). A large portion of wheels are sold through tool distributors. Wheels are also available at retail stores such as Home Depot, HomeBase, etc. Wheels with digital liquid crystal displays (LCDs) are less common than analog wheels, but they may be purchased for between $55-75 (U.S. dollars). The digital wheels offer the added functionality of standard and metric measurements and usually have a hold function to store more than one measured value.
Comparing the functionality of any distance wheel to that of the Digital Geographer is unfair. For applications that currently use distance wheels to compute area, the Digital Geographer offers superior accuracy and simplicity. However, current distance wheel products do have manufacturing benefits brought about by years of evolution, a lower retail price, and an established customer base.

| Market Analysis | |||||||
| Year 1 | Year 2 | Year 3 | Year 4 | Year 5 | |||
| Potential Customers | Growth | CAGR | |||||
| Small Contractors | 0% | 100,000 | 105,000 | 110,000 | 115,000 | 120,000 | 4.66% |
| Construction | 0% | 50,000 | 52,500 | 55,000 | 57,500 | 60,000 | 4.66% |
| Real Estate Appraisers | 0% | 10,000 | 10,000 | 10,000 | 10,000 | 10,000 | 0.00% |
| Pest Control Specialists | 0% | 200 | 200 | 200 | 200 | 200 | 0.00% |
| Other | 0% | 1,000 | 1,000 | 1,000 | 1,000 | 1,000 | 0.00% |
| Total | 4.36% | 161,200 | 168,700 | 176,200 | 183,700 | 191,200 | 4.36% |
4.2 Target Market Segment Strategy
Bottlieb Innovations will target current buyers of 10″ to 18″ distance wheels in the construction, appraising, small-scale surveying industries. More specifically, the Digital Geographer is targeted specifically at buyers who use their distance wheels to measure area.
Although the Digital Geographer has the ability to measure distance, it is not cost-competitive with other distance wheels on the market. The Digital Geographer must be marketed as an area-measurement wheel as opposed to a mere distance wheel. Bottlieb’s expected customer base is shown in the following chart.
4.2.1 Market Needs
Bottlieb’s customers are those currently using measuring wheels to calculate area. Small and large businesses alike can rapidly reduce surveying and appraising costs, while increasing accuracy, with the Digital Geographer. Bottlieb hopes to build solid local product reputation through direct marketing and exposure in retail home improvement stores. Superior capability, cost benefits, and local reputation will provide the Digital Geographer the foothold it needs for further expansion.
4.2.2 Market Growth
Current measuring wheel industry growth is difficult to forecast because of the large number of privately-owned companies that operate in the industry. The wheels themselves are simple, mechanical devices which do not need to be replaced often and so have a long, useful life. Although worldwide growth in construction is a strong indicator that the market is growing, Bottlieb Innovations does not necessarily anticipate a unit sales growth in the measuring wheel industry over the next few years because it expects to gain market share from the existing market.
Bottlieb’s Digital Geographer product represents a leap in technology, essentially creating a new product for an established market. Bottlieb’s growth is not as dependent upon the entire market size growing as it is upon generating interest, awareness, and excitement for the Digital Geographer product, which has yet to be released.
4.3 Industry Analysis
E. S. “Dandy” Gandrud invented and patented an improved land-measuring wheel and founded Dandy Co. in 1936. His motivation was to produce a measuring wheel accurate enough for New Deal farm programs. Previous to this, measuring wheels were custom-made devices. Today, Dandy Co. produces measuring wheels, lawn, and nursery equipment with annual sales of about $3M. Dandy died in 1988 at age 85.
Rollertape Corp. today claims to be the industry leader in measuring wheels and the inventor and pioneer of the “Modern Measuring Wheel industry,” setting “the standards for the industry for over 50 years.” Rollertape claims to have “reinvented the wheel” in 1950 and to be the industry benchmark for measuring wheels.
Distance measurement has always been critical, especially in construction and agriculture. Since the invention of the modern measuring wheel in this century, demand has grown swiftly due to booms and constant overall growth in population and construction. Although recently the number of small farms has been declining, the need for precision application of new soil and chemical technologies has increased. As populations grow and the urban sprawl continues, the demand for distance and area measurement is estimated to at least exceed the growth rate to compensate for replacement demand and new demand.
Advances in technology, however, such as Global Positioning Satellite (GPS) systems, could threaten the measuring wheel market as GPS systems become increasingly more accurate and less expensive. Theoretically, GPS technology could allow an individual to simply walk a perimeter carrying a small GPS device, calculating distance and/or area automatically.
Overall sales of measuring wheels worldwide are unknown. A local San Diego HomeBase store sold 88 measuring wheels during a six month period. There are hundreds of HomeBase stores nationwide, and thousands of similar retailers (e.g. Home Depot, Lowe’s) nationwide.
Measuring wheels are the sole products of several companies in the industry. Rollertape, Measure Man, and Rollersure are focused almost exclusively on the production of measuring wheels for the professional market. A large portion of TruMeasure’s revenue also comes from the sale of measuring wheels.
4.3.1 Main Competitors
Although the Digital Geographer has no direct competition, sales of the device may impact the sales revenues of other companies. Therefore, these companies may view Bottlieb Innovations as a competitor with a replacement, not a substitute, product.
The companies most likely to be impacted by Bottlieb Innovations will be the previously discussed distance measuring wheel manufacturers, namely:
- Rollertape
- Measure Man
- TruMeasure
- Rollersure
4.3.2 Industry Participants
The following table shows a breakdown of major distance wheel manufacturers, their market share, and their target markets.
| Company | Approx. Mkt. Share | Est. Sales* | Target Market Customer Profile |
| Rollertape | 45% | $45,000 | Construction, Engineering, and Appraising |
| Measure Man | 25% | $25,000 | Construction, Appraising and Agricultural |
| TruMeasure | 20% | $20,000 | Transportation, Construction, Appraising |
| Rollersure | 9% | $9,000 | Surveyors, Construction, Appraising |
| Dandy | 0.25% | $250 | Farming, Agricultural |
| Other (TSM) | 0.1% | $100 | Local, Niche, Specialized |
* Estimated Sales reported annually, worldwide and in thousands of U.S. dollars.
All of the above named companies are privately owned, well-established companies. It is difficult to estimate their financial strength, although sales revenue data received from Rollertape indicated that yearly revenue is very strong ($20-25M within the U.S. and another $20-25M globally). It is probably safe to assume that other competitor’s financial posture is solid due to their established positions in the measuring-wheel industry and their distribution throughout the world.
4.3.3 Distribution Patterns
Competitors in the distance wheel market typically sell through tool distributors. Some of the larger wheels are sold through agricultural supply distributors. Distributors handle the burden of product placement issues as well as the issues encountered in dealing with individual customers. Distance wheels are also sold at large retail home improvement chains (e.g. Home Depot). Despite the volume of customers in retail outlets, overall demand from this segment is relatively low in comparison to the professional customer base.
Distributors typically receive discounts based upon volume orders, and add markups to wholesale prices to set the retail prices. Some distributors have opened online stores (e.g. “MyToolStore.com”). Foreign manufacturers such as TruMeasure (UK) and Rollersure (S. Africa) depend heavily on worldwide distributors, since international sales represent such a large part of their revenues. Domestic manufacturers such as Meter-Man and Rollertape depend more on domestic and local distribution networks.
Retail stores represent another substantial portion of domestic distance wheel company sales. Since large chains like Home Depot typically have their own professional buyers, and since they purchase such large quantities, distance wheel companies can effectively sell directly to retail stores.
4.3.4 Competition and Buying Patterns
Distance wheels have a wide range of applications, and as such, a very wide range of promotional options. However, distance wheels are tools for professionals, not novelty or luxury items targeted at the general public. Competing distance-wheel manufacturers promote their products through the same channels as other tool manufacturers. Rollertape has indicated that it only “dabbles” in the home improvement market segment, fully realizing that the greatest potential for sales lies among industry professionals and business owners. This strategy certainly does not bar the “non-professional” from acquiring distance wheels readily available through retail chains and on the Internet, although it does little to stimulate any potential demand in this segment.
Each manufacturer has a professionally-designed company website with detailed product specifications. The Measure Man website offers a video file download–the content is essentially a television commercial for Measure Man. Most websites offer links to distributors’ websites or at least distributor phone numbers and addresses.
Since the market for distance wheels is not universal, competitive distance-wheel manufacturers do not promote products through primetime television advertisements. That would be a waste of resources. The majority of the population has no practical use for a distance wheel. Distance-wheel manufacturers target professional markets by using tool distributors and by attending trade shows. Some examples of such trade shows in the U.S. include the annual “World of Concrete” show, and the “International Hardware Show.” The companies typically rent floor space at these shows for direct contact with customers and interactive demonstrations of products.
Distance-wheel manufacturers use promotional strategies very similar to other professional industries that use distributors to advertise to a defined customer base. A professional user of measuring wheels will probably base his buying decisions on personal preference, prior use, reputation within his industry, and exposure at industry trade shows. Once the decision is made, the customer will work through a distributor. If a retail home improvement or hardware store stocks distance wheels, a customer will not find all five major brands lined up, as might be the case with other products.
Although it is difficult to determine useful information regarding internal allocations to product development and R&D, it is apparent that Bottlieb’s competitors actively seek to improve their products. Advertised improvements in durability and accuracy are common, not to mention minor changes relating to ease of use and style.
Allocations to selling and promotion appear to be minimal and focused on professions within various industries. With the exception of Rollertape, mass advertising to the general public or within its retail distributors is not common probably due to cost constraints and low “non-professional” demand in the population overall. Rollertape recently used a national magazine advertising campaign, with ads appearing in “Home Center News,” “Do-It-Yourself,” and “Equipment Today.” The ads appeared four times in each publication, and reached a combined total subscriber population of 330,000. Rollertape, however, still relies primarily on the professional market. Its most cost-effective advertising is still done at trade shows and in industry journals.
Most of the Digital Geographer’s competition offers excellent customer service. The professional user who buys his measuring wheel through a distributor can easily return his wheel to the distributor or manufacturer for repair. Retail purchasers may experience slight delays as they must work through the retail chain. Although not every one of the four major distance-wheel makers manufacture every single component in their measuring wheels, they generally can quickly replace any defective component under warranty and turn the product around fairly quickly.
All products from Rollertape of Spokane, Washington, have a three-year warranty. Rollertape also offers a seven-day return from the time they receive a product for repair. Rollertape is very concerned with customer service and standing behind their fifty-year reputation. Meter-Man offers a lifetime warranty–the best in the industry. TruMeasure, of Manchester, England, offers online support for their products. Customers may email the company with any questions or concerns regarding their product. The TruMeasure website advertises the company’s concern for after-sales service. Rollersure, a South African measuring wheel manufacturer, backs their products with a two year warranty. Customers must go through the Rollersure distributor for warranty claims. The company then reimburses the distributor. If the customer is unable to make a warranty claim through the distributor, they may then contact the company directly.
Types of service organizations consist of online support, answering questions about products and providing information about repair. Rollertape maintains its own repair shop at its Spokane, Washington factory. Customers simply send their product back to the factory, and Rollertape will have it back to them within seven days.
Since Bottlieb Innovations has yet to launch the Digital Geographer product line, all competitors have a significant advantage in the customer service department. Both Rollertape and TruMeasure have been in business for over fifty years, which gives them a significant edge in customer service. Bottlieb Innovations must first focus on the technology and retail aspects of the Digital Geographer before answering the customer service question. However, once the product line is operational, Bottlieb Innovations must focus on the customer service aspects.
Strategy and Implementation Summary
Bottlieb Innovations will focus on professional customers who can benefit from the advantages offered by the Digital Geographer–accurate and timely area measurement. Customers will come from large corporations and small businesses alike.
Bottlieb’s marketing strategy assumes that production of the Digital Geographer will start in low volume and grow to a significant volume over time. Initially, Bottlieb will rely most heavily on word-of-mouth advertising and online promotion through the Internet. Any subsequent formal advertising budget will depend on the success of the product and the profitability of the company. The Digital Geographer’s unique capability is the product’s strongest selling point.
5.1 Competitive Edge
Bottlieb Innovations’ competitive edge is the superiority of its breakthrough product in applications requiring measurement of odd-shaped areas. The company expects to receive a patent on the Digital Geographer, which will clearly provide further competitive advantages.
5.2 Marketing Strategy
Bottlieb Innovations intends to seize market share of the existing measuring wheel market within the local San Diego area and its surrounding region in the first year of production. Bottlieb expects direct marketing and product reputation, as well as sales through major distributors and home improvement stores, to briskly expand market demand throughout the state, region, and nation within the next five years. Initial domestic success and favorable Web-based sales will determine whether Bottlieb Innovations will be able to focus on global expansion within this period. However, Web-based marketing, sales, and existing global distribution methods may very well allow Bottlieb to rapidly exploit global demand with production capacity as the only significant constraint within the initial five year period.
5.2.1 Positioning Statement
For professionals in the construction, contracting, and other industries who frequently need to accurately assess the area of land or buildings, the Digital Geographer offers simple operation and state-of-the-art technology which combine to offer huge time savings.
5.2.2 Pricing Strategy
Exact Digital Geographer pricing has not been determined, but it will significantly exceed that of current measuring wheels from existing manufacturers. The Digital Geographer is expected to retail in the $550 to $600 range. Bottlieb intends to hype the obvious cost saving benefits of the Digital Geographer. The Digital Geographer can realistically be promoted to be able to pay for itself within its first several uses.
5.2.3 Promotion Strategy
The management of Bottlieb Innovations is tasked with promoting its unique product through the most cost effective methods. The Digital Geographer is targeted at customers who currently use distance wheels for area calculation. Several evaluation versions of the Digital Geographer will be loaned out to construction companies, contractors, and real-estate appraisers in an attempt to generate interest for the product, and speed up adoption of the new technology.
Tool distributors and large tool retailers will be targeted as an efficient method of obtaining both sales and industry exposure. Presence and advertising at industry trade shows will also help to stimulate interest and demand for the Digital Geographer product. Finally, a company website will provide customers with information about the product, as well as the opportunity to buy the product over the Internet.
Several magazines, such as “Popular Science” have sections that describe innovative new products and services. Bottlieb Innovations expects to gain broad, inexpensive advertising and exposure by submitting the Digital Geographer to these magazines for review.
Since the product is new, generating a positive company image and good reputation within the industry is essential for quick growth. Establishing the product’s quality and reliability are both essential to forming the basis for a good reputation. If the initial production run of the Digital Geographer has any functional problems, then subsequent revisions, no matter how reliable they might be, will not be as well-received by the market. Management recognizes the need to “get it right the first time.” The benefits of the product will be readily obvious to the market, but reliability and reputation will be the determining factors in order to break any possible existing customer brand loyalties.
5.3 Sales Strategy
Within the first year of production, Bottlieb Innovations expects to establish several strong sales relationships with local or regional construction and surveying equipment distributors and several retail home improvement chains such as Home Base, Ace Hardware, etc.
Additionally, Bottlieb will rely on direct, face-to-face marketing and promotion of the Digital Geographer to local small and large construction companies and real estate agencies in order to promote superior product features and thus establish a core reputation on which to base further expansion. Online sales are expected to eventually exceed distributor and traditional retail sales.
5.3.1 Sales Forecast
Bottlieb Innovations’ sales forecast assumes constant, non-seasonal growth and an average revenue of $425 per unit. Since volume requirements will drive production, and our suppliers have substantial discounts associated with larger volumes, it is possible that we will lower the price of the Digital Geographer if the sales volume increases substantially. However, we will not allow the price decrease to cut into our profit margin.
It is difficult to know how many of our customers will pay in the neighborhood of $600 for a Digital Geographer, but we expect to ramp up to 100 units per month within the first year. If demand for the product turns out to be greater than expected, the facility in Escondido is capable of producing up to 500 units per month. The following table contains the annual sales forecast for FY2001 through FY2003.


| Sales Forecast | |||
| Year 1 | Year 2 | Year 3 | |
| Unit Sales | |||
| Digital Geographer[DG-1] | 380 | 3,000 | 4,000 |
| Digital Geographer[DG-2] | 0 | 900 | 3,200 |
| Other | 0 | 0 | 0 |
| Total Unit Sales | 380 | 3,900 | 7,200 |
| Unit Prices | Year 1 | Year 2 | Year 3 |
| Digital Geographer[DG-1] | $425.00 | $415.00 | $400.00 |
| Digital Geographer[DG-2] | $0.00 | $375.00 | $360.00 |
| Other | $0.00 | $0.00 | $0.00 |
| Sales | |||
| Digital Geographer[DG-1] | $161,500 | $1,245,000 | $1,600,000 |
| Digital Geographer[DG-2] | $0 | $337,500 | $1,152,000 |
| Other | $0 | $0 | $0 |
| Total Sales | $161,500 | $1,582,500 | $2,752,000 |
| Direct Unit Costs | Year 1 | Year 2 | Year 3 |
| Digital Geographer[DG-1] | $264.47 | $230.00 | $190.00 |
| Digital Geographer[DG-2] | $0.00 | $215.00 | $175.00 |
| Other | $0.00 | $0.00 | $0.00 |
| Direct Cost of Sales | |||
| Digital Geographer[DG-1] | $100,500 | $690,000 | $760,000 |
| Digital Geographer[DG-2] | $0 | $193,500 | $560,000 |
| Other | $0 | $0 | $0 |
| Subtotal Direct Cost of Sales | $100,500 | $883,500 | $1,320,000 |
Management Summary
Bottlieb Innovations is a small corporation owned and operated by George S. Bottlieb. George is the developer and designer of the Digital Geographer.
George is aided by his friend Jay Rosenburg, Jr. The two have been friends and co-workers for over four years. They have worked together at several semiconductor companies in San Diego.
George’s management style reflects his personality. All employees of the company are motivated by a personal stake in the company’s success. The company is not hierarchical, and all employees work together cooperatively to reach the company’s goals.
6.1 Management Team Gaps
The management of Bottlieb Innovations is young and enthusiastic. The founder and vice-president have excellent engineering and marketing backgrounds, but little experience in operations, finance, sales, and general business management.
As the company grows, it plans to hire an assembly supervisor towards the end of FY2001 and a product manager responsible for sales and business development in FY2002. Other management personnel will be added as needed.
6.2 Personnel Plan
The personnel table assumes slow growth in employees, and moderate pay raises. Production personnel will initially be contracted from temporary employment agencies to eliminate the overhead associated with benefits. The president and vice-president will have to assume several roles and “wear many different hats” during the first few years.
Salaries are quite low across the board. The company will institute an aggressive bonus plan, linked to exceptional company performance. The bonus plan, coupled with the opportunity to work for a company that has such tremendous growth potential, should help attract and retain key personnel. The personnel plan is shown in the following table.
| Personnel Plan | |||
| Year 1 | Year 2 | Year 3 | |
| Production Personnel | |||
| Supervisor | $6,000 | $30,000 | $35,000 |
| Assembler 1 | $0 | $24,000 | $27,000 |
| Assembler 2 | $0 | $12,000 | $27,000 |
| Other | $0 | $0 | $0 |
| Subtotal | $6,000 | $66,000 | $89,000 |
| Sales and Marketing Personnel | |||
| Product Manager | $0 | $30,000 | $40,000 |
| Other | $0 | $0 | $0 |
| Subtotal | $0 | $30,000 | $40,000 |
| General and Administrative Personnel | |||
| George Bottlieb, President | $32,500 | $60,000 | $66,000 |
| Jay Rosenburg, Vice-President | $13,500 | $54,000 | $60,000 |
| Receptionist / Administrative Assistant | $0 | $24,000 | $36,000 |
| Other | $0 | $0 | $0 |
| Subtotal | $46,000 | $138,000 | $162,000 |
| Other Personnel | |||
| Contractor, Mechanical Design | $1,000 | $5,000 | $5,000 |
| Contractor, PCB Design | $2,000 | $3,000 | $3,000 |
| Other | $0 | $0 | $0 |
| Subtotal | $3,000 | $8,000 | $8,000 |
| Total People | 3 | 7 | 7 |
| Total Payroll | $55,000 | $242,000 | $299,000 |
6.3 Organizational Structure
George S. Bottlieb, president and CEO, is responsible for product design, development, sales, and overall business management. Jay Rosenburg, Jr., vice-president, shares the responsibility for business management, with a particular focus on operations, marketing, and finance. Since the company is very small, both the president and VP will initially have to focus on tasks such as product assembly, packaging, order processing, and shipping.
6.4 Management Team
George S. Bottlieb, 28, president, had a successful career as an engineer before founding Bottlieb Innovations, Inc. George was employed as a senior application engineer at Conexus Systems and Riteon Electronics, focusing on complex video and cable modem integrated circuits. George has both a B.S. and M.S. in electrical engineering from Northern Illinois University.
Jay Rosenburg, Jr., 26, vice-president, is currently employed as a senior application engineer at Conexus Systems. He also worked with George at Riteon Electronics. Jay has a bachelor’s degree in electrical engineering from the University of California, San Diego, and expects to receive an MBA from California State University, San Marcos in December of 2000.
Britney Bottlieb, George’s wife, is a CPA. Although Britney is not an official employee of the business, she serves on the Board of Directors. The fact that Britney has worked as an accountant at several major companies in Illinois and California makes her an excellent resource for financial and accounting advice.
Albert Bottlieb, George’s father, also serves on the Board of Directors. Albert was formerly the president of Albert B. & Co., a large pinball manufacturing company. Having successfully managed a large manufacturing organization for several years, Albert’s insights and advice are very valuable to Bottlieb Innovations.
Financial Plan
The financial picture is very encouraging. Bottlieb Innovations has a great product. If the company can successfully segment the market and generate interest in the Digital Geographer product, as well as meet the production volumes required, the financial targets are very achievable.
7.1 Important Assumptions
The financial plan depends on important assumptions, shown in the following General Assumptions table.
| General Assumptions | |||
| Year 1 | Year 2 | Year 3 | |
| Plan Month | 1 | 2 | 3 |
| Current Interest Rate | 10.00% | 10.00% | 10.00% |
| Long-term Interest Rate | 10.00% | 10.00% | 10.00% |
| Tax Rate | 30.00% | 30.00% | 30.00% |
| Other | 0 | 0 | 0 |
7.2 Key Financial Indicators
The following chart shows changes in the following benchmark financial indicators: sales, gross margin, operating expenses, collection days, and inventory turnover. Sales are expected to almost double between FY2002 and FY2003, while operating expenses are only expected to increase by 22%.

7.3 Break-even Analysis
Bottlieb Innovations’ break-even analysis is based on running costs, the “burn-rate” costs incurred to keep the business running, not on theoretical fixed costs that would be relevant only if the company were closing. Between payroll, rent, utilities, and basic marketing costs, a good estimate of monthly fixed costs is shown in the following chart and table, which details the break-even information.
The break-even analysis is based on an average sales revenue of $425 per unit. An exact average is not necessary, $425 is close enough to help us understand what a real break-even point might be. The essential insight here is that the expected sales level will keep the business running comfortably above break-even.

| Break-even Analysis | |
| Monthly Units Break-even | 37 |
| Monthly Revenue Break-even | $15,830 |
| Assumptions: | |
| Average Per-Unit Revenue | $425.00 |
| Average Per-Unit Variable Cost | $264.47 |
| Estimated Monthly Fixed Cost | $5,979 |
7.4 Projected Profit and Loss
Management’s primary goal is to make Bottlieb Innovations profitable before the end of FY2001. More specifically, management is aiming to make the business turn a profit in the month of September, the final month of FY2001. Maintaining a high gross margin in the first year is a key component of the profitability goal. The following chart illustrates the expected FY2001 monthly profit numbers.
Projected yearly profit numbers are shown in the following chart and table. Although Bottlieb Innovations is expected to be profitable in September of 2001, it will still lose money in FY2001 overall, due to losses in earlier months of the fiscal year. The business is expected to earn healthy profits in FY2001 and FY2002.


| Pro Forma Profit and Loss | |||
| Year 1 | Year 2 | Year 3 | |
| Sales | $161,500 | $1,582,500 | $2,752,000 |
| Direct Cost of Sales | $100,500 | $883,500 | $1,320,000 |
| Production Payroll | $6,000 | $66,000 | $89,000 |
| Other | $0 | $0 | $0 |
| Total Cost of Sales | $106,500 | $949,500 | $1,409,000 |
| Gross Margin | $55,000 | $633,000 | $1,343,000 |
| Gross Margin % | 34.06% | 40.00% | 48.80% |
| Operating Expenses | |||
| Sales and Marketing Expenses | |||
| Sales and Marketing Payroll | $0 | $30,000 | $40,000 |
| Advertising/Promotion | $1,350 | $3,000 | $6,000 |
| Travel | $3,000 | $6,000 | $9,000 |
| Miscellaneous | $900 | $1,200 | $1,500 |
| Total Sales and Marketing Expenses | $5,250 | $40,200 | $56,500 |
| Sales and Marketing % | 3.25% | 2.54% | 2.05% |
| General and Administrative Expenses | |||
| General and Administrative Payroll | $46,000 | $138,000 | $162,000 |
| Sales and Marketing and Other Expenses | $0 | $0 | $0 |
| Depreciation | $0 | $0 | $0 |
| Leased Equipment | $0 | $0 | $0 |
| Utilities | $2,400 | $2,400 | $3,000 |
| Insurance | $1,200 | $1,200 | $1,500 |
| Rent | $8,400 | $8,400 | $9,600 |
| Payroll Taxes | $5,500 | $24,200 | $29,900 |
| Other General and Administrative Expenses | $0 | $0 | $0 |
| Total General and Administrative Expenses | $63,500 | $174,200 | $206,000 |
| General and Administrative % | 39.32% | 11.01% | 7.49% |
| Other Expenses: | |||
| Other Payroll | $3,000 | $8,000 | $8,000 |
| Consultants | $0 | $0 | $0 |
| Contract/Consultants | $0 | $0 | $0 |
| Total Other Expenses | $3,000 | $8,000 | $8,000 |
| Other % | 1.86% | 0.51% | 0.29% |
| Total Operating Expenses | $71,750 | $222,400 | $270,500 |
| Profit Before Interest and Taxes | ($16,750) | $410,600 | $1,072,500 |
| EBITDA | ($16,750) | $410,600 | $1,072,500 |
| Interest Expense | $0 | $0 | $0 |
| Taxes Incurred | $0 | $123,180 | $321,750 |
| Net Profit | ($16,750) | $287,420 | $750,750 |
| Net Profit/Sales | -10.37% | 18.16% | 27.28% |
7.5 Projected Cash Flow
Although Bottlieb Innovations is expected to be profitable by the end of FY2001, there are still drains on the cash flow. The cash flow numbers illustrated in the following chart are based on very conservative estimates of first year sales. Since manufacturing and assembling the Digital Geographer is not capital intensive, profits should be directly tied to sales and variable costs. Personnel costs will start to impact the cash flow more severely in FY2002.

| Pro Forma Cash Flow | |||
| Year 1 | Year 2 | Year 3 | |
| Cash Received | |||
| Cash from Operations | |||
| Cash Sales | $121,125 | $1,186,875 | $2,064,000 |
| Cash from Receivables | $21,533 | $229,842 | $551,558 |
| Subtotal Cash from Operations | $142,658 | $1,416,717 | $2,615,558 |
| Additional Cash Received | |||
| Sales Tax, VAT, HST/GST Received | $0 | $0 | $0 |
| New Current Borrowing | $0 | $0 | $0 |
| New Other Liabilities (interest-free) | $0 | $0 | $0 |
| New Long-term Liabilities | $0 | $0 | $0 |
| Sales of Other Current Assets | $0 | $0 | $0 |
| Sales of Long-term Assets | $0 | $0 | $0 |
| New Investment Received | $0 | $0 | $0 |
| Subtotal Cash Received | $142,658 | $1,416,717 | $2,615,558 |
| Expenditures | Year 1 | Year 2 | Year 3 |
| Expenditures from Operations | |||
| Cash Spending | $55,000 | $242,000 | $299,000 |
| Bill Payments | $112,249 | $1,167,711 | $1,759,666 |
| Subtotal Spent on Operations | $167,249 | $1,409,711 | $2,058,666 |
| Additional Cash Spent | |||
| Sales Tax, VAT, HST/GST Paid Out | $0 | $0 | $0 |
| Principal Repayment of Current Borrowing | $0 | $0 | $0 |
| Other Liabilities Principal Repayment | $0 | $0 | $0 |
| Long-term Liabilities Principal Repayment | $0 | $0 | $0 |
| Purchase Other Current Assets | $0 | $0 | $0 |
| Purchase Long-term Assets | $0 | $0 | $0 |
| Dividends | $0 | $0 | $0 |
| Subtotal Cash Spent | $167,249 | $1,409,711 | $2,058,666 |
| Net Cash Flow | ($24,590) | $7,006 | $556,892 |
| Cash Balance | $72,410 | $79,416 | $636,308 |
7.6 Projected Balance Sheet
The projected balance sheet, shown in the following table, shows a healthy increase in net worth. The company’s value is projected to increase steadily over the first three years.
| Pro Forma Balance Sheet | |||
| Year 1 | Year 2 | Year 3 | |
| Assets | |||
| Current Assets | |||
| Cash | $72,410 | $79,416 | $636,308 |
| Accounts Receivable | $18,842 | $184,625 | $321,067 |
| Inventory | $28,600 | $211,191 | $315,532 |
| Other Current Assets | $1,800 | $1,800 | $1,800 |
| Total Current Assets | $121,651 | $477,032 | $1,274,707 |
| Long-term Assets | |||
| Long-term Assets | $0 | $0 | $0 |
| Accumulated Depreciation | $0 | $0 | $0 |
| Total Long-term Assets | $0 | $0 | $0 |
| Total Assets | $121,651 | $477,032 | $1,274,707 |
| Liabilities and Capital | Year 1 | Year 2 | Year 3 |
| Current Liabilities | |||
| Accounts Payable | $33,601 | $101,562 | $148,487 |
| Current Borrowing | $0 | $0 | $0 |
| Other Current Liabilities | $40,000 | $40,000 | $40,000 |
| Subtotal Current Liabilities | $73,601 | $141,562 | $188,487 |
| Long-term Liabilities | $0 | $0 | $0 |
| Total Liabilities | $73,601 | $141,562 | $188,487 |
| Paid-in Capital | $100,000 | $100,000 | $100,000 |
| Retained Earnings | ($35,200) | ($51,950) | $235,470 |
| Earnings | ($16,750) | $287,420 | $750,750 |
| Total Capital | $48,050 | $335,470 | $1,086,220 |
| Total Liabilities and Capital | $121,651 | $477,032 | $1,274,707 |
| Net Worth | $48,050 | $335,470 | $1,086,220 |
7.7 Business Ratios
Standard business ratios are included in the following table. Industry profile ratios based on the Standard Industrial Classification (SIC) code 8713, Surveying services, are shown for comparison. Bottlieb Innovations’ ratios show a plan for healthy, solid growth. Gross margin, net profit margin and ROA all show increases over time.
| Ratio Analysis | ||||
| Year 1 | Year 2 | Year 3 | Industry Profile | |
| Sales Growth | 0.00% | 879.88% | 73.90% | 7.10% |
| Percent of Total Assets | ||||
| Accounts Receivable | 15.49% | 38.70% | 25.19% | 34.20% |
| Inventory | 23.51% | 44.27% | 24.75% | 2.80% |
| Other Current Assets | 1.48% | 0.38% | 0.14% | 43.00% |
| Total Current Assets | 100.00% | 100.00% | 100.00% | 80.00% |
| Long-term Assets | 0.00% | 0.00% | 0.00% | 20.00% |
| Total Assets | 100.00% | 100.00% | 100.00% | 100.00% |
| Current Liabilities | 60.50% | 29.68% | 14.79% | 47.80% |
| Long-term Liabilities | 0.00% | 0.00% | 0.00% | 11.50% |
| Total Liabilities | 60.50% | 29.68% | 14.79% | 59.30% |
| Net Worth | 39.50% | 70.32% | 85.21% | 40.70% |
| Percent of Sales | ||||
| Sales | 100.00% | 100.00% | 100.00% | 100.00% |
| Gross Margin | 34.06% | 40.00% | 48.80% | 0.00% |
| Selling, General & Administrative Expenses | 44.43% | 21.84% | 21.52% | 80.50% |
| Advertising Expenses | 0.84% | 0.19% | 0.22% | 0.20% |
| Profit Before Interest and Taxes | -10.37% | 25.95% | 38.97% | 3.00% |
| Main Ratios | ||||
| Current | 1.65 | 3.37 | 6.76 | 1.68 |
| Quick | 1.26 | 1.88 | 5.09 | 1.38 |
| Total Debt to Total Assets | 60.50% | 29.68% | 14.79% | 59.30% |
| Pre-tax Return on Net Worth | -34.86% | 122.40% | 98.74% | 6.40% |
| Pre-tax Return on Assets | -13.77% | 86.07% | 84.14% | 15.70% |
| Additional Ratios | Year 1 | Year 2 | Year 3 | |
| Net Profit Margin | -10.37% | 18.16% | 27.28% | n.a |
| Return on Equity | -34.86% | 85.68% | 69.12% | n.a |
| Activity Ratios | ||||
| Accounts Receivable Turnover | 2.14 | 2.14 | 2.14 | n.a |
| Collection Days | 52 | 94 | 134 | n.a |
| Inventory Turnover | 9.16 | 7.37 | 5.01 | n.a |
| Accounts Payable Turnover | 4.34 | 12.17 | 12.17 | n.a |
| Payment Days | 27 | 20 | 25 | n.a |
| Total Asset Turnover | 1.33 | 3.32 | 2.16 | n.a |
| Debt Ratios | ||||
| Debt to Net Worth | 1.53 | 0.42 | 0.17 | n.a |
| Current Liab. to Liab. | 1.00 | 1.00 | 1.00 | n.a |
| Liquidity Ratios | ||||
| Net Working Capital | $48,050 | $335,470 | $1,086,220 | n.a |
| Interest Coverage | 0.00 | 0.00 | 0.00 | n.a |
| Additional Ratios | ||||
| Assets to Sales | 0.75 | 0.30 | 0.46 | n.a |
| Current Debt/Total Assets | 61% | 30% | 15% | n.a |
| Acid Test | 1.01 | 0.57 | 3.39 | n.a |
| Sales/Net Worth | 3.36 | 4.72 | 2.53 | n.a |
| Dividend Payout | 0.00 | 0.00 | 0.00 | n.a |
Appendix
| Sales Forecast | |||||||||||||
| Month 1 | Month 2 | Month 3 | Month 4 | Month 5 | Month 6 | Month 7 | Month 8 | Month 9 | Month 10 | Month 11 | Month 12 | ||
| Unit Sales | |||||||||||||
| Digital Geographer[DG-1] | 0% | 0 | 0 | 0 | 5 | 10 | 15 | 25 | 35 | 50 | 60 | 80 | 100 |
| Digital Geographer[DG-2] | 0% | 0 | 0 | 0 | 0 | 0 | 0 | 0 | 0 | 0 | 0 | 0 | 0 |
| Other | 0% | 0 | 0 | 0 | 0 | 0 | 0 | 0 | 0 | 0 | 0 | 0 | 0 |
| Total Unit Sales | 0 | 0 | 0 | 5 | 10 | 15 | 25 | 35 | 50 | 60 | 80 | 100 | |
| Unit Prices | Month 1 | Month 2 | Month 3 | Month 4 | Month 5 | Month 6 | Month 7 | Month 8 | Month 9 | Month 10 | Month 11 | Month 12 | |
| Digital Geographer[DG-1] | $0.00 | $0.00 | $0.00 | $425.00 | $425.00 | $425.00 | $425.00 | $425.00 | $425.00 | $425.00 | $425.00 | $425.00 | |
| Digital Geographer[DG-2] | $0.00 | $0.00 | $0.00 | $0.00 | $0.00 | $0.00 | $0.00 | $0.00 | $0.00 | $0.00 | $0.00 | $0.00 | |
| Other | $0.00 | $0.00 | $0.00 | $0.00 | $0.00 | $0.00 | $0.00 | $0.00 | $0.00 | $0.00 | $0.00 | $0.00 | |
| Sales | |||||||||||||
| Digital Geographer[DG-1] | $0 | $0 | $0 | $2,125 | $4,250 | $6,375 | $10,625 | $14,875 | $21,250 | $25,500 | $34,000 | $42,500 | |
| Digital Geographer[DG-2] | $0 | $0 | $0 | $0 | $0 | $0 | $0 | $0 | $0 | $0 | $0 | $0 | |
| Other | $0 | $0 | $0 | $0 | $0 | $0 | $0 | $0 | $0 | $0 | $0 | $0 | |
| Total Sales | $0 | $0 | $0 | $2,125 | $4,250 | $6,375 | $10,625 | $14,875 | $21,250 | $25,500 | $34,000 | $42,500 | |
| Direct Unit Costs | Month 1 | Month 2 | Month 3 | Month 4 | Month 5 | Month 6 | Month 7 | Month 8 | Month 9 | Month 10 | Month 11 | Month 12 | |
| Digital Geographer[DG-1] | 0.00% | $0.00 | $0.00 | $0.00 | $280.00 | $280.00 | $280.00 | $270.00 | $270.00 | $270.00 | $260.00 | $260.00 | $260.00 |
| Digital Geographer[DG-2] | 0.00% | $0.00 | $0.00 | $0.00 | $0.00 | $0.00 | $0.00 | $0.00 | $0.00 | $0.00 | $0.00 | $0.00 | $0.00 |
| Other | 0.00% | $0.00 | $0.00 | $0.00 | $0.00 | $0.00 | $0.00 | $0.00 | $0.00 | $0.00 | $0.00 | $0.00 | $0.00 |
| Direct Cost of Sales | |||||||||||||
| Digital Geographer[DG-1] | $0 | $0 | $0 | $1,400 | $2,800 | $4,200 | $6,750 | $9,450 | $13,500 | $15,600 | $20,800 | $26,000 | |
| Digital Geographer[DG-2] | $0 | $0 | $0 | $0 | $0 | $0 | $0 | $0 | $0 | $0 | $0 | $0 | |
| Other | $0 | $0 | $0 | $0 | $0 | $0 | $0 | $0 | $0 | $0 | $0 | $0 | |
| Subtotal Direct Cost of Sales | $0 | $0 | $0 | $1,400 | $2,800 | $4,200 | $6,750 | $9,450 | $13,500 | $15,600 | $20,800 | $26,000 | |
| Personnel Plan | |||||||||||||
| Month 1 | Month 2 | Month 3 | Month 4 | Month 5 | Month 6 | Month 7 | Month 8 | Month 9 | Month 10 | Month 11 | Month 12 | ||
| Production Personnel | |||||||||||||
| Supervisor | $0 | $0 | $0 | $0 | $0 | $0 | $0 | $0 | $1,200 | $1,200 | $1,200 | $2,400 | |
| Assembler 1 | $0 | $0 | $0 | $0 | $0 | $0 | $0 | $0 | $0 | $0 | $0 | $0 | |
| Assembler 2 | $0 | $0 | $0 | $0 | $0 | $0 | $0 | $0 | $0 | $0 | $0 | $0 | |
| Other | $0 | $0 | $0 | $0 | $0 | $0 | $0 | $0 | $0 | $0 | $0 | $0 | |
| Subtotal | $0 | $0 | $0 | $0 | $0 | $0 | $0 | $0 | $1,200 | $1,200 | $1,200 | $2,400 | |
| Sales and Marketing Personnel | |||||||||||||
| Product Manager | $0 | $0 | $0 | $0 | $0 | $0 | $0 | $0 | $0 | $0 | $0 | $0 | |
| Other | $0 | $0 | $0 | $0 | $0 | $0 | $0 | $0 | $0 | $0 | $0 | $0 | |
| Subtotal | $0 | $0 | $0 | $0 | $0 | $0 | $0 | $0 | $0 | $0 | $0 | $0 | |
| General and Administrative Personnel | |||||||||||||
| George Bottlieb, President | $0 | $0 | $0 | $0 | $2,500 | $3,000 | $3,500 | $4,000 | $4,500 | $5,000 | $5,000 | $5,000 | |
| Jay Rosenburg, Vice-President | $0 | $0 | $0 | $0 | $0 | $0 | $0 | $0 | $0 | $4,500 | $4,500 | $4,500 | |
| Receptionist / Administrative Assistant | $0 | $0 | $0 | $0 | $0 | $0 | $0 | $0 | $0 | $0 | $0 | $0 | |
| Other | $0 | $0 | $0 | $0 | $0 | $0 | $0 | $0 | $0 | $0 | $0 | $0 | |
| Subtotal | $0 | $0 | $0 | $0 | $2,500 | $3,000 | $3,500 | $4,000 | $4,500 | $9,500 | $9,500 | $9,500 | |
| Other Personnel | |||||||||||||
| Contractor, Mechanical Design | $0 | $0 | $0 | $1,000 | $0 | $0 | $0 | $0 | $0 | $0 | $0 | $0 | |
| Contractor, PCB Design | $2,000 | $0 | $0 | $0 | $0 | $0 | $0 | $0 | $0 | $0 | $0 | $0 | |
| Other | $0 | $0 | $0 | $0 | $0 | $0 | $0 | $0 | $0 | $0 | $0 | $0 | |
| Subtotal | $2,000 | $0 | $0 | $1,000 | $0 | $0 | $0 | $0 | $0 | $0 | $0 | $0 | |
| Total People | 0 | 0 | 0 | 2 | 2 | 2 | 2 | 2 | 2 | 3 | 3 | 3 | |
| Total Payroll | $2,000 | $0 | $0 | $1,000 | $2,500 | $3,000 | $3,500 | $4,000 | $5,700 | $10,700 | $10,700 | $11,900 | |
| General Assumptions | |||||||||||||
| Month 1 | Month 2 | Month 3 | Month 4 | Month 5 | Month 6 | Month 7 | Month 8 | Month 9 | Month 10 | Month 11 | Month 12 | ||
| Plan Month | 1 | 2 | 3 | 4 | 5 | 6 | 7 | 8 | 9 | 10 | 11 | 12 | |
| Current Interest Rate | 10.00% | 10.00% | 10.00% | 10.00% | 10.00% | 10.00% | 10.00% | 10.00% | 10.00% | 10.00% | 10.00% | 10.00% | |
| Long-term Interest Rate | 10.00% | 10.00% | 10.00% | 10.00% | 10.00% | 10.00% | 10.00% | 10.00% | 10.00% | 10.00% | 10.00% | 10.00% | |
| Tax Rate | 30.00% | 30.00% | 30.00% | 30.00% | 30.00% | 30.00% | 30.00% | 30.00% | 30.00% | 30.00% | 30.00% | 30.00% | |
| Other | 0 | 0 | 0 | 0 | 0 | 0 | 0 | 0 | 0 | 0 | 0 | 0 | |
| Pro Forma Balance Sheet | |||||||||||||
| Month 1 | Month 2 | Month 3 | Month 4 | Month 5 | Month 6 | Month 7 | Month 8 | Month 9 | Month 10 | Month 11 | Month 12 | ||
| Assets | Starting Balances | ||||||||||||
| Current Assets | |||||||||||||
| Cash | $97,000 | $94,960 | $93,767 | $92,767 | $92,342 | $91,450 | $90,650 | $88,580 | $85,911 | $84,330 | $76,479 | $75,606 | $72,410 |
| Accounts Receivable | $0 | $0 | $0 | $0 | $531 | $1,576 | $2,621 | $4,197 | $6,286 | $8,907 | $11,510 | $14,663 | $18,842 |
| Inventory | $6,000 | $6,000 | $6,000 | $6,000 | $4,600 | $3,080 | $4,620 | $7,425 | $10,395 | $14,850 | $17,160 | $22,880 | $28,600 |
| Other Current Assets | $1,800 | $1,800 | $1,800 | $1,800 | $1,800 | $1,800 | $1,800 | $1,800 | $1,800 | $1,800 | $1,800 | $1,800 | $1,800 |
| Total Current Assets | $104,800 | $102,760 | $101,567 | $100,567 | $99,273 | $97,906 | $99,690 | $102,002 | $104,393 | $109,888 | $106,949 | $114,949 | $121,651 |
| Long-term Assets | |||||||||||||
| Long-term Assets | $0 | $0 | $0 | $0 | $0 | $0 | $0 | $0 | $0 | $0 | $0 | $0 | $0 |
| Accumulated Depreciation | $0 | $0 | $0 | $0 | $0 | $0 | $0 | $0 | $0 | $0 | $0 | $0 | $0 |
| Total Long-term Assets | $0 | $0 | $0 | $0 | $0 | $0 | $0 | $0 | $0 | $0 | $0 | $0 | $0 |
| Total Assets | $104,800 | $102,760 | $101,567 | $100,567 | $99,273 | $97,906 | $99,690 | $102,002 | $104,393 | $109,888 | $106,949 | $114,949 | $121,651 |
| Liabilities and Capital | Month 1 | Month 2 | Month 3 | Month 4 | Month 5 | Month 6 | Month 7 | Month 8 | Month 9 | Month 10 | Month 11 | Month 12 | |
| Current Liabilities | |||||||||||||
| Accounts Payable | $0 | $1,160 | $967 | $967 | $1,498 | $2,881 | $7,240 | $10,977 | $13,843 | $19,358 | $20,039 | $28,459 | $33,601 |
| Current Borrowing | $0 | $0 | $0 | $0 | $0 | $0 | $0 | $0 | $0 | $0 | $0 | $0 | $0 |
| Other Current Liabilities | $40,000 | $40,000 | $40,000 | $40,000 | $40,000 | $40,000 | $40,000 | $40,000 | $40,000 | $40,000 | $40,000 | $40,000 | $40,000 |
| Subtotal Current Liabilities | $40,000 | $41,160 | $40,967 | $40,967 | $41,498 | $42,881 | $47,240 | $50,977 | $53,843 | $59,358 | $60,039 | $68,459 | $73,601 |
| Long-term Liabilities | $0 | $0 | $0 | $0 | $0 | $0 | $0 | $0 | $0 | $0 | $0 | $0 | $0 |
| Total Liabilities | $40,000 | $41,160 | $40,967 | $40,967 | $41,498 | $42,881 | $47,240 | $50,977 | $53,843 | $59,358 | $60,039 | $68,459 | $73,601 |
| Paid-in Capital | $100,000 | $100,000 | $100,000 | $100,000 | $100,000 | $100,000 | $100,000 | $100,000 | $100,000 | $100,000 | $100,000 | $100,000 | $100,000 |
| Retained Earnings | ($35,200) | ($35,200) | ($35,200) | ($35,200) | ($35,200) | ($35,200) | ($35,200) | ($35,200) | ($35,200) | ($35,200) | ($35,200) | ($35,200) | ($35,200) |
| Earnings | $0 | ($3,200) | ($4,200) | ($5,200) | ($7,025) | ($9,775) | ($12,350) | ($13,775) | ($14,250) | ($14,270) | ($17,890) | ($18,310) | ($16,750) |
| Total Capital | $64,800 | $61,600 | $60,600 | $59,600 | $57,775 | $55,025 | $52,450 | $51,025 | $50,550 | $50,530 | $46,910 | $46,490 | $48,050 |
| Total Liabilities and Capital | $104,800 | $102,760 | $101,567 | $100,567 | $99,273 | $97,906 | $99,690 | $102,002 | $104,393 | $109,888 | $106,949 | $114,949 | $121,651 |
| Net Worth | $64,800 | $61,600 | $60,600 | $59,600 | $57,775 | $55,025 | $52,450 | $51,025 | $50,550 | $50,530 | $46,910 | $46,490 | $48,050 |
| Pro Forma Profit and Loss | |||||||||||||
| Month 1 | Month 2 | Month 3 | Month 4 | Month 5 | Month 6 | Month 7 | Month 8 | Month 9 | Month 10 | Month 11 | Month 12 | ||
| Sales | $0 | $0 | $0 | $2,125 | $4,250 | $6,375 | $10,625 | $14,875 | $21,250 | $25,500 | $34,000 | $42,500 | |
| Direct Cost of Sales | $0 | $0 | $0 | $1,400 | $2,800 | $4,200 | $6,750 | $9,450 | $13,500 | $15,600 | $20,800 | $26,000 | |
| Production Payroll | $0 | $0 | $0 | $0 | $0 | $0 | $0 | $0 | $1,200 | $1,200 | $1,200 | $2,400 | |
| Other | $0 | $0 | $0 | $0 | $0 | $0 | $0 | $0 | $0 | $0 | $0 | $0 | |
| Total Cost of Sales | $0 | $0 | $0 | $1,400 | $2,800 | $4,200 | $6,750 | $9,450 | $14,700 | $16,800 | $22,000 | $28,400 | |
| Gross Margin | $0 | $0 | $0 | $725 | $1,450 | $2,175 | $3,875 | $5,425 | $6,550 | $8,700 | $12,000 | $14,100 | |
| Gross Margin % | 0.00% | 0.00% | 0.00% | 34.12% | 34.12% | 34.12% | 36.47% | 36.47% | 30.82% | 34.12% | 35.29% | 33.18% | |
| Operating Expenses | |||||||||||||
| Sales and Marketing Expenses | |||||||||||||
| Sales and Marketing Payroll | $0 | $0 | $0 | $0 | $0 | $0 | $0 | $0 | $0 | $0 | $0 | $0 | |
| Advertising/Promotion | $0 | $0 | $0 | $100 | $100 | $100 | $100 | $150 | $150 | $150 | $250 | $250 | |
| Travel | $0 | $0 | $0 | $250 | $250 | $250 | $250 | $250 | $250 | $500 | $500 | $500 | |
| Miscellaneous | $0 | $0 | $0 | $100 | $100 | $100 | $100 | $100 | $100 | $100 | $100 | $100 | |
| Total Sales and Marketing Expenses | $0 | $0 | $0 | $450 | $450 | $450 | $450 | $500 | $500 | $750 | $850 | $850 | |
| Sales and Marketing % | 0.00% | 0.00% | 0.00% | 21.18% | 10.59% | 7.06% | 4.24% | 3.36% | 2.35% | 2.94% | 2.50% | 2.00% | |
| General and Administrative Expenses | |||||||||||||
| General and Administrative Payroll | $0 | $0 | $0 | $0 | $2,500 | $3,000 | $3,500 | $4,000 | $4,500 | $9,500 | $9,500 | $9,500 | |
| Sales and Marketing and Other Expenses | $0 | $0 | $0 | $0 | $0 | $0 | $0 | $0 | $0 | $0 | $0 | $0 | |
| Depreciation | $0 | $0 | $0 | $0 | $0 | $0 | $0 | $0 | $0 | $0 | $0 | $0 | |
| Leased Equipment | $0 | $0 | $0 | $0 | $0 | $0 | $0 | $0 | $0 | $0 | $0 | $0 | |
| Utilities | $200 | $200 | $200 | $200 | $200 | $200 | $200 | $200 | $200 | $200 | $200 | $200 | |
| Insurance | $100 | $100 | $100 | $100 | $100 | $100 | $100 | $100 | $100 | $100 | $100 | $100 | |
| Rent | $700 | $700 | $700 | $700 | $700 | $700 | $700 | $700 | $700 | $700 | $700 | $700 | |
| Payroll Taxes | 10% | $200 | $0 | $0 | $100 | $250 | $300 | $350 | $400 | $570 | $1,070 | $1,070 | $1,190 |
| Other General and Administrative Expenses | $0 | $0 | $0 | $0 | $0 | $0 | $0 | $0 | $0 | $0 | $0 | $0 | |
| Total General and Administrative Expenses | $1,200 | $1,000 | $1,000 | $1,100 | $3,750 | $4,300 | $4,850 | $5,400 | $6,070 | $11,570 | $11,570 | $11,690 | |
| General and Administrative % | 0.00% | 0.00% | 0.00% | 51.76% | 88.24% | 67.45% | 45.65% | 36.30% | 28.56% | 45.37% | 34.03% | 27.51% | |
| Other Expenses: | |||||||||||||
| Other Payroll | $2,000 | $0 | $0 | $1,000 | $0 | $0 | $0 | $0 | $0 | $0 | $0 | $0 | |
| Consultants | $0 | $0 | $0 | $0 | $0 | $0 | $0 | $0 | $0 | $0 | $0 | $0 | |
| Contract/Consultants | $0 | $0 | $0 | $0 | $0 | $0 | $0 | $0 | $0 | $0 | $0 | $0 | |
| Total Other Expenses | $2,000 | $0 | $0 | $1,000 | $0 | $0 | $0 | $0 | $0 | $0 | $0 | $0 | |
| Other % | 0.00% | 0.00% | 0.00% | 47.06% | 0.00% | 0.00% | 0.00% | 0.00% | 0.00% | 0.00% | 0.00% | 0.00% | |
| Total Operating Expenses | $3,200 | $1,000 | $1,000 | $2,550 | $4,200 | $4,750 | $5,300 | $5,900 | $6,570 | $12,320 | $12,420 | $12,540 | |
| Profit Before Interest and Taxes | ($3,200) | ($1,000) | ($1,000) | ($1,825) | ($2,750) | ($2,575) | ($1,425) | ($475) | ($20) | ($3,620) | ($420) | $1,560 | |
| EBITDA | ($3,200) | ($1,000) | ($1,000) | ($1,825) | ($2,750) | ($2,575) | ($1,425) | ($475) | ($20) | ($3,620) | ($420) | $1,560 | |
| Interest Expense | $0 | $0 | $0 | $0 | $0 | $0 | $0 | $0 | $0 | $0 | $0 | $0 | |
| Taxes Incurred | $0 | $0 | $0 | $0 | $0 | $0 | $0 | $0 | $0 | $0 | $0 | $0 | |
| Net Profit | ($3,200) | ($1,000) | ($1,000) | ($1,825) | ($2,750) | ($2,575) | ($1,425) | ($475) | ($20) | ($3,620) | ($420) | $1,560 | |
| Net Profit/Sales | 0.00% | 0.00% | 0.00% | -85.88% | -64.71% | -40.39% | -13.41% | -3.19% | -0.09% | -14.20% | -1.24% | 3.67% | |
| Pro Forma Cash Flow | |||||||||||||
| Month 1 | Month 2 | Month 3 | Month 4 | Month 5 | Month 6 | Month 7 | Month 8 | Month 9 | Month 10 | Month 11 | Month 12 | ||
| Cash Received | |||||||||||||
| Cash from Operations | |||||||||||||
| Cash Sales | $0 | $0 | $0 | $1,594 | $3,188 | $4,781 | $7,969 | $11,156 | $15,938 | $19,125 | $25,500 | $31,875 | |
| Cash from Receivables | $0 | $0 | $0 | $0 | $18 | $549 | $1,080 | $1,629 | $2,692 | $3,772 | $5,348 | $6,446 | |
| Subtotal Cash from Operations | $0 | $0 | $0 | $1,594 | $3,205 | $5,330 | $9,049 | $12,785 | $18,629 | $22,897 | $30,848 | $38,321 | |
| Additional Cash Received | |||||||||||||
| Sales Tax, VAT, HST/GST Received | 0.00% | $0 | $0 | $0 | $0 | $0 | $0 | $0 | $0 | $0 | $0 | $0 | $0 |
| New Current Borrowing | $0 | $0 | $0 | $0 | $0 | $0 | $0 | $0 | $0 | $0 | $0 | $0 | |
| New Other Liabilities (interest-free) | $0 | $0 | $0 | $0 | $0 | $0 | $0 | $0 | $0 | $0 | $0 | $0 | |
| New Long-term Liabilities | $0 | $0 | $0 | $0 | $0 | $0 | $0 | $0 | $0 | $0 | $0 | $0 | |
| Sales of Other Current Assets | $0 | $0 | $0 | $0 | $0 | $0 | $0 | $0 | $0 | $0 | $0 | $0 | |
| Sales of Long-term Assets | $0 | $0 | $0 | $0 | $0 | $0 | $0 | $0 | $0 | $0 | $0 | $0 | |
| New Investment Received | $0 | $0 | $0 | $0 | $0 | $0 | $0 | $0 | $0 | $0 | $0 | $0 | |
| Subtotal Cash Received | $0 | $0 | $0 | $1,594 | $3,205 | $5,330 | $9,049 | $12,785 | $18,629 | $22,897 | $30,848 | $38,321 | |
| Expenditures | Month 1 | Month 2 | Month 3 | Month 4 | Month 5 | Month 6 | Month 7 | Month 8 | Month 9 | Month 10 | Month 11 | Month 12 | |
| Expenditures from Operations | |||||||||||||
| Cash Spending | $2,000 | $0 | $0 | $1,000 | $2,500 | $3,000 | $3,500 | $4,000 | $5,700 | $10,700 | $10,700 | $11,900 | |
| Bill Payments | $40 | $1,193 | $1,000 | $1,018 | $1,598 | $3,130 | $7,619 | $11,454 | $14,510 | $20,049 | $21,020 | $29,617 | |
| Subtotal Spent on Operations | $2,040 | $1,193 | $1,000 | $2,018 | $4,098 | $6,130 | $11,119 | $15,454 | $20,210 | $30,749 | $31,720 | $41,517 | |
| Additional Cash Spent | |||||||||||||
| Sales Tax, VAT, HST/GST Paid Out | $0 | $0 | $0 | $0 | $0 | $0 | $0 | $0 | $0 | $0 | $0 | $0 | |
| Principal Repayment of Current Borrowing | $0 | $0 | $0 | $0 | $0 | $0 | $0 | $0 | $0 | $0 | $0 | $0 | |
| Other Liabilities Principal Repayment | $0 | $0 | $0 | $0 | $0 | $0 | $0 | $0 | $0 | $0 | $0 | $0 | |
| Long-term Liabilities Principal Repayment | $0 | $0 | $0 | $0 | $0 | $0 | $0 | $0 | $0 | $0 | $0 | $0 | |
| Purchase Other Current Assets | $0 | $0 | $0 | $0 | $0 | $0 | $0 | $0 | $0 | $0 | $0 | $0 | |
| Purchase Long-term Assets | $0 | $0 | $0 | $0 | $0 | $0 | $0 | $0 | $0 | $0 | $0 | $0 | |
| Dividends | $0 | $0 | $0 | $0 | $0 | $0 | $0 | $0 | $0 | $0 | $0 | $0 | |
| Subtotal Cash Spent | $2,040 | $1,193 | $1,000 | $2,018 | $4,098 | $6,130 | $11,119 | $15,454 | $20,210 | $30,749 | $31,720 | $41,517 | |
| Net Cash Flow | ($2,040) | ($1,193) | ($1,000) | ($425) | ($892) | ($800) | ($2,070) | ($2,668) | ($1,581) | ($7,852) | ($872) | ($3,197) | |
| Cash Balance | $94,960 | $93,767 | $92,767 | $92,342 | $91,450 | $90,650 | $88,580 | $85,911 | $84,330 | $76,479 | $75,606 | $72,410 | |

