
Bioring SA
Executive Summary
Bioring SA produces niche-specific rings for cardiac valve repair. It has its main office in Lonay (CH) and maintains a small manufacturing and assembly plant in Lonay, Switzerland. Its products are to be sold through single or multiple distributors.
- This business plan is part of our regular business planning process. We revise this plan every quarter and it is placed under change control.
- In the next two years we intend to develop two new products and to improve revenues.
- Our keys to success and critical factors for the next year are, in order of importance:
- Product approval: CE mark.
- Sales to dealers in volume.
- Financial control and cash flow planning.
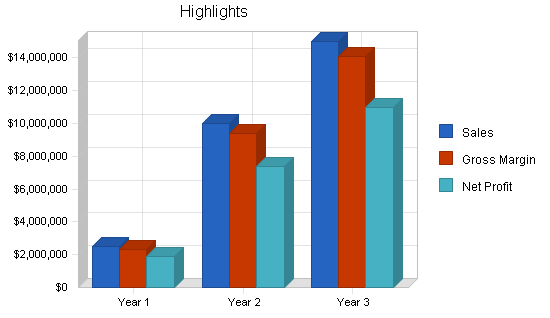
The following chart illustrates highlights of our financial performance as projected for the next three years. Sales and profits should continue to grow.
1.1 Objectives
- To give Bioring SA the market presence needed to support marketing and sales goals, and to attract distributors of new Bioring products.
- To develop two new Bioring products by the end of year four.
- To increase sales to reach $312,500 monthly sales by the end of year two, and $830,000 monthly by the end of month eight of year three.
- To control expenditures to serve the best dividends to the shareholders.
1.2 Mission
Bioring SA addresses the surgical repair techniques which are implemented in open heart surgery. This business is based on a product owned by the company, which is a cardiac implant more precisely called “Kalangos Biodegradable Ring.”
We intend to make enough profit to generate a fair return for our investors and finance continued growth and development in quality products. We also maintain a friendly, fair, and creative work environment, which respects diversity, new ideas, and hard work.
1.3 Keys to Success
The keys to success in this business are:
- Marketing: either dealing with national distributors or with well-established international companies.
- Product quality.
- Product approval in Europe and USA.
- Management: products delivered on time, costs controlled, marketing budgets managed. There is a temptation to fix on growth at the expense of profits.
Company Summary
Bioring SA Company develops and manufactures cardiac biodegradable annuloplasty devices designed to restore a normal heart function. Its customers are cardiac surgery clinics who want prostheses that accomplish useful tasks with as little expenditure of time and money as possible. The company was incorporated in Switzerland in 2000, after three years of previous developments.
2.1 Company Ownership
Bioring SA is a privately-owned Swiss operation. Raymond Andrieu, Bioring’s founder, is the majority owner. Several members of the board of directors also hold minority stock positions. The initial $642,500 share capital is increased by another $100,000 in April 2000.
2.2 Start-up Summary
Our start-up expenses come to $258,500, which are mostly equipment, legal costs, patent costs and expenses associated with opening our first office and manufacturing facilities. Another $384,000 is required in start-up assets. The start-up costs are to be financed by direct owners’ investment. The assumptions are shown in the following table and chart.

2.3 Company Locations and Facilities
Headquarters are located in an office of approximately 4,000 square feet at Chemin d’Etraz 2, CH-1027 Lonay, Switzerland.
The present office space is small. As we add employees, we will have to take on additional space. We expect space to be available in our present building. The office space will have assembly space on site and be equipped to handle shipping.
Products
Bioring SA addresses the surgical repair techniques which are implemented in open heart surgery. This business is based on a patented product owned by the company, which is the Kalangos Biodegradable Ring cardiac implant.
The Bioring biodegradable valvular heart ring (Kalangos mitral or tricuspid ring) has been developed and designed to diminish or reinforce the valvular orifices of the heart. The ring allows a normal growth of the valve in newborn and babies, avoiding stenosis and multiple surgical procedures.
The ring is dimensioned to the size and natural geometry of the valve, and it is manufactured with a specially designed biodegradable polymer called polydioxanone. Once implanted, through the regular absorption of the ring inside the endomyocardiac tissue by simple hydrolysis, the body creates (by reaction) a scar along the ring, characterized by fibrotic tissue presenting an improved resistance to elongation. Once the ring has been completely biodegraded, the rigidity of the fibrotic tissue of the scar is maintaining the valvular orifice at the desired dimension.
As the residual scar is made of the proper biologic tissues of the patient, there is no predisposition to infection, and furthermore, the scar is able to grow normally during the growth process of the newborn.
The Kalangos mitral ring is available in 11 dimensions, covering all phases of development and all adult sizes. The Kalangos tricuspid ring is also available in 11 dimensions. Sizers have been designed to help the surgeon surgeon to choose the right ring dimension.
3.1 Product Description
As of June 2001, Bioring SA has 44 products to sell:
- Kalangos Mitral Biodegradable Ring: sizes 16, 18, 20, 22, 24, 26, 28, 30, 32, 34, 36.
- Kalangos Mitral Sizers: model size 16, 18, 20, 22, 24, 26, 28, 30, 32, 24, 36.
- Kalangos Tricuspid Biodegradable Ring: sizes 16, 18, 20, 22, 24, 26, 28, 30, 32, 34, 36.
- Kalangos Tricuspid Sizers: model size 16, 18, 20, 22, 24, 26, 28, 30, 32, 34, 36.
3.2 Competitive Comparison
There are already existing heart rings on the market: Duran, Carpentier, Puig-Masada, Cosgrove, but none of them produce a biodegradable ring. The major benefits of Kalangos rings when compared to existing products available on the market are:
- Avoiding multiple surgical procedures (newborn and babies).
- Lowering the risk of local infection.
And moreover, the ring is attached to a suture-needle system which makes the surgical procedure easier and faster.
3.3 Sales Literature
Bioring advertisements and sales literature are under development.
Bioring is registered on the Web page of the Chambre Vaudoise du Commerce et de l’Industrie. The company intends to have its own presenting page on the Web once the products have been CE marked.
3.4 Sourcing
Bioring SA manufactures its own products, using its in-house development process. The raw materials are provided by a major chemical supplier, which delivers to Bioring SA a customized polymer.
An injection molding press has been specially designed and installed to inject the polymer into the proprietary molds.
All operations, including the packaging of the final product, are done in a controlled environment: class 100 clean room.
The list of suppliers is considered as proprietary information, which is not disclosed here.
3.5 Technology
Bioring Kalangos biodegradable rings have been internationally protected by patent. A Swiss patent application has been filed in 1997, followed by a worldwide PCT application filed in 2000. Copies are available.
A trademark application is in progress.
3.6 Future Products
The Kalangos biodegradable rings have ben developed following a market need and demand in pediatric surgery. Moreover the present existing rings are subject to very restrictive applications in neonate surgery in USA. This is due to the used material. As a result of this situation, a collaboration between a Swiss cardiac surgeon and a Swiss biomedical engineer led to the creation of Bioring SA. Together, they conceived a new concept which opens new perspectives in the field of cardiovascular surgery. This concept was tested as a prototype, and the achieved results motivated the partners to create the company in order to patent, develop, manufacture and commercialize the new cardiac implant. The long term strategy at five years is to penetrate 35% of the newborn market (40,000) and 10% of the adult market (200,000). All together, this means around 35,000 biodegradable rings implanted per year.

The development of the biodegradable polymer may meet other very promising applications in the fields of cardiac and vascular surgery. We are presently in the process of writing the extension of the initial patent and testing the very first prototypes of new implants. No information can be given at this stage.
Market Analysis Summary
The market for annuloplasty rings is worth an estimated $250 million at end-user value in 2001, and is projected to grow at 3% per year according to professional forecasts published in specialized issues in 2000. Sources included The European Heart Institute and The National Center for Health Statistics in the USA.
Market leaders are Edwards Laboratories, Sulzer Medica, Medtronic. However, the industry is highly concentrated. The 10 major companies account for 95% of the total market.
4.1 Market Segmentation
The rings for annuloplasty belong to the heart valve repair industry.
We prefer a segmentation by addressed patients. This incorporates some of the product type differences, but in a more practical sense:
- The pediatric market, which is a potential market of 40,000 rings implanted per year.
- The adult market, which is a potential market of 200,000 rings implanted per year.

4.2 Target Market Segment Strategy
The following sections outline Bioring SA’s target market segment strategy.
4.2.1 Market Needs
We understand that our target market needs more than just standard rings covered with a polyester mesh. The need grew out of the special needs of neonate cardiac surgery. Our target customer wants to have this new possibility which they consider as a major improvement. There is a need for a high-quality prostheses which solves patient and surgeon problems. We don’t just sell a ring, we sell a new concept and a new surgical procedure.
4.2.2 Market Trends
Our market has finally grown towards more sophisticated technics of valve repair, where the surgeon will try to repair a portion a faulty valve. In the past years, he would have replaced the total valve. Fine repair of cardiac valve is the new trend.
4.2.3 Market Growth
According to The European Heart Institute, (Cardiovascular Device Update, August 98, page 2) the number of congenital heart defects treated in Europe in 1995 represented 24,400 procedures, which represent a rate of 48 surgical procedures per million. In 2002, it is projected to perform 28,000 surgical procedures (50 procedures per million). This market is growing at a annual rate of 1.9%.
According to the same source, the heart valve surgery market has accounted 66,700 procedures in 1995 (131 procedures per million). In 2002, it is projected to amount 84,000 procedures (150 per million), which represent an annual growth rate of 3%.
4.3 Industry Analysis
A recent article published in Cardiovascular Device Update, (December 2000), shows that the European and the U.S. market are practically the same size. The same issue of this paper indicated that the present potential U.S. market for cardiac abnormalities repair amounted $215 million per year, and that the congenital heart defects repair amounted for $149 million per year.
4.3.1 Industry Participants
The major players in this industry are international companies. It is a concentrated industry in which there are a few major players.
We are mentioning: Baxter Corporation (U.S.), Boston Scientific (U.S.), Cryolife (U.S.), Edwards Corporation (U.S.), Guidant (U.S.), Medtronic (U.S.), St Jude Medical (U.S.), Sulzer Medica (Switzerland).
4.3.2 Distribution Patterns
Distribution channels are of two types:
- Distribution through a national dealer.
- Distribution through a large multi-national company.
The cost of marketing a new class III device is becoming a serious barrier to enter a market. For bioring type of company, the best choice is to deal through national dealers in Europe and a major company in USA.
4.3.3 Competition and Buying Patterns
In the high-end specialty market, particularly in our niche, features are very important. Our target customer is not making selections based on price. The high-tech, innovative aspect, the easy-to-implant aspect, the reduced time of procedure, the anatomical shape, the physiological process and the clinical results are more important than pricing.
4.3.4 Main Competitors
In the field of cardiac surgery prostheses, the general trend is to develop anatomical and physiological mimetic implants. The ergonomy of the implant is also important.
In the field of pediatric surgery, as previously mentioned, there is no real competitor. Therefore the strategy of the company is to enter the market together with a well-known market leader, to avoid to be considered as a weak company by the market leaders.
In the field of adult surgery, the company will benefit of the presence on the market of the chosen distributors for pediatric surgery. In this field, our main competitors are: Edwards Laboratories, Sulzer Medica, Medtronic.
Strategy and Implementation Summary
Our strategy is based on serving niche markets well. What begins as a customized product, tailored to the needs of a local pediatric cardiac surgeon, can eventually become a niche product that will fit the needs of the pediatric cardiac surgeons worldwide. Our marketing infrastructure is built to reach our customers across broad geographic lines. Our products are designed to fit the need of the international cardiac pediatric surgeons community, as the market presence requires to fulfill with regulatory rules which are quite costly.
5.1 Marketing Strategy
Our marketing strategy is based on:
- Fulfillment with regulatory requirements: EC mark and FDA approval.
- Publication of clinical data in recognized international papers.
- Exhibition in the major congresses.
- Advertising in international papers.
We intend to participate in May 2001 in the 3rd World Congress of Pediatric Cardiology and Cardiac Surgery in Toronto, Canada, where we are showing our product for the first time to the world community.
In September, we intend to participate to the joint meeting of the European Association of Cardio Throracic Surgeons and the European Society for Thoracic Surgery where our consulting surgeon, Dr. Kalangos, is publishing clinical data.
5.1.1 Positioning Statement
For discriminating pediatric cardiac surgeons who want to benefit from the latest advances with polymer technology, Bioring offers superb anatomical design combined with state-of-the-art technology. For surgeons addressing cardiac adult surgery, unlike other non-biodegradable rings covered with polyester mesh. The Kalangos biodegradable ring, made of polydioxanone, offers an excellent resistance to infection. Polyester mesh is known to be an excellent support for bacterial growth.
5.1.2 Pricing Strategy
In the high-tech products market, pricing is based on the level of other similar products, already on the market. The European end-user market price for a standard cardiac ring is around $1,250. We intend to introduce Kalangos biodegradable ring at the same level of price. Price to distributor is $625, which provides the distributor enough margin to take care of its national market.
5.1.3 Promotion Strategy
The long-range goal is to create enough visibility to achieve the best penetration possible on the different markets.
We are intending to do it through:
- Scientific publications: a clinical study is published in September 2001 in Lisbonne.
- Advertising in specialized surgical journals: one European, one U.S.
- Cardiac surgery congresses and industry trade-shows: May 2001 in Toronto.
- Private clinical support and conferences by our consulting surgeon, who has accumulated strong experience.
5.1.4 Distribution Strategy
The distribution strategy is to:
- Either through national distribution in Europe, and other parts of the world, and a company in USA.
- Or a large multinational company covering the worldwide market, on an exclusive basis. The exclusivity would have price, estimated to $2 million USD.
5.1.5 Marketing Programs
Our most important marketing program is CE mark approval. Philippe Le Goff is in charge of it, assisted by Raymond Andrieu and A. Kalangos. This program should be completed for the 1st of June 2001. This program will allow us to sell our ring in Europe. Achievement should be measured by receiving a CE number, which has to be printed on all packaging of the products.
Another key marketing program is the European distribution network. Raymond Andrieu is in charge of it, and most of European distributors should be appointed for July 2001. Achievement should be measured by signed agreements in the different countries.
The next important milestone is the FDA approval process. Raymond Andrieu will be in charge of it, with a budget of $ 200,000 and a milestone date of the 1st of December 2002. Achievement should be measured by receiving the official FDA approval document. This process is intended to be done in close collaboration with the U.S. company in charge of distributing the product in USA.
5.2 Sales Strategy
The sales strategy has been forecasted as follows:
Sales in Europe
In each European country a distributor has been chosen. By signing a distribution agreement, he has to order a minimum quantity of products to be sold in his country. This quantity is to be reviewed each year. He will at first develop the pediatric market, then the adult market. Each distributor is supposed to have a team of salesmen or saleswomen who are in charge of visiting cardiac surgeons in the country. Each salesperson is in charge of several hospitals in one area of the country. In a country like Germany, the distributor should have five or six salesmen or women to cover the country. The distributor should have enough products on the shelves to serve the needs of the country. The salespeople would sell products to public and private hospitals and clinics where cardiac surgery, either pediatric or adult, is performed. Large countries like Germany or France should have around 400 rings permanently on the shelves of the distributor. Invoicing to hospital, delays of payment of hospitals, shipment to hospitals, rings freely deposited in hospitals are under the management of the distributor.
Sales in USA
Once the U.S. distribution channel is chosen, the sales strategy will be discussed together with the U.S. company. It does not differ fundamentally from Europe. The major difference is the the U.S. sales team may belong to the U.S. distributor, or be independent from the U.S. distributor.
Sales in Other Parts of the World
It is intended to act as in Europe: nominate a local distributor who is able to have easy access to the cardiac surgeons community of his country.
5.2.1 Sales Forecast
Our sales forecast assumes no change in costs or prices, which is a reasonable assumption for the last few years.We are expecting to increase sales from $2.5 million (4,000 rings) to $10 million (16,000 rings) the second year. The growth forecast is very high, but we are developing new products. We expect growth of the pediatric market, where the product is really needed. We are not projecting significant change in the product line, or in the proportion between different lines.

5.2.2 Sales Programs
The company will mainly sell outside Switzerland, which is representing a very small market. It intends to develop persistent efforts to generate the distribution through major names in each country.
It intends to hire a marketing and sales executive, and a clinical director by 2002. Both positions will support international sales, by training the sales team, assisting them with key customers, and participating in international meetings.
5.3 Strategic Alliances
We have been contacted by several major U.S. companies, (Medtronic, St Jude), who are interested with our product line. In case they would wish to distribute the products worldwide, we would have to negotiate a fair fee for international exclusive distribution (U.S. $2 million), as well as the different involvements of both parties concerning regulatory affairs, marketing, clinical studies.
We would need to understand the real interest of these companies: do they wish to buy Bioring on a middle-term plan? At what price? What do they intend to do with Bioring’s manufacturing facility? The board is of the opinion that a fair offer from one of these companies should be seriously studied.
5.4 Milestones
The accompanying table shows specific milestones, with responsibilities assigned, dates, and budgets. We are focusing, in this plan, on a few key milestones that should be accomplished.
Management Summary
Bioring SA is slow to hire new people, and very loyal to those who are hired.
Immediate personnel plans call for increases from five to seven people two years from now. The increase is needed to support the effort to move on a real international base.
Management style reflects the participation of the owners. The company respects its community of co-workers and treats all workers well. We attempt to develop and nurture the company as a community.
6.1 Organizational Structure
Raymond Andrieu, president, is responsible for overall business management.
Philippe Le Goff, consultant, is responsible for product development, quality insurance and CE mark approval. He closely collaborates with Raymond Andrieu.
Afksendiyos Kalengos, cardiac surgeon, is responsible for the final presentation of the product, its adequation to the clinical needs, and clinical studies. He closely collaborates with Raymond Andrieu and Philippe Le Goff.
Danielle Collomb, assistant to the president, is responsible for relations with furnisher, orders to furnisher and all administrative current workload.
Marlyse Bertholet and Marie-José Raposo are producing the products. They report directly to Raymond Andrieu.
6.2 Management Team
The company is managed by:
Raymond Andrieu: chairman of the board, CEO, and founder. He has been working for 25 years in sales and marketing with international companies after a first experience in manufacturing vaccines. He has been acting as production engineer, sales manager, clinical director, marketing executive and president of several international companies including Roger Bellon Laboratories, (Rhône Poulenc), Edwards Laboratories, American Hospital Supply Corporation, Ausonics Corporation (Nucleus Group), Dornier Medizintechnik GmbH, Cardicorp SA, Cambridge Biotech Corporation, Hancock Jaffe Laboratories, Bioracs SA. He owns an MSc in Biochemistry and is graduated biomedical engineer. He is a 52 years old Swiss citizen, married, three children.
Afksendiyos Kalengos: assistant pediatric and adult cardiac surgeon in Geneva University Hospital. He has also been nominated professor in foreign universities. He is presently following an MBA program during his free hours. He is considered as the reference surgeon in pediatric cardiac surgery in Switzerland. He developed the original idea together with the founder. He has a Ph.D., is 41 years old, a Swiss citizen, married and has two children.
Philippe Le Goff: chemical engineer, has a Ph.D. from Polytechnique School in Paris, where he ranked second and his wife as the “major” (first rank). He participated to the final development of the polymer synthesis. He is consultant to major pharmaceutical companies, where he is mainly in charge of the approval of the new synthesis pilot production for drugs by the regulatory authorities (CE and FDA). He is also in charge of developing industrial production based on pilot production and approval by authorities. He is a 38 years old French citizen, with Swiss residence approval, married with two children.
6.3 Management Team Gaps
There are two gaps in the planning process:
- The future distribution channel is still not yet established.
- We depend on our attorney to fight for unfair competition if it appears.
6.4 Personnel Plan
The personnel plan has been projected to cover the production needs over the considered period.
Two production people, working eight hours a day, five days a week, are able to manufacture up to 25,000 rings a year. If we add another team of two people, the production capacity reaches 50,000 rings a year.
The personnel table assumes 5% per annum pay raises. We already have a strong benefits policy with fully paid medical insurance for employees. We therefore expect very low turnover. A stock option plan is under study by our auditing company for Mr. Philippe Le Goff.
Salaries are generally in line with market pay for Lausanne and Geneva area, although our benefits are above standard market level, so we ultimately pay a bit more for our people than what might be considered industrial standard in the area. However, we are at the same level in our industrial area that local medical companies and biotech companies.
Financial Plan
The financial picture is quite encouraging. Sales are projected to start slowly, but this is due to the necessity of receiving CE mark. We need a second round of financing in April 2000 to start the sales on the market. The company has financed all machinery and tools and does not have any credit line. The original investors have been financing the development.
We want to finance growth mainly through cash flow. Collection days is very important. We do not want to let our average collection days get above 45 under any circumstances. We must maintain gross profit margins of 90% at the least, and hold marketing costs to no more than 5%. We are planning to receive tax exemption from the Canton of Vaud, which means that only federal tax is due to payment on net profit (around 10%) in FY2000. In the following years the total tax rate will be 25%
7.1 Important Assumptions
The financial plan depends on important assumptions, most of which are shown in the following table. The key underlying assumptions are:
- We assume a slow-growth economy, without major recession.
- We assume that there are no unforeseen changes in technology to make products immediately obsolete.
- We assume access to equity capital and financing sufficient to maintain our financial plan.
7.2 Key Financial Indicators
The following chart shows changes in key financial indicators: sales, gross margin, operating expenses, collection days, and inventory turnover.

7.3 Break-even Analysis
Our Break-even Analysis is based on running costs, the “burn-rate” costs we incur to keep the business running, not on theoretical fixed costs that would be relevant only if we were closing. Between payroll, rent, utilities, and basic marketing costs, we think the number shown in the table is a good estimate of fixed costs.
The Break-even Analysis shows that Bioring has a good balance of fixed costs and sufficient sales strength to remain healthy. The essential insight here is that our sales level seems to be running comfortably above break-even.

7.4 Projected Profit and Loss
We expect sales to hit $2,500,000 for this year. It should increase to $10 million by the second year of this plan, as net earnings increase steadily. Our high sales volume has lowered our cost of goods and increased our gross margin. This increase in gross margin is important to profitability.


7.5 Projected Cash Flow
We expect to manage cash flow over the next three years with $100,000 of new investment in April 2000. This additional financing resources are required to finance the working capital.

7.6 Projected Balance Sheet
As shown in the balance sheet in the following table, we expect a healthy growth in net worth. The monthly projections are in the appendix.
7.7 Business Ratios
Our ratios look healthy and solid. Gross margin is projected to stay above 95%, and return on assets and return on equity are very sound. Debt and liquidity ratios also look very good, with debt to net worth running at respectively 0,34, 0,05 and 0,02. The projections, if we make them, are those of a very solid company. Industry profile ratios based on the Standard Industrial Classification (SIC) code 3842, Surgical Appliances and Supplies, are shown for comparison.


