
Hang Toes Surfing
Executive Summary
Hang Toes Surfing will be a new player in the United States for the surf wear and active wear apparel industry. Hang Toes Surfing is composed of surfers and designers making quality products for surfing, skating and other active lifestyles. Hang Toes Surfing plans to gain market penetration and establish themselves as a cool-to-wear Logo and apparel company.
Hang Toes Surfing is a corporation located in Florida whose products are manufactured in South America. Florida was strategically chosen to provide Hang Toes Surfing with credible product feedback, since it is considered by many as the hispanic South American blend capital of the United States.
Products
Hang Toes Surfing currently has both surfing and active-wear clothing lines that will soon be available for distribution in the United States.
Market
Hang Toes Surfing will be able to supply the rapidly growing active-wear specialty market with quality lines of apparel provided by their South American manufacturer. The clothing lines can be broken down into five segments: surfing, recreational, fitness, speed (cycling), leisure, and extreme skaters.
Management Team
The management team of the company consists of sports-oriented people who design products to match their own active lifestyles. The President of Hang Toes Surfing is also President of the South American manufacturer. He has 25 years of surfing experience and is dedicated, personally and professionally, to the world of surfing and surf competitions. His love of the sport has been passed down to his children, who also participate in surfing competitions. The Vice President and CEO in the United States became involved while supporting their children’s participation in ice hockey and skate boarding.
Hang Toes Surfing is an exciting business that will leverage their individual sports passions for the greater good of the company as well as for all sports-active people and their lifestyles.
Sales are forecasted to be $765,000 for year one. Hang Toes Surfing will generate robust profits by year three.

Objectives
- Provide specialty surfing stores with top quality active-wear products
- Develop and manufacture new products and create brand awareness
- Develop and expand a sales force throughout the United States
- Reach sales of $700,000 by the end of our first year in business, and reach sales above $50,000 monthly
- Sponsor local community sports events
- Develop products that will attract our buyers and sell to consumers
- Develop a solid e-commerce market and to maximize our profit margin
Mission
Hang Toes Surfing is focused on fulfilling the need for after-market products. This is a market we have identified based on the large volume of specialty stores being opened throughout the United States.
Hang Toes Surfing will be able to adapt their product line for a variety of recreation activities, including sports, leisure, and casual lifestyles. Our mission is to:
- Focus our product lines to be the top sellers against competing companies such as Billabong, Quicksilver/Roxy, and Reef
- Focus on our surfing industry experience to identify products that attract consumers to specialty stores
Keys to Success
- Seek out feedback from our customers (kids, teens and young adults) to develop a successful clothing line that meets their needs and tastes
- Develop a niche market for our unique apparel (bags, beanies, hats and surf boards)
- Maximize profits by selling through the Internet
- Maintain low overhead costs by monitoring and scheduling production
- Implement a successful marketing campaign to inform the existing clientele and the public of our new image
- Build brand image and brand equity through marketing
Company Summary
Hang Toes Surfing is a start-up branch of an established clothing manufacturing firm located in South America. Hang Toes Surfing was conceived by a professional surfer and a clothing designer who will work together to create practical designs for surf wear, in-line skating, and skate boarding. Being avid health and fitness advocates, they will promote a clothing line that can be incorporated into any active lifestyle.
Hang Toes Surfing will be managed by two executives in the United States, with support from the president of the South American manufacturing . They bring to the company a wide range of experience in Marketing, International Sales, Accounting and Public Relations. They perceive an opportunity to acquire a significant amount of market share by focusing on specific needs of the active-wear clothing industry and by providing greater service and support to their distributors and sales representatives than their competitors. The company will be organized as a closely-held corporation with a majority of the shares held by the two principle executives.
The company will be seeking to raise approximately $120,000 in loans for start-up purposes. The company will have close contact with its manufacturer in South America.
Company Ownership
The company will be a closely-held corporation with two principle shareholders who will form the Board of Directors. It is anticipated that within the next five years, the company will be instituting a public offering to enlarge its ability to acquire financing. The principle owners will seek to retain the majority of the company’s stock for the foreseeable future. The company is incorporated in the state of Florida.
Presently, (removed for confidentiality) is Chief Executive Officer and owns eighty percent (80%) of the company.
Presently, (removed for confidentiality) is Vice President and owns twenty percent (20%) of the company.
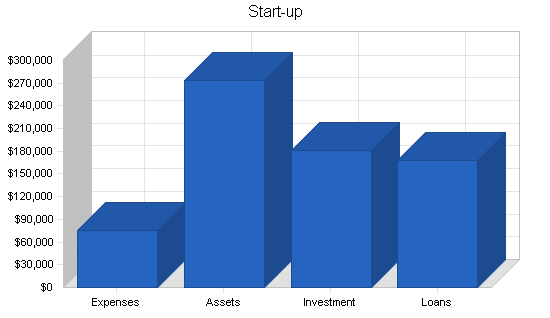
Start-up Summary
Start-up costs have been primarily for inventory, trade shows, marketing, trademark acquisition, leasing a company vehicle, operating and administrative costs, and establishing a professional e-commerce website.
Upon receiving a loan for the first month of operation, the company is planning on extensive advertising through the Internet as well as surfing, skating, and snow boarding publications, and sponsorship of community on-site events.
The start-up costs are shown in the following table and illustration.
| Start-up | |
| Requirements | |
| Start-up Expenses | |
| Legal | $4,000 |
| Office Supplies | $800 |
| Rent | $1,375 |
| Computer,Internet Services & Hosting, Internet Merchant Acct. | $5,950 |
| Marketing: Catalogues, Brochures, Posters, Magazine Ads, Expos | $27,500 |
| Travel and Communication | $9,000 |
| Customer Account Management | $5,500 |
| Accounting | $1,500 |
| Sponsorship Programs | $10,000 |
| Product Shipping and Delivery | $10,000 |
| Total Start-up Expenses | $75,625 |
| Start-up Assets | |
| Cash Required | $75,000 |
| Start-up Inventory | $48,000 |
| Other Current Assets | $50,000 |
| Long-term Assets | $100,000 |
| Total Assets | $273,000 |
| Total Requirements | $348,625 |
Products
Hang Toes Surfing offers the following product lines:
- Clothing line (street wear, dry-fit wear, surfing wear, snow wear, casual wear)
- Accessories line (surf boards, fins, bags, socks,dry-fit hats, stickers, wallets)
- Private labels for specialty stores, making their name wear an investment with direct profit for them
Other ideas for products are under development pending patent applications.
Market Analysis Summary
The increase in the number of independent specialty stores in the United States and internationally provides an opportunity to introduce a new, fresh clothing line. Within the larger surfing and active-wear market is our target market, customers of specialty stores. These discerning customers want comfortable quality clothing for both surfing as well as everyday street wear.
Specialty retail stores are the growing “gourmet” market and are represented by large American companies like Quicksilver/Roxy, Billabong, etc. Specialty stores are willing to pay a bit more for quality products, and attempt to distinguish themselves by being a family store that attracts young teens and their parents.

Board-Trac’s 2003 survey clearly shows the crossover between sports, finding 47% of skate boarders and 50% of surfers surveyed also snow board. Additionally, it found that participation in snow boarding has jumped from 7.96 million in 2001 to 9.9 million just three years later. (*sources www.asrbiz.com, Transworld Magazine)
Retail shops are trying to hold customers year-round, and many specialty shops who focus on one action sport are also looking to bring in products that will keep customer loyalty from season to season.
There is now a growing trend towards fitness skate boarding, serious street skating, wake boarding, snow boarding, cycling and surfing. With these large potential markets, our targeted clothing and apparel lines will be there to address their lifestyle needs.
Market Segmentation
The Sporting Goods Manufacturers Association survey indicates that surfing, skate boarding, and in-line skating now have more participation than football, softball, skiing, and snow boarding combined. Surf Expo, where for the past 29 years has introduced new and top manufacturers to retailers in the surf, skate, water sports, swim and resort industries, now comes together in a business-first buying and selling environment. Produced twice annually, Surf Expo draws buyers from across the U.S., the Caribbean and around the world. Whether an industry manufacturer or specialty retailer, Surf Expo has the target markets to reach.
With a world skating market of over 31 million and steadily growing (statistics released by the Sporting Goods Manufacturers Association), our aim is to penetrate into this market by promoting our clothing line in Florida’s geographical location and be viewed as an asset to the state. The mild winters and beautiful beaches attract millions of tourists and newcomers to South Florida each year. Our primary target market will be: family-oriented consumers, teenagers that want to buy clothes to match current trends, and the local specialty stores who cater to these customers.
Target Market Segment Strategy
Our target markets are teens, young adults skaters, surfers, snow boarders and the health and fitness enthusiast. This segment can be reached over the Internet and through TransWorld Business – Skate* Surf *Snow Magazine.
We plan on developing the specialty stores market through an inexpensive postcard method. Direct mailing ads/coupons with priority codes is one the most cost-effective ways to reach potential retail store customers. Also, by offering gift certificates to specialty store owners, they will contact us for more details.
Industry Analysis
Our skating and surfing sales have undergone tremendous growth and distribution throughout South America, and we want to do the same with Hang Toes Surfing in the United States. We will concentrate on Internet marketing and direct sales to specialty stores. The Internet is one of the best communication mediums for surfers, skaters, and snow borders all over the world, and we believe this is the best way to introduce our products. Sales on the Internet are now over $28 billion (as quoted by Forester Research) on e-commerce.
Our web site will attract consumers and future distributors. We want our presence over the Internet to be strong.
Competition and Buying Patterns
The purchase decision for our customers is based on trust in our services, professionalism and quality products. We have established relationships with our overseas customers which extend beyond that of the buyers/sellers. Our products have the highest quality standards in mind.
Each segment of specialty stores has its own buying patterns depending on its own needs. The pertaining table in 4.1, Market Segmentation, illustrates this.
Strategy and Implementation Summary
Hang Toes Surfing will expand production capabilities in order to fulfill the requests of overseas customers who are placing larger orders than we are currently able to fulfill. We intend to first maximize the quantity of products offered by introducing new products and apparel to existing channels. Second, we intend to establish additional accounts through targeted marketing efforts on the West and East coasts of the United States to increase sales.
Competitive Edge
Our competitive edge comes from the advantage of having established relationships with Japanese, Italian and Brazilian franchise and distributors ,brokers and wholesalers. Hang Toes has received affirmation of the demand for their product in the form of requests from importers for larger product shipments. We feel we have a superior product offering because of the larger variety of our clothing line, and because we purchase our material direct from the original suppliers (DUPONT & LYCRA) who provide other well-known products. In addition, prompt preparation and shipment provides importers with a product that is manufactured on time.
Our company’s competitive edge exists because we address the needs of our specialty retailers, and their customers’ appetites for active wear. Accessories such as fins, surf boards, and bags encourage our customers to give us a second look.
There are several other projects we are currently working on to further broaden our product lines and open up our markets even more. We will be more than glad to discuss in length some of our future confidential plans, upon request.
Marketing Strategy
Our marketing strategy will include the use of targeted online and print media advertising and direct selling to direct customers and retailers in the United States. We will capitalize on the existing international relationships of our South American manufacturer. We will position ourselves as a differentiated provider of quality active-wear products. The primary goal of all marketing efforts will be to communicate this to existing and potential customers.
The key to our marketing strategy is focusing on dry-fit clothing lines for active consumers such as cyclists, surfers, skaters and fitness enthusiasts. We believe we can cover about 80% of these sports markets since we produce products geared towards such, and another 20% for fitness and family.
Sales Strategy
Our sales strategy focuses on meeting the increased demand of specialty stores in the United States, and international companies with whom we have established relationships for larger orders. These are critical to our ability to acquire additional accounts on both the East and West coasts of the United States. We will focus on increasing the volume in the United States while working on our international marketing.
For now, our products are seen through our website, where our e-commerce lets us sell our products direct at full retail price. We will also gear sales towards the specialty shops with our Hang Toes Surfing clothing line. Through these speciality retail shops, we will further increase our sales.
Visibility will be very important, and we will gain valuable exposure by sponsoring sporting events for surfing, skate boarding and cycling in the South Florida region. We will target our advertising through the major skate, surf and sports magazines and Internet online magazines.
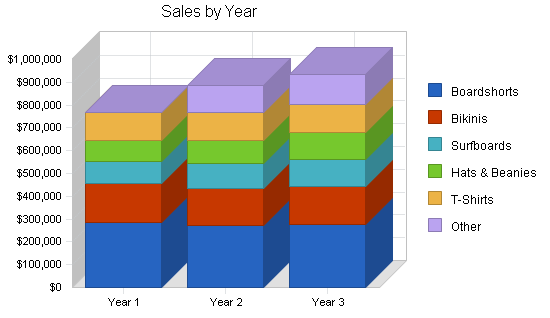
Sales Forecast
The following chart and table show our estimated sales forecast. We project sales to grow by ten to fifteen percent in 2006, and reaching maximum production capacity in 2007. The company will begin by utilizing its extensive contacts with several major distribution companies to leverage contracts through direct sales methods. A number of these companies have expressed an interest in purchasing the Hang Toes Surfing clothing lines. The company’s extensive advertising campaign will be used to create product awareness through the use of trade journals, shows, direct-mail advertising, and the Internet. At some future date, the company will seek sales representation to help increase sales, once the company has established a firm reputation. Post sales servicing and an International division will provide additional sales opportunities for marketing new product lines such as: bands and watches, and we are hoping to associate ourselves with a solid manufacturer of jewelry (NAME REMOVED TO PROTECT CONFIDENTIALITY).
We feel that our sales forecasting is realistic. We will steadily increase sales as our advertising budget allows.

| Sales Forecast | |||
| Year 1 | Year 2 | Year 3 | |
| Sales | |||
| Boardshorts | $284,520 | $270,000 | $275,000 |
| Bikinis | $172,790 | $165,000 | $168,000 |
| Surfboards | $96,460 | $110,000 | $120,000 |
| Hats & Beanies | $91,860 | $100,000 | $115,000 |
| T-Shirts | $120,000 | $122,000 | $125,000 |
| Other | $0 | $120,000 | $130,000 |
| Total Sales | $765,630 | $887,000 | $933,000 |
| Direct Cost of Sales | Year 1 | Year 2 | Year 3 |
| Freight | $60,000 | $44,000 | $45,000 |
| Processing | $180,000 | $150,000 | $165,000 |
| Subtotal Direct Cost of Sales | $240,000 | $194,000 | $210,000 |
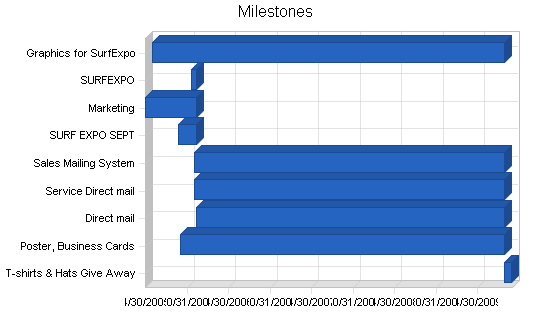
Milestones
The following milestones table outlines the key projects we need to focus on within our first year. We want to have a strong presence at both SurfExpos, to make contact with key distributors and specialty retail shops that cater to our customer base.
| Milestones | |||||
| Milestone | Start Date | End Date | Budget | Manager | Department |
| Graphics for SurfExpo | 8/26/2009 | 6/1/2005 | $3,500 | Graphic/ Expo | MKT |
| SURFEXPO | 11/20/2005 | 12/10/2005 | $10,000 | M.S | MKT |
| Marketing | 5/1/2005 | 12/10/2005 | $50,000 | P.C | MKT |
| SURF EXPO SEPT | 9/21/2005 | 12/10/2005 | $10,000 | R.G | MKT |
| Sales Mailing System | 8/26/2009 | 12/1/2005 | $600 | P.C | MKT |
| Service Direct mail | 8/26/2009 | 12/1/2005 | $500 | P.C | SURF EXPO,MKT |
| Direct mail | 8/26/2009 | 12/12/2005 | $300 | L.B | SURFEXPO, MKT |
| Poster, Business Cards | 8/26/2009 | 10/1/2005 | $200 | P.C | CEO,VP,ACCT |
| T-shirts & Hats Give Away | 8/26/2009 | 9/25/2009 | $500 | P.C | MKT |
| Totals | $75,600 | ||||
Web Plan Summary
Hang Toes Surfing sees its website as a dynamic marketing tool for sales and direct e-mail marketing. The goal will be to implement a functional and professionally-designed website that will provide information about new product lines, sponsorship, a web cam for target customers and potential business partners, and new product updates. As the company grows, its recruiting needs can be addressed by posting career opportunities and FAQs about the company. The website will also communicate company news to create and maintain positive public relations with the surfing community.
Website Marketing Strategy
We will maintain a two-way link between our website and our product suppliers. In addition to using the page as a sales tool, we will develop a monthly newsletter and coordinate with related sites to link to our site, giving us an opportunity to reach more directly to our customers.
We will also maintain two-way links between supporters of sports events and events organizations through our website. This will include a schedule of relevant sporting events that we think will appeal to our target customers.
Development Requirements
The initial creative design of the Hang Toes Surfing website will be handled by (NAME REMOVED TO PROTECT CONFIDENTIALITY), with experience in web design, and (NAME REMOVED TO PROTECT CONFIDENTIALITY), with experience in graphic design. They will work together to conceptualize the design and use of the company logo. Future redesign and ongoing support of the website will eventually be handled through an outside contractor.
Management Summary
Chief Executive Officer and Founder
NAME AND BACKGROUND REMOVED TO PROTECT CONFIDENTIALITY. Will concentrate on sales, Internet, e-commerce and promotion. She will oversee product development and production by making sure to order the products needed to maintain a smooth flow. She will also see to it that orders are filled and shipped to their destination.
Vice President
NAME AND BACKGROUND REMOVED TO PROTECT CONFIDENTIALITY. Will be in charge of the administrative functions, including public relations.
Vice President
NAME AND BACKGROUND REMOVED TO PROTECT CONFIDENTIALITY. Has a background in accounting and will incorporate his expertise in areas such as marketing relations management and negotiations for future large accounts such as Burdine’s/Macy’s, Ron Jon.
Our team will help each other with the work required for a smooth running company.
Personnel Plan
Our aim is to increase salary and compensation in line with a projected increase in sales and profits. Our overall personnel costs will be $48,000 and $42,000 for the first 12 months, which includes principles only. The present personnel cost figure is subject to change as business demands it. If our sales growth in the summer is as projected, we will need to consider adding one more employee to assist with the increased administrative demands.
| Personnel Plan | |||
| Year 1 | Year 2 | Year 3 | |
| CEO | $48,000 | $50,000 | $55,000 |
| Vice President | $42,000 | $45,000 | $48,000 |
| Total People | 0 | 0 | 0 |
| Total Payroll | $90,000 | $95,000 | $103,000 |
Financial Plan
With an increase in sales, we do expect to apply for a credit line to a limit of $150,000. The credit line will be supported by assets.
These are our strong points:
- We want to finance growth mainly through cash flow. We recognize that this means we will will have to grow at a slower pace than we would like, but this will enable us to build sales through more advertising.
- Our most important asset is inventory turnover. Our ability to schedule production from month to month will help to control inventory costs.
- We will be credited payment to our bank account within two days for all our credit card sales over the Internet. Sales on credit accounts for 25% of our overall sales.
Start-up Funding
Our initial startup expenses will amount to approximately $75,000. The anticipated funding sources are detailed in the table below.
| Start-up Funding | |
| Start-up Expenses to Fund | $75,625 |
| Start-up Assets to Fund | $273,000 |
| Total Funding Required | $348,625 |
| Assets | |
| Non-cash Assets from Start-up | $198,000 |
| Cash Requirements from Start-up | $75,000 |
| Additional Cash Raised | $0 |
| Cash Balance on Starting Date | $75,000 |
| Total Assets | $273,000 |
| Liabilities and Capital | |
| Liabilities | |
| Current Borrowing | $0 |
| Long-term Liabilities | $120,000 |
| Accounts Payable (Outstanding Bills) | $48,000 |
| Other Current Liabilities (interest-free) | $0 |
| Total Liabilities | $168,000 |
| Capital | |
| Planned Investment | |
| Owner | $180,625 |
| Investor | $0 |
| Additional Investment Requirement | $0 |
| Total Planned Investment | $180,625 |
| Loss at Start-up (Start-up Expenses) | ($75,625) |
| Total Capital | $105,000 |
| Total Capital and Liabilities | $273,000 |
| Total Funding | $348,625 |
Break-even Analysis
The following table shows our monthly break-even point. This includes costs associated with maintaining our business, such as rent and payroll, as outlined in our other tables.

| Break-even Analysis | |
| Monthly Revenue Break-even | $52,056 |
| Assumptions: | |
| Average Percent Variable Cost | 31% |
| Estimated Monthly Fixed Cost | $35,738 |
Projected Profit and Loss
As the profit and loss table shows, Hang Toes Surfing expects to continue slow but steady growth over the next three years of operations, with an estimated net profit of almost 15% for both years two and three.


| Pro Forma Profit and Loss | |||
| Year 1 | Year 2 | Year 3 | |
| Sales | $765,630 | $887,000 | $933,000 |
| Direct Cost of Sales | $240,000 | $194,000 | $210,000 |
| Other Costs of Sales | $60,000 | $65,000 | $70,000 |
| Total Cost of Sales | $300,000 | $259,000 | $280,000 |
| Gross Margin | $465,630 | $628,000 | $653,000 |
| Gross Margin % | 60.82% | 70.80% | 69.99% |
| Expenses | |||
| Payroll | $90,000 | $95,000 | $103,000 |
| Marketing/Promotion | $162,920 | $165,000 | $170,000 |
| Depreciation | $43,414 | $48,000 | $50,000 |
| Rent | $16,500 | $16,500 | $16,500 |
| Office utility, supplies | $56,023 | $50,000 | $50,000 |
| Insurance | $60,000 | $60,000 | $65,000 |
| Other | $0 | $0 | $0 |
| Total Operating Expenses | $428,857 | $434,500 | $454,500 |
| Profit Before Interest and Taxes | $36,773 | $193,500 | $198,500 |
| EBITDA | $80,187 | $241,500 | $248,500 |
| Interest Expense | $11,110 | $8,448 | $5,998 |
| Taxes Incurred | $7,699 | $55,516 | $57,751 |
| Net Profit | $17,964 | $129,536 | $134,751 |
| Net Profit/Sales | 2.35% | 14.60% | 14.44% |
Projected Cash Flow
The financial outlook is positive as the company rolls out and meets its milestones. Initially our cash flow will fluctuate, with negative cash flow in several months for our first year. However, Hang Toes Surfing expects to be cash flow positive for years two and three.
- We want to finance our first year’s growth through a loan.
- The most important indicator is inventory turnover. Our ability to schedule production from month to month will help control inventory costs.
- Collection is not a problem for our direct sales, since we will be credited payment to our bank account in two days by our credit card company for Internet sales.
- Selling our products over the Internet will allow us full retail price and maximize our profit.

| Pro Forma Cash Flow | |||
| Year 1 | Year 2 | Year 3 | |
| Cash Received | |||
| Cash from Operations | |||
| Cash Sales | $574,223 | $665,250 | $699,750 |
| Cash from Receivables | $166,175 | $217,750 | $231,734 |
| Subtotal Cash from Operations | $740,398 | $883,000 | $931,484 |
| Additional Cash Received | |||
| Sales Tax, VAT, HST/GST Received | $45,938 | $53,220 | $55,980 |
| New Current Borrowing | $16,072 | $0 | $0 |
| New Other Liabilities (interest-free) | $0 | $0 | $0 |
| New Long-term Liabilities | $0 | $0 | $0 |
| Sales of Other Current Assets | $0 | $0 | $0 |
| Sales of Long-term Assets | $0 | $0 | $0 |
| New Investment Received | $0 | $0 | $0 |
| Subtotal Cash Received | $802,407 | $936,220 | $987,464 |
| Expenditures | Year 1 | Year 2 | Year 3 |
| Expenditures from Operations | |||
| Cash Spending | $90,000 | $95,000 | $103,000 |
| Bill Payments | $631,193 | $588,145 | $658,819 |
| Subtotal Spent on Operations | $721,193 | $683,145 | $761,819 |
| Additional Cash Spent | |||
| Sales Tax, VAT, HST/GST Paid Out | $42,859 | $53,000 | $56,000 |
| Principal Repayment of Current Borrowing | $16,072 | $0 | $0 |
| Other Liabilities Principal Repayment | $0 | $0 | $0 |
| Long-term Liabilities Principal Repayment | $23,521 | $24,000 | $25,000 |
| Purchase Other Current Assets | $0 | $0 | $0 |
| Purchase Long-term Assets | $0 | $0 | $0 |
| Dividends | $0 | $0 | $0 |
| Subtotal Cash Spent | $803,645 | $760,145 | $842,819 |
| Net Cash Flow | ($1,237) | $176,075 | $144,645 |
| Cash Balance | $73,763 | $249,838 | $394,483 |
Projected Balance Sheet
Hang Toes Surfing’s projected company balance sheet follows.
| Pro Forma Balance Sheet | |||
| Year 1 | Year 2 | Year 3 | |
| Assets | |||
| Current Assets | |||
| Cash | $73,763 | $249,838 | $394,483 |
| Accounts Receivable | $25,232 | $29,232 | $30,748 |
| Inventory | $48,000 | $40,511 | $58,724 |
| Other Current Assets | $50,000 | $50,000 | $50,000 |
| Total Current Assets | $196,995 | $369,581 | $533,956 |
| Long-term Assets | |||
| Long-term Assets | $100,000 | $100,000 | $100,000 |
| Accumulated Depreciation | $43,414 | $91,414 | $141,414 |
| Total Long-term Assets | $56,586 | $8,586 | ($41,414) |
| Total Assets | $253,581 | $378,167 | $492,542 |
| Liabilities and Capital | Year 1 | Year 2 | Year 3 |
| Current Liabilities | |||
| Accounts Payable | $31,059 | $49,888 | $54,531 |
| Current Borrowing | $0 | $0 | $0 |
| Other Current Liabilities | $3,079 | $3,299 | $3,279 |
| Subtotal Current Liabilities | $34,138 | $53,188 | $57,810 |
| Long-term Liabilities | $96,479 | $72,479 | $47,479 |
| Total Liabilities | $130,617 | $125,667 | $105,290 |
| Paid-in Capital | $180,625 | $180,625 | $180,625 |
| Retained Earnings | ($75,625) | ($57,661) | $71,876 |
| Earnings | $17,964 | $129,536 | $134,751 |
| Total Capital | $122,964 | $252,501 | $387,252 |
| Total Liabilities and Capital | $253,581 | $378,167 | $492,542 |
| Net Worth | $122,964 | $252,501 | $387,252 |
Business Ratios
Standard business ratios are included in the following table. The ratios show an aggressive plan for growth in order to reach maximum production within three years. Return on investment increases each year as we bring the new facility to maximum capacity and production. Return on sales and assets remain strong and cost of goods decreases.
| Ratio Analysis | ||||
| Year 1 | Year 2 | Year 3 | Industry Profile | |
| Sales Growth | n.a. | 15.85% | 5.19% | 6.06% |
| Percent of Total Assets | ||||
| Accounts Receivable | 9.95% | 7.73% | 6.24% | 6.51% |
| Inventory | 18.93% | 10.71% | 11.92% | 56.31% |
| Other Current Assets | 19.72% | 13.22% | 10.15% | 22.81% |
| Total Current Assets | 77.69% | 97.73% | 108.41% | 85.63% |
| Long-term Assets | 22.31% | 2.27% | -8.41% | 14.37% |
| Total Assets | 100.00% | 100.00% | 100.00% | 100.00% |
| Current Liabilities | 13.46% | 14.06% | 11.74% | 30.47% |
| Long-term Liabilities | 38.05% | 19.17% | 9.64% | 12.59% |
| Total Liabilities | 51.51% | 33.23% | 21.38% | 43.06% |
| Net Worth | 48.49% | 66.77% | 78.62% | 56.94% |
| Percent of Sales | ||||
| Sales | 100.00% | 100.00% | 100.00% | 100.00% |
| Gross Margin | 60.82% | 70.80% | 69.99% | 40.20% |
| Selling, General & Administrative Expenses | 58.47% | 56.20% | 55.55% | 19.35% |
| Advertising Expenses | 0.00% | 0.00% | 0.00% | 3.27% |
| Profit Before Interest and Taxes | 4.80% | 21.82% | 21.28% | 1.20% |
| Main Ratios | ||||
| Current | 5.77 | 6.95 | 9.24 | 2.60 |
| Quick | 4.36 | 6.19 | 8.22 | 0.71 |
| Total Debt to Total Assets | 51.51% | 33.23% | 21.38% | 59.60% |
| Pre-tax Return on Net Worth | 20.87% | 73.29% | 49.71% | 3.62% |
| Pre-tax Return on Assets | 10.12% | 48.93% | 39.08% | 8.97% |
| Additional Ratios | Year 1 | Year 2 | Year 3 | |
| Net Profit Margin | 2.35% | 14.60% | 14.44% | n.a |
| Return on Equity | 14.61% | 51.30% | 34.80% | n.a |
| Activity Ratios | ||||
| Accounts Receivable Turnover | 7.59 | 7.59 | 7.59 | n.a |
| Collection Days | 58 | 45 | 47 | n.a |
| Inventory Turnover | 3.87 | 4.38 | 4.23 | n.a |
| Accounts Payable Turnover | 19.78 | 12.17 | 12.17 | n.a |
| Payment Days | 29 | 24 | 29 | n.a |
| Total Asset Turnover | 3.02 | 2.35 | 1.89 | n.a |
| Debt Ratios | ||||
| Debt to Net Worth | 1.06 | 0.50 | 0.27 | n.a |
| Current Liab. to Liab. | 0.26 | 0.42 | 0.55 | n.a |
| Liquidity Ratios | ||||
| Net Working Capital | $162,857 | $316,394 | $476,145 | n.a |
| Interest Coverage | 3.31 | 22.91 | 33.09 | n.a |
| Additional Ratios | ||||
| Assets to Sales | 0.33 | 0.43 | 0.53 | n.a |
| Current Debt/Total Assets | 13% | 14% | 12% | n.a |
| Acid Test | 3.63 | 5.64 | 7.69 | n.a |
| Sales/Net Worth | 6.23 | 3.51 | 2.41 | n.a |
| Dividend Payout | 0.00 | 0.00 | 0.00 | n.a |
Appendix
| Sales Forecast | |||||||||||||
| Month 1 | Month 2 | Month 3 | Month 4 | Month 5 | Month 6 | Month 7 | Month 8 | Month 9 | Month 10 | Month 11 | Month 12 | ||
| Sales | |||||||||||||
| Boardshorts | 0% | $18,760 | $18,760 | $18,760 | $18,760 | $18,760 | $38,960 | $38,960 | $40,000 | $22,640 | $21,200 | $14,480 | $14,480 |
| Bikinis | 0% | $9,600 | $9,600 | $9,600 | $9,600 | $9,600 | $24,960 | $24,960 | $25,000 | $23,950 | $8,160 | $8,880 | $8,880 |
| Surfboards | 0% | $3,540 | $3,540 | $3,540 | $3,540 | $3,540 | $11,400 | $11,400 | $12,000 | $13,800 | $8,160 | $11,000 | $11,000 |
| Hats & Beanies | 0% | $5,580 | $5,580 | $5,580 | $5,580 | $5,580 | $11,400 | $11,400 | $12,000 | $10,680 | $4,560 | $6,960 | $6,960 |
| T-Shirts | 0% | $10,000 | $10,000 | $10,000 | $10,000 | $10,000 | $10,000 | $10,000 | $10,000 | $10,000 | $10,000 | $10,000 | $10,000 |
| Other | 0% | $0 | $0 | $0 | $0 | $0 | $0 | $0 | $0 | $0 | $0 | $0 | $0 |
| Total Sales | $47,480 | $47,480 | $47,480 | $47,480 | $47,480 | $96,720 | $96,720 | $99,000 | $81,070 | $52,080 | $51,320 | $51,320 | |
| Direct Cost of Sales | Month 1 | Month 2 | Month 3 | Month 4 | Month 5 | Month 6 | Month 7 | Month 8 | Month 9 | Month 10 | Month 11 | Month 12 | |
| Freight | $5,000 | $5,000 | $5,000 | $5,000 | $5,000 | $5,000 | $5,000 | $5,000 | $5,000 | $5,000 | $5,000 | $5,000 | |
| Processing | $15,000 | $15,000 | $15,000 | $15,000 | $15,000 | $15,000 | $15,000 | $15,000 | $15,000 | $15,000 | $15,000 | $15,000 | |
| Subtotal Direct Cost of Sales | $20,000 | $20,000 | $20,000 | $20,000 | $20,000 | $20,000 | $20,000 | $20,000 | $20,000 | $20,000 | $20,000 | $20,000 | |
| Personnel Plan | |||||||||||||
| Month 1 | Month 2 | Month 3 | Month 4 | Month 5 | Month 6 | Month 7 | Month 8 | Month 9 | Month 10 | Month 11 | Month 12 | ||
| CEO | 0% | $4,000 | $4,000 | $4,000 | $4,000 | $4,000 | $4,000 | $4,000 | $4,000 | $4,000 | $4,000 | $4,000 | $4,000 |
| Vice President | 0% | $3,500 | $3,500 | $3,500 | $3,500 | $3,500 | $3,500 | $3,500 | $3,500 | $3,500 | $3,500 | $3,500 | $3,500 |
| Total People | 0 | 0 | 0 | 0 | 0 | 0 | 0 | 0 | 0 | 0 | 0 | 0 | |
| Total Payroll | $7,500 | $7,500 | $7,500 | $7,500 | $7,500 | $7,500 | $7,500 | $7,500 | $7,500 | $7,500 | $7,500 | $7,500 | |
| Pro Forma Profit and Loss | |||||||||||||
| Month 1 | Month 2 | Month 3 | Month 4 | Month 5 | Month 6 | Month 7 | Month 8 | Month 9 | Month 10 | Month 11 | Month 12 | ||
| Sales | $47,480 | $47,480 | $47,480 | $47,480 | $47,480 | $96,720 | $96,720 | $99,000 | $81,070 | $52,080 | $51,320 | $51,320 | |
| Direct Cost of Sales | $20,000 | $20,000 | $20,000 | $20,000 | $20,000 | $20,000 | $20,000 | $20,000 | $20,000 | $20,000 | $20,000 | $20,000 | |
| Other Costs of Sales | $5,000 | $5,000 | $5,000 | $5,000 | $5,000 | $5,000 | $5,000 | $5,000 | $5,000 | $5,000 | $5,000 | $5,000 | |
| Total Cost of Sales | $25,000 | $25,000 | $25,000 | $25,000 | $25,000 | $25,000 | $25,000 | $25,000 | $25,000 | $25,000 | $25,000 | $25,000 | |
| Gross Margin | $22,480 | $22,480 | $22,480 | $22,480 | $22,480 | $71,720 | $71,720 | $74,000 | $56,070 | $27,080 | $26,320 | $26,320 | |
| Gross Margin % | 47.35% | 47.35% | 47.35% | 47.35% | 47.35% | 74.15% | 74.15% | 74.75% | 69.16% | 52.00% | 51.29% | 51.29% | |
| Expenses | |||||||||||||
| Payroll | $7,500 | $7,500 | $7,500 | $7,500 | $7,500 | $7,500 | $7,500 | $7,500 | $7,500 | $7,500 | $7,500 | $7,500 | |
| Marketing/Promotion | $10,000 | $13,440 | $9,840 | $7,920 | $13,200 | $5,000 | $15,840 | $12,000 | $15,840 | $22,880 | $18,240 | $18,720 | |
| Depreciation | $640 | $1,270 | $3,594 | $10,000 | $1,900 | $1,900 | $1,200 | $3,000 | $1,690 | $14,000 | $2,740 | $1,480 | |
| Rent | $1,375 | $1,375 | $1,375 | $1,375 | $1,375 | $1,375 | $1,375 | $1,375 | $1,375 | $1,375 | $1,375 | $1,375 | |
| Office utility, supplies | $4,675 | $3,578 | $3,446 | $3,696 | $4,238 | $4,964 | $4,634 | $5,088 | $6,020 | $4,436 | $5,822 | $5,426 | |
| Insurance | 15% | $5,000 | $5,000 | $5,000 | $5,000 | $5,000 | $5,000 | $5,000 | $5,000 | $5,000 | $5,000 | $5,000 | $5,000 |
| Other | $0 | $0 | $0 | $0 | $0 | $0 | $0 | $0 | $0 | $0 | $0 | $0 | |
| Total Operating Expenses | $29,190 | $32,163 | $30,755 | $35,491 | $33,213 | $25,739 | $35,549 | $33,963 | $37,425 | $55,191 | $40,677 | $39,501 | |
| Profit Before Interest and Taxes | ($6,710) | ($9,683) | ($8,275) | ($13,011) | ($10,733) | $45,981 | $36,171 | $40,037 | $18,645 | ($28,111) | ($14,357) | ($13,181) | |
| EBITDA | ($6,070) | ($8,413) | ($4,681) | ($3,011) | ($8,833) | $47,881 | $37,371 | $43,037 | $20,335 | ($14,111) | ($11,617) | ($11,701) | |
| Interest Expense | $998 | $1,026 | $1,010 | $1,069 | $977 | $961 | $886 | $869 | $853 | $837 | $820 | $804 | |
| Taxes Incurred | ($2,312) | ($3,213) | ($2,785) | ($4,224) | ($3,513) | $13,506 | $10,586 | $11,750 | $5,338 | ($8,684) | ($4,553) | ($4,195) | |
| Net Profit | ($5,396) | ($7,496) | ($6,499) | ($9,856) | ($8,197) | $31,514 | $24,700 | $27,417 | $12,454 | ($20,263) | ($10,624) | ($9,789) | |
| Net Profit/Sales | -11.36% | -15.79% | -13.69% | -20.76% | -17.26% | 32.58% | 25.54% | 27.69% | 15.36% | -38.91% | -20.70% | -19.08% | |
| Pro Forma Cash Flow | |||||||||||||
| Month 1 | Month 2 | Month 3 | Month 4 | Month 5 | Month 6 | Month 7 | Month 8 | Month 9 | Month 10 | Month 11 | Month 12 | ||
| Cash Received | |||||||||||||
| Cash from Operations | |||||||||||||
| Cash Sales | $35,610 | $35,610 | $35,610 | $35,610 | $35,610 | $72,540 | $72,540 | $74,250 | $60,803 | $39,060 | $38,490 | $38,490 | |
| Cash from Receivables | $0 | $396 | $11,870 | $11,870 | $11,870 | $11,870 | $12,280 | $24,180 | $24,199 | $24,601 | $20,026 | $13,014 | |
| Subtotal Cash from Operations | $35,610 | $36,006 | $47,480 | $47,480 | $47,480 | $84,410 | $84,820 | $98,430 | $85,002 | $63,661 | $58,516 | $51,504 | |
| Additional Cash Received | |||||||||||||
| Sales Tax, VAT, HST/GST Received | 6.00% | $2,849 | $2,849 | $2,849 | $2,849 | $2,849 | $5,803 | $5,803 | $5,940 | $4,864 | $3,125 | $3,079 | $3,079 |
| New Current Borrowing | $1,696 | $5,376 | $0 | $9,000 | $0 | $0 | $0 | $0 | $0 | $0 | $0 | $0 | |
| New Other Liabilities (interest-free) | $0 | $0 | $0 | $0 | $0 | $0 | $0 | $0 | $0 | $0 | $0 | $0 | |
| New Long-term Liabilities | $0 | $0 | $0 | $0 | $0 | $0 | $0 | $0 | $0 | $0 | $0 | $0 | |
| Sales of Other Current Assets | $0 | $0 | $0 | $0 | $0 | $0 | $0 | $0 | $0 | $0 | $0 | $0 | |
| Sales of Long-term Assets | $0 | $0 | $0 | $0 | $0 | $0 | $0 | $0 | $0 | $0 | $0 | $0 | |
| New Investment Received | $0 | $0 | $0 | $0 | $0 | $0 | $0 | $0 | $0 | $0 | $0 | $0 | |
| Subtotal Cash Received | $40,155 | $44,230 | $50,329 | $59,329 | $50,329 | $90,213 | $90,624 | $104,370 | $89,866 | $66,785 | $61,595 | $54,583 | |
| Expenditures | Month 1 | Month 2 | Month 3 | Month 4 | Month 5 | Month 6 | Month 7 | Month 8 | Month 9 | Month 10 | Month 11 | Month 12 | |
| Expenditures from Operations | |||||||||||||
| Cash Spending | $7,500 | $7,500 | $7,500 | $7,500 | $7,500 | $7,500 | $7,500 | $7,500 | $7,500 | $7,500 | $7,500 | $7,500 | |
| Bill Payments | $50,425 | $71,185 | $27,696 | $69,184 | $20,050 | $28,195 | $82,456 | $44,846 | $87,427 | $39,140 | $32,472 | $78,118 | |
| Subtotal Spent on Operations | $57,925 | $78,685 | $35,196 | $76,684 | $27,550 | $35,695 | $89,956 | $52,346 | $94,927 | $46,640 | $39,972 | $85,618 | |
| Additional Cash Spent | |||||||||||||
| Sales Tax, VAT, HST/GST Paid Out | $0 | $2,849 | $2,849 | $2,849 | $2,849 | $2,849 | $5,803 | $5,803 | $5,940 | $4,864 | $3,125 | $3,079 | |
| Principal Repayment of Current Borrowing | $0 | $0 | $0 | $0 | $9,000 | $0 | $7,072 | $0 | $0 | $0 | $0 | $0 | |
| Other Liabilities Principal Repayment | $0 | $0 | $0 | $0 | $0 | $0 | $0 | $0 | $0 | $0 | $0 | $0 | |
| Long-term Liabilities Principal Repayment | $1,960 | $1,960 | $1,960 | $1,960 | $1,960 | $1,960 | $1,960 | $1,960 | $1,960 | $1,960 | $1,960 | $1,960 | |
| Purchase Other Current Assets | $0 | $0 | $0 | $0 | $0 | $0 | $0 | $0 | $0 | $0 | $0 | $0 | |
| Purchase Long-term Assets | $0 | $0 | $0 | $0 | $0 | $0 | $0 | $0 | $0 | $0 | $0 | $0 | |
| Dividends | $0 | $0 | $0 | $0 | $0 | $0 | $0 | $0 | $0 | $0 | $0 | $0 | |
| Subtotal Cash Spent | $59,885 | $83,493 | $40,005 | $81,493 | $41,359 | $40,504 | $104,792 | $60,109 | $102,827 | $53,464 | $45,057 | $90,658 | |
| Net Cash Flow | ($19,730) | ($39,263) | $10,324 | ($22,164) | $8,970 | $49,710 | ($14,168) | $44,261 | ($12,962) | $13,322 | $16,538 | ($36,075) | |
| Cash Balance | $55,270 | $16,007 | $26,331 | $4,167 | $13,137 | $62,847 | $48,678 | $92,939 | $79,978 | $93,299 | $109,837 | $73,763 | |
| Pro Forma Balance Sheet | |||||||||||||
| Month 1 | Month 2 | Month 3 | Month 4 | Month 5 | Month 6 | Month 7 | Month 8 | Month 9 | Month 10 | Month 11 | Month 12 | ||
| Assets | Starting Balances | ||||||||||||
| Current Assets | |||||||||||||
| Cash | $75,000 | $55,270 | $16,007 | $26,331 | $4,167 | $13,137 | $62,847 | $48,678 | $92,939 | $79,978 | $93,299 | $109,837 | $73,763 |
| Accounts Receivable | $0 | $11,870 | $23,344 | $23,344 | $23,344 | $23,344 | $35,654 | $47,554 | $48,124 | $44,193 | $32,612 | $25,416 | $25,232 |
| Inventory | $48,000 | $76,000 | $56,000 | $84,000 | $64,000 | $44,000 | $72,000 | $52,000 | $80,000 | $60,000 | $40,000 | $68,000 | $48,000 |
| Other Current Assets | $50,000 | $50,000 | $50,000 | $50,000 | $50,000 | $50,000 | $50,000 | $50,000 | $50,000 | $50,000 | $50,000 | $50,000 | $50,000 |
| Total Current Assets | $173,000 | $193,140 | $145,352 | $183,676 | $141,512 | $130,481 | $220,501 | $198,232 | $271,063 | $234,170 | $215,911 | $253,253 | $196,995 |
| Long-term Assets | |||||||||||||
| Long-term Assets | $100,000 | $100,000 | $100,000 | $100,000 | $100,000 | $100,000 | $100,000 | $100,000 | $100,000 | $100,000 | $100,000 | $100,000 | $100,000 |
| Accumulated Depreciation | $0 | $640 | $1,910 | $5,504 | $15,504 | $17,404 | $19,304 | $20,504 | $23,504 | $25,194 | $39,194 | $41,934 | $43,414 |
| Total Long-term Assets | $100,000 | $99,360 | $98,090 | $94,496 | $84,496 | $82,596 | $80,696 | $79,496 | $76,496 | $74,806 | $60,806 | $58,066 | $56,586 |
| Total Assets | $273,000 | $292,500 | $243,442 | $278,172 | $226,008 | $213,077 | $301,197 | $277,728 | $347,559 | $308,976 | $276,717 | $311,319 | $253,581 |
| Liabilities and Capital | Month 1 | Month 2 | Month 3 | Month 4 | Month 5 | Month 6 | Month 7 | Month 8 | Month 9 | Month 10 | Month 11 | Month 12 | |
| Current Liabilities | |||||||||||||
| Accounts Payable | $48,000 | $70,311 | $25,333 | $68,523 | $19,175 | $25,401 | $81,012 | $41,876 | $86,113 | $38,111 | $29,815 | $77,047 | $31,059 |
| Current Borrowing | $0 | $1,696 | $7,072 | $7,072 | $16,072 | $7,072 | $7,072 | $0 | $0 | $0 | $0 | $0 | $0 |
| Other Current Liabilities | $0 | $2,849 | $2,849 | $2,849 | $2,849 | $2,849 | $5,803 | $5,803 | $5,940 | $4,864 | $3,125 | $3,079 | $3,079 |
| Subtotal Current Liabilities | $48,000 | $74,856 | $35,254 | $78,443 | $38,095 | $35,322 | $93,888 | $47,679 | $92,053 | $42,976 | $32,940 | $80,127 | $34,138 |
| Long-term Liabilities | $120,000 | $118,040 | $116,080 | $114,120 | $112,160 | $110,200 | $108,240 | $106,280 | $104,320 | $102,359 | $100,399 | $98,439 | $96,479 |
| Total Liabilities | $168,000 | $192,896 | $151,334 | $192,563 | $150,255 | $145,522 | $202,127 | $153,959 | $196,373 | $145,335 | $133,339 | $178,566 | $130,617 |
| Paid-in Capital | $180,625 | $180,625 | $180,625 | $180,625 | $180,625 | $180,625 | $180,625 | $180,625 | $180,625 | $180,625 | $180,625 | $180,625 | $180,625 |
| Retained Earnings | ($75,625) | ($75,625) | ($75,625) | ($75,625) | ($75,625) | ($75,625) | ($75,625) | ($75,625) | ($75,625) | ($75,625) | ($75,625) | ($75,625) | ($75,625) |
| Earnings | $0 | ($5,396) | ($12,892) | ($19,392) | ($29,247) | ($37,444) | ($5,930) | $18,769 | $46,187 | $58,641 | $38,378 | $27,754 | $17,964 |
| Total Capital | $105,000 | $99,604 | $92,108 | $85,608 | $75,753 | $67,556 | $99,070 | $123,769 | $151,187 | $163,641 | $143,378 | $132,754 | $122,964 |
| Total Liabilities and Capital | $273,000 | $292,500 | $243,442 | $278,172 | $226,008 | $213,077 | $301,197 | $277,728 | $347,559 | $308,976 | $276,717 | $311,319 | $253,581 |
| Net Worth | $105,000 | $99,604 | $92,108 | $85,608 | $75,753 | $67,556 | $99,070 | $123,769 | $151,187 | $163,641 | $143,378 | $132,754 | $122,964 |
| General Assumptions | |||||||||||||
| Month 1 | Month 2 | Month 3 | Month 4 | Month 5 | Month 6 | Month 7 | Month 8 | Month 9 | Month 10 | Month 11 | Month 12 | ||
| Plan Month | 1 | 2 | 3 | 4 | 5 | 6 | 7 | 8 | 9 | 10 | 11 | 12 | |
| Current Interest Rate | 10.00% | 10.00% | 10.00% | 10.00% | 10.00% | 10.00% | 10.00% | 10.00% | 10.00% | 10.00% | 10.00% | 10.00% | |
| Long-term Interest Rate | 10.00% | 10.00% | 10.00% | 10.00% | 10.00% | 10.00% | 10.00% | 10.00% | 10.00% | 10.00% | 10.00% | 10.00% | |
| Tax Rate | 30.00% | 30.00% | 30.00% | 30.00% | 30.00% | 30.00% | 30.00% | 30.00% | 30.00% | 30.00% | 30.00% | 30.00% | |
| Other | 0 | 0 | 0 | 0 | 0 | 0 | 0 | 0 | 0 | 0 | 0 | 0 | |


