
Fire Fountain Grille
Executive Summary
The following plan is based on years of experience, is highly focused and promises to follow a path of prosperity for its investors, owners, managers and staff. It is based on conservative sales figures, and actual sales may be higher. The projections contained herein are authentic and will be used as the budget for the business. The Fire Fountain Grille® will show a profit immediately, and will increase sales and profits each year thereafter.
The Fire Fountain Grille is a comfortable, inviting restaurant designed to make our customers feel as if they are enjoying VIP services in a world all to themselves. The decor and theme is based on an exterior fountain located at the main entrance that has a cascading water fountain combined with flame throwing torches. The show kitchen will also feature a custom made “Fire Fountain”, a unique show kitchen grill that also has a cascading water fountain combined with flame throwing torches. This spectacular marvel will be visible from the dining room side, and will be a functioning 48″ gas powered steak grill on the kitchen side. The energy and atmosphere of the restaurant is high, and draws some of its power from the dazzling “Fire Fountain”. By offering an exciting, tantalizing and rewarding experience for its customers, the Fire Fountain Grille and its service oriented approach will be immediately embraced by those that love dining out!

1.1 Objectives
- Sales for the first full calendar year will be $2.3 million, with Net Profit/Sales in excess of 19%.
- A second unit will be opened in the first quarter of year three.
- A third unit will be opened in the first quarter of year four.
1.2 Mission
- Fire Fountain Grille is a commercial enterprise, and as such, exists for the purpose of generating sales and profits for its investors, owners, managers and staff. Because Fire Fountain Grille is a service business, it also exists to serve its customers. These two reasons for its existence are inextricable. If one aspect does not exist, the other will cease to exist.
- Fire Fountain Grille will offer mouth-watering meals and beverages in a soothing environment.
- Our staff will be cheerful, courteous, and focused on pleasing our customers.
- Our customers will always be treated with importance and warmth. When it comes time for our customers to decide where to spend their entertainment dollars, we will strive to become their first destination of choice.
- Our staff will be offered a workplace where they can prosper and grow in a dignified, fun and rewarding manner.
- Our investors will see a lucrative return on their dollars, and will have opportunity for future growth and prosperity with our company.
- Our vendors will be treated with loyalty, and they will find their future with us to be fruitful.
- We will be a good neighbor to the businesses in our area, and we will be a contributing and supportive member of our community
1.3 Keys to Success
- Our policy of having a manager pass by every table in the dining room every night to greet, visit with, or at least make eye contact with (with a smile) our customers.
- Our policy of having a manager visit any and every table that has a question, or if the customer has positive or negative feedback. The manager is required to use every means possible to satisfy our customers.
- Our commitment to the success and happiness of our staff.
- Our commitment to providing excellent quality food and beverages at all times.
Company Summary
The Fire Fountain Grille is a steakhouse concept. It offers a comfortable, upscale ambience, replete with its signature fountains of flames and water. The menu features original variations of American favorites with a tantalizing array of seasoned steaks, prime rib, roasted caramel chicken, hot gourmet sandwiches and hearty salads. Beverages include an impressive wine list, microbrew beers, and festive cocktails. Fire Fountain Grille, Unit One, will be located in a newer free standing building. This location is an extremely high visibility spot on one of the most popular commercial corridors in the region. It has excellent parking, excellent ingress and egress from an eight lane thoroughfare.
2.1 Company Ownership
Fire Fountain Grille – Unit One LP, is projected as a Limited Partnership, but may switch the preferred structure to a stock “C” Corporation or Limited Liability Corporation “LLC”, for purposes of investment structuring (see section 6.1.1 “Investment Summary”). The number of investors could vary, based on various interpretations under SEC “Regulation D”.
OPERATING PARTNERS
- General Managing Partner, with 31% ownership.
- Vice Managing Partner for Dining Room and Human Resource Operations, with 9% ownership.
- Vice Managing Partner for Beverage and Entertainment, with 9% ownership.
- Vice Managing Partner for Kitchen and Catering Operations, with 9% ownership.
INVESTMENT PARTNERS
- Limited Partner Group One, with 14% ownership.
- Limited Partner Group Two, with 14% ownership.
- Limited Partner Group Three, with 14% ownership.
2.2 Start-up Summary
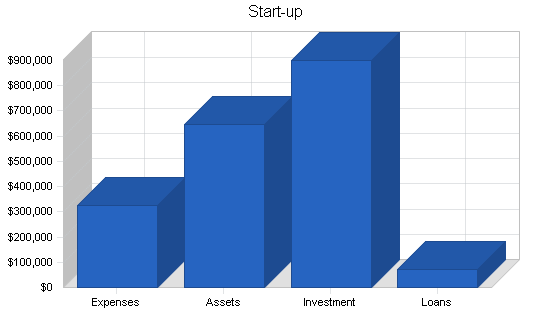
Fire Fountain Grille, Unit One, is a project that will take advantage of a newer, existing structure. Start-up costs will cover a number of details to convert the structure to suit our concept both visually, and functionally. Included in start-up costs are all necessary expenditures to cover the pre-opening hiring and training of our staff, adding and revising equipment needs, supplying smallwares and servicewares, inventory and other essentials.
| Start-up | |
| Requirements | |
| Start-up Expenses | |
| Legal | $5,000 |
| Stationery, Menus, Brochures | $4,000 |
| Food Inventory | $20,000 |
| Alcohol Inventory | $8,000 |
| Operating Supplies | $5,000 |
| Smallwares | $22,000 |
| Uniforms | $3,000 |
| Linen | $1,500 |
| Two Fire Fountains | $30,000 |
| Kitchen Improvements | $15,000 |
| Leasehold Improvements | $30,000 |
| Exterior Improvements | $10,000 |
| Catering Vehicle & Equipment | $23,000 |
| Signage | $15,000 |
| Liquor License | $4,000 |
| Point Of Sale System | $10,000 |
| Computers & Peripherals | $5,000 |
| Office Furnishings | $1,500 |
| Pre-opening Management Labor | $15,000 |
| Pre-opening Labor/Training | $16,000 |
| Pre-opening Advertising & Marketing | $8,000 |
| Permits & Fees | $3,000 |
| Insurance | $7,500 |
| Rent | $15,000 |
| Research and Development | $5,000 |
| Utility Deposits | $10,000 |
| Cash Reserve | $25,000 |
| Other | $8,000 |
| Total Start-up Expenses | $324,500 |
| Start-up Assets | |
| Cash Required | $580,500 |
| Start-up Inventory | $0 |
| Other Current Assets | $0 |
| Long-term Assets | $65,000 |
| Total Assets | $645,500 |
| Total Requirements | $970,000 |
2.3 Company Locations and Facilities
The Fire Fountain Grille is locate in a large stand-alone building with plenty of parking next to the Acres & Acres Mall, in Electrumburg, a fast growing suburb of Starburstville.
Products and Services
The Fire Fountain Grille is a comfortable, inviting restaurant designed to make our customers feel as if they are enjoying VIP services in a world all to themselves. The decor and theme is centered around the custom made “Fire Fountain”, a unique show kitchen grill that has a cascading water fountain combined with flame throwing torches on the dining room side, and is a sizzling 48″ gas powered steak grill on the kitchen side. The energy and atmosphere of the restaurant is high, and draws some of its power from the dazzling “Fire Fountain”.
The real power and energy of the restaurant comes from the attentive and courteous service provided by our floor staff, and the indescribably delicious steaks and other entrees caringly prepared by our motivated kitchen team. Each night that we are open, two managers are on duty. One manager carefully orchestrates the proper execution of the kitchen, so that all food comes out prepared perfectly, and on time. The other manager attends to the flow of the dining room, there to facilitate outstanding customer service and satisfaction. Our floor managers are extremely high profile, taking the time to greet every customer at some point in their stay. Our customer service policy is simple: All customers must leave happy about our service and food!

We are a dinner-house, but we do offer lunch on Friday, Saturday and Sunday. We have a “late-night seating” 10:00 pm-1:00 am Friday and Saturday. The lights come way down, and customers enjoy light jazz music, and a discount on certain food and beverage items. Gift Certificates always available. We have private dining facilities for group events, and we offer full catering services for events at any location! We offer “take-out” food for those on the run! Visitors to our website will find upcoming events, specials, and catering and gift certificate information.
The restaurant hours are: Monday-Thursday 3:00 pm-10:00 pm; Friday and Saturday 11:00 am-1:00 am; Sunday 11:00 am-9:00 pm.
3.1 Competitive Comparison
PF Chang’s®, Houston’s® and TGI Friday’s® are chains that offer fun atmospheres for comparison purposes. Our most competitive edge is our managers, and their ability and willingness to create goodwill among our customers, and to overcome any perceived difficulty, and indeed, turn it around into a positive experience.
The Fire Fountain Grille offers steaks and other foods that are prepared with an irresistible combination of flavors and spices. No one else in the industry serves steaks as delicious as ours.
3.2 Product and Service Description
Our menu consists of juicy, thick steaks that are coated with a secret combination of flavorings and zesty spices. These steaks are grilled to perfection. We offer mouth watering prime rib, available “Fire Fountain Style”, in four portion sizes. The menu also consists of butter-roasted and seasoned chicken dishes, fresh grilled seafoods, imaginative salads, cold melon chowders, a variety of huge burgers and grilled sandwiches, tender pork chops, soups, appetizers with berry barbecue sauces, refreshing fountain drinks, and flaming desserts.
From the bar patrons can order a wide range of American wines, as well as dozens of beers including the most popular microbrews. The bar also offers festive martinis, margaritas, specialty frozen drinks, and hundreds of cocktails.
3.2.1 Menu
Fire Fountain Grille Menu
We have a “late-night seating” 10:00 pm-1:00 am Friday and Saturday, with a discount on food items printed in red…
Fire Fountain Specialties…These meals come with your choice of baked tater or sweet tater or red beans n’ rice or veggies or fries. Also, you get fresh baked rolls, butter, and a salad! All steaks are seasoned USDA Prime Cuts! You can also order anything on this menu without seasonings!
RIBEYE – Perhaps the tastiest of all steaks! Hand cut daily, choose from big (16 ounce) $16.95 or huge (22 ounces) $22.95!!
FIRE FOUNTAIN FILET – Tender 9 ounce filet, lightly seasoned and sizzle-grilled $14.95
METROPOLITAN STRIP STEAK – 14 ounce Strip steak, with Bay Shrimp and Citrus-Bearnaise Sauce $17.95
NEW YORK STRIP – Classic Strip Cut, seasoned and grilled $13.95
TOP SIRLOIN – Prime delicate cut, seasoned and grilled to order. America’s#1 steak! $11.95
PRIME RIB – Hand carved cuts, slow roasted, and served with au jus and whipped horseradish sauce: 20 ounce – $19.95; 16 ounce – $16.95; 12 ounce – $13.95; 8 ounce – $10.95
Also, try our Fire Fountain Style of Prime Rib! Ask your server!
Seafood…
HONEY/CHILI GLAZED SALMON – Fire-Grilled Salmon, brushed with honey-chili glaze and topped with black bean salsa $13.95
GRILLED SALMON – With your choice of side dish $12.95
JAMAICAN SNAPPER – Pan charred, topped with a sweet coconut-tomato glaze $11.95
ROASTED PRAWNS – 12 Grilled Jumbo Shrimp over rice $13.95
CHICKEN ASTORIA – Breast of chicken, topped with Bay Shrimp and asparagus spears, finished with Citrus-Bearnaise sauce $11.95
FIRE-SMOKE CHICKEN – Robust, entirely dark meat, quarter of a chicken, smoke-roasted, served with Three Berry Barbecue Sauce $12.95
CARAMEL FLAMED CHICKEN – Tender Chicken breast, buttered and basted with sweet caramel glaze, then charred over an open flame $10.95
Burgers ‘n such……they come with fries..
THE BACON SPECTACULAR – Broiled 1/3 pound burger with bacon, Cheddar cheese, lettuce, dill pickle and tomato. $5.95
BURGER BURGER – Juicy ½ pounder served on a toasted onion bun with pickle, onion, lettuce and tomato $4.95… add cheese $.50
THE HIGHWAYMAN – Colossal. Char-broiled. One entire pound of juicy ground beef with Canadian bacon, Swiss cheese, lettuce, grilled onions, barbecue sauce and tomato on a giant bun $7.95
SLOPPY JOE – Sweet ‘n zesty, a mouth-watering favorite! $4.95
SHAVED PRIME RIB SANDWICH – With smoked bacon-horseradish sauce and smothered with melted Monterey Jack cheese $4.95
BARBECUE-BEEF – Huge pile of beef, slathered with barbecue sauce and melted Cheddar cheese- served open-faced $4.95
CHICKEN RANCH SANDWICH – Golden deep-fried chicken, served on a kaiser roll with Ranch sauce, lettuce and tomato $4.95
Appetizers…
GRILLED CHICKEN STRIPS – Served with Three Berry Barbecue Sauce $4.95
GRILLED STEAK SKEWERS with Ginger Red Sauce $4.95
FIRE STICKS – Fried Pepper-Jack cheese with cool Ranch Dip $3.95
CHILLED MELON CHOWDER – Bowl $2.95 Cup $1.95
BEER BATTERED SHRIMP with Pineapple Salsa $5.95
CHICKEN STRIPS with Honey-Dijon Sauce $4.95
From The Fountain…
Coffee $1.25, Decaf $1.25; Coke, Root Beer, 7-UP, Diet Coke, Iced Tea $1.50; Milk, Large$1.50 Small $1.25;
Draft Beers…Pint $2.75, Glass $1.50; Microbrews…Pint $3.00, Glass $1.95
Wines…House Glass $3.95, House Carafe $12.00. Please ask your server for a wine list.
Desserts…
Flaming Fruit Kebabs with ice cream $5.95; Cherries Jubilee $5.95; Key Lime Pie $3.95
Milk Shakes $2.95; Banana Split $5.25; Ice Cream Sundae $2.50; Carrot Cake $3.95
Completely Fat-Free Dessert: Chewy Brownies with Frozen Yogurt $2.95
JUST FOR KIDS…Yaaay!!
Kids meals come with fries..
Little Burger $3.95; Chicken Toes $3.95; Little Steak $5.95; Cheesaroni $2.95; Corny Dog $3.95; Hot Doggy $3.95…kids soda pop is free!!!
Salads…
SMOKED CHICKEN SALAD – with caramelized Hazel nuts and Ginger-Orange dressing $7.95
Grilled Sirloin Caesar $7.95; Grilled Chicken Caesar $7.95; Grilled Shrimp Caesar $7.95; Traditional Caesar $2.95; Fresh Garden Salad $2.95; – with these dressing choices: Ranch, Bleu Cheese, Catalina, Honey-Mustard, Low-Fat Italian
Chilled Melon Chowder – Bowl $2.95, Cup $1.95; Side of Fries $1.95; Sides of Red Beans ‘n’ Rice or Baked Tater, Sweet Taters, Mashed Taters, or Veggies are $1.95; Grilled Onions $1.95; Daily Soup -Bowl $2.95, Cup $1.95
Remember! We offer “to-go” food for those on the run!
Please visit our Website!
Market Analysis Summary
Electrumburg is a dynamic city located in the rapidly growing Southeast part of the Starburstville metropolitan area. The city is known for its excellent medical and educational institutions, beautiful neighborhoods, easy access to freeways and a diversified economic base. From a residential perspective, Electrumburg features master-planned communities, luxury executive homes, older residences in tree-lined neighborhoods and affordable starter housing. A robust economy, attractive residential developments, exciting commercial and business growth, dynamic neighborhoods and abundant civic pride combined with outstanding city services – Electrumburg has all of the amenities necessary for ensuring a quality lifestyle.
Electrumburg has been one of the fastest-growing cities in one of the fastest-growing metropolitan areas in the United States over the past three decades. The city’s population grew 48 percent during the 1990s. Today, Electrumburg has a population of more than 225,000. Electrumburg is adjacent to Starburstville (pop. 500,000), within the Valley with 1.6 million residents.
The median age of “Electrumburgians” is 39 years, and more than 59 percent of its residents are college-educated. Of the five largest cities in the Valley, Electrumburg has the most homes with married couples (53 percent) and the largest percentage of households with children under 18 years old living at home (32 percent). The demographics of Electrumburg’s workforce are almost identical to that of the region, providing an excellent labor pool for businesses of all sizes. The fact that Electrumburg is part of a vibrant metropolitan area makes it a very attractive place to live and establish a business.
4.1 Market Segmentation
Fire Fountain Grille, Unit One, is located in Electrumburg. According to the Electrumburg Chamber of Commerce and the US Census Bureau, the population within a five mile radius of this address is nearly 125,000, with over 59,000 households, and over 400 businesses. Income within one mile is over $81,000, $72,000 within three miles and $60,000 within five miles. Per capita retail spending in this area exceeds $13,000, with total retail spending exceeding $2.8 billion!
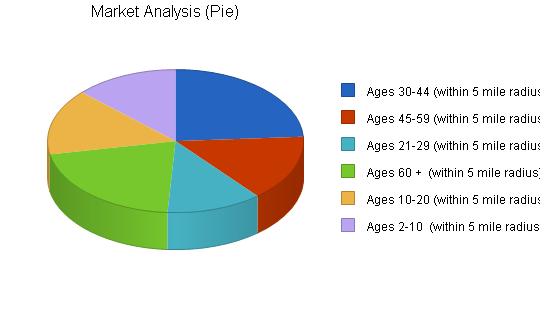
The first tier target segment for Fire Fountain Grille concentrates on the 30-44 year old age range, with income in the $40,000 – $80,000 range, located within a five mile radius. Second tier is the 45-59 year old range, with income in the $55,000 – $90,000 range, located within a five mile radius. Third tier is the 21-29 group, with income at $36,000 – $60,000, located within a five mile radius. Fourth tier is a combination of the age and income ranges mentioned in tiers 1-3, but extends the geographic radius to seven miles. Fifth tier is age ranges 60+, within five miles, and income of $65,000+. Sixth, and final tier is a composite of age ranges 60+, 10-20, and under 10, with a radius of five – seven miles, and a mixture of incomes.
| Market Analysis | |||||||
| Year 1 | Year 2 | Year 3 | Year 4 | Year 5 | |||
| Potential Customers | Growth | CAGR | |||||
| Ages 30-44 (within 5 mile radius) | 10% | 48,000 | 52,800 | 58,080 | 63,888 | 70,277 | 10.00% |
| Ages 45-59 (within 5 mile radius) | 9% | 30,000 | 32,700 | 35,643 | 38,851 | 42,348 | 9.00% |
| Ages 21-29 (within 5 mile radius) | 9% | 24,000 | 26,160 | 28,514 | 31,080 | 33,877 | 9.00% |
| Ages 60 + (within 5 mile radius) | 7% | 42,000 | 44,940 | 48,086 | 51,452 | 55,054 | 7.00% |
| Ages 10-20 (within 5 mile radius) | 5% | 30,000 | 31,500 | 33,075 | 34,729 | 36,465 | 5.00% |
| Ages 2-10 (within 5 mile radius) | 2% | 26,000 | 26,520 | 27,050 | 27,591 | 28,143 | 2.00% |
| Total | 7.41% | 200,000 | 214,620 | 230,448 | 247,591 | 266,164 | 7.41% |
4.2 Target Market Segment Strategy
Strategically, targeting the 30-44 year old age range in upper middle class areas close to our restaurant helps serve the needs and requirements of our customers, and ties in logically with our marketing plan (see Marketing Plan) and style of restaurant. Typically, the upper middle class in the 30-44 range are raising families whose children range from toddlers to teens, yet tend to continue to have “disposable” dollars available for a quality diversion (such as Fire Fountain Grille) to get them away from home and work. These customers have regimented schedules in their lives, and find value in exceptional service, timely service, and mouth watering, delightful food. If a couple chooses to leave the kids home, they’ll find value in the form of satisfaction and fun together, in their diversionary time. If they bring the kids, they will appreciate a value based kids menu. This first tier of our market segment, is also the primary focus of our marketing plan (see Marketing Plan), which has a deep commitment to focusing on kids, at their schools and in their community. These kids are primarily the children of our 30-44 tier-one group. Industry research (Nation’s Restaurant News®) has shown that the 30-44 age group appreciates steaks, chops, chicken and seafood dishes prepared with lightly seasoned recipes, which is a perfect fit for Fire Fountain Grille.
Our SECOND-TIER market group (45-59 / $55,000 – $ 80,000), will also find value in great service, and delicious food, and will appreciate a restaurant with a much better wine list than what is normally available in the upscale casual dining niche. Fire Fountain Grille will also be considered a refreshing escape from restaurants that sing and clap for birthdays.
Our THIRD-TIER group, the 21-29 year olds will find that the menu contains many favorites available to them that are considered essential: tantalizing appetizers, spicy steaks, and hundreds of cocktails and specialty beers. The Fire Fountain turns down the lights for late hour business on the weekends, and offers jazz and food and beverage specials, offering our customers a chance for some socializing and conversation.
FOURTH-TIER simply extends the market radius out to a five mile area, with the same demographics included in tiers 1-3.
FIFTH-TIER (60+ / $65,000+), represents a market that has abundant disposable income, and truly reveres attentive, efficient service. Fire Fountain Grille serves all of its meals with the option of cooking with little or no spices. This customization is much more appreciated by this group, who often prefer meals prepared to their own specifications. Because Fire Fountain Grille has only one purpose in mind when it comes to our customers – All Customers Must Leave Happy, customizing a meal to our treasured customers will always be a pleasure!
The SIXTH-TIER group will benefit from all of the quality approaches that are marketed to the previous five tiers, and will gain exposure to us primarily through our community involvement and word-of-mouth.
4.2.1 Market Trends
The trends in the Starburstville Metro market rely heavily on visual appeal, and locations. Most restaurants overlook targeting kids as a way to market to the parents. The Fire Fountain Grille does not seek to market to kids to get them to eat at our restaurant, but rather as a way to get their parents to eat there.
4.2.2 Market Growth
Steak restaurants comprise less than 5% of the total restaurant market. Service oriented steak houses have room to grow. Meat and potatoes is still what Americans want, and they want it with good service.
4.2.3 Market Needs
The market suffers from a lack of service oriented restaurants. The market needs a restaurant that values the customer as its number one priority.
4.3 Service Business Analysis
All restaurants combined, from fast food to fine dining, show an average bottom line profit of 3-10%. Margins are much better in full service restaurants with good management, good staff, good concepts, good menus and wine lists, good location and good financial controls. A full service steakhouse with all of these factors should show a bottom line profit of 13% – 25%.
4.3.1 Competition and Buying Patterns
The general nature of competition in this business, and how the customers seem to choose one provider over another can be measured by customer loyalty and positive word of mouth. Customer loyalty and brand preference come from developing a trust between the customer and the business. To be successful in the hospitality business, one must truly believe in, and always apply, the fundamental meaning of hospitality, which simply stated is, one must always be hospitable, and the customer must truly be made to feel welcome and cared for. The trust that a customer feels, is based upon the business’ ability to recognize what it takes to please a customer, and then is built upon by continuously delivering to that customer at, or above, the level of expectation that the customer expects. Fire Fountain Grille has carefully selected a management team that has been specially trained in the high art of exceptional customer service. The screening, hiring and training standards for front-of-the house staff are the highest in the industry.
The level of attention and care that our staff bestows upon our customers sets us far above our competition. Fire Fountain Grille also has extremely high standards for professionalism in the kitchen. Cleanliness, freshness of ingredients, adherence to recipe and cooking standards, and efficiency are constantly applied. Prices are reasonable, and are perceived as being an exceptional value. Fire Fountain Grille offers extremely delicious steaks, tantalizing chicken dishes, savory grilled seafoods, tender prime rib, fresh salads, sensational appetizers, tempting desserts and refreshing beverages. All of this can be found in an environment with an ambience that is unusual, and very comfortable. Our signature “Fire Fountain” fills the restaurant with an exciting glow, and the soothing sounds of falling water. The seating is almost all private booths, creating an atmosphere of relaxation and comfort.
The Fire Fountain Grille is conveniently located on a highly visible ingress near a successful mall. The restaurant has a huge, secure parking lot, excellent ingress and egress, and a beautiful and highly noticeable exterior. This area has other restaurants, which is a definite plus for us. This allows us to capitalize on a positive “clustering” effect, and works well with our marketing strategy.
4.3.2 Main Competitors
Competition comes from major chains and from various independents.
4.3.3 Business Participants
The general category is eating and drinking places. Typically, this can be broken down as follows:
- Fine dining (white tablecloths, expensive wines).
- Private Clubs and Country Clubs
- Upscale
- Upscale casual (good prices, fun)
- Boiler plate casual
- Neighborhood places
- Breakfast/lunch/dinner chains
- Fast Food
The Fire Fountain Grille will participate in the upscale casual category.
Strategy and Implementation Summary
We will differentiate ourselves with SERVICE! We will establish our business offering as a clear and viable alternative for our target market, from the scores of “rubber chicken”, frozen food, and “Happy Birthday singing” restaurant chains.
Build a relationship-oriented business
Build long-term relationships with customers, not single-visit deals. Become their restaurant and destination of choice. Make them understand the value of the relationship.
Focus on target markets
We need to focus our offerings on specific population groups as the key market segment we should own. We do not want to compete for the buyers who go to fast food or “microwave frozen foods” types of “restaurants. We definitely want to be able to sell to smart, quality conscious customers.
5.1 Competitive Edge
Clearly, our competitive edge is the customer service experience and approach that our management team will bring to the table. Our smiling, unassuming and good natured approach to all of our customers is evident, and highly appreciated. Our recipes are delicious, and the portions are large. The foods are fresh and satisfying, and the drinks are fulfilling and refreshing.
5.2 Marketing Strategy
An overview of the marketing plan includes:
• Kids Tours • Gift Certificate Program • In-store comp cards
• Direct mail • Free surprise dinners for radio station DJ’s.
• Charity events for senior citizens, high schools, grade schools, churches and community centers.
• Trade shows • Vintner and Chef Dinners
• Eye-catching exterior and interior neons, fountains and torches.
• High profile interaction between our managers, and the customers.
• Excellent service and high food quality every single day in the restaurant.
5.2.1 Positioning Statement
The Fire Fountain Grille. Sizzling, Refreshing, Exciting! For A Dinner To Remember…
5.2.2 Pricing Strategy
Prices are fit to attract the consumer who prefers a quality steak for a reasonable price. The prices are above those of operators such as Sizzler®, El Paso BBQ® and Black Angus®, are below Ruth’s Chris® and Morton’s®.
5.2.3 Promotion Strategy
The Fire Fountain Grille uses a mix of various promotions and media to spread news about ourselves. This includes:
- Direct mail, generated from in-store “Event Cards” and customer’s business cards. Event cards are forms that the customers fill out so as to receive notices of our upcoming events.
- Young people’s tours, to generate enthusiasm among the kids in our area, who in turn spread it to their folks.
- Eye-catching exterior neons and torches.
- In-store comp cards for appetizers and desserts.
- Free surprise dinners for radio station DJ’s.
- Charity events for senior citizens, high schools, grade schools, churches and community centers.
- Trade shows, to promote private dining, banquets and catering.
- “Vintner and Chef Dinners” bringing together the wine making and culinary fields at showcase events, to be held at the Fire Fountain Grille.
- High profile interaction between our managers, and the customers.
- Excellent service and high food quality every single day in the restaurant.
5.2.4 Marketing Programs
Children’s tours will be an ongoing program that has proven to work over and over again. The kids are brought to the restaurant by teachers or parents, in groups of no more than 25, and are greeted at the door by our manager. They all go inside and are seated near the Fire Fountain where they are told a cool short story. They then are taken on a tour of the store and kitchen and get to go inside of a giant refrigerator, and see some cool cooks doing their thing. Then everyone is seated for a free lunch of “Chicken Toes” or “Hot Doggies” and soda pop. Everybody talks a little about restaurants and other neat stuff. When its time to say goodbye, we take pictures and everybody gets an appetizer or dessert card, and some promotional menus. When the kids come back with their parents, we address the kids by their first names and treat them special.
5.3 Sales Strategy
We require our servers to have a thorough and comprehensive understanding of the menus, ingredients and methods of preparation of all of our foods and beverages. We train our staff to always describe and recommend items, even to regular customers, and to always upsell. The key to a server’s success in upselling is the realization that it almost always brings in better tips because the checks are higher.
GIFT CERTIFICATES
The Fire Fountain Grille will aggressively sell gift certificates. The strategy behind gift certificate sales is simple and proven. Most GC sales occur during the holidays. Most GC’s are then redeemed in the post holiday months of January and February, helping drive sales in those traditionally slower months.
5.3.1 Sales Forecast
The first month sales will open strongly, because of the advance buzz created by our pre-opening marketing, and our Grand Opening Festivities. Sales will drop off slightly as we begin to sort out our operational patterns. September is a slower month for restaurants. October and November see sales begin to build as we continue with our marketing, and relentless quality. December sees a sharp spike upward as the Holidays are in full swing. A typical week for the first six months will look like this (conservative estimate):
|
Sun. |
Mon. | Tues. | Wed. | Thurs. | Fri. | Sat. | Total Sales |
| $8,500 | $4,000 | $4,000 | $5,500 | $7,000 | $9,500 | $11,500 | $50,000 |
Years 2005 – 2008 will see an 8% annual increase. Costs will be higher during the start-up months.


| Sales Forecast | |||||
| Year 1 | Year 2 | Year 3 | Year 4 | Year 5 | |
| Sales | |||||
| Food | $1,058,353 | $1,935,200 | $2,090,016 | $2,257,217 | $2,437,794 |
| Beverage | $43,588 | $70,800 | $76,464 | $82,581 | $89,187 |
| Liquor | $59,890 | $106,200 | $114,696 | $123,871 | $133,781 |
| Beer | $83,801 | $153,400 | $165,672 | $178,925 | $193,239 |
| Wine | $52,325 | $94,400 | $101,952 | $110,108 | $118,916 |
| Total Sales | $1,297,957 | $2,360,000 | $2,548,800 | $2,752,702 | $2,972,917 |
| Direct Cost of Sales | Year 1 | Year 2 | Year 3 | Year 4 | Year 5 |
| Food | $359,706 | $657,968 | $710,605 | $767,453 | $828,850 |
| Beverage | $2,955 | $5,664 | $6,117 | $6,606 | $7,135 |
| Liquor | $7,949 | $16,057 | $16,048 | $17,342 | $18,729 |
| Beer | $15,716 | $32,214 | $34,791 | $37,574 | $40,580 |
| Wine | $10,795 | $20,768 | $22,429 | $24,223 | $26,161 |
| Subtotal Direct Cost of Sales | $397,121 | $732,671 | $789,990 | $853,198 | $921,455 |
5.4 Strategic Alliances
The Fire Fountain Grille will align with hotels, movie theatres, live theatres, cab companies, banks and retail stores in an informational brochure exchange. Each business will have a chance to promote the other businesses at their place of business. Additionally, our respective businesses will barter with each other, using gift certificates and comps.
5.5 Milestones
The milestone table is set up as a flow-chart. We opted to exclude budgeted dollars in the milestone category because we detailed these dollars in the start-up table. The milestone table is specific in detail, allowing for the smooth flow of functions that are necessary to set up the restaurant on schedule for the Grand Opening. Each function is timed to coincide with the proper execution and time needed to complete each task. Each Managing Partner has specific duties assigned specifically to his area of expertise. The end of the milestone table also shows the beginning of the 2004 marketing plan.
| Milestones | |||||
| Milestone | Start Date | End Date | Budget | Manager | Department |
| Office/Computer Supplies | 4/1/2004 | 4/5/2004 | $0 | MP 1 | Finance/Ops. |
| Install Accounting Programs | 4/1/2004 | 4/5/2004 | $0 | MP 1 | Finance/Ops. |
| Set Up Utility Accounts | 4/1/2004 | 4/5/2004 | $0 | MP 1 | Finance/Ops. |
| Finan./Legal/Ins. Accounts | 4/1/2004 | 4/5/2004 | $0 | MP 1 | Finance/Ops. |
| Expedite Liquor License | 4/1/2004 | 4/5/2004 | $0 | MP 1 | Finance/Ops. |
| Order POS System | 4/1/2004 | 4/5/2004 | $0 | MP 1 | Finance/Ops. |
| Begin Screening/Hiring | 4/1/2004 | 4/5/2004 | $0 | MP 4 | Personnel |
| Order Kitchen Equipment | 4/1/2004 | 4/5/2004 | $0 | MP 1 | Kitchen |
| Order Dining Room Equip | 4/1/2004 | 4/5/2004 | $0 | MP 1 | Finance/Ops. |
| Order Fountain & Decos | 4/1/2004 | 4/7/2004 | $0 | MP 1 | Finance/Ops. |
| Computerize Food Accts. | 4/1/2004 | 4/7/2004 | $0 | MP 3 | Kitchen |
| All Other Vendor Accounts | 4/1/2004 | 4/7/2004 | $0 | MP 3 | Kitchen |
| Produce Brochures | 4/1/2004 | 4/7/2004 | $0 | MP 4 | Marketing |
| Brochures To Printers | 4/1/2004 | 4/7/2004 | $0 | MP 4 | Marketing |
| Order Smallwares | 4/2/2004 | 4/7/2004 | $0 | MP 3 | Kithcne |
| Invites To Opening Events | 4/2/2004 | 4/7/2004 | $0 | MP 4 | Marketing |
| Dates Final Inspections | 4/2/2004 | 4/10/2004 | $0 | MP 1 | Finance/Ops. |
| First Hiring Goals Attained | 4/2/2004 | 4/10/2004 | $0 | MP 4 | Personnel |
| Signs/Exterior Neons | 4/2/2004 | 4/10/2004 | $0 | MP 1 | Finance/Ops. |
| Hire Tradesmen | 4/2/2004 | 4/10/2004 | $0 | MP 2 | Start-up |
| Purchase Catering Vehicle | 4/8/2004 | 4/10/2004 | $0 | MP 2 | Start-up |
| Alcohol Accounts | 4/8/2004 | 4/10/2004 | $0 | MP 2 | Beverages |
| Rec/Install Kitch Equipment | 4/8/2004 | 4/16/2004 | $0 | MP 3 | Kitchen |
| Install Dining Furn | 4/8/2004 | 4/16/2004 | $0 | MP 2 | Start-up |
| Install Fountain/Decos | 4/8/2004 | 4/16/2004 | $0 | MP 4 | Start-up |
| Install Signs & Neons | 4/8/2004 | 4/16/2004 | $0 | MP 2 | Start-up |
| Train POS System | 4/8/2004 | 4/16/2004 | $0 | MP 1 | Finance/Ops. |
| Final Test Of All Equipment | 4/15/2004 | 4/16/2004 | $0 | MP 1 | Finance/Ops. |
| Order Dry Goods | 4/15/2004 | 4/18/2004 | $0 | MP 3 | Kitchen |
| Building & Fire Inspect | 4/15/2004 | 4/18/2004 | $0 | MP 2 | Start-up |
| Receive Smallwares | 4/15/2004 | 4/18/2004 | $0 | MP 3 | Kitchen |
| Health Dept. Inspection | 4/15/2004 | 4/15/2004 | $0 | MP 3 | Kitchen |
| Receive Dry Goods | 4/15/2004 | 4/15/2004 | $0 | MP 3 | Kitchen |
| 2nd Hiring Goals | 4/15/2004 | 4/15/2004 | $0 | MP 4 | Personnel |
| Place 1st PFG (food) Order | 4/21/2004 | 4/21/2004 | $0 | MP 3 | Kitchen |
| Place 1st Alcohol Orders | 4/21/2004 | 4/21/2004 | $0 | MP 2 | Beverages |
| Begin Training FOH Staff | 5/1/2004 | 5/15/2004 | $0 | MP 4 | Personnel |
| Begin Training Bar Staff | 5/1/2004 | 5/15/2004 | $0 | MP 2 | Beverages |
| Begin Training Kitchen Staff | 5/1/2004 | 5/15/2004 | $0 | MP 3 | Kitchen |
| 1st Produ/Dairy/Bread | 5/1/2004 | 5/1/2004 | $0 | MP 3 | Kitchen |
| Receive 1st PFG Shipment | 5/15/2004 | 5/15/2004 | $0 | MP 3 | Kitchen |
| Produce/Dairy/Bread Delivery | 5/15/2004 | 5/15/2004 | $0 | MP 3 | Kitchen |
| Achieve Final Hiring Goals | 5/15/2004 | 5/15/2004 | $0 | MP 4 | Personnel |
| Test Night For Staff | 5/29/2004 | 5/29/2004 | $0 | MP 2 | Beverages |
| Associates Night | 5/30/2004 | 5/30/2004 | $0 | MP 4 | Marketing |
| Fundraiser For Senior Center | 5/31/2004 | 5/31/2004 | $0 | MP 1 | Finance/Ops. |
| Grand Opening | 6/1/2004 | 6/1/2004 | $0 | MP 4 | Sales |
| Staff Party | 6/10/2004 | 6/10/2004 | $0 | MP 2 | Marketing |
| Kids Tour | 6/11/2004 | 6/11/2004 | $0 | MP 4 | Marketing |
| Kids Tour | 6/25/2004 | 6/25/2004 | $0 | MP 4 | Marketing |
| Free Lunch Chamb Comm | 7/1/2004 | 7/1/2004 | $0 | MP 1 | Finance/Ops. |
| Kids Tour | 7/16/2004 | 7/16/2004 | $0 | MP 4 | Marketing |
| 1st Rotary Lunch | 7/26/2004 | 7/26/2004 | $0 | MP 1 | Finance/Ops. |
| Kids Tour | 7/29/2004 | 7/29/2004 | $0 | MP 4 | Marketing |
| Totals | $0 | ||||
Web Plan Summary
Our website, is an opportunity to offer current information on special events, menu offerings, public service announcements and comp specials.
6.1 Website Marketing Strategy
Our website will be promoted on all of our menus, and promo pieces. We will link to CitySearch.com® and many other hospitality oriented websites and portals.
6.2 Development Requirements
The Fire Fountain Grille website will be initially developed with few technical resources. VeriSign® will host the site and provide the technical back end. We will maintain a simple, classy, yet Internet focused site. The website logos, and graphics will be the same artwork found on our hard-copy menus, and in various spots in the business plan. Our managers will maintain the website. As the website rolls out future development such as restaurant delivery options, newsletters and downloadable market research reports, a technical resource may need to be contracted to build the trackable download and the newsletter capabilities. We will also look into pre-packaged solutions through VeriSign® and other Web hosting resources.
Management Summary
We will open with a team of four manager/owners, one bookkeeper, and fifty-three staff members. Each member of the management team has specific industry experience that will apply to their assignment. Each Vice Managing Partner will also cross train for one year in preparation for their promotions to their own Fire Fountain Grille units. This is an extremely experienced and well balanced team. There are no gaps in its structure.
7.1 Personnel Plan
The personnel table (labor pro-forma) shows the number, and structure of the “back-of-the-house” (BOH), “front-of-the-house” (FOH), and management staffs. June 2004 has a higher labor cost, as is usual in a restaurant start-up. Labor costs come down as the operation begins to flow more smoothly. The service staff is large, and is necessary to provide the level of service that the Fire Fountain Grille needs to set it apart from the competition.
| Personnel Plan | |||||
| Year 1 | Year 2 | Year 3 | Year 4 | Year 5 | |
| Production Personnel | |||||
| Assistant Chef | $1,750 | $3,000 | $3,036 | $3,121 | $3,184 |
| Lead Cook/Grill | $10,340 | $17,725 | $18,079 | $18,441 | $18,809 |
| Grill Two | $4,180 | $7,165 | $7,308 | $7,454 | $7,603 |
| Broiler Cook One | $10,240 | $17,554 | $17,905 | $18,263 | $18,628 |
| Broiler Cook Two | $4,180 | $7,165 | $7,308 | $7,454 | $8,050 |
| Fry Cook One | $8,600 | $14,742 | $15,037 | $15,338 | $15,644 |
| Fry Cook Two | $4,300 | $7,371 | $7,518 | $7,668 | $7,822 |
| Wheel Man One | $4,300 | $7,371 | $7,518 | $7,668 | $7,822 |
| Wheel Man Two | $2,780 | $4,765 | $4,860 | $4,957 | $5,056 |
| Salad Cook One | $8,600 | $14,742 | $15,037 | $15,338 | $15,644 |
| Salad Cook Two | $4,300 | $7,371 | $7,518 | $7,668 | $7,822 |
| Prep Cook One | $8,260 | $14,160 | $14,443 | $14,732 | $15,026 |
| Prep Cook Two | $8,260 | $14,160 | $14,443 | $14,732 | $15,026 |
| Prep Cook Three | $8,260 | $14,160 | $14,443 | $14,732 | $15,026 |
| Dish One | $7,440 | $12,754 | $13,009 | $13,269 | $13,534 |
| Dish Two | $4,350 | $7,371 | $7,518 | $7,668 | $7,882 |
| Subtotal | $100,140 | $171,576 | $174,980 | $178,503 | $182,578 |
| Sales and Marketing Personnel | |||||
| One (1) Floor Supervisor | $1,980 | $3,360 | $3,427 | $3,495 | $3,564 |
| One (1) Window Expediter | $3,380 | $5,760 | $5,875 | $5,992 | $6,111 |
| Ten (10) Full-time Servers | $27,264 | $46,000 | $46,000 | $46,000 | $46,000 |
| Ten (10) Part-time Servers | $13,632 | $23,004 | $23,004 | $23,004 | $23,004 |
| Four (4) Full-time Bartenders | $15,940 | $26,880 | $26,880 | $26,880 | $26,880 |
| Two (2) Full-time Hostesses | $5,120 | $8,640 | $8,640 | $8,640 | $8,640 |
| Three (3) Part-time Hostesses | $2,560 | $4,320 | $4,320 | $4,320 | $4,320 |
| Four (4) Bussers | $2,500 | $4,200 | $4,200 | $4,200 | $4,200 |
| Food Runner | $3,500 | $6,000 | $6,000 | $6,000 | $0 |
| Subtotal | $75,876 | $128,164 | $128,346 | $128,531 | $122,719 |
| General and Administrative Personnel | |||||
| Managing Partner 1 | $17,500 | $30,000 | $30,000 | $30,000 | $30,000 |
| Managing Partner 2 | $17,500 | $30,000 | $30,000 | $30,000 | $30,000 |
| Managing Partner 3 | $17,500 | $30,000 | $30,000 | $30,000 | $30,000 |
| Managing Partner 4 | $17,500 | $30,000 | $30,000 | $30,000 | $30,000 |
| Bookkeeper | $11,200 | $19,200 | $20,160 | $21,168 | $22,226 |
| Subtotal | $81,200 | $139,200 | $140,160 | $141,168 | $142,226 |
| Other Personnel | |||||
| Event by Event Basis TBD | $0 | $0 | $0 | $0 | $0 |
| Event by Event Basis TBD | $0 | $0 | $0 | $0 | $0 |
| Subtotal | $0 | $0 | $0 | $0 | $0 |
| Total People | 0 | 0 | 0 | 0 | 0 |
| Total Payroll | $257,216 | $438,940 | $443,486 | $448,202 | $447,523 |
Financial Plan
Our main concerns will be aggressive time management, so that our labor costs stay under control, and proper purchasing, prep and food handling to keep food costs down, as well as managing the higher costs of meats and seafoods. Secondarily, hiring the best grill and broiler cooks, training them properly and retaining them will be a critical component to good meat and seafood costs. A good grill cook does not waste steaks by burning them, nor does he anger customers by undercooking them. He must also be accurate time after time in how he carves his prime rib.
Growth will be sustained through a contribution to an expansion fund, and potential investment from current investors in a “roll-over” plan, and from potential future investors or bank capital.
8.1 Start-up Funding
We are seeking $900,000 (see section 2.2 “Start-up Summary”), and will seek it from one, two, or three investment groups, or under an SEC “Regulation D” equity offering (where the company sells partial ownership in the company – via the sale of stock or a membership unit, to raise capital). We prefer this approach as an early stage company because there is no set repayment schedule or debt service payments – the investors profit when the company profits. Initially, the company is projected as a Limited Partnership, but may switch the preferred structure to a stock “C” Corporation or Limited Liability Corporation “LLC”. The preparation of the investment documents will be handled in a cooperative effort by the legal firms representing each party individually. These documents will include, but are not limited to:
Private Placement Memorandum
The Private Placement Memorandum, or “PPM”, is the document that discloses all pertinent information to the investors about the company, proposed company operations, the transaction structure (whether we are selling equity ownership or raising debt financing from the investors), the terms of the investment (share price, note amounts, maturity dates, etc.), risks the investors may face, etc.
Form D SEC Filing
It notifies the SEC that we are using the Regulation D program and provides them basic information on the company and the offering. It is not an approval document or registration – it is merely a filing that notifies the SEC that we have a Regulation D Offering in place. Raising capital from investors without filing this document with the Federal government could place a company in violation of securities laws.
Subscription Agreement
The Subscription Agreement sets forth the terms and conditions of the investment. It is the “sales contract” for purchasing the securities.
Promissory Note
For a debt offering (if necessary), outlining the terms of any loan arrangement with the investors. The note is the actual “loan document” between the company and the investor.
| Start-up Funding | |
| Start-up Expenses to Fund | $324,500 |
| Start-up Assets to Fund | $645,500 |
| Total Funding Required | $970,000 |
| Assets | |
| Non-cash Assets from Start-up | $65,000 |
| Cash Requirements from Start-up | $580,500 |
| Additional Cash Raised | $0 |
| Cash Balance on Starting Date | $580,500 |
| Total Assets | $645,500 |
| Liabilities and Capital | |
| Liabilities | |
| Current Borrowing | $0 |
| Long-term Liabilities | $50,000 |
| Accounts Payable (Outstanding Bills) | $10,000 |
| Other Current Liabilities (interest-free) | $10,000 |
| Total Liabilities | $70,000 |
| Capital | |
| Planned Investment | |
| Investor Group One | $300,000 |
| Investor Group Two | $300,000 |
| Investor Group Three | $300,000 |
| Investor Contingency | $0 |
| Additional Investment Requirement | $0 |
| Total Planned Investment | $900,000 |
| Loss at Start-up (Start-up Expenses) | ($324,500) |
| Total Capital | $575,500 |
| Total Capital and Liabilities | $645,500 |
| Total Funding | $970,000 |
8.2 Break-even Analysis
Break-even based on fixed costs including rent, insurance, maintenance, investor note, and pre-opening amortization. Additionally, controllables such as service labor, kitchen labor, management labor, payroll taxes, property taxes, excess rent, advertising and legal/professional fees are included.

| Break-even Analysis | |
| Monthly Revenue Break-even | $64,679 |
| Assumptions: | |
| Average Percent Variable Cost | 31% |
| Estimated Monthly Fixed Cost | $44,890 |
8.3 Projected Profit and Loss
2004 is not a full year on the yearly P&L. Highlights include a bottom line of better than 18% for every year. The numbers reflect realism in the start up and continuing operations of the restaurant. We begin contributing aggressively to an expansion fund in 2005. We begin accruing for vacations immediately, and we are budgeting money from the insurance line for health benefits, all as an early commitment to the future prosperity of our staff. These numbers are an excellent indication that our investors, owners, partners and staff will all prosper and grow with the Fire Fountain Grille!


| Pro Forma Profit and Loss | |||||
| Year 1 | Year 2 | Year 3 | Year 4 | Year 5 | |
| Sales | $1,297,957 | $2,360,000 | $2,548,800 | $2,752,702 | $2,972,917 |
| Direct Cost of Sales | $397,121 | $732,671 | $789,990 | $853,198 | $921,455 |
| Production Payroll | $100,140 | $171,576 | $174,980 | $178,503 | $182,578 |
| Other Costs of Goods | $0 | $0 | $0 | $0 | $0 |
| Total Cost of Sales | $497,261 | $904,247 | $964,970 | $1,031,701 | $1,104,033 |
| Gross Margin | $800,696 | $1,455,753 | $1,583,830 | $1,721,001 | $1,868,884 |
| Gross Margin % | 61.69% | 61.68% | 62.14% | 62.52% | 62.86% |
| Operating Expenses | |||||
| Sales and Marketing Expenses | |||||
| Sales and Marketing Payroll | $75,876 | $128,164 | $128,346 | $128,531 | $122,719 |
| Operating Supplies | $12,940 | $23,600 | $27,840 | $32,860 | $38,770 |
| Janitorial | $10,500 | $18,000 | $18,000 | $18,000 | $18,000 |
| Repairs | $1,750 | $3,000 | $6,000 | $6,000 | $9,000 |
| Aprons, Towels & Napkins | $7,000 | $12,000 | $12,000 | $12,000 | $12,000 |
| Menus | $1,050 | $1,800 | $1,800 | $1,800 | $1,800 |
| Miscellaneous Supplies | $1,750 | $3,000 | $3,000 | $3,000 | $3,000 |
| Miscellaneous Purchases | $51,500 | $3,000 | $3,000 | $3,000 | $3,000 |
| Complimentary Meals or Drinks For PR | $5,250 | $9,000 | $9,000 | $9,000 | $9,000 |
| Advertising/Promotion | $3,000 | $6,000 | $6,000 | $6,000 | $6,000 |
| Credit Card Charges | $10,760 | $23,600 | $27,840 | $32,680 | $38,775 |
| Fraud Credit Cards/Checks | $1,050 | $1,800 | $1,800 | $1,800 | $1,800 |
| Professional Fees | $1,000 | $3,000 | $3,000 | $3,000 | $3,000 |
| Membership Fees | $525 | $900 | $900 | $900 | $900 |
| Uniforms | $600 | $1,800 | $1,800 | $1,800 | $1,800 |
| Travel | $0 | $3,000 | $3,000 | $6,000 | $6,000 |
| Employee Discounts | $3,500 | $6,000 | $6,000 | $6,000 | $6,000 |
| Total Sales and Marketing Expenses | $188,051 | $247,664 | $259,326 | $272,371 | $281,564 |
| Sales and Marketing % | 14.49% | 10.49% | 10.17% | 9.89% | 9.47% |
| General and Administrative Expenses | |||||
| General and Administrative Payroll | $81,200 | $139,200 | $140,160 | $141,168 | $142,226 |
| Sales and Marketing and Other Expenses | $0 | $0 | $0 | $0 | $0 |
| Depreciation | $13,500 | $24,000 | $24,000 | $24,000 | $24,000 |
| Leased Equipment | $1,050 | $1,800 | $1,800 | $1,800 | $1,800 |
| Utilities | $58,000 | $99,000 | $105,000 | $108,000 | $111,000 |
| Amortization | $35,000 | $60,000 | $60,000 | $60,000 | $60,000 |
| Debt Service | $25,000 | $75,000 | $150,000 | $175,000 | $175,000 |
| Insurance | $21,000 | $36,000 | $38,000 | $40,000 | $42,000 |
| Excess Insurance | $3,500 | $6,000 | $6,500 | $7,000 | $7,500 |
| Property Taxes | $10,500 | $18,000 | $19,000 | $20,000 | $21,000 |
| Excess Taxes | $3,500 | $6,000 | $6,200 | $6,300 | $6,400 |
| Vacation Accrual | $2,450 | $4,200 | $4,300 | $4,500 | $4,700 |
| Base Rent | $42,000 | $72,000 | $72,000 | $72,000 | $72,000 |
| Percentage Rent | $12,958 | $23,600 | $27,848 | $32,860 | $38,775 |
| CAM Rent | $5,250 | $9,000 | $9,500 | $10,000 | $10,500 |
| Payroll Taxes | $25,722 | $43,894 | $44,349 | $44,820 | $44,752 |
| Other General and Administrative Expenses | $0 | $0 | $0 | $0 | $0 |
| Total General and Administrative Expenses | $340,630 | $617,694 | $708,657 | $747,448 | $761,653 |
| General and Administrative % | 26.24% | 26.17% | 27.80% | 27.15% | 25.62% |
| Other Expenses: | |||||
| Other Payroll | $0 | $0 | $0 | $0 | $0 |
| Consultants | $0 | $0 | $0 | $0 | $0 |
| Expansion Fund | $10,000 | $50,000 | $40,000 | $75,000 | $125,000 |
| Total Other Expenses | $10,000 | $50,000 | $40,000 | $75,000 | $125,000 |
| Other % | 0.77% | 2.12% | 1.57% | 2.72% | 4.20% |
| Total Operating Expenses | $538,681 | $915,358 | $1,007,983 | $1,094,819 | $1,168,217 |
| Profit Before Interest and Taxes | $262,015 | $540,395 | $575,847 | $626,182 | $700,667 |
| EBITDA | $275,515 | $564,395 | $599,847 | $650,182 | $724,667 |
| Interest Expense | $4,928 | $3,916 | $2,860 | $1,804 | $748 |
| Taxes Incurred | $38,510 | $80,472 | $93,110 | $93,657 | $113,737 |
| Net Profit | $218,577 | $456,007 | $479,877 | $530,721 | $586,182 |
| Net Profit/Sales | 16.84% | 19.32% | 18.83% | 19.28% | 19.72% |
8.4 Projected Cash Flow
The cash flow depends on assumptions for good daily operational management, good traffic counts in the restaurant, inventory turnover, payment days, and accounts receivable management. We will need no new financing until we open our second unit.
Initial projections are a sales-to-investment ratio in excess of 2-to-1, return on investment in excess of 30 percent and return on equity of 20 percent-plus.

| Pro Forma Cash Flow | |||||
| Year 1 | Year 2 | Year 3 | Year 4 | Year 5 | |
| Cash Received | |||||
| Cash from Operations | |||||
| Cash Sales | $1,297,957 | $2,360,000 | $2,548,800 | $2,752,702 | $2,972,917 |
| Subtotal Cash from Operations | $1,297,957 | $2,360,000 | $2,548,800 | $2,752,702 | $2,972,917 |
| Additional Cash Received | |||||
| Sales Tax, VAT, HST/GST Received | $0 | $0 | $0 | $0 | $0 |
| New Current Borrowing | $0 | $0 | $0 | $0 | $0 |
| New Other Liabilities (interest-free) | $0 | $0 | $0 | $0 | $0 |
| New Long-term Liabilities | $0 | $0 | $0 | $0 | $0 |
| Sales of Other Current Assets | $0 | $0 | $0 | $0 | $0 |
| Sales of Long-term Assets | $0 | $0 | $0 | $0 | $0 |
| New Investment Received | $0 | $0 | $0 | $0 | $0 |
| Subtotal Cash Received | $1,297,957 | $2,360,000 | $2,548,800 | $2,752,702 | $2,972,917 |
| Expenditures | Year 1 | Year 2 | Year 3 | Year 4 | Year 5 |
| Expenditures from Operations | |||||
| Cash Spending | $257,216 | $438,940 | $443,486 | $448,202 | $447,523 |
| Bill Payments | $738,769 | $1,511,347 | $1,600,633 | $1,747,267 | $1,912,087 |
| Subtotal Spent on Operations | $995,985 | $1,950,287 | $2,044,119 | $2,195,469 | $2,359,610 |
| Additional Cash Spent | |||||
| Sales Tax, VAT, HST/GST Paid Out | $0 | $0 | $0 | $0 | $0 |
| Principal Repayment of Current Borrowing | $0 | $0 | $0 | $0 | $0 |
| Other Liabilities Principal Repayment | $0 | $0 | $0 | $0 | $0 |
| Long-term Liabilities Principal Repayment | $9,600 | $9,600 | $9,600 | $9,600 | $9,600 |
| Purchase Other Current Assets | $0 | $0 | $0 | $0 | $0 |
| Purchase Long-term Assets | $0 | $0 | $0 | $0 | $0 |
| Dividends | $0 | $0 | $0 | $0 | $0 |
| Subtotal Cash Spent | $1,005,585 | $1,959,887 | $2,053,719 | $2,205,069 | $2,369,210 |
| Net Cash Flow | $292,372 | $400,113 | $495,081 | $547,633 | $603,707 |
| Cash Balance | $872,872 | $1,272,985 | $1,768,066 | $2,315,698 | $2,919,405 |
8.5 Projected Balance Sheet
The balance sheet is quite solid. We do not project any real trouble meeting our debt obligations–as long as we can achieve our specific objectives.
| Pro Forma Balance Sheet | |||||
| Year 1 | Year 2 | Year 3 | Year 4 | Year 5 | |
| Assets | |||||
| Current Assets | |||||
| Cash | $872,872 | $1,272,985 | $1,768,066 | $2,315,698 | $2,919,405 |
| Inventory | $61,302 | $113,099 | $121,947 | $131,703 | $142,239 |
| Other Current Assets | $0 | $0 | $0 | $0 | $0 |
| Total Current Assets | $934,174 | $1,386,084 | $1,890,013 | $2,447,401 | $3,061,645 |
| Long-term Assets | |||||
| Long-term Assets | $65,000 | $65,000 | $65,000 | $65,000 | $65,000 |
| Accumulated Depreciation | $13,500 | $37,500 | $61,500 | $85,500 | $109,500 |
| Total Long-term Assets | $51,500 | $27,500 | $3,500 | ($20,500) | ($44,500) |
| Total Assets | $985,674 | $1,413,584 | $1,893,513 | $2,426,901 | $3,017,145 |
| Liabilities and Capital | Year 1 | Year 2 | Year 3 | Year 4 | Year 5 |
| Current Liabilities | |||||
| Accounts Payable | $141,197 | $122,700 | $132,352 | $144,619 | $158,281 |
| Current Borrowing | $0 | $0 | $0 | $0 | $0 |
| Other Current Liabilities | $10,000 | $10,000 | $10,000 | $10,000 | $10,000 |
| Subtotal Current Liabilities | $151,197 | $132,700 | $142,352 | $154,619 | $168,281 |
| Long-term Liabilities | $40,400 | $30,800 | $21,200 | $11,600 | $2,000 |
| Total Liabilities | $191,597 | $163,500 | $163,552 | $166,219 | $170,281 |
| Paid-in Capital | $900,000 | $900,000 | $900,000 | $900,000 | $900,000 |
| Retained Earnings | ($324,500) | ($105,923) | $350,084 | $829,961 | $1,360,682 |
| Earnings | $218,577 | $456,007 | $479,877 | $530,721 | $586,182 |
| Total Capital | $794,077 | $1,250,084 | $1,729,961 | $2,260,682 | $2,846,864 |
| Total Liabilities and Capital | $985,674 | $1,413,584 | $1,893,513 | $2,426,901 | $3,017,145 |
| Net Worth | $794,077 | $1,250,084 | $1,729,961 | $2,260,682 | $2,846,864 |
8.6 Business Ratios
The table follows with our main business ratios. We do intend to improve gross margin, collection days, sales and labor controls. Our ratios are compared to industry ratios for Steak Restaurants – SIC code 5812.0802.
| Ratio Analysis | ||||||
| Year 1 | Year 2 | Year 3 | Year 4 | Year 5 | Industry Profile | |
| Sales Growth | 0.00% | 81.82% | 8.00% | 8.00% | 8.00% | 6.96% |
| Percent of Total Assets | ||||||
| Inventory | 6.22% | 8.00% | 6.44% | 5.43% | 4.71% | 3.90% |
| Other Current Assets | 0.00% | 0.00% | 0.00% | 0.00% | 0.00% | 28.39% |
| Total Current Assets | 94.78% | 98.05% | 99.82% | 100.84% | 101.47% | 37.68% |
| Long-term Assets | 5.22% | 1.95% | 0.18% | -0.84% | -1.47% | 62.32% |
| Total Assets | 100.00% | 100.00% | 100.00% | 100.00% | 100.00% | 100.00% |
| Current Liabilities | 15.34% | 9.39% | 7.52% | 6.37% | 5.58% | 19.17% |
| Long-term Liabilities | 4.10% | 2.18% | 1.12% | 0.48% | 0.07% | 29.21% |
| Total Liabilities | 19.44% | 11.57% | 8.64% | 6.85% | 5.64% | 48.38% |
| Net Worth | 80.56% | 88.43% | 91.36% | 93.15% | 94.36% | 51.62% |
| Percent of Sales | ||||||
| Sales | 100.00% | 100.00% | 100.00% | 100.00% | 100.00% | 100.00% |
| Gross Margin | 61.69% | 61.68% | 62.14% | 62.52% | 62.86% | 59.31% |
| Selling, General & Administrative Expenses | 44.89% | 42.42% | 43.12% | 43.35% | 42.99% | 39.09% |
| Advertising Expenses | 1.00% | 1.00% | 1.09% | 1.19% | 1.30% | 2.75% |
| Profit Before Interest and Taxes | 20.19% | 22.90% | 22.59% | 22.75% | 23.57% | 1.59% |
| Main Ratios | ||||||
| Current | 6.18 | 10.45 | 13.28 | 15.83 | 18.19 | 1.26 |
| Quick | 5.77 | 9.59 | 12.42 | 14.98 | 17.35 | 0.87 |
| Total Debt to Total Assets | 19.44% | 11.57% | 8.64% | 6.85% | 5.64% | 3.27% |
| Pre-tax Return on Net Worth | 32.38% | 42.92% | 33.12% | 27.62% | 24.59% | 54.38% |
| Pre-tax Return on Assets | 26.08% | 37.95% | 30.26% | 25.73% | 23.20% | 7.17% |
| Additional Ratios | Year 1 | Year 2 | Year 3 | Year 4 | Year 5 | |
| Net Profit Margin | 16.84% | 19.32% | 18.83% | 19.28% | 19.72% | n.a |
| Return on Equity | 27.53% | 36.48% | 27.74% | 23.48% | 20.59% | n.a |
| Activity Ratios | ||||||
| Inventory Turnover | 10.91 | 8.40 | 6.72 | 6.73 | 6.73 | n.a |
| Accounts Payable Turnover | 6.16 | 12.17 | 12.17 | 12.17 | 12.17 | n.a |
| Payment Days | 27 | 32 | 29 | 29 | 29 | n.a |
| Total Asset Turnover | 1.32 | 1.67 | 1.35 | 1.13 | 0.99 | n.a |
| Debt Ratios | ||||||
| Debt to Net Worth | 0.24 | 0.13 | 0.09 | 0.07 | 0.06 | n.a |
| Current Liab. to Liab. | 0.79 | 0.81 | 0.87 | 0.93 | 0.99 | n.a |
| Liquidity Ratios | ||||||
| Net Working Capital | $782,977 | $1,253,384 | $1,747,661 | $2,292,782 | $2,893,364 | n.a |
| Interest Coverage | 53.17 | 138.00 | 201.35 | 347.11 | 936.72 | n.a |
| Additional Ratios | ||||||
| Assets to Sales | 0.76 | 0.60 | 0.74 | 0.88 | 1.01 | n.a |
| Current Debt/Total Assets | 15% | 9% | 8% | 6% | 6% | n.a |
| Acid Test | 5.77 | 9.59 | 12.42 | 14.98 | 17.35 | n.a |
| Sales/Net Worth | 1.63 | 1.89 | 1.47 | 1.22 | 1.04 | n.a |
| Dividend Payout | 0.00 | 0.00 | 0.00 | 0.00 | 0.00 | n.a |
8.7 Long-term Plan
Our long term plan is to continue to maintain a cash flow of 19-20% while increasing sales annually, thereby increasing actual dollars earned by our investors, principals and staff.
Appendix
| Sales Forecast | |||||||||||||
| Month 1 | Month 2 | Month 3 | Month 4 | Month 5 | Month 6 | Month 7 | Month 8 | Month 9 | Month 10 | Month 11 | Month 12 | ||
| Sales | |||||||||||||
| Food | 0% | $0 | $0 | $0 | $0 | $0 | $163,188 | $144,048 | $154,627 | $135,464 | $138,591 | $138,591 | $183,844 |
| Beverage | 0% | $0 | $0 | $0 | $0 | $0 | $7,582 | $6,903 | $7,155 | $4,956 | $5,133 | $5,133 | $6,726 |
| Liquor | 0% | $0 | $0 | $0 | $0 | $0 | $9,127 | $7,911 | $8,439 | $7,764 | $7,955 | $7,955 | $10,739 |
| Beer | 0% | $0 | $0 | $0 | $0 | $0 | $12,677 | $11,646 | $12,517 | $10,308 | $11,018 | $11,018 | $14,617 |
| Wine | 0% | $0 | $0 | $0 | $0 | $0 | $8,024 | $6,460 | $6,060 | $6,707 | $8,401 | $8,401 | $8,272 |
| Total Sales | $0 | $0 | $0 | $0 | $0 | $200,598 | $176,968 | $188,798 | $165,199 | $171,098 | $171,098 | $224,198 | |
| Direct Cost of Sales | Month 1 | Month 2 | Month 3 | Month 4 | Month 5 | Month 6 | Month 7 | Month 8 | Month 9 | Month 10 | Month 11 | Month 12 | |
| Food | $0 | $0 | $0 | $0 | $0 | $59,500 | $52,500 | $56,000 | $47,600 | $47,850 | $46,400 | $49,856 | |
| Beverage | $0 | $0 | $0 | $0 | $0 | $514 | $468 | $485 | $336 | $348 | $348 | $456 | |
| Liquor | $0 | $0 | $0 | $0 | $0 | $1,315 | $1,139 | $1,215 | $1,052 | $1,011 | $943 | $1,274 | |
| Beer | $0 | $0 | $0 | $0 | $0 | $2,471 | $2,270 | $2,439 | $1,921 | $2,054 | $1,960 | $2,601 | |
| Wine | $0 | $0 | $0 | $0 | $0 | $1,566 | $1,478 | $1,386 | $1,477 | $1,780 | $1,566 | $1,542 | |
| Subtotal Direct Cost of Sales | $0 | $0 | $0 | $0 | $0 | $65,366 | $57,855 | $61,525 | $52,386 | $53,043 | $51,217 | $55,729 | |
| Personnel Plan | |||||||||||||
| Month 1 | Month 2 | Month 3 | Month 4 | Month 5 | Month 6 | Month 7 | Month 8 | Month 9 | Month 10 | Month 11 | Month 12 | ||
| Production Personnel | |||||||||||||
| Assistant Chef | $0 | $0 | $0 | $0 | $0 | $300 | $240 | $240 | $240 | $240 | $240 | $250 | |
| Lead Cook/Grill | $0 | $0 | $0 | $0 | $0 | $1,700 | $1,440 | $1,440 | $1,440 | $1,440 | $1,440 | $1,440 | |
| Grill Two | $0 | $0 | $0 | $0 | $0 | $700 | $580 | $580 | $580 | $580 | $580 | $580 | |
| Broiler Cook One | $0 | $0 | $0 | $0 | $0 | $1,600 | $1,440 | $1,440 | $1,440 | $1,440 | $1,440 | $1,440 | |
| Broiler Cook Two | $0 | $0 | $0 | $0 | $0 | $700 | $580 | $580 | $580 | $580 | $580 | $580 | |
| Fry Cook One | $0 | $0 | $0 | $0 | $0 | $1,400 | $1,200 | $1,200 | $1,200 | $1,200 | $1,200 | $1,200 | |
| Fry Cook Two | $0 | $0 | $0 | $0 | $0 | $700 | $600 | $600 | $600 | $600 | $600 | $600 | |
| Wheel Man One | $0 | $0 | $0 | $0 | $0 | $700 | $600 | $600 | $600 | $600 | $600 | $600 | |
| Wheel Man Two | $0 | $0 | $0 | $0 | $0 | $500 | $380 | $380 | $380 | $380 | $380 | $380 | |
| Salad Cook One | $0 | $0 | $0 | $0 | $0 | $1,400 | $1,200 | $1,200 | $1,200 | $1,200 | $1,200 | $1,200 | |
| Salad Cook Two | $0 | $0 | $0 | $0 | $0 | $700 | $600 | $600 | $600 | $600 | $600 | $600 | |
| Prep Cook One | $0 | $0 | $0 | $0 | $0 | $1,300 | $1,160 | $1,160 | $1,160 | $1,160 | $1,160 | $1,160 | |
| Prep Cook Two | $0 | $0 | $0 | $0 | $0 | $1,300 | $1,160 | $1,160 | $1,160 | $1,160 | $1,160 | $1,160 | |
| Prep Cook Three | $0 | $0 | $0 | $0 | $0 | $1,300 | $1,160 | $1,160 | $1,160 | $1,160 | $1,160 | $1,160 | |
| Dish One | $0 | $0 | $0 | $0 | $0 | $1,200 | $1,040 | $1,040 | $1,040 | $1,040 | $1,040 | $1,040 | |
| Dish Two | $0 | $0 | $0 | $0 | $0 | $750 | $600 | $600 | $600 | $600 | $600 | $600 | |
| Subtotal | $0 | $0 | $0 | $0 | $0 | $16,250 | $13,980 | $13,980 | $13,980 | $13,980 | $13,980 | $13,990 | |
| Sales and Marketing Personnel | |||||||||||||
| One (1) Floor Supervisor | $0 | $0 | $0 | $0 | $0 | $300 | $280 | $280 | $280 | $280 | $280 | $280 | |
| One (1) Window Expediter | $0 | $0 | $0 | $0 | $0 | $500 | $480 | $480 | $480 | $480 | $480 | $480 | |
| Ten (10) Full-time Servers | $0 | $0 | $0 | $0 | $0 | $4,260 | $3,834 | $3,834 | $3,834 | $3,834 | $3,834 | $3,834 | |
| Ten (10) Part-time Servers | $0 | $0 | $0 | $0 | $0 | $2,130 | $1,917 | $1,917 | $1,917 | $1,917 | $1,917 | $1,917 | |
| Four (4) Full-time Bartenders | $0 | $0 | $0 | $0 | $0 | $2,500 | $2,240 | $2,240 | $2,240 | $2,240 | $2,240 | $2,240 | |
| Two (2) Full-time Hostesses | $0 | $0 | $0 | $0 | $0 | $800 | $720 | $720 | $720 | $720 | $720 | $720 | |
| Three (3) Part-time Hostesses | $0 | $0 | $0 | $0 | $0 | $400 | $360 | $360 | $360 | $360 | $360 | $360 | |
| Four (4) Bussers | $0 | $0 | $0 | $0 | $0 | $400 | $350 | $350 | $350 | $350 | $350 | $350 | |
| Food Runner | $0 | $0 | $0 | $0 | $0 | $500 | $500 | $500 | $500 | $500 | $500 | $500 | |
| Subtotal | $0 | $0 | $0 | $0 | $0 | $11,790 | $10,681 | $10,681 | $10,681 | $10,681 | $10,681 | $10,681 | |
| General and Administrative Personnel | |||||||||||||
| Managing Partner 1 | $0 | $0 | $0 | $0 | $0 | $2,500 | $2,500 | $2,500 | $2,500 | $2,500 | $2,500 | $2,500 | |
| Managing Partner 2 | $0 | $0 | $0 | $0 | $0 | $2,500 | $2,500 | $2,500 | $2,500 | $2,500 | $2,500 | $2,500 | |
| Managing Partner 3 | $0 | $0 | $0 | $0 | $0 | $2,500 | $2,500 | $2,500 | $2,500 | $2,500 | $2,500 | $2,500 | |
| Managing Partner 4 | $0 | $0 | $0 | $0 | $0 | $2,500 | $2,500 | $2,500 | $2,500 | $2,500 | $2,500 | $2,500 | |
| Bookkeeper | $0 | $0 | $0 | $0 | $0 | $1,600 | $1,600 | $1,600 | $1,600 | $1,600 | $1,600 | $1,600 | |
| Subtotal | $0 | $0 | $0 | $0 | $0 | $11,600 | $11,600 | $11,600 | $11,600 | $11,600 | $11,600 | $11,600 | |
| Other Personnel | |||||||||||||
| Event by Event Basis TBD | $0 | $0 | $0 | $0 | $0 | $0 | $0 | $0 | $0 | $0 | $0 | $0 | |
| Event by Event Basis TBD | $0 | $0 | $0 | $0 | $0 | $0 | $0 | $0 | $0 | $0 | $0 | $0 | |
| Subtotal | $0 | $0 | $0 | $0 | $0 | $0 | $0 | $0 | $0 | $0 | $0 | $0 | |
| Total People | 0 | 0 | 0 | 0 | 0 | 0 | 0 | 0 | 0 | 0 | 0 | 0 | |
| Total Payroll | $0 | $0 | $0 | $0 | $0 | $39,640 | $36,261 | $36,261 | $36,261 | $36,261 | $36,261 | $36,271 | |
| General Assumptions | |||||||||||||
| Month 1 | Month 2 | Month 3 | Month 4 | Month 5 | Month 6 | Month 7 | Month 8 | Month 9 | Month 10 | Month 11 | Month 12 | ||
| Plan Month | 1 | 2 | 3 | 4 | 5 | 6 | 7 | 8 | 9 | 10 | 11 | 12 | |
| Current Interest Rate | 9.00% | 9.00% | 9.00% | 9.00% | 9.00% | 9.00% | 9.00% | 9.00% | 9.00% | 9.00% | 9.00% | 9.00% | |
| Long-term Interest Rate | 11.00% | 11.00% | 11.00% | 11.00% | 11.00% | 11.00% | 11.00% | 11.00% | 11.00% | 11.00% | 11.00% | 11.00% | |
| Tax Rate | 30.00% | 15.00% | 15.00% | 15.00% | 15.00% | 15.00% | 15.00% | 15.00% | 15.00% | 15.00% | 15.00% | 15.00% | |
| Other | 0 | 0 | 0 | 0 | 0 | 0 | 0 | 0 | 0 | 0 | 0 | 0 | |
| Pro Forma Profit and Loss | |||||||||||||
| Month 1 | Month 2 | Month 3 | Month 4 | Month 5 | Month 6 | Month 7 | Month 8 | Month 9 | Month 10 | Month 11 | Month 12 | ||
| Sales | $0 | $0 | $0 | $0 | $0 | $200,598 | $176,968 | $188,798 | $165,199 | $171,098 | $171,098 | $224,198 | |
| Direct Cost of Sales | $0 | $0 | $0 | $0 | $0 | $65,366 | $57,855 | $61,525 | $52,386 | $53,043 | $51,217 | $55,729 | |
| Production Payroll | $0 | $0 | $0 | $0 | $0 | $16,250 | $13,980 | $13,980 | $13,980 | $13,980 | $13,980 | $13,990 | |
| Other Costs of Goods | $0 | $0 | $0 | $0 | $0 | $0 | $0 | $0 | $0 | $0 | $0 | $0 | |
| Total Cost of Sales | $0 | $0 | $0 | $0 | $0 | $81,616 | $71,835 | $75,505 | $66,366 | $67,023 | $65,197 | $69,719 | |
| Gross Margin | $0 | $0 | $0 | $0 | $0 | $118,982 | $105,133 | $113,293 | $98,833 | $104,075 | $105,901 | $154,479 | |
| Gross Margin % | 0.00% | 0.00% | 0.00% | 0.00% | 0.00% | 59.31% | 59.41% | 60.01% | 59.83% | 60.83% | 61.89% | 68.90% | |
| Operating Expenses | |||||||||||||
| Sales and Marketing Expenses | |||||||||||||
| Sales and Marketing Payroll | $0 | $0 | $0 | $0 | $0 | $11,790 | $10,681 | $10,681 | $10,681 | $10,681 | $10,681 | $10,681 | |
| Operating Supplies | $0 | $0 | $0 | $0 | $0 | $2,000 | $1,760 | $1,890 | $1,650 | $1,720 | $1,720 | $2,200 | |
| Janitorial | $0 | $0 | $0 | $0 | $0 | $1,500 | $1,500 | $1,500 | $1,500 | $1,500 | $1,500 | $1,500 | |
| Repairs | $0 | $0 | $0 | $0 | $0 | $250 | $250 | $250 | $250 | $250 | $250 | $250 | |
| Aprons, Towels & Napkins | $0 | $0 | $0 | $0 | $0 | $1,000 | $1,000 | $1,000 | $1,000 | $1,000 | $1,000 | $1,000 | |
| Menus | $0 | $0 | $0 | $0 | $0 | $150 | $150 | $150 | $150 | $150 | $150 | $150 | |
| Miscellaneous Supplies | $0 | $0 | $0 | $0 | $0 | $250 | $250 | $250 | $250 | $250 | $250 | $250 | |
| Miscellaneous Purchases | $0 | $0 | $0 | $0 | $0 | $50,000 | $250 | $250 | $250 | $250 | $250 | $250 | |
| Complimentary Meals or Drinks For PR | $0 | $0 | $0 | $0 | $0 | $750 | $750 | $750 | $750 | $750 | $750 | $750 | |
| Advertising/Promotion | $0 | $0 | $0 | $0 | $0 | $500 | $500 | $500 | $500 | $500 | $0 | $500 | |
| Credit Card Charges | $0 | $0 | $0 | $0 | $0 | $1,760 | $1,500 | $1,500 | $1,500 | $1,500 | $1,500 | $1,500 | |
| Fraud Credit Cards/Checks | $0 | $0 | $0 | $0 | $0 | $150 | $150 | $150 | $150 | $150 | $150 | $150 | |
| Professional Fees | $0 | $0 | $0 | $0 | $0 | $250 | $250 | $250 | $0 | $0 | $0 | $250 | |
| Membership Fees | $0 | $0 | $0 | $0 | $0 | $75 | $75 | $75 | $75 | $75 | $75 | $75 | |
| Uniforms | $0 | $0 | $0 | $0 | $0 | $150 | $150 | $150 | $0 | $0 | $0 | $150 | |
| Travel | $0 | $0 | $0 | $0 | $0 | $0 | $0 | $0 | $0 | $0 | $0 | $0 | |
| Employee Discounts | $0 | $0 | $0 | $0 | $0 | $500 | $500 | $500 | $500 | $500 | $500 | $500 | |
| Total Sales and Marketing Expenses | $0 | $0 | $0 | $0 | $0 | $71,075 | $19,716 | $19,846 | $19,206 | $19,276 | $18,776 | $20,156 | |
| Sales and Marketing % | 0.00% | 0.00% | 0.00% | 0.00% | 0.00% | 35.43% | 11.14% | 10.51% | 11.63% | 11.27% | 10.97% | 8.99% | |
| General and Administrative Expenses | |||||||||||||
| General and Administrative Payroll | $0 | $0 | $0 | $0 | $0 | $11,600 | $11,600 | $11,600 | $11,600 | $11,600 | $11,600 | $11,600 | |
| Sales and Marketing and Other Expenses | $0 | $0 | $0 | $0 | $0 | $0 | $0 | $0 | $0 | $0 | $0 | $0 | |
| Depreciation | ($100) | ($100) | ($100) | ($100) | ($100) | $2,000 | $2,000 | $2,000 | $2,000 | $2,000 | $2,000 | $2,000 | |
| Leased Equipment | $0 | $0 | $0 | $0 | $0 | $150 | $150 | $150 | $150 | $150 | $150 | $150 | |
| Utilities | $0 | $0 | $0 | $0 | $0 | $8,000 | $7,500 | $8,500 | $8,000 | $8,500 | $8,500 | $9,000 | |
| Amortization | $0 | $0 | $0 | $0 | $0 | $5,000 | $5,000 | $5,000 | $5,000 | $5,000 | $5,000 | $5,000 | |
| Debt Service | $0 | $0 | $0 | $0 | $0 | $0 | $0 | $0 | $0 | . | $0 | $25,000 | |
| Insurance | $0 | $0 | $0 | $0 | $0 | $3,000 | $3,000 | $3,000 | $3,000 | $3,000 | $3,000 | $3,000 | |
| Excess Insurance | $0 | $0 | $0 | $0 | $0 | $500 | $500 | $500 | $500 | $500 | $500 | $500 | |
| Property Taxes | $0 | $0 | $0 | $0 | $0 | $1,500 | $1,500 | $1,500 | $1,500 | $1,500 | $1,500 | $1,500 | |
| Excess Taxes | $0 | $0 | $0 | $0 | $0 | $500 | $500 | $500 | $500 | $500 | $500 | $500 | |
| Vacation Accrual | $0 | $0 | $0 | $0 | $0 | $350 | $350 | $350 | $350 | $350 | $350 | $350 | |
| Base Rent | $0 | $0 | $0 | $0 | $0 | $6,000 | $6,000 | $6,000 | $6,000 | $6,000 | $6,000 | $6,000 | |
| Percentage Rent | $0 | $0 | $0 | $0 | $0 | $2,000 | $1,760 | $1,887 | $1,650 | $1,710 | $1,710 | $2,241 | |
| CAM Rent | $0 | $0 | $0 | $0 | $0 | $750 | $750 | $750 | $750 | $750 | $750 | $750 | |
| Payroll Taxes | 10% | $0 | $0 | $0 | $0 | $0 | $3,964 | $3,626 | $3,626 | $3,626 | $3,626 | $3,626 | $3,627 |
| Other General and Administrative Expenses | $0 | $0 | $0 | $0 | $0 | $0 | $0 | $0 | $0 | $0 | $0 | $0 | |
| Total General and Administrative Expenses | ($100) | ($100) | ($100) | ($100) | ($100) | $45,314 | $44,236 | $45,363 | $44,626 | $45,186 | $45,186 | $71,218 | |
| General and Administrative % | 0.00% | 0.00% | 0.00% | 0.00% | 0.00% | 22.59% | 25.00% | 24.03% | 27.01% | 26.41% | 26.41% | 31.77% | |
| Other Expenses: | |||||||||||||
| Other Payroll | $0 | $0 | $0 | $0 | $0 | $0 | $0 | $0 | $0 | $0 | $0 | $0 | |
| Consultants | $0 | $0 | $0 | $0 | $0 | $0 | $0 | $0 | $0 | $0 | $0 | $0 | |
| Expansion Fund | $0 | $0 | $0 | $0 | $0 | $0 | $0 | $0 | $0 | $0 | $0 | $10,000 | |
| Total Other Expenses | $0 | $0 | $0 | $0 | $0 | $0 | $0 | $0 | $0 | $0 | $0 | $10,000 | |
| Other % | 0.00% | 0.00% | 0.00% | 0.00% | 0.00% | 0.00% | 0.00% | 0.00% | 0.00% | 0.00% | 0.00% | 4.46% | |
| Total Operating Expenses | ($100) | ($100) | ($100) | ($100) | ($100) | $116,389 | $63,952 | $65,209 | $63,832 | $64,462 | $63,962 | $101,374 | |
| Profit Before Interest and Taxes | $100 | $100 | $100 | $100 | $100 | $2,593 | $41,181 | $48,084 | $35,001 | $39,613 | $41,939 | $53,105 | |
| EBITDA | $0 | $0 | $0 | $0 | $0 | $4,593 | $43,181 | $50,084 | $37,001 | $41,613 | $43,939 | $55,105 | |
| Interest Expense | $451 | $444 | $436 | $429 | $422 | $414 | $407 | $400 | $392 | $385 | $378 | $370 | |
| Taxes Incurred | ($105) | ($52) | ($50) | ($49) | ($48) | $327 | $6,116 | $7,153 | $5,191 | $5,884 | $6,234 | $7,910 | |
| Net Profit | ($246) | ($292) | ($286) | ($280) | ($273) | $1,852 | $34,658 | $40,532 | $29,417 | $33,344 | $35,327 | $44,824 | |
| Net Profit/Sales | 0.00% | 0.00% | 0.00% | 0.00% | 0.00% | 0.92% | 19.58% | 21.47% | 17.81% | 19.49% | 20.65% | 19.99% | |
| Pro Forma Cash Flow | |||||||||||||
| Month 1 | Month 2 | Month 3 | Month 4 | Month 5 | Month 6 | Month 7 | Month 8 | Month 9 | Month 10 | Month 11 | Month 12 | ||
| Cash Received | |||||||||||||
| Cash from Operations | |||||||||||||
| Cash Sales | $0 | $0 | $0 | $0 | $0 | $200,598 | $176,968 | $188,798 | $165,199 | $171,098 | $171,098 | $224,198 | |
| Subtotal Cash from Operations | $0 | $0 | $0 | $0 | $0 | $200,598 | $176,968 | $188,798 | $165,199 | $171,098 | $171,098 | $224,198 | |
| Additional Cash Received | |||||||||||||
| Sales Tax, VAT, HST/GST Received | 0.00% | $0 | $0 | $0 | $0 | $0 | $0 | $0 | $0 | $0 | $0 | $0 | $0 |
| New Current Borrowing | $0 | $0 | $0 | $0 | $0 | $0 | $0 | $0 | $0 | $0 | $0 | $0 | |
| New Other Liabilities (interest-free) | $0 | $0 | $0 | $0 | $0 | $0 | $0 | $0 | $0 | $0 | $0 | $0 | |
| New Long-term Liabilities | $0 | $0 | $0 | $0 | $0 | $0 | $0 | $0 | $0 | $0 | $0 | $0 | |
| Sales of Other Current Assets | $0 | $0 | $0 | $0 | $0 | $0 | $0 | $0 | $0 | $0 | $0 | $0 | |
| Sales of Long-term Assets | $0 | $0 | $0 | $0 | $0 | $0 | $0 | $0 | $0 | $0 | $0 | $0 | |
| New Investment Received | $0 | $0 | $0 | $0 | $0 | $0 | $0 | $0 | $0 | $0 | $0 | $0 | |
| Subtotal Cash Received | $0 | $0 | $0 | $0 | $0 | $200,598 | $176,968 | $188,798 | $165,199 | $171,098 | $171,098 | $224,198 | |
| Expenditures | Month 1 | Month 2 | Month 3 | Month 4 | Month 5 | Month 6 | Month 7 | Month 8 | Month 9 | Month 10 | Month 11 | Month 12 | |
| Expenditures from Operations | |||||||||||||
| Cash Spending | $0 | $0 | $0 | $0 | $0 | $39,640 | $36,261 | $36,261 | $36,261 | $36,261 | $36,261 | $36,271 | |
| Bill Payments | $10,012 | $347 | $392 | $386 | $379 | $7,995 | $224,568 | $96,396 | $113,157 | $87,893 | $100,059 | $97,187 | |
| Subtotal Spent on Operations | $10,012 | $347 | $392 | $386 | $379 | $47,635 | $260,829 | $132,657 | $149,418 | $124,154 | $136,320 | $133,458 | |
| Additional Cash Spent | |||||||||||||
| Sales Tax, VAT, HST/GST Paid Out | $0 | $0 | $0 | $0 | $0 | $0 | $0 | $0 | $0 | $0 | $0 | $0 | |
| Principal Repayment of Current Borrowing | $0 | $0 | $0 | $0 | $0 | $0 | $0 | $0 | $0 | $0 | $0 | $0 | |
| Other Liabilities Principal Repayment | $0 | $0 | $0 | $0 | $0 | $0 | $0 | $0 | $0 | $0 | $0 | $0 | |
| Long-term Liabilities Principal Repayment | $800 | $800 | $800 | $800 | $800 | $800 | $800 | $800 | $800 | $800 | $800 | $800 | |
| Purchase Other Current Assets | $0 | $0 | $0 | $0 | $0 | $0 | $0 | $0 | $0 | $0 | $0 | $0 | |
| Purchase Long-term Assets | $0 | $0 | $0 | $0 | $0 | $0 | $0 | $0 | $0 | $0 | $0 | $0 | |
| Dividends | $0 | $0 | $0 | $0 | $0 | $0 | $0 | $0 | $0 | $0 | $0 | $0 | |
| Subtotal Cash Spent | $10,812 | $1,147 | $1,192 | $1,186 | $1,179 | $48,435 | $261,629 | $133,457 | $150,218 | $124,954 | $137,120 | $134,258 | |
| Net Cash Flow | ($10,812) | ($1,147) | ($1,192) | ($1,186) | ($1,179) | $152,163 | ($84,661) | $55,341 | $14,981 | $46,144 | $33,978 | $89,940 | |
| Cash Balance | $569,688 | $568,541 | $567,349 | $566,164 | $564,984 | $717,148 | $632,487 | $687,828 | $702,809 | $748,954 | $782,932 | $872,872 | |
| Pro Forma Balance Sheet | |||||||||||||
| Month 1 | Month 2 | Month 3 | Month 4 | Month 5 | Month 6 | Month 7 | Month 8 | Month 9 | Month 10 | Month 11 | Month 12 | ||
| Assets | Starting Balances | ||||||||||||
| Current Assets | |||||||||||||
| Cash | $580,500 | $569,688 | $568,541 | $567,349 | $566,164 | $564,984 | $717,148 | $632,487 | $687,828 | $702,809 | $748,954 | $782,932 | $872,872 |
| Inventory | $0 | $0 | $0 | $0 | $0 | $0 | $71,903 | $63,641 | $67,678 | $57,625 | $58,347 | $56,339 | $61,302 |
| Other Current Assets | $0 | $0 | $0 | $0 | $0 | $0 | $0 | $0 | $0 | $0 | $0 | $0 | $0 |
| Total Current Assets | $580,500 | $569,688 | $568,541 | $567,349 | $566,164 | $564,984 | $789,050 | $696,127 | $755,506 | $760,434 | $807,301 | $839,271 | $934,174 |
| Long-term Assets | |||||||||||||
| Long-term Assets | $65,000 | $65,000 | $65,000 | $65,000 | $65,000 | $65,000 | $65,000 | $65,000 | $65,000 | $65,000 | $65,000 | $65,000 | $65,000 |
| Accumulated Depreciation | $0 | ($100) | ($200) | ($300) | ($400) | ($500) | $1,500 | $3,500 | $5,500 | $7,500 | $9,500 | $11,500 | $13,500 |
| Total Long-term Assets | $65,000 | $65,100 | $65,200 | $65,300 | $65,400 | $65,500 | $63,500 | $61,500 | $59,500 | $57,500 | $55,500 | $53,500 | $51,500 |
| Total Assets | $645,500 | $634,788 | $633,741 | $632,649 | $631,564 | $630,484 | $852,550 | $757,627 | $815,006 | $817,934 | $862,801 | $892,771 | $985,674 |
| Liabilities and Capital | Month 1 | Month 2 | Month 3 | Month 4 | Month 5 | Month 6 | Month 7 | Month 8 | Month 9 | Month 10 | Month 11 | Month 12 | |
| Current Liabilities | |||||||||||||
| Accounts Payable | $10,000 | $334 | $379 | $373 | $367 | $361 | $221,375 | $92,594 | $110,241 | $84,552 | $96,875 | $92,318 | $141,197 |
| Current Borrowing | $0 | $0 | $0 | $0 | $0 | $0 | $0 | $0 | $0 | $0 | $0 | $0 | $0 |
| Other Current Liabilities | $10,000 | $10,000 | $10,000 | $10,000 | $10,000 | $10,000 | $10,000 | $10,000 | $10,000 | $10,000 | $10,000 | $10,000 | $10,000 |
| Subtotal Current Liabilities | $20,000 | $10,334 | $10,379 | $10,373 | $10,367 | $10,361 | $231,375 | $102,594 | $120,241 | $94,552 | $106,875 | $102,318 | $151,197 |
| Long-term Liabilities | $50,000 | $49,200 | $48,400 | $47,600 | $46,800 | $46,000 | $45,200 | $44,400 | $43,600 | $42,800 | $42,000 | $41,200 | $40,400 |
| Total Liabilities | $70,000 | $59,534 | $58,779 | $57,973 | $57,167 | $56,361 | $276,575 | $146,994 | $163,841 | $137,352 | $148,875 | $143,518 | $191,597 |
| Paid-in Capital | $900,000 | $900,000 | $900,000 | $900,000 | $900,000 | $900,000 | $900,000 | $900,000 | $900,000 | $900,000 | $900,000 | $900,000 | $900,000 |
| Retained Earnings | ($324,500) | ($324,500) | ($324,500) | ($324,500) | ($324,500) | ($324,500) | ($324,500) | ($324,500) | ($324,500) | ($324,500) | ($324,500) | ($324,500) | ($324,500) |
| Earnings | $0 | ($246) | ($538) | ($824) | ($1,103) | ($1,377) | $475 | $35,133 | $75,665 | $105,082 | $138,426 | $173,753 | $218,577 |
| Total Capital | $575,500 | $575,254 | $574,962 | $574,676 | $574,397 | $574,123 | $575,975 | $610,633 | $651,165 | $680,582 | $713,926 | $749,253 | $794,077 |
| Total Liabilities and Capital | $645,500 | $634,788 | $633,741 | $632,649 | $631,564 | $630,484 | $852,550 | $757,627 | $815,006 | $817,934 | $862,801 | $892,771 | $985,674 |
| Net Worth | $575,500 | $575,254 | $574,962 | $574,676 | $574,397 | $574,123 | $575,975 | $610,633 | $651,165 | $680,582 | $713,926 | $749,253 | $794,077 |


