
Glass Dreams
Executive Summary
More than 10 years ago Jan Primak discovered stained glass art. Within six months, she was teaching the art, running a successful stained glass retail store in Richmond and developing her own artistic style. Jan returned to Montclair and dedicated her time to creating unique stained glass pieces and teaching stained glass classes at Montclair Community College. Later she opened Glass Dreams, a highly successful art studio and gallery.
As well as an art studio, Glass Dreams is a small retail outlet for supplies, tools and glass in Montclair.
Glass Dreams wants to expand the retail outlet to create a second storefront with the most comprehensive variety of supplies, tools and glass in Montclair. The new storefront will be adjacent to studio. The original storefront will become a reference library with over 610 art glass books, and a training center for both serious and recreational artists, novice and expert alike.
Glass Dreams will secure a $50,000 long-term loan to facilitate the opening of a second storefront.
1.1 Mission
Glass Dreams’ mission is to offer consumers one of a kind stained glass art as well as provide tools and training to both serious and recreational artists.
1.2 Keys to Success
- A knowledgeable staff that can quickly answer customer questions.
- Excellent instruction in the art of stained glass.
- A comfortable shopping environment that keeps customers in the store.

Company Summary
Glass Dreams is a highly successful art studio and gallery, as well as a small retail outlet for supplies, tools and glass in Montclair. Jan Primak is a popular stained glass instructor and the studio has become a gathering place for aspiring stained glass artists.
2.1 Company History
Jan uses stained glass art and the play of ambient light to create her artistic interpretations. Jan combines the shifting qualities of light with the subtle textures and colors of glass, to create graceful, elegant, exclusive pieces for discriminating collectors from around the world.
Jan Primak has chosen to work in Montclair, but she is an artist of international renown. Her singular stained glass creations have sold to Japan, Belgium, Egypt, Australia and the United States. A high-energy individual, she has a seemingly limitless supply of creative ideas. She proudly emphasizes the individuality of each and every piece she creates. Her singular art pieces and limitless ideas result in high demand for her work.
Her studio, gallery and store are combined in one, which creates an unusually wonderful experience for customers and aspiring stained glass artists. Her classes are so popular that the existing store space can no longer accommodate her students and customers.

| Past Performance | |||
| 1999 | 2000 | 2001 | |
| Sales | $180,000 | $220,000 | $260,000 |
| Gross Margin | $50,000 | $60,000 | $75,000 |
| Gross Margin % | 27.78% | 27.27% | 28.85% |
| Operating Expenses | $100,000 | $110,000 | $120,000 |
| Inventory Turnover | 13.00 | 11.85 | 5.52 |
| Balance Sheet | |||
| 1999 | 2000 | 2001 | |
| Current Assets | |||
| Cash | $10,000 | $30,000 | $50,000 |
| Inventory | $10,000 | $17,000 | $50,000 |
| Other Current Assets | $0 | $0 | $0 |
| Total Current Assets | $20,000 | $47,000 | $100,000 |
| Long-term Assets | |||
| Long-term Assets | $20,000 | $20,000 | $20,000 |
| Accumulated Depreciation | $1,000 | $2,000 | $3,000 |
| Total Long-term Assets | $19,000 | $18,000 | $17,000 |
| Total Assets | $39,000 | $65,000 | $117,000 |
| Current Liabilities | |||
| Accounts Payable | $14,000 | $15,000 | $16,000 |
| Current Borrowing | $0 | $0 | $0 |
| Other Current Liabilities (interest free) | $0 | $0 | $0 |
| Total Current Liabilities | $14,000 | $15,000 | $16,000 |
| Long-term Liabilities | $0 | $0 | $50,000 |
| Total Liabilities | $14,000 | $15,000 | $66,000 |
| Paid-in Capital | $0 | $0 | $0 |
| Retained Earnings | ($5,000) | $20,000 | $11,000 |
| Earnings | $30,000 | $30,000 | $40,000 |
| Total Capital | $25,000 | $50,000 | $51,000 |
| Total Capital and Liabilities | $39,000 | $65,000 | $117,000 |
| Other Inputs | |||
| Payment Days | 0 | 0 | 0 |
2.2 Company Ownership
Jan Primak is the owner of Glass Dreams.
Products and Services
Glass Dreams will be opening a second store front that will focus on selling stained glass supplies. The new space will double the inventory of Glass Dreams and will provide ample space for customers to shop. The retail space will have its own manager and staff.
Glass Dreams provides the following products and services:
STAINED GLASS SUPPLIES
- Basic and super stained glass tool kits;
- Gryphon band saws;
- Tauris ring saws;
- Glass grinders;
- Glass: Spectrum, Kokomo, Bullseye, Armstrong, Optimum, Sahara, English Muffle, Uroborus, GNA, Antiques, Gluechip;
- Mosaic forms and supplies;
- Slab glass (Dalle De Verre);
- Solder;
- Lamp bases;
- Bevels;
- Books and more!
TEACHING
- Stained glass courses;
- 7-10 week classes;
- Novice to advanced;
- Mosaics, etching, soldering–one day courses.
STAINED GLASS DESIGNS FOR
- Entryways;
- Shower doors;
- Lamps;
- Windows;
- Gifts;
- Custom orders;
- Residential;
- Commercial.
Market Analysis Summary
Stained glass is a very popular craft art. It has grown to be a popular attraction of art and craft galleries and festivals. There are approximately 2,000 galleries on the West Coast that carry stained glass art. Each year, stained glass artists are popular attractions at over 250 major arts and craft festivals on the West Coast. It is estimated that over 30 million shopper visit these arts and craft festivals annually. These galleries and festivals represent millions of dollars in sales for stained glass artists.
Over the past three years, Jan Primak has had many customers sign up for stained glass project classes. Some of these students have gone on to become stained glass artists. Jan has built a base of loyal artists and customers who use Glass Dreams as a resource.
4.1 Market Segmentation
Glass Dreams will focus on two customer groups:
- Recreational Artists: These are customers of Jan’s less expensive pieces and are interested in trying their own hand at creating a piece based on one of Jan’s designs.
- Serious Artists: This group represents the strong artist base that comes from three years of teaching stained glass courses. Over that period, Jan has assisted 300 students in finishing multiple stained glass projects.

| Market Analysis | |||||||
| 2002 | 2003 | 2004 | 2005 | 2006 | |||
| Potential Customers | Growth | CAGR | |||||
| Recreational Artists | 15% | 5,000 | 5,750 | 6,613 | 7,605 | 8,746 | 15.00% |
| Serious Artists | 10% | 2,000 | 2,200 | 2,420 | 2,662 | 2,928 | 10.00% |
| Total | 13.64% | 7,000 | 7,950 | 9,033 | 10,267 | 11,674 | 13.64% |
Strategy and Implementation Summary
After the second storefront is opened, Glass Dreams will have the following resources:
Studio
The work studio is a new space with many amenities, including a 4′ x 6′ light box table, a full basement with kilns, and a kitchenette where coffee and good conversation are always present. Jan Primak and apprentices are continuously working on many projects.
The teaching section of the studio, allows for up to six people at a time, where they can receive instruction in stained glass assembly. The different types of classes being taught are: beginning, intermediate or advanced. Some of the different types of projects customers can learn to make are: lead came windows, panel lamps, tiffany lamps, glass mosaics, picture frames, stained glass boxes, stained and beveled glass windows, stained glass stone tables, mosaic stepping stones and garden stakes.
Retail
The retail section offers everything that a glass crafter needs to work with stained glass, we offer a selection with over 6,000 square feet of stained glass varying from clear textured to hand rolled opalescent and cathedrals. The retail store will have a manager and a staff of two. This staff will be responsible for the setup and maintenance of the store.
5.1 Competitive Edge
Jan Primak is an artist of international renown. She is the competitive edge of Glass Dreams. Her stained glass creations are sold throughout the world. She is a high-energy individual with a seemingly limitless supply of creative ideas. But most importantly, she is excellent with customers and fellow artists. Her classes are popular and have generated a loyal base of budding artists that return again and again to Glass Dreams for supplies and inspiration.
5.2 Sales Strategy
Glass Dream’s focus will be on building the retail storefront during the first three months of operation. During that time, Glass Dreams will offer a 20% discount on all purchases of $50 or more. Glass Dreams anticipates that sales will grow slowly during the first five months of the store’s operation.

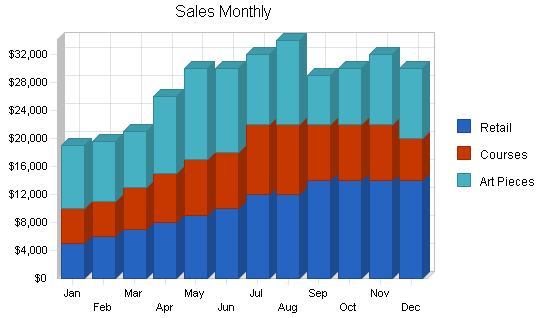
5.2.1 Sales Forecast
The following is the sales forecast for three years.

| Sales Forecast | |||
| 2002 | 2003 | 2004 | |
| Sales | |||
| Retail | $125,000 | $140,000 | $160,000 |
| Courses | $89,000 | $100,000 | $100,000 |
| Art Pieces | $118,500 | $120,000 | $140,000 |
| Total Sales | $332,500 | $360,000 | $400,000 |
| Direct Cost of Sales | 2002 | 2003 | 2004 |
| Retail | $40,500 | $45,000 | $52,000 |
| Courses | $0 | $0 | $0 |
| Art Pieces | $25,250 | $30,000 | $36,000 |
| Subtotal Direct Cost of Sales | $65,750 | $75,000 | $88,000 |
Management Summary
Jan Primak will manage the staff of Glass Dreams, though the retail storefront will have its own manager. Jan has over ten years experience in stained glass art. More importantly, she has been a popular arts teacher at the local community college. Her ability to manage people and maintain a disciplined, but creative, environment is one of her strongest hallmark as an artist and teacher.
6.1 Personnel Plan
Glass Dreams will be doubling its staff with the opening of the second storefront. The retail store manager position and the retail staff positions are new. The personnel plan for Glass Dreams is as follows:
| Personnel Plan | |||
| 2002 | 2003 | 2004 | |
| Jan Primak | $36,000 | $38,000 | $40,000 |
| Retail Store Manager | $32,400 | $34,000 | $36,000 |
| Apprentices/Project Assistants (2) | $48,000 | $48,000 | $48,000 |
| Retail Staff (2) | $38,400 | $40,000 | $42,000 |
| Total People | 5 | 5 | 5 |
| Total Payroll | $154,800 | $160,000 | $166,000 |
Financial Plan
The following sections outline the financial plan for Glass Dreams.
7.1 Break-even Analysis
The following table and chart show our monthly break-even point for the next year.

| Break-even Analysis | |
| Monthly Revenue Break-even | $23,353 |
| Assumptions: | |
| Average Percent Variable Cost | 20% |
| Estimated Monthly Fixed Cost | $18,735 |
7.2 Projected Profit and Loss
The following table and charts are the projected profit and loss for three years.


| Pro Forma Profit and Loss | |||
| 2002 | 2003 | 2004 | |
| Sales | $332,500 | $360,000 | $400,000 |
| Direct Cost of Sales | $65,750 | $75,000 | $88,000 |
| Other Production Expenses | $0 | $0 | $0 |
| Total Cost of Sales | $65,750 | $75,000 | $88,000 |
| Gross Margin | $266,750 | $285,000 | $312,000 |
| Gross Margin % | 80.23% | 79.17% | 78.00% |
| Expenses | |||
| Payroll | $154,800 | $160,000 | $166,000 |
| Sales and Marketing and Other Expenses | $6,000 | $6,000 | $6,000 |
| Depreciation | $0 | $0 | $0 |
| Leased Equipment | $0 | $0 | $0 |
| Utilities | $4,800 | $4,800 | $4,800 |
| Insurance | $0 | $0 | $0 |
| Rent | $36,000 | $36,000 | $36,000 |
| Payroll Taxes | $23,220 | $24,000 | $24,900 |
| Other | $0 | $0 | $0 |
| Total Operating Expenses | $224,820 | $230,800 | $237,700 |
| Profit Before Interest and Taxes | $41,930 | $54,200 | $74,300 |
| EBITDA | $41,930 | $54,200 | $74,300 |
| Interest Expense | $4,415 | $3,380 | $2,300 |
| Taxes Incurred | $11,255 | $15,246 | $21,600 |
| Net Profit | $26,260 | $35,574 | $50,400 |
| Net Profit/Sales | 7.90% | 9.88% | 12.60% |
7.3 Projected Cash Flow
The following table and chart are the projected cash flow for three years.

| Pro Forma Cash Flow | |||
| 2002 | 2003 | 2004 | |
| Cash Received | |||
| Cash from Operations | |||
| Cash Sales | $332,500 | $360,000 | $400,000 |
| Subtotal Cash from Operations | $332,500 | $360,000 | $400,000 |
| Additional Cash Received | |||
| Sales Tax, VAT, HST/GST Received | $0 | $0 | $0 |
| New Current Borrowing | $0 | $0 | $0 |
| New Other Liabilities (interest-free) | $0 | $0 | $0 |
| New Long-term Liabilities | $0 | $0 | $0 |
| Sales of Other Current Assets | $0 | $0 | $0 |
| Sales of Long-term Assets | $0 | $0 | $0 |
| New Investment Received | $0 | $0 | $0 |
| Subtotal Cash Received | $332,500 | $360,000 | $400,000 |
| Expenditures | 2002 | 2003 | 2004 |
| Expenditures from Operations | |||
| Cash Spending | $154,800 | $160,000 | $166,000 |
| Bill Payments | $111,511 | $164,044 | $183,256 |
| Subtotal Spent on Operations | $266,311 | $324,044 | $349,256 |
| Additional Cash Spent | |||
| Sales Tax, VAT, HST/GST Paid Out | $0 | $0 | $0 |
| Principal Repayment of Current Borrowing | $0 | $0 | $0 |
| Other Liabilities Principal Repayment | $0 | $0 | $0 |
| Long-term Liabilities Principal Repayment | $10,800 | $10,800 | $10,800 |
| Purchase Other Current Assets | $0 | $0 | $0 |
| Purchase Long-term Assets | $0 | $0 | $0 |
| Dividends | $0 | $0 | $0 |
| Subtotal Cash Spent | $277,111 | $334,844 | $360,056 |
| Net Cash Flow | $55,389 | $25,156 | $39,944 |
| Cash Balance | $105,389 | $130,545 | $170,490 |
7.4 Projected Balance Sheet
The following table is the projected balance sheet for three years.
| Pro Forma Balance Sheet | |||
| 2002 | 2003 | 2004 | |
| Assets | |||
| Current Assets | |||
| Cash | $105,389 | $130,545 | $170,490 |
| Inventory | $6,380 | $7,278 | $8,539 |
| Other Current Assets | $0 | $0 | $0 |
| Total Current Assets | $111,769 | $137,823 | $179,029 |
| Long-term Assets | |||
| Long-term Assets | $20,000 | $20,000 | $20,000 |
| Accumulated Depreciation | $3,000 | $3,000 | $3,000 |
| Total Long-term Assets | $17,000 | $17,000 | $17,000 |
| Total Assets | $128,769 | $154,823 | $196,029 |
| Liabilities and Capital | 2002 | 2003 | 2004 |
| Current Liabilities | |||
| Accounts Payable | $12,309 | $13,588 | $15,194 |
| Current Borrowing | $0 | $0 | $0 |
| Other Current Liabilities | $0 | $0 | $0 |
| Subtotal Current Liabilities | $12,309 | $13,588 | $15,194 |
| Long-term Liabilities | $39,200 | $28,400 | $17,600 |
| Total Liabilities | $51,509 | $41,988 | $32,794 |
| Paid-in Capital | $0 | $0 | $0 |
| Retained Earnings | $51,000 | $77,261 | $112,835 |
| Earnings | $26,260 | $35,574 | $50,400 |
| Total Capital | $77,261 | $112,835 | $163,235 |
| Total Liabilities and Capital | $128,769 | $154,823 | $196,029 |
| Net Worth | $77,260 | $112,835 | $163,235 |
7.5 Business Ratios
Business ratios for the years of this plan are shown below. Industry profile ratios based on the Standard Industrial Classification (SIC) code 7336, Commercial Art and Graphic Design, are shown for comparison.
| Ratio Analysis | ||||
| 2002 | 2003 | 2004 | Industry Profile | |
| Sales Growth | 27.88% | 8.27% | 11.11% | 8.50% |
| Percent of Total Assets | ||||
| Inventory | 4.95% | 4.70% | 4.36% | 5.30% |
| Other Current Assets | 0.00% | 0.00% | 0.00% | 44.20% |
| Total Current Assets | 86.80% | 89.02% | 91.33% | 69.00% |
| Long-term Assets | 13.20% | 10.98% | 8.67% | 31.00% |
| Total Assets | 100.00% | 100.00% | 100.00% | 100.00% |
| Current Liabilities | 9.56% | 8.78% | 7.75% | 43.70% |
| Long-term Liabilities | 30.44% | 18.34% | 8.98% | 19.40% |
| Total Liabilities | 40.00% | 27.12% | 16.73% | 63.10% |
| Net Worth | 60.00% | 72.88% | 83.27% | 36.90% |
| Percent of Sales | ||||
| Sales | 100.00% | 100.00% | 100.00% | 100.00% |
| Gross Margin | 80.23% | 79.17% | 78.00% | 0.00% |
| Selling, General & Administrative Expenses | 72.33% | 69.29% | 65.40% | 81.30% |
| Advertising Expenses | 1.80% | 1.67% | 1.50% | 1.00% |
| Profit Before Interest and Taxes | 12.61% | 15.06% | 18.58% | 1.70% |
| Main Ratios | ||||
| Current | 9.08 | 10.14 | 11.78 | 1.60 |
| Quick | 8.56 | 9.61 | 11.22 | 1.23 |
| Total Debt to Total Assets | 40.00% | 27.12% | 16.73% | 63.10% |
| Pre-tax Return on Net Worth | 48.56% | 45.04% | 44.11% | 3.60% |
| Pre-tax Return on Assets | 29.13% | 32.82% | 36.73% | 9.80% |
| Additional Ratios | 2002 | 2003 | 2004 | |
| Net Profit Margin | 7.90% | 9.88% | 12.60% | n.a |
| Return on Equity | 33.99% | 31.53% | 30.88% | n.a |
| Activity Ratios | ||||
| Inventory Turnover | 2.93 | 10.98 | 11.13 | n.a |
| Accounts Payable Turnover | 8.76 | 12.17 | 12.17 | n.a |
| Payment Days | 31 | 29 | 28 | n.a |
| Total Asset Turnover | 2.58 | 2.33 | 2.04 | n.a |
| Debt Ratios | ||||
| Debt to Net Worth | 0.67 | 0.37 | 0.20 | n.a |
| Current Liab. to Liab. | 0.24 | 0.32 | 0.46 | n.a |
| Liquidity Ratios | ||||
| Net Working Capital | $99,460 | $124,235 | $163,835 | n.a |
| Interest Coverage | 9.50 | 16.04 | 32.30 | n.a |
| Additional Ratios | ||||
| Assets to Sales | 0.39 | 0.43 | 0.49 | n.a |
| Current Debt/Total Assets | 10% | 9% | 8% | n.a |
| Acid Test | 8.56 | 9.61 | 11.22 | n.a |
| Sales/Net Worth | 4.30 | 3.19 | 2.45 | n.a |
| Dividend Payout | 0.00 | 0.00 | 0.00 | n.a |
Appendix
| Sales Forecast | |||||||||||||
| Jan | Feb | Mar | Apr | May | Jun | Jul | Aug | Sep | Oct | Nov | Dec | ||
| Sales | |||||||||||||
| Retail | 0% | $5,000 | $6,000 | $7,000 | $8,000 | $9,000 | $10,000 | $12,000 | $12,000 | $14,000 | $14,000 | $14,000 | $14,000 |
| Courses | 0% | $5,000 | $5,000 | $6,000 | $7,000 | $8,000 | $8,000 | $10,000 | $10,000 | $8,000 | $8,000 | $8,000 | $6,000 |
| Art Pieces | 0% | $9,000 | $8,500 | $8,000 | $11,000 | $13,000 | $12,000 | $10,000 | $12,000 | $7,000 | $8,000 | $10,000 | $10,000 |
| Total Sales | $19,000 | $19,500 | $21,000 | $26,000 | $30,000 | $30,000 | $32,000 | $34,000 | $29,000 | $30,000 | $32,000 | $30,000 | |
| Direct Cost of Sales | Jan | Feb | Mar | Apr | May | Jun | Jul | Aug | Sep | Oct | Nov | Dec | |
| Retail | $1,300 | $1,600 | $2,100 | $3,000 | $4,000 | $4,000 | $4,500 | $4,500 | $4,000 | $4,200 | $4,000 | $3,300 | |
| Courses | $0 | $0 | $0 | $0 | $0 | $0 | $0 | $0 | $0 | $0 | $0 | $0 | |
| Art Pieces | $1,000 | $1,500 | $2,000 | $2,500 | $2,500 | $2,500 | $2,000 | $2,500 | $1,750 | $2,000 | $2,500 | $2,500 | |
| Subtotal Direct Cost of Sales | $2,300 | $3,100 | $4,100 | $5,500 | $6,500 | $6,500 | $6,500 | $7,000 | $5,750 | $6,200 | $6,500 | $5,800 | |
| Personnel Plan | |||||||||||||
| Jan | Feb | Mar | Apr | May | Jun | Jul | Aug | Sep | Oct | Nov | Dec | ||
| Jan Primak | 0% | $3,000 | $3,000 | $3,000 | $3,000 | $3,000 | $3,000 | $3,000 | $3,000 | $3,000 | $3,000 | $3,000 | $3,000 |
| Retail Store Manager | 0% | $2,700 | $2,700 | $2,700 | $2,700 | $2,700 | $2,700 | $2,700 | $2,700 | $2,700 | $2,700 | $2,700 | $2,700 |
| Apprentices/Project Assistants (2) | 0% | $4,000 | $4,000 | $4,000 | $4,000 | $4,000 | $4,000 | $4,000 | $4,000 | $4,000 | $4,000 | $4,000 | $4,000 |
| Retail Staff (2) | 0% | $3,200 | $3,200 | $3,200 | $3,200 | $3,200 | $3,200 | $3,200 | $3,200 | $3,200 | $3,200 | $3,200 | $3,200 |
| Total People | 5 | 5 | 5 | 5 | 5 | 5 | 5 | 5 | 5 | 5 | 5 | 5 | |
| Total Payroll | $12,900 | $12,900 | $12,900 | $12,900 | $12,900 | $12,900 | $12,900 | $12,900 | $12,900 | $12,900 | $12,900 | $12,900 | |
| General Assumptions | |||||||||||||
| Jan | Feb | Mar | Apr | May | Jun | Jul | Aug | Sep | Oct | Nov | Dec | ||
| Plan Month | 1 | 2 | 3 | 4 | 5 | 6 | 7 | 8 | 9 | 10 | 11 | 12 | |
| Current Interest Rate | 10.00% | 10.00% | 10.00% | 10.00% | 10.00% | 10.00% | 10.00% | 10.00% | 10.00% | 10.00% | 10.00% | 10.00% | |
| Long-term Interest Rate | 10.00% | 10.00% | 10.00% | 10.00% | 10.00% | 10.00% | 10.00% | 10.00% | 10.00% | 10.00% | 10.00% | 10.00% | |
| Tax Rate | 30.00% | 30.00% | 30.00% | 30.00% | 30.00% | 30.00% | 30.00% | 30.00% | 30.00% | 30.00% | 30.00% | 30.00% | |
| Other | 0 | 0 | 0 | 0 | 0 | 0 | 0 | 0 | 0 | 0 | 0 | 0 | |
| Pro Forma Profit and Loss | |||||||||||||
| Jan | Feb | Mar | Apr | May | Jun | Jul | Aug | Sep | Oct | Nov | Dec | ||
| Sales | $19,000 | $19,500 | $21,000 | $26,000 | $30,000 | $30,000 | $32,000 | $34,000 | $29,000 | $30,000 | $32,000 | $30,000 | |
| Direct Cost of Sales | $2,300 | $3,100 | $4,100 | $5,500 | $6,500 | $6,500 | $6,500 | $7,000 | $5,750 | $6,200 | $6,500 | $5,800 | |
| Other Production Expenses | $0 | $0 | $0 | $0 | $0 | $0 | $0 | $0 | $0 | $0 | $0 | $0 | |
| Total Cost of Sales | $2,300 | $3,100 | $4,100 | $5,500 | $6,500 | $6,500 | $6,500 | $7,000 | $5,750 | $6,200 | $6,500 | $5,800 | |
| Gross Margin | $16,700 | $16,400 | $16,900 | $20,500 | $23,500 | $23,500 | $25,500 | $27,000 | $23,250 | $23,800 | $25,500 | $24,200 | |
| Gross Margin % | 87.89% | 84.10% | 80.48% | 78.85% | 78.33% | 78.33% | 79.69% | 79.41% | 80.17% | 79.33% | 79.69% | 80.67% | |
| Expenses | |||||||||||||
| Payroll | $12,900 | $12,900 | $12,900 | $12,900 | $12,900 | $12,900 | $12,900 | $12,900 | $12,900 | $12,900 | $12,900 | $12,900 | |
| Sales and Marketing and Other Expenses | $500 | $500 | $500 | $500 | $500 | $500 | $500 | $500 | $500 | $500 | $500 | $500 | |
| Depreciation | $0 | $0 | $0 | $0 | $0 | $0 | $0 | $0 | $0 | $0 | $0 | $0 | |
| Leased Equipment | $0 | $0 | $0 | $0 | $0 | $0 | $0 | $0 | $0 | $0 | $0 | $0 | |
| Utilities | $400 | $400 | $400 | $400 | $400 | $400 | $400 | $400 | $400 | $400 | $400 | $400 | |
| Insurance | $0 | $0 | $0 | $0 | $0 | $0 | $0 | $0 | $0 | $0 | $0 | $0 | |
| Rent | $3,000 | $3,000 | $3,000 | $3,000 | $3,000 | $3,000 | $3,000 | $3,000 | $3,000 | $3,000 | $3,000 | $3,000 | |
| Payroll Taxes | 15% | $1,935 | $1,935 | $1,935 | $1,935 | $1,935 | $1,935 | $1,935 | $1,935 | $1,935 | $1,935 | $1,935 | $1,935 |
| Other | $0 | $0 | $0 | $0 | $0 | $0 | $0 | $0 | $0 | $0 | $0 | $0 | |
| Total Operating Expenses | $18,735 | $18,735 | $18,735 | $18,735 | $18,735 | $18,735 | $18,735 | $18,735 | $18,735 | $18,735 | $18,735 | $18,735 | |
| Profit Before Interest and Taxes | ($2,035) | ($2,335) | ($1,835) | $1,765 | $4,765 | $4,765 | $6,765 | $8,265 | $4,515 | $5,065 | $6,765 | $5,465 | |
| EBITDA | ($2,035) | ($2,335) | ($1,835) | $1,765 | $4,765 | $4,765 | $6,765 | $8,265 | $4,515 | $5,065 | $6,765 | $5,465 | |
| Interest Expense | $409 | $402 | $394 | $387 | $379 | $372 | $364 | $357 | $349 | $342 | $334 | $327 | |
| Taxes Incurred | ($733) | ($821) | ($669) | $413 | $1,316 | $1,318 | $1,920 | $2,373 | $1,250 | $1,417 | $1,929 | $1,541 | |
| Net Profit | ($1,711) | ($1,916) | ($1,560) | $965 | $3,070 | $3,075 | $4,481 | $5,536 | $2,916 | $3,306 | $4,502 | $3,597 | |
| Net Profit/Sales | -9.00% | -9.82% | -7.43% | 3.71% | 10.23% | 10.25% | 14.00% | 16.28% | 10.06% | 11.02% | 14.07% | 11.99% | |
| Pro Forma Cash Flow | |||||||||||||
| Jan | Feb | Mar | Apr | May | Jun | Jul | Aug | Sep | Oct | Nov | Dec | ||
| Cash Received | |||||||||||||
| Cash from Operations | |||||||||||||
| Cash Sales | $19,000 | $19,500 | $21,000 | $26,000 | $30,000 | $30,000 | $32,000 | $34,000 | $29,000 | $30,000 | $32,000 | $30,000 | |
| Subtotal Cash from Operations | $19,000 | $19,500 | $21,000 | $26,000 | $30,000 | $30,000 | $32,000 | $34,000 | $29,000 | $30,000 | $32,000 | $30,000 | |
| Additional Cash Received | |||||||||||||
| Sales Tax, VAT, HST/GST Received | 0.00% | $0 | $0 | $0 | $0 | $0 | $0 | $0 | $0 | $0 | $0 | $0 | $0 |
| New Current Borrowing | $0 | $0 | $0 | $0 | $0 | $0 | $0 | $0 | $0 | $0 | $0 | $0 | |
| New Other Liabilities (interest-free) | $0 | $0 | $0 | $0 | $0 | $0 | $0 | $0 | $0 | $0 | $0 | $0 | |
| New Long-term Liabilities | $0 | $0 | $0 | $0 | $0 | $0 | $0 | $0 | $0 | $0 | $0 | $0 | |
| Sales of Other Current Assets | $0 | $0 | $0 | $0 | $0 | $0 | $0 | $0 | $0 | $0 | $0 | $0 | |
| Sales of Long-term Assets | $0 | $0 | $0 | $0 | $0 | $0 | $0 | $0 | $0 | $0 | $0 | $0 | |
| New Investment Received | $0 | $0 | $0 | $0 | $0 | $0 | $0 | $0 | $0 | $0 | $0 | $0 | |
| Subtotal Cash Received | $19,000 | $19,500 | $21,000 | $26,000 | $30,000 | $30,000 | $32,000 | $34,000 | $29,000 | $30,000 | $32,000 | $30,000 | |
| Expenditures | Jan | Feb | Mar | Apr | May | Jun | Jul | Aug | Sep | Oct | Nov | Dec | |
| Expenditures from Operations | |||||||||||||
| Cash Spending | $12,900 | $12,900 | $12,900 | $12,900 | $12,900 | $12,900 | $12,900 | $12,900 | $12,900 | $12,900 | $12,900 | $12,900 | |
| Bill Payments | $16,184 | $5,508 | $5,420 | $5,596 | $6,665 | $7,530 | $7,544 | $8,134 | $8,646 | $11,118 | $14,310 | $14,855 | |
| Subtotal Spent on Operations | $29,084 | $18,408 | $18,320 | $18,496 | $19,565 | $20,430 | $20,444 | $21,034 | $21,546 | $24,018 | $27,210 | $27,755 | |
| Additional Cash Spent | |||||||||||||
| Sales Tax, VAT, HST/GST Paid Out | $0 | $0 | $0 | $0 | $0 | $0 | $0 | $0 | $0 | $0 | $0 | $0 | |
| Principal Repayment of Current Borrowing | $0 | $0 | $0 | $0 | $0 | $0 | $0 | $0 | $0 | $0 | $0 | $0 | |
| Other Liabilities Principal Repayment | $0 | $0 | $0 | $0 | $0 | $0 | $0 | $0 | $0 | $0 | $0 | $0 | |
| Long-term Liabilities Principal Repayment | $900 | $900 | $900 | $900 | $900 | $900 | $900 | $900 | $900 | $900 | $900 | $900 | |
| Purchase Other Current Assets | $0 | $0 | $0 | $0 | $0 | $0 | $0 | $0 | $0 | $0 | $0 | $0 | |
| Purchase Long-term Assets | $0 | $0 | $0 | $0 | $0 | $0 | $0 | $0 | $0 | $0 | $0 | $0 | |
| Dividends | $0 | $0 | $0 | $0 | $0 | $0 | $0 | $0 | $0 | $0 | $0 | $0 | |
| Subtotal Cash Spent | $29,984 | $19,308 | $19,220 | $19,396 | $20,465 | $21,330 | $21,344 | $21,934 | $22,446 | $24,918 | $28,110 | $28,655 | |
| Net Cash Flow | ($10,984) | $192 | $1,780 | $6,604 | $9,535 | $8,670 | $10,656 | $12,066 | $6,554 | $5,082 | $3,890 | $1,345 | |
| Cash Balance | $39,016 | $39,209 | $40,988 | $47,592 | $57,127 | $65,797 | $76,453 | $88,518 | $95,073 | $100,154 | $104,044 | $105,389 | |
| Pro Forma Balance Sheet | |||||||||||||
| Jan | Feb | Mar | Apr | May | Jun | Jul | Aug | Sep | Oct | Nov | Dec | ||
| Assets | Starting Balances | ||||||||||||
| Current Assets | |||||||||||||
| Cash | $50,000 | $39,016 | $39,209 | $40,988 | $47,592 | $57,127 | $65,797 | $76,453 | $88,518 | $95,073 | $100,154 | $104,044 | $105,389 |
| Inventory | $50,000 | $47,700 | $44,600 | $40,500 | $35,000 | $28,500 | $22,000 | $15,500 | $8,500 | $6,325 | $6,820 | $7,150 | $6,380 |
| Other Current Assets | $0 | $0 | $0 | $0 | $0 | $0 | $0 | $0 | $0 | $0 | $0 | $0 | $0 |
| Total Current Assets | $100,000 | $86,716 | $83,809 | $81,488 | $82,592 | $85,627 | $87,797 | $91,953 | $97,018 | $101,398 | $106,974 | $111,194 | $111,769 |
| Long-term Assets | |||||||||||||
| Long-term Assets | $20,000 | $20,000 | $20,000 | $20,000 | $20,000 | $20,000 | $20,000 | $20,000 | $20,000 | $20,000 | $20,000 | $20,000 | $20,000 |
| Accumulated Depreciation | $3,000 | $3,000 | $3,000 | $3,000 | $3,000 | $3,000 | $3,000 | $3,000 | $3,000 | $3,000 | $3,000 | $3,000 | $3,000 |
| Total Long-term Assets | $17,000 | $17,000 | $17,000 | $17,000 | $17,000 | $17,000 | $17,000 | $17,000 | $17,000 | $17,000 | $17,000 | $17,000 | $17,000 |
| Total Assets | $117,000 | $103,716 | $100,809 | $98,488 | $99,592 | $102,627 | $104,797 | $108,953 | $114,018 | $118,398 | $123,974 | $128,194 | $128,769 |
| Liabilities and Capital | Jan | Feb | Mar | Apr | May | Jun | Jul | Aug | Sep | Oct | Nov | Dec | |
| Current Liabilities | |||||||||||||
| Accounts Payable | $16,000 | $5,327 | $5,235 | $5,375 | $6,414 | $7,279 | $7,274 | $7,849 | $8,279 | $10,642 | $13,812 | $14,431 | $12,309 |
| Current Borrowing | $0 | $0 | $0 | $0 | $0 | $0 | $0 | $0 | $0 | $0 | $0 | $0 | $0 |
| Other Current Liabilities | $0 | $0 | $0 | $0 | $0 | $0 | $0 | $0 | $0 | $0 | $0 | $0 | $0 |
| Subtotal Current Liabilities | $16,000 | $5,327 | $5,235 | $5,375 | $6,414 | $7,279 | $7,274 | $7,849 | $8,279 | $10,642 | $13,812 | $14,431 | $12,309 |
| Long-term Liabilities | $50,000 | $49,100 | $48,200 | $47,300 | $46,400 | $45,500 | $44,600 | $43,700 | $42,800 | $41,900 | $41,000 | $40,100 | $39,200 |
| Total Liabilities | $66,000 | $54,427 | $53,435 | $52,675 | $52,814 | $52,779 | $51,874 | $51,549 | $51,079 | $52,542 | $54,812 | $54,531 | $51,509 |
| Paid-in Capital | $0 | $0 | $0 | $0 | $0 | $0 | $0 | $0 | $0 | $0 | $0 | $0 | $0 |
| Retained Earnings | $11,000 | $51,000 | $51,000 | $51,000 | $51,000 | $51,000 | $51,000 | $51,000 | $51,000 | $51,000 | $51,000 | $51,000 | $51,000 |
| Earnings | $40,000 | ($1,711) | ($3,627) | ($5,187) | ($4,222) | ($1,152) | $1,923 | $6,404 | $11,940 | $14,856 | $18,162 | $22,664 | $26,260 |
| Total Capital | $51,000 | $49,289 | $47,373 | $45,813 | $46,778 | $49,848 | $52,923 | $57,404 | $62,940 | $65,856 | $69,162 | $73,664 | $77,261 |
| Total Liabilities and Capital | $117,000 | $103,716 | $100,809 | $98,488 | $99,592 | $102,627 | $104,797 | $108,953 | $114,018 | $118,398 | $123,974 | $128,194 | $128,769 |
| Net Worth | $51,000 | $49,289 | $47,373 | $45,813 | $46,778 | $49,848 | $52,923 | $57,404 | $62,940 | $65,856 | $69,162 | $73,664 | $77,260 |

