
Jerseys R Us
Executive Summary
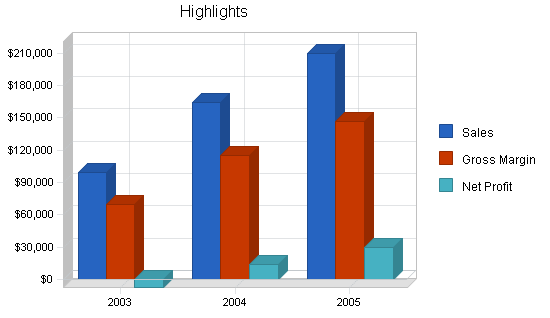
Jerseys R Us (Jerseys) is a Massachusetts-based collectible sports jersey store. Jerseys focuses on offering famous player baseball, football and cycling jerseys. Jerseys is an existing business that is being purchased by Phil Garment. Jerseys will reach profitability by the end of year one and will modestly generate profits for future years.
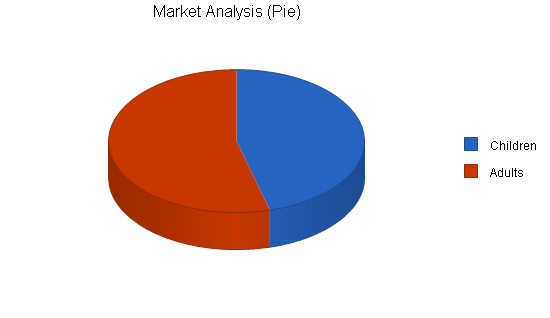
The sports collectible market is huge, particularly for sport jerseys. The ages of collectors ranges from young kids to grown adults. With the growing popularity of eBay, sport collectible trading has become even more popular with a much more open market. Jerseys has segmented the market into two niches, children and adults. In general the children are most interested in the baseball and football jerseys with the adults showing primary interest in all three.
Jerseys R Us has recognized three keys to success that will be instrumental. The first is having a comprehensive inventory. This will serve as an attraction to get many people browsing the store for what is for sale. The second key is to listen to customers. Having an active feedback loop will be essential for Jerseys to exceed customer expectations. The last key to success will be to implement and adhere to strict financial controls.
Jerseys‘ competitive edge of inventory will be leveraged to quickly grow sales. The inventory is an advantage for two reasons. First, it is very comprehensive, much more so than its competitors. Second, having a constant turnover of inventory will also be effective in increasing the times that an individual customer will come back to Jerseys to check up on any new products.
Jerseys R Us is owned and led by Phil Garment. Phil is a lifelong sports fanatic. He is passionate about sports which is clear just from speaking with him. After receiving his undergrad degree, Phil went to work for a leading sports marketing firm where he developed an incredible web of networking contacts. These contacts are instrumental in getting access to rare, hard to find jerseys. Phil also received great project management skills from the experience. To bolster this work experience, Phil studied for an MBA, providing him with the requisite skills for running a business.
1.1 Mission
It is Jerseys R Us’ mission to be the premier jersey collectible store. This will be accomplished by offering a wide selection of fair-priced jerseys and ensuring complete customer satisfaction.
1.2 Keys to Success
- Having a comprehensive, worthwhile inventory.
- Listening to customer feedback.
- Follow strict financial controls.
1.3 Objectives
- To be the premier sports jersey collectible store in the Mappleton area.
- Have constant turnover of inventory encouraging customers to come in often.
- Be known for excellent customer service.
Company Summary
Jerseys is an existing business that is being purchased by Phil Garment. The business will be a sole proprietorship. The business is being sold because the previous owner is ready to retire. For a lump sum, the lease will be transferred and Phil will receive the current inventory as well as the good will of the business. The name will remain the same and the inventory will also be similar, however, in addition to baseball and football jerseys, Phil will stock cycling jerseys as well.
2.1 Company History
The business began as Jerseys R Us back in 1980 by Chuck Jack. Chuck is ready to retire and was looking to get a bit of cash from his business, recognizing that a large portion of his retirement account will be supplied by his wife’s pension.

| Past Performance | |||
| 2000 | 2001 | 2002 | |
| Sales | $114,000 | $112,000 | $111,000 |
| Gross Margin | $65,000 | $63,000 | $59,000 |
| Gross Margin % | 57.02% | 56.25% | 53.15% |
| Operating Expenses | $0 | $0 | $0 |
| Inventory Turnover | 1.53 | 1.66 | 1.76 |
| Balance Sheet | |||
| 2000 | 2001 | 2002 | |
| Current Assets | |||
| Cash | $12,000 | $10,000 | $8,000 |
| Inventory | $32,000 | $27,000 | $32,000 |
| Other Current Assets | $12,000 | $14,000 | $18,000 |
| Total Current Assets | $56,000 | $51,000 | $58,000 |
| Long-term Assets | |||
| Long-term Assets | $12,000 | $22,000 | $34,000 |
| Accumulated Depreciation | $3,400 | $5,200 | $6,700 |
| Total Long-term Assets | $8,600 | $16,800 | $27,300 |
| Total Assets | $64,600 | $67,800 | $85,300 |
| Current Liabilities | |||
| Accounts Payable | $3,200 | $2,500 | $15,000 |
| Current Borrowing | $1,700 | $1,300 | $2,200 |
| Other Current Liabilities (interest free) | $0 | $0 | $0 |
| Total Current Liabilities | $4,900 | $3,800 | $17,200 |
| Long-term Liabilities | $12,000 | $8,000 | $8,000 |
| Total Liabilities | $16,900 | $11,800 | $25,200 |
| Paid-in Capital | $0 | $0 | $0 |
| Retained Earnings | $47,700 | $56,000 | $60,100 |
| Earnings | $0 | $0 | $0 |
| Total Capital | $47,700 | $56,000 | $60,100 |
| Total Capital and Liabilities | $64,600 | $67,800 | $85,300 |
| Other Inputs | |||
| Payment Days | 0 | 0 | 0 |
2.2 Company Ownership
Phil Garment is the sole proprietor.
Products
Jerseys R Us sells famous players’ collectible sport jerseys, typically from baseball, football, and cycling. There is a huge market for famous player jerseys, especially in Massachusetts which has rabid sport fans. The products will be procured through two sources, the first is personal networking, the second is eBay. While some customers might actually wear these previously worn jerseys, most are purchasing them as a collectible that they will put on display.
Market Analysis Summary
The sports collectible market is huge, particularly for sport jerseys. The ages of collectors ranges from young kids to grown adults. With the growing popularity of eBay, sport collectible trading has become even more popular with a much more open market. Jerseys has segmented the market into two niches, children and adults. In general the children are most interested in the baseball and football jerseys with the adults showing primary interest in the cycling jerseys.
Jerseys will employ different strategies to market itself to the two different market segments. While Jerseys will use an active marketing strategy, they will also rely on walk-by traffic as an excellent source of walk-in customers.
4.1 Market Segmentation
Jerseys will be targeting two distinct types of customers. Each one has its own distinct demographics.
- Children: these are kids typically ages seven to 15. They often participate in sports but are also caught up in viewing/following of professional sports and enjoy collecting memorabilia. While this group does not have significant amounts of discretionary income, a function of their age, they typically do get an allowance and save their money for purchases relating to sports.
- Adults: this market segment is typically very active in sports, they either play sports or follow it religiously. To them, nothing would be better than to stay in front of a TV for the entire Saturday or Sunday watching all the different games that day. Sixty-five percent of the adults that collect memorabilia began as a child and have continued into adulthood. The average income of this group $45,000. Fifty-five percent have at least some college education. This group enjoys to watch sports, while most of the observations occur with the TV, this group views live sports at least 10 times a year.
| Market Analysis | |||||||
| 2003 | 2004 | 2005 | 2006 | 2007 | |||
| Potential Customers | Growth | CAGR | |||||
| Children | 8% | 34,878 | 37,668 | 40,681 | 43,935 | 47,450 | 8.00% |
| Adults | 7% | 41,223 | 44,109 | 47,197 | 50,501 | 54,036 | 7.00% |
| Total | 7.46% | 76,101 | 81,777 | 87,878 | 94,436 | 101,486 | 7.46% |
4.2 Target Market Segment Strategy
Jerseys recognizes the need to try to communicate to both segments of the market and that a campaign must be developed separately for each group. Of the advertising that Jerseys will be undertaking, some will be utilizing magazines with primary child readership demographics for the child market, and adult publications for the adult segment. To attract additional child attention, Jerseys will also sponsor a few little leagues to ensure a presence among the children. The walk-in traffic of the store will be primarily adults as the store is located in a busy commercial retail area of the city and while some children do walk through the city browsing, the walk-in traffic will be primarily adult.
4.3 Industry Analysis
The sport collectibles market is made up primarily of mom and pop stores. There are very few larger stores or chains. This is the case to a large degree due to the fact that the products are used, one of a kind items. They are often hard to come by, thereby limiting the ability of a larger store to buy larger quantities, leveraging scales of economy.

The popularity of eBay has significantly increased the quantity of trades in the U.S., opening up the market for a much larger audience. While the market has opened up significantly, prices have seemed to rise. It can be speculated that the prices have risen due to the phenomenon of a bidding frenzy where people get all worked up about winning the auction and bid irrationally, relying on emotion to guide them through the auction. Because Jerseys has inside market knowledge, it is able to avoid the auctions that are unreasonably high and concentrate on the auctions that have gone unnoticed and are soliciting low bids. The high bid phenomenon of eBay therefore supplies a steady stream of customers to Jerseys because the customers are looking for reasonable prices, as well as the ability to touch ad feel before they purchase.
4.3.1 Competition and Buying Patterns
Jerseys R Us faces two sources of competition:
- Local sports collectible retail stores. There are two other retail stores in the city, however they tend to concentrate more on equipment than clothing.
- eBay. This is a good source for the same products that Jerseys‘ sells, however, prices are not always reasonable.
The buying habits of customers depends to a large degree on age and amount of knowledge they have regarding the market. The younger the customer, the more likely they will want to touch and feel what they are buying. The older the customer, the more they are willing to rely on a description of the item for their purchase as opposed to needing to see it in person. Additionally, the more information they have about the market, the more confident they are about bidding or buying something somewhat unknown since they can speculate its worth.
Strategy and Implementation Summary
Jerseys will leverage its competitive edge of a superior and constantly changing selection to lure customers and keep them coming back to check on changes in inventory. Sales will be generated through a combination of a multi-pronged marketing strategy that will drive sales from both targeted market segments.
5.1 Competitive Edge
Jerseys R Us enjoys a two-pronged competitive edge with its inventory:
- A large inventory to keep everyone happy and interested.
- A constantly revolving inventory which creates incentives for customers to check back often for new products.
This competitive edge will be maintained through Jerseys‘ excellent procurement system that relies on personal contacts as well as excellent eBay skills. Please view the management section for a more in-depth explanation of Phil’s networking contacts.
5.2 Marketing Strategy
Jerseys will have a marketing strategy that will address both market segments, the children and the adults.
- Advertisements. Placement of ads will be in several different sources, some tailored to adult readers, and a few tailored to children. The ads will be used to develop awareness for Jerseys as an excellent source of famous sport jerseys.
- Sponsorship. Jerseys will sponsor several little league sport leagues as a way of introducing itself to the youngsters.
- Location. The location was chosen to provide a high number of walk-by traffic, so by virtue of the high foot traffic, location is an element of the market plan.
5.3 Sales Strategy
The sales strategy will be geared at displaying the wide variety of jerseys and the constant turnover of inventory encouraging frequent visits by customers. Another sales technique that Jerseys will practice is the willingness to take requests from customers and look for their preferences. This should drive sales as most competitors will not look out for items that the customers may want. Typically, most stores will only purchase what they think will sell without truly soliciting customer input. Not only will this approach drive short term sales by securing the items that customers desire, it will also propel long-term sales by creating loyal customers.
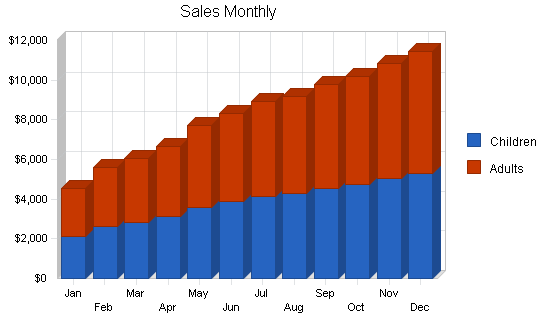
5.3.1 Sales Forecast
The sales forecast indicates that because Jerseys is the purchase of an existing business, sales growth will be small but incremental. Growth within the first couple of months is not expected to be much due to the somewhat slow transition from old business to new business. Once old customers become more familiar with the new owners and new customers become aware of Jerseys, the incremental monthly increase in sales should rise.
| Sales Forecast | |||
| 2003 | 2004 | 2005 | |
| Sales | |||
| Children | $46,160 | $76,259 | $97,731 |
| Adults | $53,058 | $87,654 | $112,334 |
| Total Sales | $99,218 | $163,913 | $210,065 |
| Direct Cost of Sales | 2003 | 2004 | 2005 |
| Cost of Jerseys | $29,766 | $49,174 | $63,019 |
| Other | $0 | $0 | $0 |
| Subtotal Direct Cost of Sales | $29,766 | $49,174 | $63,019 |
5.4 Milestones
- Completion of business plan.
- 100th new customer.
- First month of serious growth.
- Sustainable profit.
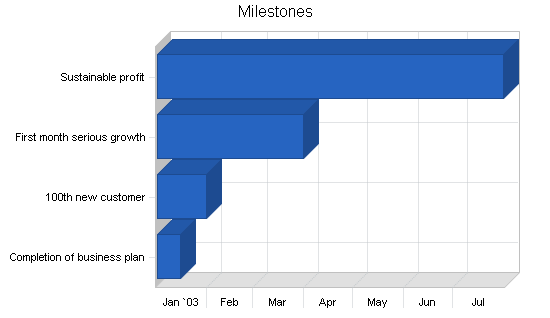
| Milestones | |||||
| Milestone | Start Date | End Date | Budget | Manager | Department |
| Completion of business plan | 1/1/2003 | 1/15/2003 | $0 | Phil | Strategic |
| 100th new customer | 1/1/2003 | 1/31/2003 | $0 | Phil | Marketing |
| First month serious growth | 1/1/2003 | 3/31/2003 | $0 | Phil | Operations |
| Sustainable profit | 1/1/2003 | 7/31/2003 | $0 | Phil | Operations |
| Totals | $0 | ||||
Management Summary
Phil Garment started his sports fanaticism at the young age of nine. That was when he began trading baseball cards. His fascination continued throughout his life, in part from an observational standpoint, in part from a participatory standpoint. Phil enjoyed watching, talking, and playing sports. While Phil was receiving his Bachelors or Arts from Washington & Jefferson College, he played varsity baseball as well as being on the cycling team. After graduation, Phil went to work for one of the premier sports marketing firms in NYC. Phil spent five years at (name omitted) as a support account manager. It was Phil’s responsibility to offer support for the account managers. To some degree this was supporting all promotional activities that were undertaken for the sports professionals. This job also required just looking after the stars ensuring their comfort level. As Phil worked within the organization, he has given increased responsibilities, ultimately being promoted to account manager. This position provided Phil with excellent project management skills, and it also provided him with incredible networking contacts to a host of professional athletes. Phil was in constant contact will all of his clients. Because of his love of the job, he would go out of his way to exceed their satisfaction. As a result of Phil going out of his way to satisfy his clients, he developed long-term friendships with his client athletes who felt like they were indebted to Phil due to all of his hard work.
While Phil enjoyed this work within the sports arena, he recognized his need for more advanced business skills. Consequently, Phil went back to school to earn his MBA at the University of Massachusetts. Upon graduation, Phil was temporarily at a loss as to what type of job he was looking for. He enjoyed his work at the sports marketing firm, yet he longed for more autonomy. At a party a friend mentioned that he should open up his own sport collectible store. Phil’s initially reaction was that it was below him in terms of his skills, education, and experience. After contemplating this thought he realized that it was a perfect job as it challenged his business skills to operate a business, but allowed him to work in the industry that he loves. While in the process of writing a business plan, Phil heard about a gentlemen with a sports jersey collectible shop that was looking to retire. They were able to arrive at a mutually agreeable price and Phil is in the process of continuing Jerseys R Us.
6.1 Personnel Plan
- Phil: marketing, operations and customer service functions.
- Support staff: this will be several part-time employees to help Phil serve customers, track inventory, and find new purchases.
| Personnel Plan | |||
| 2003 | 2004 | 2005 | |
| Phil | $30,000 | $40,000 | $45,000 |
| Support staff | $12,000 | $17,800 | $22,000 |
| Total People | 2 | 2 | 2 |
| Total Payroll | $42,000 | $57,800 | $67,000 |
Financial Plan
The following sections outline important financial information.
7.1 Important Assumptions
The following table details important financial assumptions
| General Assumptions | |||
| 2003 | 2004 | 2005 | |
| Plan Month | 1 | 2 | 3 |
| Current Interest Rate | 10.00% | 10.00% | 10.00% |
| Long-term Interest Rate | 10.00% | 10.00% | 10.00% |
| Tax Rate | 30.00% | 30.00% | 30.00% |
| Other | 0 | 0 | 0 |
7.2 Business Ratios
The following table indicates industry and business specific Business Ratios, based on NAICS code 448190, Clothing Stores offering specialized lines of garments.
| Ratio Analysis | ||||
| 2003 | 2004 | 2005 | Industry Profile | |
| Sales Growth | -10.61% | 65.20% | 28.16% | 5.27% |
| Percent of Total Assets | ||||
| Inventory | 2.53% | 3.79% | 4.14% | 38.34% |
| Other Current Assets | 12.86% | 13.52% | 11.52% | 26.48% |
| Total Current Assets | 41.88% | 50.49% | 60.68% | 88.71% |
| Long-term Assets | 58.12% | 49.51% | 39.32% | 11.29% |
| Total Assets | 100.00% | 100.00% | 100.00% | 100.00% |
| Current Liabilities | 4.07% | 5.80% | 5.83% | 37.92% |
| Long-term Liabilities | 3.75% | 1.89% | 0.31% | 12.86% |
| Total Liabilities | 7.82% | 7.69% | 6.14% | 50.78% |
| Net Worth | 92.18% | 92.31% | 93.86% | 49.22% |
| Percent of Sales | ||||
| Sales | 100.00% | 100.00% | 100.00% | 100.00% |
| Gross Margin | 70.00% | 70.00% | 70.00% | 14.97% |
| Selling, General & Administrative Expenses | 77.62% | 61.65% | 56.25% | 6.56% |
| Advertising Expenses | 0.00% | 0.00% | 0.00% | 1.14% |
| Profit Before Interest and Taxes | -6.60% | 12.55% | 20.13% | 1.32% |
| Main Ratios | ||||
| Current | 10.30 | 8.71 | 10.41 | 2.10 |
| Quick | 9.68 | 8.05 | 9.70 | 0.86 |
| Total Debt to Total Assets | 7.82% | 7.69% | 6.14% | 57.27% |
| Pre-tax Return on Net Worth | -5.40% | 13.14% | 23.15% | 4.00% |
| Pre-tax Return on Assets | -4.98% | 12.13% | 21.73% | 9.36% |
| Additional Ratios | 2003 | 2004 | 2005 | |
| Net Profit Margin | -7.49% | 8.50% | 13.96% | n.a |
| Return on Equity | -5.40% | 9.19% | 16.21% | n.a |
| Activity Ratios | ||||
| Inventory Turnover | 1.64 | 9.83 | 8.87 | n.a |
| Accounts Payable Turnover | 7.98 | 12.17 | 12.17 | n.a |
| Payment Days | 41 | 23 | 27 | n.a |
| Total Asset Turnover | 0.66 | 1.00 | 1.09 | n.a |
| Debt Ratios | ||||
| Debt to Net Worth | 0.08 | 0.08 | 0.07 | n.a |
| Current Liab. to Liab. | 0.52 | 0.75 | 0.95 | n.a |
| Liquidity Ratios | ||||
| Net Working Capital | $56,463 | $73,403 | $105,726 | n.a |
| Interest Coverage | -7.35 | 31.40 | 104.43 | n.a |
| Additional Ratios | ||||
| Assets to Sales | 1.51 | 1.00 | 0.92 | n.a |
| Current Debt/Total Assets | 4% | 6% | 6% | n.a |
| Acid Test | 9.68 | 8.05 | 9.70 | n.a |
| Sales/Net Worth | 0.72 | 1.08 | 1.16 | n.a |
| Dividend Payout | 0.00 | 0.00 | 0.00 | n.a |
7.3 Break-even Analysis
The Break-even Analysis indicates what will be needed in monthly revenue to reach the break-even point.

| Break-even Analysis | |
| Monthly Revenue Break-even | $9,047 |
| Assumptions: | |
| Average Percent Variable Cost | 30% |
| Estimated Monthly Fixed Cost | $6,333 |
7.4 Projected Profit and Loss
The following table and charts project Profit and Loss.


| Pro Forma Profit and Loss | |||
| 2003 | 2004 | 2005 | |
| Sales | $99,218 | $163,913 | $210,065 |
| Direct Cost of Sales | $29,766 | $49,174 | $63,019 |
| Other Costs of Goods | $0 | $0 | $0 |
| Total Cost of Sales | $29,766 | $49,174 | $63,019 |
| Gross Margin | $69,453 | $114,739 | $147,045 |
| Gross Margin % | 70.00% | 70.00% | 70.00% |
| Expenses | |||
| Payroll | $42,000 | $57,800 | $67,000 |
| Sales and Marketing and Other Expenses | $3,000 | $3,000 | $3,000 |
| Depreciation | $5,497 | $5,500 | $5,500 |
| Rent | $10,800 | $10,800 | $10,800 |
| Utilities | $5,400 | $5,400 | $5,400 |
| Insurance | $3,000 | $3,000 | $3,000 |
| Payroll Taxes | $6,300 | $8,670 | $10,050 |
| Other | $0 | $0 | $0 |
| Total Operating Expenses | $75,997 | $94,170 | $104,750 |
| Profit Before Interest and Taxes | ($6,544) | $20,569 | $42,295 |
| EBITDA | ($1,047) | $26,069 | $47,795 |
| Interest Expense | $890 | $655 | $405 |
| Taxes Incurred | $0 | $5,974 | $12,567 |
| Net Profit | ($7,434) | $13,940 | $29,323 |
| Net Profit/Sales | -7.49% | 8.50% | 13.96% |
7.5 Projected Cash Flow
The following table and chart present Projected Cash Flow. Please note that there is a new investment received in January. This was an investment that Phil made into the business. Please also note a significant charge listed in January under purchase of long-term assets, the cost of buying out the lease and the existing business.

| Pro Forma Cash Flow | |||
| 2003 | 2004 | 2005 | |
| Cash Received | |||
| Cash from Operations | |||
| Cash Sales | $99,218 | $163,913 | $210,065 |
| Subtotal Cash from Operations | $99,218 | $163,913 | $210,065 |
| Additional Cash Received | |||
| Sales Tax, VAT, HST/GST Received | $0 | $0 | $0 |
| New Current Borrowing | $0 | $0 | $0 |
| New Other Liabilities (interest-free) | $0 | $0 | $0 |
| New Long-term Liabilities | $0 | $0 | $0 |
| Sales of Other Current Assets | $0 | $0 | $0 |
| Sales of Long-term Assets | $0 | $0 | $0 |
| New Investment Received | $85,000 | $0 | $0 |
| Subtotal Cash Received | $184,218 | $163,913 | $210,065 |
| Expenditures | 2003 | 2004 | 2005 |
| Expenditures from Operations | |||
| Cash Spending | $42,000 | $57,800 | $67,000 |
| Bill Payments | $42,054 | $85,680 | $108,281 |
| Subtotal Spent on Operations | $84,054 | $143,480 | $175,281 |
| Additional Cash Spent | |||
| Sales Tax, VAT, HST/GST Paid Out | $0 | $0 | $0 |
| Principal Repayment of Current Borrowing | $0 | $0 | $0 |
| Other Liabilities Principal Repayment | $0 | $0 | $0 |
| Long-term Liabilities Principal Repayment | $2,400 | $2,500 | $2,500 |
| Purchase Other Current Assets | $1,200 | $3,000 | $0 |
| Purchase Long-term Assets | $65,000 | $0 | $0 |
| Dividends | $0 | $0 | $0 |
| Subtotal Cash Spent | $152,654 | $148,980 | $177,781 |
| Net Cash Flow | $31,565 | $14,933 | $32,284 |
| Cash Balance | $39,565 | $54,498 | $86,781 |
7.6 Projected Balance Sheet
The following table displays the Projected Balance Sheet.
| Pro Forma Balance Sheet | |||
| 2003 | 2004 | 2005 | |
| Assets | |||
| Current Assets | |||
| Cash | $39,565 | $54,498 | $86,781 |
| Inventory | $3,772 | $6,231 | $7,985 |
| Other Current Assets | $19,200 | $22,200 | $22,200 |
| Total Current Assets | $62,537 | $82,929 | $116,967 |
| Long-term Assets | |||
| Long-term Assets | $99,000 | $99,000 | $99,000 |
| Accumulated Depreciation | $12,197 | $17,697 | $23,197 |
| Total Long-term Assets | $86,803 | $81,303 | $75,803 |
| Total Assets | $149,340 | $164,232 | $192,770 |
| Liabilities and Capital | 2003 | 2004 | 2005 |
| Current Liabilities | |||
| Accounts Payable | $3,874 | $7,326 | $9,041 |
| Current Borrowing | $2,200 | $2,200 | $2,200 |
| Other Current Liabilities | $0 | $0 | $0 |
| Subtotal Current Liabilities | $6,074 | $9,526 | $11,241 |
| Long-term Liabilities | $5,600 | $3,100 | $600 |
| Total Liabilities | $11,674 | $12,626 | $11,841 |
| Paid-in Capital | $85,000 | $85,000 | $85,000 |
| Retained Earnings | $60,100 | $52,666 | $66,606 |
| Earnings | ($7,434) | $13,940 | $29,323 |
| Total Capital | $137,666 | $151,606 | $180,929 |
| Total Liabilities and Capital | $149,340 | $164,232 | $192,770 |
| Net Worth | $137,666 | $151,606 | $180,929 |
Appendix
| Sales Forecast | |||||||||||||
| Jan | Feb | Mar | Apr | May | Jun | Jul | Aug | Sep | Oct | Nov | Dec | ||
| Sales | |||||||||||||
| Children | 0% | $2,116 | $2,600 | $2,821 | $3,102 | $3,585 | $3,875 | $4,147 | $4,271 | $4,544 | $4,747 | $5,035 | $5,317 |
| Adults | 0% | $2,432 | $2,989 | $3,243 | $3,565 | $4,121 | $4,454 | $4,767 | $4,909 | $5,223 | $5,456 | $5,787 | $6,112 |
| Total Sales | $4,548 | $5,589 | $6,064 | $6,667 | $7,706 | $8,329 | $8,914 | $9,180 | $9,767 | $10,203 | $10,822 | $11,429 | |
| Direct Cost of Sales | Jan | Feb | Mar | Apr | May | Jun | Jul | Aug | Sep | Oct | Nov | Dec | |
| Cost of Jerseys | $1,364 | $1,677 | $1,819 | $2,000 | $2,312 | $2,499 | $2,674 | $2,754 | $2,930 | $3,061 | $3,247 | $3,429 | |
| Other | $0 | $0 | $0 | $0 | $0 | $0 | $0 | $0 | $0 | $0 | $0 | $0 | |
| Subtotal Direct Cost of Sales | $1,364 | $1,677 | $1,819 | $2,000 | $2,312 | $2,499 | $2,674 | $2,754 | $2,930 | $3,061 | $3,247 | $3,429 | |
| Personnel Plan | |||||||||||||
| Jan | Feb | Mar | Apr | May | Jun | Jul | Aug | Sep | Oct | Nov | Dec | ||
| Phil | 0% | $2,500 | $2,500 | $2,500 | $2,500 | $2,500 | $2,500 | $2,500 | $2,500 | $2,500 | $2,500 | $2,500 | $2,500 |
| Support staff | 0% | $0 | $0 | $1,200 | $1,200 | $1,200 | $1,200 | $1,200 | $1,200 | $1,200 | $1,200 | $1,200 | $1,200 |
| Total People | 0 | 0 | 2 | 2 | 2 | 2 | 2 | 2 | 2 | 2 | 2 | 2 | |
| Total Payroll | $2,500 | $2,500 | $3,700 | $3,700 | $3,700 | $3,700 | $3,700 | $3,700 | $3,700 | $3,700 | $3,700 | $3,700 | |
| General Assumptions | |||||||||||||
| Jan | Feb | Mar | Apr | May | Jun | Jul | Aug | Sep | Oct | Nov | Dec | ||
| Plan Month | 1 | 2 | 3 | 4 | 5 | 6 | 7 | 8 | 9 | 10 | 11 | 12 | |
| Current Interest Rate | 10.00% | 10.00% | 10.00% | 10.00% | 10.00% | 10.00% | 10.00% | 10.00% | 10.00% | 10.00% | 10.00% | 10.00% | |
| Long-term Interest Rate | 10.00% | 10.00% | 10.00% | 10.00% | 10.00% | 10.00% | 10.00% | 10.00% | 10.00% | 10.00% | 10.00% | 10.00% | |
| Tax Rate | 30.00% | 30.00% | 30.00% | 30.00% | 30.00% | 30.00% | 30.00% | 30.00% | 30.00% | 30.00% | 30.00% | 30.00% | |
| Other | 0 | 0 | 0 | 0 | 0 | 0 | 0 | 0 | 0 | 0 | 0 | 0 | |
| Pro Forma Profit and Loss | |||||||||||||
| Jan | Feb | Mar | Apr | May | Jun | Jul | Aug | Sep | Oct | Nov | Dec | ||
| Sales | $4,548 | $5,589 | $6,064 | $6,667 | $7,706 | $8,329 | $8,914 | $9,180 | $9,767 | $10,203 | $10,822 | $11,429 | |
| Direct Cost of Sales | $1,364 | $1,677 | $1,819 | $2,000 | $2,312 | $2,499 | $2,674 | $2,754 | $2,930 | $3,061 | $3,247 | $3,429 | |
| Other Costs of Goods | $0 | $0 | $0 | $0 | $0 | $0 | $0 | $0 | $0 | $0 | $0 | $0 | |
| Total Cost of Sales | $1,364 | $1,677 | $1,819 | $2,000 | $2,312 | $2,499 | $2,674 | $2,754 | $2,930 | $3,061 | $3,247 | $3,429 | |
| Gross Margin | $3,183 | $3,913 | $4,245 | $4,667 | $5,394 | $5,830 | $6,240 | $6,426 | $6,837 | $7,142 | $7,575 | $8,001 | |
| Gross Margin % | 70.00% | 70.00% | 70.00% | 70.00% | 70.00% | 70.00% | 70.00% | 70.00% | 70.00% | 70.00% | 70.00% | 70.00% | |
| Expenses | |||||||||||||
| Payroll | $2,500 | $2,500 | $3,700 | $3,700 | $3,700 | $3,700 | $3,700 | $3,700 | $3,700 | $3,700 | $3,700 | $3,700 | |
| Sales and Marketing and Other Expenses | $250 | $250 | $250 | $250 | $250 | $250 | $250 | $250 | $250 | $250 | $250 | $250 | |
| Depreciation | $458 | $458 | $458 | $458 | $458 | $458 | $458 | $458 | $458 | $458 | $458 | $459 | |
| Rent | $900 | $900 | $900 | $900 | $900 | $900 | $900 | $900 | $900 | $900 | $900 | $900 | |
| Utilities | $450 | $450 | $450 | $450 | $450 | $450 | $450 | $450 | $450 | $450 | $450 | $450 | |
| Insurance | $250 | $250 | $250 | $250 | $250 | $250 | $250 | $250 | $250 | $250 | $250 | $250 | |
| Payroll Taxes | 15% | $375 | $375 | $555 | $555 | $555 | $555 | $555 | $555 | $555 | $555 | $555 | $555 |
| Other | $0 | $0 | $0 | $0 | $0 | $0 | $0 | $0 | $0 | $0 | $0 | $0 | |
| Total Operating Expenses | $5,183 | $5,183 | $6,563 | $6,563 | $6,563 | $6,563 | $6,563 | $6,563 | $6,563 | $6,563 | $6,563 | $6,564 | |
| Profit Before Interest and Taxes | ($2,000) | ($1,270) | ($2,318) | ($1,896) | ($1,169) | ($733) | ($323) | ($137) | $274 | $579 | $1,012 | $1,437 | |
| EBITDA | ($1,542) | ($812) | ($1,860) | ($1,438) | ($711) | ($275) | $135 | $321 | $732 | $1,037 | $1,470 | $1,896 | |
| Interest Expense | $83 | $82 | $80 | $78 | $77 | $75 | $73 | $72 | $70 | $68 | $67 | $65 | |
| Taxes Incurred | $0 | $0 | $0 | $0 | $0 | $0 | $0 | $0 | $0 | $0 | $0 | $0 | |
| Net Profit | ($2,083) | ($1,352) | ($2,398) | ($1,975) | ($1,245) | ($808) | ($396) | ($209) | $204 | $511 | $946 | $1,372 | |
| Net Profit/Sales | -45.80% | -24.19% | -39.54% | -29.62% | -16.16% | -9.70% | -4.45% | -2.27% | 2.09% | 5.00% | 8.74% | 12.00% | |
| Pro Forma Cash Flow | |||||||||||||
| Jan | Feb | Mar | Apr | May | Jun | Jul | Aug | Sep | Oct | Nov | Dec | ||
| Cash Received | |||||||||||||
| Cash from Operations | |||||||||||||
| Cash Sales | $4,548 | $5,589 | $6,064 | $6,667 | $7,706 | $8,329 | $8,914 | $9,180 | $9,767 | $10,203 | $10,822 | $11,429 | |
| Subtotal Cash from Operations | $4,548 | $5,589 | $6,064 | $6,667 | $7,706 | $8,329 | $8,914 | $9,180 | $9,767 | $10,203 | $10,822 | $11,429 | |
| Additional Cash Received | |||||||||||||
| Sales Tax, VAT, HST/GST Received | 0.00% | $0 | $0 | $0 | $0 | $0 | $0 | $0 | $0 | $0 | $0 | $0 | $0 |
| New Current Borrowing | $0 | $0 | $0 | $0 | $0 | $0 | $0 | $0 | $0 | $0 | $0 | $0 | |
| New Other Liabilities (interest-free) | $0 | $0 | $0 | $0 | $0 | $0 | $0 | $0 | $0 | $0 | $0 | $0 | |
| New Long-term Liabilities | $0 | $0 | $0 | $0 | $0 | $0 | $0 | $0 | $0 | $0 | $0 | $0 | |
| Sales of Other Current Assets | $0 | $0 | $0 | $0 | $0 | $0 | $0 | $0 | $0 | $0 | $0 | $0 | |
| Sales of Long-term Assets | $0 | $0 | $0 | $0 | $0 | $0 | $0 | $0 | $0 | $0 | $0 | $0 | |
| New Investment Received | $85,000 | $0 | $0 | $0 | $0 | $0 | $0 | $0 | $0 | $0 | $0 | $0 | |
| Subtotal Cash Received | $89,548 | $5,589 | $6,064 | $6,667 | $7,706 | $8,329 | $8,914 | $9,180 | $9,767 | $10,203 | $10,822 | $11,429 | |
| Expenditures | Jan | Feb | Mar | Apr | May | Jun | Jul | Aug | Sep | Oct | Nov | Dec | |
| Expenditures from Operations | |||||||||||||
| Cash Spending | $2,500 | $2,500 | $3,700 | $3,700 | $3,700 | $3,700 | $3,700 | $3,700 | $3,700 | $3,700 | $3,700 | $3,700 | |
| Bill Payments | $15,077 | $2,308 | $2,313 | $2,485 | $2,483 | $2,482 | $2,480 | $2,478 | $2,477 | $2,475 | $2,473 | $2,523 | |
| Subtotal Spent on Operations | $17,577 | $4,808 | $6,013 | $6,185 | $6,183 | $6,182 | $6,180 | $6,178 | $6,177 | $6,175 | $6,173 | $6,223 | |
| Additional Cash Spent | |||||||||||||
| Sales Tax, VAT, HST/GST Paid Out | $0 | $0 | $0 | $0 | $0 | $0 | $0 | $0 | $0 | $0 | $0 | $0 | |
| Principal Repayment of Current Borrowing | $0 | $0 | $0 | $0 | $0 | $0 | $0 | $0 | $0 | $0 | $0 | $0 | |
| Other Liabilities Principal Repayment | $0 | $0 | $0 | $0 | $0 | $0 | $0 | $0 | $0 | $0 | $0 | $0 | |
| Long-term Liabilities Principal Repayment | $200 | $200 | $200 | $200 | $200 | $200 | $200 | $200 | $200 | $200 | $200 | $200 | |
| Purchase Other Current Assets | $0 | $0 | $0 | $0 | $400 | $0 | $0 | $300 | $0 | $500 | $0 | $0 | |
| Purchase Long-term Assets | $65,000 | $0 | $0 | $0 | $0 | $0 | $0 | $0 | $0 | $0 | $0 | $0 | |
| Dividends | $0 | $0 | $0 | $0 | $0 | $0 | $0 | $0 | $0 | $0 | $0 | $0 | |
| Subtotal Cash Spent | $82,777 | $5,008 | $6,213 | $6,385 | $6,783 | $6,382 | $6,380 | $6,678 | $6,377 | $6,875 | $6,373 | $6,423 | |
| Net Cash Flow | $6,771 | $581 | ($148) | $282 | $923 | $1,947 | $2,534 | $2,502 | $3,390 | $3,328 | $4,448 | $5,007 | |
| Cash Balance | $14,771 | $15,352 | $15,204 | $15,485 | $16,408 | $18,356 | $20,890 | $23,392 | $26,782 | $30,110 | $34,558 | $39,565 | |
| Pro Forma Balance Sheet | |||||||||||||
| Jan | Feb | Mar | Apr | May | Jun | Jul | Aug | Sep | Oct | Nov | Dec | ||
| Assets | Starting Balances | ||||||||||||
| Current Assets | |||||||||||||
| Cash | $8,000 | $14,771 | $15,352 | $15,204 | $15,485 | $16,408 | $18,356 | $20,890 | $23,392 | $26,782 | $30,110 | $34,558 | $39,565 |
| Inventory | $32,000 | $30,636 | $28,959 | $27,139 | $25,140 | $22,828 | $20,329 | $17,655 | $14,901 | $11,971 | $8,910 | $5,663 | $3,772 |
| Other Current Assets | $18,000 | $18,000 | $18,000 | $18,000 | $18,000 | $18,400 | $18,400 | $18,400 | $18,700 | $18,700 | $19,200 | $19,200 | $19,200 |
| Total Current Assets | $58,000 | $63,407 | $62,311 | $60,343 | $58,625 | $57,636 | $57,085 | $56,945 | $56,992 | $57,453 | $58,220 | $59,422 | $62,537 |
| Long-term Assets | |||||||||||||
| Long-term Assets | $34,000 | $99,000 | $99,000 | $99,000 | $99,000 | $99,000 | $99,000 | $99,000 | $99,000 | $99,000 | $99,000 | $99,000 | $99,000 |
| Accumulated Depreciation | $6,700 | $7,158 | $7,616 | $8,074 | $8,532 | $8,990 | $9,448 | $9,906 | $10,364 | $10,822 | $11,280 | $11,738 | $12,197 |
| Total Long-term Assets | $27,300 | $91,842 | $91,384 | $90,926 | $90,468 | $90,010 | $89,552 | $89,094 | $88,636 | $88,178 | $87,720 | $87,262 | $86,803 |
| Total Assets | $85,300 | $155,249 | $153,695 | $151,269 | $149,093 | $147,646 | $146,637 | $146,039 | $145,628 | $145,631 | $145,940 | $146,684 | $149,340 |
| Liabilities and Capital | Jan | Feb | Mar | Apr | May | Jun | Jul | Aug | Sep | Oct | Nov | Dec | |
| Current Liabilities | |||||||||||||
| Accounts Payable | $15,000 | $2,231 | $2,230 | $2,402 | $2,401 | $2,399 | $2,397 | $2,396 | $2,394 | $2,392 | $2,391 | $2,389 | $3,874 |
| Current Borrowing | $2,200 | $2,200 | $2,200 | $2,200 | $2,200 | $2,200 | $2,200 | $2,200 | $2,200 | $2,200 | $2,200 | $2,200 | $2,200 |
| Other Current Liabilities | $0 | $0 | $0 | $0 | $0 | $0 | $0 | $0 | $0 | $0 | $0 | $0 | $0 |
| Subtotal Current Liabilities | $17,200 | $4,431 | $4,430 | $4,602 | $4,601 | $4,599 | $4,597 | $4,596 | $4,594 | $4,592 | $4,591 | $4,589 | $6,074 |
| Long-term Liabilities | $8,000 | $7,800 | $7,600 | $7,400 | $7,200 | $7,000 | $6,800 | $6,600 | $6,400 | $6,200 | $6,000 | $5,800 | $5,600 |
| Total Liabilities | $25,200 | $12,231 | $12,030 | $12,002 | $11,801 | $11,599 | $11,397 | $11,196 | $10,994 | $10,792 | $10,591 | $10,389 | $11,674 |
| Paid-in Capital | $0 | $85,000 | $85,000 | $85,000 | $85,000 | $85,000 | $85,000 | $85,000 | $85,000 | $85,000 | $85,000 | $85,000 | $85,000 |
| Retained Earnings | $60,100 | $60,100 | $60,100 | $60,100 | $60,100 | $60,100 | $60,100 | $60,100 | $60,100 | $60,100 | $60,100 | $60,100 | $60,100 |
| Earnings | $0 | ($2,083) | ($3,435) | ($5,833) | ($7,808) | ($9,053) | ($9,861) | ($10,257) | ($10,466) | ($10,262) | ($9,751) | ($8,806) | ($7,434) |
| Total Capital | $60,100 | $143,017 | $141,665 | $139,267 | $137,292 | $136,047 | $135,239 | $134,843 | $134,634 | $134,838 | $135,349 | $136,294 | $137,666 |
| Total Liabilities and Capital | $85,300 | $155,249 | $153,695 | $151,269 | $149,093 | $147,646 | $146,637 | $146,039 | $145,628 | $145,631 | $145,940 | $146,684 | $149,340 |
| Net Worth | $60,100 | $143,017 | $141,665 | $139,267 | $137,292 | $136,047 | $135,239 | $134,843 | $134,634 | $134,838 | $135,349 | $136,294 | $137,666 |


