
Velocipede / Snowpede Borrow Bank
Executive Summary
Velocipede/Snowpede Borrow Bank (VS) is a Eugene, OR based rental company specializing in bicycles and snowshoes. VS will offer road, mountain, and tandem bicycles for rent as well as a variety of sizes of snowshoes. Bicycles will be the primary source of revenue from April through November. Once the rains come into the Willamette valley and snow falls upon the Cascade Mountains, the revenue source will switch from bicycles to snowshoes. For both bicycles and snowshoes, Velocipede/Snowpede will supply each customer with a detailed map/trip log which the customer will be able to follow, showing them incredible hiking and biking trails. Eugene is ideal for these types of activities because of it’s enthusiastic cycling population, and proximity to the Cascade Mt. range.
While Eugene has several rental stores for bicycles and snowshoes, their primary line of businesses is retail, with rentals as an ancillary distraction. VS will leverage their superior customer service to steadily gain market share and will reach profitability by month nine and achieve $150,000 in revenue in year two.

1.1 Objectives
The objectives for the first three years of operation include:
- To create a service-based company whose primary goal is to exceed customer’s expectations.
- To increase the number of clients served by 20% per year through superior performance.
- To develop a sustainable start-up business surviving off of its own cash flow.
1.2 Mission
Velocipede/Snowpede Borrow Bank’s mission is to provide customers with bicycle and snowshoe rentals as well as suggested journeys. We exist to attract and maintain customers. When we adhere to this maxim, everything else will fall into place. Our services will exceed the expectations of our customers.
Company Summary
Velocipede/Snowpede Borrow Bank is a bicycle rental company operating in Eugene, OR. VS rents road bikes, mountain bikes, and tandems (two person bicycles) as well as snowshoes. In addition to providing rental equipment, VS offers detailed maps which indicate suggested rides/hikes. While there are other companies that offer rentals, none have as large a selection or as detailed a trail system.
2.1 Start-up Summary
Velocipede/Snowpede Borrow Bank will incur the following start-up costs:
- Three tandems, seven road bikes, 10 mountain bikes (five rigid bikes, five suspension bikes). GT will be the manufacturer of the road and mountain bicycles. KHS will manufacture the tandems.
- Two repair stands and all of the necessary assorted tools. The stands and tools will be manufactured by Park.
- Twenty pairs of snowshoes of assorted sizes (different sizes have different weight capacities as well as different floatation capacities for varying depths of snow).
- Twenty pairs of trekking poles.
- A computer with a POS terminal and software.
- A back-end computer with CD-RW and printer.
- Fax machine and copier.
- Counters and shelving units.
- Office desk and chair.
Please note that the following items which are considered assets to be used for more than a year will be labeled long-term assets and will be depreciated using G.A.A.P. approved straight line depreciation method.

| Start-up | |
| Requirements | |
| Start-up Expenses | |
| Legal | $1,000 |
| Stationary | $200 |
| Expensed Equipment | $0 |
| Other | $0 |
| Total Start-up Expenses | $1,200 |
| Start-up Assets | |
| Cash Required | $24,900 |
| Other Current Assets | $0 |
| Long-term Assets | $25,900 |
| Total Assets | $50,800 |
| Total Requirements | $52,000 |
| Start-up Funding | |
| Start-up Expenses to Fund | $1,200 |
| Start-up Assets to Fund | $50,800 |
| Total Funding Required | $52,000 |
| Assets | |
| Non-cash Assets from Start-up | $25,900 |
| Cash Requirements from Start-up | $24,900 |
| Additional Cash Raised | $0 |
| Cash Balance on Starting Date | $24,900 |
| Total Assets | $50,800 |
| Liabilities and Capital | |
| Liabilities | |
| Current Borrowing | $0 |
| Long-term Liabilities | $0 |
| Accounts Payable (Outstanding Bills) | $0 |
| Other Current Liabilities (interest-free) | $0 |
| Total Liabilities | $0 |
| Capital | |
| Planned Investment | |
| Investor 1 | $52,000 |
| Investor 2 | $0 |
| Other | $0 |
| Additional Investment Requirement | $0 |
| Total Planned Investment | $52,000 |
| Loss at Start-up (Start-up Expenses) | ($1,200) |
| Total Capital | $50,800 |
| Total Capital and Liabilities | $50,800 |
| Total Funding | $52,000 |
2.2 Company Ownership
Velocipede/Snowpede Borrow Bank is a privately held Oregon corporation owned entirely by Dan Jalopee.
Services
Velocipede/Snowpede Borrow Bank offers a rental service for a variety of bicycles as well as snowshoes and poles. In addition to the rental of the equipment, VS offers detailed maps of suggested rides and hikes. Eugene’s biker friendly attitude and unique landscape provides numerous challenging road rides for the enthusiastic cycler. It’s proximity to several mt. ranges also draws a lot of mt. bikers to the area in search of some off road adventure.
A large deposit will be taken with cash or a hold of funds with a credit card to discourage theft. It is common to have theft occur when there is either no deposit or the deposit is small.
Eugene also has two different roads that head up into the Cascades. There are many different areas directly off the roads that are wonderful areas for snowshoeing.
Market Analysis Summary
VS has two distinct groups of customers: local customers and tourists . While many of the media forms that VS will use to advertise will reach both groups, there are some sources that will be used specifically to target the tourists.
VS faces competition from local retail outlets that also have rentals. These shops tend to concentrate on the retail side and consequently do not offer the appropriate level of customer service support for the rentals.
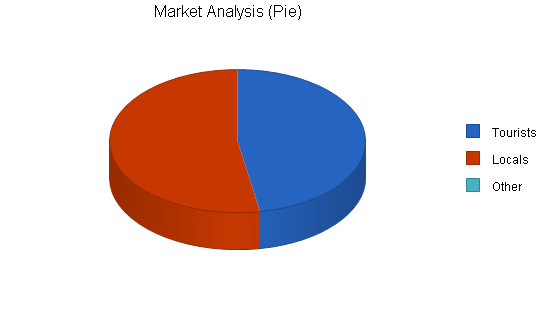
4.1 Market Segmentation
Velocipede/Snowpede Borrow Bank will target two distinct market segments:
- Tourists- These people are passing through Eugene and are either cycling enthusiasts without bikes or visitors who would like to try cycling.
- Locals- This group of people lives in Eugene and would like to try cycling/snowshoeing so they will go to a rental facility and rent the equipment. There will be a larger percentage of locals renting snowshoes than bicycles. This is primarily because snowshoes are more unusual and it less common for people to own their own snowshoes than for people to own their own bicycle.
| Market Analysis | |||||||
| Year 1 | Year 2 | Year 3 | Year 4 | Year 5 | |||
| Potential Customers | Growth | CAGR | |||||
| Tourists | 9% | 35,645 | 38,853 | 42,350 | 46,162 | 50,317 | 9.00% |
| Locals | 9% | 39,854 | 43,441 | 47,351 | 51,613 | 56,258 | 9.00% |
| Other | 0% | 0 | 0 | 0 | 0 | 0 | 0.00% |
| Total | 9.00% | 75,499 | 82,294 | 89,701 | 97,775 | 106,575 | 9.00% |
4.2 Target Market Segment Strategy
Velocipede/Snowpede Borrow Bank will have a different strategy to communicate with different target groups. The tourists will be targeted through advertisements published in Chamber of Commerce publications that are released specifically for visitors.
Locals will be targeted through advertisements in the local outdoor free-journal that tracks outdoor activities in Eugene. In addition to these advertisements, VS will have an ad in the Yellow pages as well as information on the website.
4.2.1 Competition and Buying Patterns
Currently, there are three different retail bicycle shops that rent bicycles and four different retailers that rent snowshoes.
The typical buying patterns of customers is to call different bicycle/outdoor shops and ask who rents equipment. Convenience and availability are the typical variables that customers are concerned with.
Strategy and Implementation Summary
All employees will be trained in customer service, ensuring that the competitive edge is bred throughout the organization.
5.1 Competitive Edge
VS’s competitive advantage is excellent customer service. This attention to service begins with answering any questions during the initial phone inquiry. The concentration continues when fitting the bicycle and explaining different features. Most rental places very briefly go over the features of the bicycle/snowshoes. Their view point is the faster they can move onto the next customer, the more money they can generate. VS sees helping the customer as an opportunity to impress them and encourage repeat business.

VS’s employees are trained to explain all the necessary features of the rental products. This takes time but the customer leaves with the impression that they have been fully trained in the equipment they are using. This will leave the customer impressed with the level of attention that they have received.
5.2 Sales Strategy
The Sales Strategy of VS is to try turning information gatherers into customers through outstanding customer attention. Generally, anyone that enters into the shop will likely end up renting the gear. The reason for this is that the cost of the rental is not all that significant so if people have made the effort to come to the shop, unless availability is a problem, they will almost always end up renting the gear. With this said, it is very important to impress the customers while they are on the phone inquiring about the services offered. This can be done at a basic level of tone and helpfulness of the employee on the phone. The other way this can be achieved is by communicating the additional perks that customers would receive: detailed maps of local rides/hikes.
All employees will be trained prior and during employment, ensuring that they are delivering the proper level of service to customers.
5.2.1 Sales Forecast
The first month will be used to set up the store-front and train the employees. During the end of the first month and during the second month the rental fleet of bicycles will assembled. There might be a few rentals of bikes, but the majority of the sales will be from the rental of snowshoes. Sales will incrementally increase each month. Revenue will switch from snowshoes to bicycles around April and back in November.
It is forecasted that the busiest month during the winter will not be as high as busy months for the bicycles in the summer. This is due to the incredible popularity of bicycles as well as the basic fact that bicycles rent for more money and this translates into higher revenue.
The snowshoes will be rented as a way to eliminate the seasonal nature of a bicycle rental facility. It provides stability and revenue during the down season. Additionally, snowshoes are very easy to maintain as rentals as there is virtually no maintenance required.


| Sales Forecast | |||
| Year 1 | Year 2 | Year 3 | |
| Sales | |||
| Tourists | $65,044 | $96,547 | $102,458 |
| Locals | $35,800 | $54,545 | $59,014 |
| Total Sales | $100,844 | $151,092 | $161,472 |
| Direct Cost of Sales | Year 1 | Year 2 | Year 3 |
| Tourists | $3,252 | $4,827 | $5,123 |
| Locals | $1,790 | $2,727 | $2,951 |
| Subtotal Direct Cost of Sales | $5,042 | $7,555 | $8,074 |
5.3 Milestones
VS will have several milestones early on:
- Business plan completion. This will be done as a roadmap for the organization; It will be an indispensable tool for the ongoing performance and improvement of the company.
- Store set up.
- Training programs developed.
- Profitability.
| Milestones | |||||
| Milestone | Start Date | End Date | Budget | Manager | Department |
| Business plan completion | 1/1/2001 | 2/1/2001 | $0 | ABC | Marketing |
| Store set up | 1/1/2001 | 2/1/2001 | $0 | ABC | Department |
| Training programs developed | 1/1/2001 | 2/1/2001 | $0 | ABC | Department |
| Profitability | 1/1/2001 | 10/1/2001 | $0 | ABC | Department |
| Totals | $0 | ||||
Management Summary
Dan Jalopee received his his Bachelor of Arts from Colorado College. This is also where he had his first experience in the bike industry, by working as a mechanic in a local shop.
Upon graduation, Dan was unsure about his future. He figured at some point that he would go to graduate school as his philosophy major would not be very helpful in securing him a job. He was offered the opportunity to continue working at the bicycle shop full time and he accepted it. It only took him four months before he was promoted to manager. While manager, Dan ran every facet of the company. An advantage of working at the bike shop was the ability to take a few months off during the winter to travel. Since Dan worked in Colorado, it was only natural that he picked up snowshoeing. Dan had been running for the last few years and decided to pick up snowshoe racing since he had the fitness level, was in the right geographic region, and had time off during the winter. Snowshoe races were in their infancy and just beginning to get popular. After doing well in a few races he picked up sponsorship from Redfeather snowshoes, a Leadville based manufacturer. It was through this racing and sponsorship that Dan developed a good working relationship with Redfeather which he would eventually leverage for Velocipede/Snowpede.
Dan managed the bicycle shop for three years before he began to get restless. During these last few years Dan had picked up the majority of skills needed to operate a business. He was however, growing tired of working for someone else. Dan finally came to the conclusion that he needed to open up his own business. After a lot of research, he settled on the rental business, primarily bicycles with snowshoes in the winter. Dan chose Eugene as it was famous for its cycling.
6.1 Personnel Plan
Dan will be working full time for VS. During the second month Dan will hire one full-time employee to help out in the store. This employee will initially be working the store-front as well as getting the bicycles ready for the upcoming season. In April, Dan will hire two additional employees. These employees will be seasonal and will remain with VS until the beginning of November when they will be released.
| Personnel Plan | |||
| Year 1 | Year 2 | Year 3 | |
| Dan | $36,000 | $36,000 | $36,000 |
| Full-time employee | $16,500 | $18,000 | $18,000 |
| Full-time employee | $12,000 | $12,000 | $12,000 |
| Full-time employee | $12,000 | $12,000 | $12,000 |
| Total People | 2 | 4 | 4 |
| Total Payroll | $76,500 | $78,000 | $78,000 |
Financial Plan
The following sections will outline important financial information.
7.1 Important Assumptions
The following table details important financial assumptions.
| General Assumptions | |||
| Year 1 | Year 2 | Year 3 | |
| Plan Month | 1 | 2 | 3 |
| Current Interest Rate | 10.00% | 10.00% | 10.00% |
| Long-term Interest Rate | 10.00% | 10.00% | 10.00% |
| Tax Rate | 30.00% | 30.00% | 30.00% |
| Other | 0 | 0 | 0 |
7.2 Break-even Analysis
The Break-even Analysis below indicates our break-even point.

| Break-even Analysis | |
| Monthly Revenue Break-even | $10,435 |
| Assumptions: | |
| Average Percent Variable Cost | 5% |
| Estimated Monthly Fixed Cost | $9,913 |
7.3 Projected Profit and Loss
The following table will indicate projected profit and loss.


| Pro Forma Profit and Loss | |||
| Year 1 | Year 2 | Year 3 | |
| Sales | $100,844 | $151,092 | $161,472 |
| Direct Cost of Sales | $5,042 | $7,555 | $8,074 |
| Other Production Expenses | $0 | $0 | $0 |
| Total Cost of Sales | $5,042 | $7,555 | $8,074 |
| Gross Margin | $95,802 | $143,537 | $153,398 |
| Gross Margin % | 95.00% | 95.00% | 95.00% |
| Expenses | |||
| Payroll | $76,500 | $78,000 | $78,000 |
| Sales and Marketing and Other Expenses | $4,200 | $4,200 | $4,200 |
| Depreciation | $5,184 | $5,184 | $5,184 |
| Utilities | $1,200 | $1,200 | $1,200 |
| Insurance | $2,400 | $2,400 | $2,400 |
| Rent | $18,000 | $18,000 | $18,000 |
| Payroll Taxes | $11,475 | $11,700 | $11,700 |
| Other | $0 | $0 | $0 |
| Total Operating Expenses | $118,959 | $120,684 | $120,684 |
| Profit Before Interest and Taxes | ($23,157) | $22,853 | $32,714 |
| EBITDA | ($17,973) | $28,037 | $37,898 |
| Interest Expense | $0 | $0 | $0 |
| Taxes Incurred | $0 | $6,856 | $9,814 |
| Net Profit | ($23,157) | $15,997 | $22,900 |
| Net Profit/Sales | -22.96% | 10.59% | 14.18% |
7.4 Projected Cash Flow
The following chart and table will indicate projected cash flow.

| Pro Forma Cash Flow | |||
| Year 1 | Year 2 | Year 3 | |
| Cash Received | |||
| Cash from Operations | |||
| Cash Sales | $100,844 | $151,092 | $161,472 |
| Subtotal Cash from Operations | $100,844 | $151,092 | $161,472 |
| Additional Cash Received | |||
| Sales Tax, VAT, HST/GST Received | $0 | $0 | $0 |
| New Current Borrowing | $0 | $0 | $0 |
| New Other Liabilities (interest-free) | $0 | $0 | $0 |
| New Long-term Liabilities | $0 | $0 | $0 |
| Sales of Other Current Assets | $0 | $0 | $0 |
| Sales of Long-term Assets | $0 | $0 | $0 |
| New Investment Received | $0 | $0 | $0 |
| Subtotal Cash Received | $100,844 | $151,092 | $161,472 |
| Expenditures | Year 1 | Year 2 | Year 3 |
| Expenditures from Operations | |||
| Cash Spending | $76,500 | $78,000 | $78,000 |
| Bill Payments | $39,096 | $50,866 | $55,102 |
| Subtotal Spent on Operations | $115,596 | $128,866 | $133,102 |
| Additional Cash Spent | |||
| Sales Tax, VAT, HST/GST Paid Out | $0 | $0 | $0 |
| Principal Repayment of Current Borrowing | $0 | $0 | $0 |
| Other Liabilities Principal Repayment | $0 | $0 | $0 |
| Long-term Liabilities Principal Repayment | $0 | $0 | $0 |
| Purchase Other Current Assets | $0 | $0 | $0 |
| Purchase Long-term Assets | $0 | $0 | $0 |
| Dividends | $0 | $0 | $0 |
| Subtotal Cash Spent | $115,596 | $128,866 | $133,102 |
| Net Cash Flow | ($14,752) | $22,226 | $28,370 |
| Cash Balance | $10,148 | $32,375 | $60,745 |
7.5 Projected Balance Sheet
The following table will indicate the projected balance sheet.
| Pro Forma Balance Sheet | |||
| Year 1 | Year 2 | Year 3 | |
| Assets | |||
| Current Assets | |||
| Cash | $10,148 | $32,375 | $60,745 |
| Other Current Assets | $0 | $0 | $0 |
| Total Current Assets | $10,148 | $32,375 | $60,745 |
| Long-term Assets | |||
| Long-term Assets | $25,900 | $25,900 | $25,900 |
| Accumulated Depreciation | $5,184 | $10,368 | $15,552 |
| Total Long-term Assets | $20,716 | $15,532 | $10,348 |
| Total Assets | $30,864 | $47,907 | $71,093 |
| Liabilities and Capital | Year 1 | Year 2 | Year 3 |
| Current Liabilities | |||
| Accounts Payable | $3,222 | $4,267 | $4,552 |
| Current Borrowing | $0 | $0 | $0 |
| Other Current Liabilities | $0 | $0 | $0 |
| Subtotal Current Liabilities | $3,222 | $4,267 | $4,552 |
| Long-term Liabilities | $0 | $0 | $0 |
| Total Liabilities | $3,222 | $4,267 | $4,552 |
| Paid-in Capital | $52,000 | $52,000 | $52,000 |
| Retained Earnings | ($1,200) | ($24,357) | ($8,360) |
| Earnings | ($23,157) | $15,997 | $22,900 |
| Total Capital | $27,643 | $43,640 | $66,540 |
| Total Liabilities and Capital | $30,864 | $47,907 | $71,093 |
| Net Worth | $27,643 | $43,640 | $66,540 |
7.6 Business Ratios
The following table outlines some of the more important ratios from the Recreational Vehicles Dealers industry. The final column, Industry Profile, details specific ratios based on the industry as it is classified by the Standard Industry Classification (SIC) code, 5561.
| Ratio Analysis | ||||
| Year 1 | Year 2 | Year 3 | Industry Profile | |
| Sales Growth | 0.00% | 49.83% | 6.87% | 5.92% |
| Percent of Total Assets | ||||
| Other Current Assets | 0.00% | 0.00% | 0.00% | 17.78% |
| Total Current Assets | 32.88% | 67.58% | 85.44% | 81.05% |
| Long-term Assets | 67.12% | 32.42% | 14.56% | 18.95% |
| Total Assets | 100.00% | 100.00% | 100.00% | 100.00% |
| Current Liabilities | 10.44% | 8.91% | 6.40% | 34.43% |
| Long-term Liabilities | 0.00% | 0.00% | 0.00% | 17.02% |
| Total Liabilities | 10.44% | 8.91% | 6.40% | 51.45% |
| Net Worth | 89.56% | 91.09% | 93.60% | 48.55% |
| Percent of Sales | ||||
| Sales | 100.00% | 100.00% | 100.00% | 100.00% |
| Gross Margin | 95.00% | 95.00% | 95.00% | 19.74% |
| Selling, General & Administrative Expenses | 117.96% | 84.41% | 80.82% | 11.64% |
| Advertising Expenses | 1.78% | 1.19% | 1.11% | 1.02% |
| Profit Before Interest and Taxes | -22.96% | 15.13% | 20.26% | 0.15% |
| Main Ratios | ||||
| Current | 3.15 | 7.59 | 13.34 | 2.15 |
| Quick | 3.15 | 7.59 | 13.34 | 0.51 |
| Total Debt to Total Assets | 10.44% | 8.91% | 6.40% | 53.76% |
| Pre-tax Return on Net Worth | -83.77% | 52.37% | 49.16% | 0.45% |
| Pre-tax Return on Assets | -75.03% | 47.70% | 46.02% | 0.97% |
| Additional Ratios | Year 1 | Year 2 | Year 3 | |
| Net Profit Margin | -22.96% | 10.59% | 14.18% | n.a |
| Return on Equity | -83.77% | 36.66% | 34.42% | n.a |
| Activity Ratios | ||||
| Accounts Payable Turnover | 13.14 | 12.17 | 12.17 | n.a |
| Payment Days | 27 | 26 | 29 | n.a |
| Total Asset Turnover | 3.27 | 3.15 | 2.27 | n.a |
| Debt Ratios | ||||
| Debt to Net Worth | 0.12 | 0.10 | 0.07 | n.a |
| Current Liab. to Liab. | 1.00 | 1.00 | 1.00 | n.a |
| Liquidity Ratios | ||||
| Net Working Capital | $6,927 | $28,108 | $56,192 | n.a |
| Interest Coverage | 0.00 | 0.00 | 0.00 | n.a |
| Additional Ratios | ||||
| Assets to Sales | 0.31 | 0.32 | 0.44 | n.a |
| Current Debt/Total Assets | 10% | 9% | 6% | n.a |
| Acid Test | 3.15 | 7.59 | 13.34 | n.a |
| Sales/Net Worth | 3.65 | 3.46 | 2.43 | n.a |
| Dividend Payout | 0.00 | 0.00 | 0.00 | n.a |
Appendix
| Sales Forecast | |||||||||||||
| Month 1 | Month 2 | Month 3 | Month 4 | Month 5 | Month 6 | Month 7 | Month 8 | Month 9 | Month 10 | Month 11 | Month 12 | ||
| Sales | |||||||||||||
| Tourists | 0% | $0 | $958 | $1,025 | $4,587 | $5,214 | $6,457 | $7,254 | $7,545 | $8,974 | $8,547 | $8,782 | $5,701 |
| Locals | 0% | $0 | $1,005 | $1,265 | $2,547 | $3,154 | $3,545 | $3,245 | $3,874 | $4,145 | $4,212 | $4,354 | $4,454 |
| Total Sales | $0 | $1,963 | $2,290 | $7,134 | $8,368 | $10,002 | $10,499 | $11,419 | $13,119 | $12,759 | $13,136 | $10,155 | |
| Direct Cost of Sales | Month 1 | Month 2 | Month 3 | Month 4 | Month 5 | Month 6 | Month 7 | Month 8 | Month 9 | Month 10 | Month 11 | Month 12 | |
| Tourists | $0 | $48 | $51 | $229 | $261 | $323 | $363 | $377 | $449 | $427 | $439 | $285 | |
| Locals | $0 | $50 | $63 | $127 | $158 | $177 | $162 | $194 | $207 | $211 | $218 | $223 | |
| Subtotal Direct Cost of Sales | $0 | $98 | $115 | $357 | $418 | $500 | $525 | $571 | $656 | $638 | $657 | $508 | |
| Personnel Plan | |||||||||||||
| Month 1 | Month 2 | Month 3 | Month 4 | Month 5 | Month 6 | Month 7 | Month 8 | Month 9 | Month 10 | Month 11 | Month 12 | ||
| Dan | 0% | $3,000 | $3,000 | $3,000 | $3,000 | $3,000 | $3,000 | $3,000 | $3,000 | $3,000 | $3,000 | $3,000 | $3,000 |
| Full-time employee | 0% | $0 | $1,500 | $1,500 | $1,500 | $1,500 | $1,500 | $1,500 | $1,500 | $1,500 | $1,500 | $1,500 | $1,500 |
| Full-time employee | 0% | $0 | $0 | $0 | $1,500 | $1,500 | $1,500 | $1,500 | $1,500 | $1,500 | $1,500 | $1,500 | $0 |
| Full-time employee | 0% | $0 | $0 | $0 | $1,500 | $1,500 | $1,500 | $1,500 | $1,500 | $1,500 | $1,500 | $1,500 | $0 |
| Total People | 1 | 2 | 2 | 4 | 4 | 4 | 4 | 4 | 4 | 4 | 4 | 2 | |
| Total Payroll | $3,000 | $4,500 | $4,500 | $7,500 | $7,500 | $7,500 | $7,500 | $7,500 | $7,500 | $7,500 | $7,500 | $4,500 | |
| General Assumptions | |||||||||||||
| Month 1 | Month 2 | Month 3 | Month 4 | Month 5 | Month 6 | Month 7 | Month 8 | Month 9 | Month 10 | Month 11 | Month 12 | ||
| Plan Month | 1 | 2 | 3 | 4 | 5 | 6 | 7 | 8 | 9 | 10 | 11 | 12 | |
| Current Interest Rate | 10.00% | 10.00% | 10.00% | 10.00% | 10.00% | 10.00% | 10.00% | 10.00% | 10.00% | 10.00% | 10.00% | 10.00% | |
| Long-term Interest Rate | 10.00% | 10.00% | 10.00% | 10.00% | 10.00% | 10.00% | 10.00% | 10.00% | 10.00% | 10.00% | 10.00% | 10.00% | |
| Tax Rate | 30.00% | 30.00% | 30.00% | 30.00% | 30.00% | 30.00% | 30.00% | 30.00% | 30.00% | 30.00% | 30.00% | 30.00% | |
| Other | 0 | 0 | 0 | 0 | 0 | 0 | 0 | 0 | 0 | 0 | 0 | 0 | |
| Pro Forma Profit and Loss | |||||||||||||
| Month 1 | Month 2 | Month 3 | Month 4 | Month 5 | Month 6 | Month 7 | Month 8 | Month 9 | Month 10 | Month 11 | Month 12 | ||
| Sales | $0 | $1,963 | $2,290 | $7,134 | $8,368 | $10,002 | $10,499 | $11,419 | $13,119 | $12,759 | $13,136 | $10,155 | |
| Direct Cost of Sales | $0 | $98 | $115 | $357 | $418 | $500 | $525 | $571 | $656 | $638 | $657 | $508 | |
| Other Production Expenses | $0 | $0 | $0 | $0 | $0 | $0 | $0 | $0 | $0 | $0 | $0 | $0 | |
| Total Cost of Sales | $0 | $98 | $115 | $357 | $418 | $500 | $525 | $571 | $656 | $638 | $657 | $508 | |
| Gross Margin | $0 | $1,865 | $2,176 | $6,777 | $7,950 | $9,502 | $9,974 | $10,848 | $12,463 | $12,121 | $12,479 | $9,647 | |
| Gross Margin % | 0.00% | 95.00% | 95.00% | 95.00% | 95.00% | 95.00% | 95.00% | 95.00% | 95.00% | 95.00% | 95.00% | 95.00% | |
| Expenses | |||||||||||||
| Payroll | $3,000 | $4,500 | $4,500 | $7,500 | $7,500 | $7,500 | $7,500 | $7,500 | $7,500 | $7,500 | $7,500 | $4,500 | |
| Sales and Marketing and Other Expenses | $350 | $350 | $350 | $350 | $350 | $350 | $350 | $350 | $350 | $350 | $350 | $350 | |
| Depreciation | $432 | $432 | $432 | $432 | $432 | $432 | $432 | $432 | $432 | $432 | $432 | $432 | |
| Utilities | $100 | $100 | $100 | $100 | $100 | $100 | $100 | $100 | $100 | $100 | $100 | $100 | |
| Insurance | $200 | $200 | $200 | $200 | $200 | $200 | $200 | $200 | $200 | $200 | $200 | $200 | |
| Rent | $1,500 | $1,500 | $1,500 | $1,500 | $1,500 | $1,500 | $1,500 | $1,500 | $1,500 | $1,500 | $1,500 | $1,500 | |
| Payroll Taxes | 15% | $450 | $675 | $675 | $1,125 | $1,125 | $1,125 | $1,125 | $1,125 | $1,125 | $1,125 | $1,125 | $675 |
| Other | $0 | $0 | $0 | $0 | $0 | $0 | $0 | $0 | $0 | $0 | $0 | $0 | |
| Total Operating Expenses | $6,032 | $7,757 | $7,757 | $11,207 | $11,207 | $11,207 | $11,207 | $11,207 | $11,207 | $11,207 | $11,207 | $7,757 | |
| Profit Before Interest and Taxes | ($6,032) | ($5,892) | ($5,582) | ($4,430) | ($3,257) | ($1,705) | ($1,233) | ($359) | $1,256 | $914 | $1,272 | $1,890 | |
| EBITDA | ($5,600) | ($5,460) | ($5,150) | ($3,998) | ($2,825) | ($1,273) | ($801) | $73 | $1,688 | $1,346 | $1,704 | $2,322 | |
| Interest Expense | $0 | $0 | $0 | $0 | $0 | $0 | $0 | $0 | $0 | $0 | $0 | $0 | |
| Taxes Incurred | $0 | $0 | $0 | $0 | $0 | $0 | $0 | $0 | $0 | $0 | $0 | $0 | |
| Net Profit | ($6,032) | ($5,892) | ($5,582) | ($4,430) | ($3,257) | ($1,705) | ($1,233) | ($359) | $1,256 | $914 | $1,272 | $1,890 | |
| Net Profit/Sales | 0.00% | -300.16% | -243.73% | -62.09% | -38.93% | -17.05% | -11.74% | -3.14% | 9.57% | 7.16% | 9.68% | 18.61% | |
| Pro Forma Cash Flow | |||||||||||||
| Month 1 | Month 2 | Month 3 | Month 4 | Month 5 | Month 6 | Month 7 | Month 8 | Month 9 | Month 10 | Month 11 | Month 12 | ||
| Cash Received | |||||||||||||
| Cash from Operations | |||||||||||||
| Cash Sales | $0 | $1,963 | $2,290 | $7,134 | $8,368 | $10,002 | $10,499 | $11,419 | $13,119 | $12,759 | $13,136 | $10,155 | |
| Subtotal Cash from Operations | $0 | $1,963 | $2,290 | $7,134 | $8,368 | $10,002 | $10,499 | $11,419 | $13,119 | $12,759 | $13,136 | $10,155 | |
| Additional Cash Received | |||||||||||||
| Sales Tax, VAT, HST/GST Received | 0.00% | $0 | $0 | $0 | $0 | $0 | $0 | $0 | $0 | $0 | $0 | $0 | $0 |
| New Current Borrowing | $0 | $0 | $0 | $0 | $0 | $0 | $0 | $0 | $0 | $0 | $0 | $0 | |
| New Other Liabilities (interest-free) | $0 | $0 | $0 | $0 | $0 | $0 | $0 | $0 | $0 | $0 | $0 | $0 | |
| New Long-term Liabilities | $0 | $0 | $0 | $0 | $0 | $0 | $0 | $0 | $0 | $0 | $0 | $0 | |
| Sales of Other Current Assets | $0 | $0 | $0 | $0 | $0 | $0 | $0 | $0 | $0 | $0 | $0 | $0 | |
| Sales of Long-term Assets | $0 | $0 | $0 | $0 | $0 | $0 | $0 | $0 | $0 | $0 | $0 | $0 | |
| New Investment Received | $0 | $0 | $0 | $0 | $0 | $0 | $0 | $0 | $0 | $0 | $0 | $0 | |
| Subtotal Cash Received | $0 | $1,963 | $2,290 | $7,134 | $8,368 | $10,002 | $10,499 | $11,419 | $13,119 | $12,759 | $13,136 | $10,155 | |
| Expenditures | Month 1 | Month 2 | Month 3 | Month 4 | Month 5 | Month 6 | Month 7 | Month 8 | Month 9 | Month 10 | Month 11 | Month 12 | |
| Expenditures from Operations | |||||||||||||
| Cash Spending | $3,000 | $4,500 | $4,500 | $7,500 | $7,500 | $7,500 | $7,500 | $7,500 | $7,500 | $7,500 | $7,500 | $4,500 | |
| Bill Payments | $87 | $2,611 | $2,924 | $2,963 | $3,634 | $3,696 | $3,776 | $3,801 | $3,849 | $3,930 | $3,914 | $3,912 | |
| Subtotal Spent on Operations | $3,087 | $7,111 | $7,424 | $10,463 | $11,134 | $11,196 | $11,276 | $11,301 | $11,349 | $11,430 | $11,414 | $8,412 | |
| Additional Cash Spent | |||||||||||||
| Sales Tax, VAT, HST/GST Paid Out | $0 | $0 | $0 | $0 | $0 | $0 | $0 | $0 | $0 | $0 | $0 | $0 | |
| Principal Repayment of Current Borrowing | $0 | $0 | $0 | $0 | $0 | $0 | $0 | $0 | $0 | $0 | $0 | $0 | |
| Other Liabilities Principal Repayment | $0 | $0 | $0 | $0 | $0 | $0 | $0 | $0 | $0 | $0 | $0 | $0 | |
| Long-term Liabilities Principal Repayment | $0 | $0 | $0 | $0 | $0 | $0 | $0 | $0 | $0 | $0 | $0 | $0 | |
| Purchase Other Current Assets | $0 | $0 | $0 | $0 | $0 | $0 | $0 | $0 | $0 | $0 | $0 | $0 | |
| Purchase Long-term Assets | $0 | $0 | $0 | $0 | $0 | $0 | $0 | $0 | $0 | $0 | $0 | $0 | |
| Dividends | $0 | $0 | $0 | $0 | $0 | $0 | $0 | $0 | $0 | $0 | $0 | $0 | |
| Subtotal Cash Spent | $3,087 | $7,111 | $7,424 | $10,463 | $11,134 | $11,196 | $11,276 | $11,301 | $11,349 | $11,430 | $11,414 | $8,412 | |
| Net Cash Flow | ($3,087) | ($5,148) | ($5,134) | ($3,329) | ($2,766) | ($1,194) | ($777) | $118 | $1,770 | $1,329 | $1,722 | $1,743 | |
| Cash Balance | $21,813 | $16,666 | $11,532 | $8,203 | $5,438 | $4,243 | $3,466 | $3,584 | $5,354 | $6,683 | $8,405 | $10,148 | |
| Pro Forma Balance Sheet | |||||||||||||
| Month 1 | Month 2 | Month 3 | Month 4 | Month 5 | Month 6 | Month 7 | Month 8 | Month 9 | Month 10 | Month 11 | Month 12 | ||
| Assets | Starting Balances | ||||||||||||
| Current Assets | |||||||||||||
| Cash | $24,900 | $21,813 | $16,666 | $11,532 | $8,203 | $5,438 | $4,243 | $3,466 | $3,584 | $5,354 | $6,683 | $8,405 | $10,148 |
| Other Current Assets | $0 | $0 | $0 | $0 | $0 | $0 | $0 | $0 | $0 | $0 | $0 | $0 | $0 |
| Total Current Assets | $24,900 | $21,813 | $16,666 | $11,532 | $8,203 | $5,438 | $4,243 | $3,466 | $3,584 | $5,354 | $6,683 | $8,405 | $10,148 |
| Long-term Assets | |||||||||||||
| Long-term Assets | $25,900 | $25,900 | $25,900 | $25,900 | $25,900 | $25,900 | $25,900 | $25,900 | $25,900 | $25,900 | $25,900 | $25,900 | $25,900 |
| Accumulated Depreciation | $0 | $432 | $864 | $1,296 | $1,728 | $2,160 | $2,592 | $3,024 | $3,456 | $3,888 | $4,320 | $4,752 | $5,184 |
| Total Long-term Assets | $25,900 | $25,468 | $25,036 | $24,604 | $24,172 | $23,740 | $23,308 | $22,876 | $22,444 | $22,012 | $21,580 | $21,148 | $20,716 |
| Total Assets | $50,800 | $47,281 | $41,702 | $36,136 | $32,375 | $29,178 | $27,551 | $26,342 | $26,028 | $27,366 | $28,263 | $29,553 | $30,864 |
| Liabilities and Capital | Month 1 | Month 2 | Month 3 | Month 4 | Month 5 | Month 6 | Month 7 | Month 8 | Month 9 | Month 10 | Month 11 | Month 12 | |
| Current Liabilities | |||||||||||||
| Accounts Payable | $0 | $2,513 | $2,826 | $2,842 | $3,511 | $3,570 | $3,649 | $3,673 | $3,718 | $3,800 | $3,783 | $3,801 | $3,222 |
| Current Borrowing | $0 | $0 | $0 | $0 | $0 | $0 | $0 | $0 | $0 | $0 | $0 | $0 | $0 |
| Other Current Liabilities | $0 | $0 | $0 | $0 | $0 | $0 | $0 | $0 | $0 | $0 | $0 | $0 | $0 |
| Subtotal Current Liabilities | $0 | $2,513 | $2,826 | $2,842 | $3,511 | $3,570 | $3,649 | $3,673 | $3,718 | $3,800 | $3,783 | $3,801 | $3,222 |
| Long-term Liabilities | $0 | $0 | $0 | $0 | $0 | $0 | $0 | $0 | $0 | $0 | $0 | $0 | $0 |
| Total Liabilities | $0 | $2,513 | $2,826 | $2,842 | $3,511 | $3,570 | $3,649 | $3,673 | $3,718 | $3,800 | $3,783 | $3,801 | $3,222 |
| Paid-in Capital | $52,000 | $52,000 | $52,000 | $52,000 | $52,000 | $52,000 | $52,000 | $52,000 | $52,000 | $52,000 | $52,000 | $52,000 | $52,000 |
| Retained Earnings | ($1,200) | ($1,200) | ($1,200) | ($1,200) | ($1,200) | ($1,200) | ($1,200) | ($1,200) | ($1,200) | ($1,200) | ($1,200) | ($1,200) | ($1,200) |
| Earnings | $0 | ($6,032) | ($11,924) | ($17,506) | ($21,935) | ($25,193) | ($26,898) | ($28,131) | ($28,490) | ($27,234) | ($26,320) | ($25,047) | ($23,157) |
| Total Capital | $50,800 | $44,768 | $38,876 | $33,294 | $28,865 | $25,607 | $23,902 | $22,669 | $22,310 | $23,566 | $24,480 | $25,753 | $27,643 |
| Total Liabilities and Capital | $50,800 | $47,281 | $41,702 | $36,136 | $32,375 | $29,178 | $27,551 | $26,342 | $26,028 | $27,366 | $28,263 | $29,553 | $30,864 |
| Net Worth | $50,800 | $44,768 | $38,876 | $33,294 | $28,865 | $25,607 | $23,902 | $22,669 | $22,310 | $23,566 | $24,480 | $25,753 | $27,643 |


