
Boulder Stop
Executive Summary
Introduction
The Boulder Stop will be a combination coffee shop and rock climbing gear store strategically located near one of the Pacific Northwest’s premier climbing spots. Our main strategy is to develop The Boulder Stop experience as part of the overall rock climbing activity. We don’t intend to be just a store, but rather a rock climbing cultural center for regulars and visitors to Smith Rock, Oregon.
It is the purpose of this business plan to lay the foundations of the company’s vision, philosophy and strategy to the firm’s principal investors and debtors and to align the various elements of the company to create a coherent system of sustainable customer satisfaction and profits.
The Company
The store is located one mile from Smith Rock State Park in the Central Oregon desert. It is conveniently located in an area frequented by national and international tourists.
We expect a high degree of expertise and enthusiasm from our employees and we will compensate them accordingly. All employees are hired for their expertise and enthusiasm and will be paid at a rate well above the minimum wage to facilitate low-turnover and long-term loyalty. The company plans to hire two part-time employees as espresso servers/gear experts.
Sourcing is critical for any enterprise, especially a retail operation. The Espresso Harvest will be our coffee vendors, and will handle many in-store merchandising issues for their line of coffee products. The sport and recreation inventory will be sourced directly from manufacturers like Black Diamond, Boreal, and Petzl.
Luke Walsh will be the general manager and founder of The Boulder Stop. Mr. Walsh graduated from the University of Oregon with a degree in Business Management. Luke’s success as a Nordstrom employee combined with his formal business training makes him an ideal community leader and business owner.
The Market
Consumer expenditures for rock climbing equipment rose to $4,000,000 in Central Oregon last year. We expect sales to increase steadily as Oregon’s population grows and the rock-climbing industry becomes increasingly popular.
The Western Oregon presence of several large universities is expected to fuel our business, as does the status of Smith Rock as an international destination spot for rock climbing enthusiasts. Individuals from as far away as Japan, Europe, South America, and Australia seek out Smith Rock as a beautiful and challenging sport and rock climbing destination. We count worldwide readers of such publications as Rock & Ice magazine and Outdoor Adventure among our target audience.
Trends are in our favor. There are three major trends at work in our market:
- Outdoor sports in general and rock climbing in particular are gaining exposure. The rock climbing gyms in the Silicon Valley, Seattle, Eugene, and other locations are clear evidence of this trend.
- Central Oregon is becoming a major vacation destination and recreation spot.
- The gourmet coffee trend started in the Northwest, and is spreading quickly throughout the nation. A growing number of people look to their high-end coffee drinks as a way to enjoy a moment, and as an integral part of any outing or activity.
There are two important underlying market needs; a real need for a highly professional provider of climbing gear and a social meeting place/refreshment provider near the Smith Rock location. In many ways the Boulder Stop mimics the positioning of a ski lodge; selling crucial gear while providing a place for coffee, snacks, and talk.
The Boulder Stop has several advantages over its leading competitor including newer inventory and more modern interior fixtures, an atmosphere that appeals to a wider market than our largest competitor, and the coffee/espresso concept.
The Boulder Stop will use advertising and sales programs to get the word out to customers.
- 2000 four-color brochures
- Half-page newspaper advertisements in Oregon regional newspapers,
- Web promotions
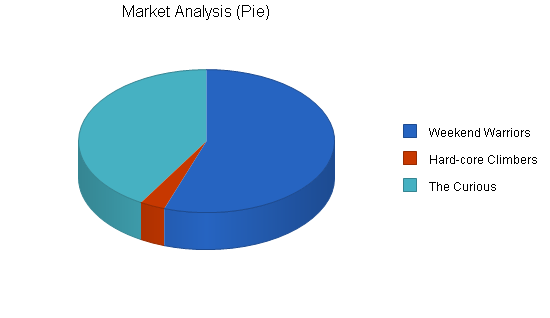
Our three main target markets are Weekend warriors, Hard-core climbers, and The curious. We predict that the number of Hard-core climbers will grow faster than the number of Weekend warriors. Climbing is becoming more and more technical, an “Insider’s sport” and we believe this will fuel the growth of dedicated, highly sophisticated climbers.
Financial Projections
The Boulder Stop expects to earn modest profits by year three based on projected sales. These projections are based on the following assumptions.
- Growth will be moderate, cash balance always positive.
- Marketing will remain at or below 15% of sales.
- The company will invest residual profits into company expansion and personnel.
We predict advertising costs and consulting costs will go up in the next three years. This will give The Boulder Stop an acceptable profit-to-sales ratio of by Year 3. Normally, a start-up concern will operate with negative profits through the first two years. We expect to avoid that kind of operating loss by knowing our competitors, our target markets, industry direction, and the products we sell.

1.1 Objectives
- To make The Boulder Stop a local favorite for tourists, hikers, and climbers on their way to/from Smith Rock.
- To achieve the largest market share in the region for appeals gear. We will use State of Oregon economic data to compile an estimate of market share goals for Year 2.
- To be an active and vocal member of the community, and to provide continual re-investment through sponsorship of community activities and celebrations. We will sponsor five or more events during the year, including fun climbs, family bouldering, and celebrity hosted competitions.
- To achieve a conservatively projected gross margin within the first year.
- To achieve a net profit by year two. We will re-invest these profits in our business and our community’s future.
1.2 Mission
The Boulder Stop is an equipment store and cafe specializing in premium appeals gear and coffee/espresso drinks. We believe appeals should be safe and fun. We understand that rock climbers need a healthy dose of the newest gear, fresh snacks, and raw caffeine.
Our goal is to be the centrifuge for rock climbers living in and visiting Central Oregon. Smith Rock State Park is one of the finest rock climbers parks in the world. Our staff is fluent in several languages, including Spanish, German, and French. Locals and tourists alike will long for our hip, lively shop because of our staff, our setting, our gear, and our coffee.
We believe it is important to remain an active member of the community. To impact people’s lives in more ways than deriving a profit from them. We host community events that bring out the best in people.
We will be the region’s destination for those who want to know all there is to know about rock climbers gear, safety, rules, and events. The future of rock climbers in Central Oregon will be determined by our level of commitment.
1.3 Keys to Success
To succeed in this business we must:
- Sell products that are of the highest reliability and quality. We must offer as many or more premium products than REI offers online and through their Eugene and Portland stores. This means we must carry all premium brands of harnesses, active protection, passive protection, helmets, ice climbing gear, camping gear and mountaineering gear.
- Offer loss leaders and other promotions that bring customers into the store to buy goods, explore our line of services, and sign up for future events.
- Provide for the satisfaction of 100% of our customers and vendors. Both are very valuable to us and we will design a customer care plan to manage complaints, implement employee and customer feedback, manage supplier accounts, and predict potential conflicts.
- Be an active member of the community: i.e., host sport climbing and sport climbing events.
- Negotiate valuable contracts with great distributors such as Trago, Petzl, Black Diamond, Beal, Ushba Mountain Works, and others. To maintain a high margin business plan, we must negotiate a good cost structure.
Company Summary
The Boulder Stop is a purveyor of premium coffee and gear. The cafe is located one mile from Smith Rock State Park in Central Oregon.

The Boulder Stop was incorporated in the State of Oregon. It is privately held and managed by Luke Walsh. The company has established a central office at 1455 Portland St., Bend, OR 97701. This location is designed for purchasing, storage, and contract negotiations. Service purchases will be forwarded to this office for review and approval. All PO authorizations will also be approved at this office.
2.1 Company Ownership
The Boulder Stop is a privately held corporation. Luke Walsh owns 60% of The Boulder Stop, his wife Lisa, owns 40%. This company operates under the jurisdiction of the State of Oregon and the United States of America as an S Corporation. If the company shows steady are exponential growth, the owners will prepare the company for re-establishment as a “C” corporation. As a “C” corporation, the owners will not be taxed at the higher maximum personal rate of 39.6%, but rather the company will be taxed at the maximum corporate rate of 34%. If the owners elect to administer The Boulder Stop as a “C” corporation, it will not be taken lightly. A company that moves from “S” to “C” status must remain in “C” status for a minimum of five years.
At the moment, the owners wish to benefit from the single taxation of an “S” corporation.
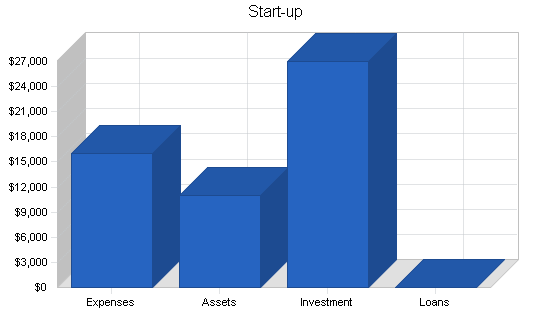
2.2 Start-up Summary
Our incorporation costs are listed below, as well as the cost of retaining a marketing consultant to manage local impact-management teams and to issue a community impact report to major public and private agencies within the region. Their job will be to inform The Boulder Stop owners about how to effectively communicate with the community leaders. Our lawyer will be responsible for preempting any local government conflicts having to do with zoning and/or permit allowance.
There will be other normal business costs such as a $1,000,000 liability umbrella, rent, interior design costs, and opening day promotions.
The largest equipment purchase will be that of a Conti brand commercial espresso machine. This machine, named “The TwinStar”, comes with an 18-month warranty on parts and 12-months warranty on labor. Their espresso machines are world renowned for their high quality and performance features. The machine will push steam through the espresso grounds at temperatures set by the user.
The company will start with two months’ inventory on-hand. The majority of company assets will reside in inventory. The starting cash balance will be $3,000.
The purpose of this business plan is to secure a SBA loan. This loan appears in the long-term liability row of the attached Start-up Funding table.
| Start-up | |
| Requirements | |
| Start-up Expenses | |
| Legal | $300 |
| Marketing Consultant | $4,500 |
| Business and Liability Insurance | $600 |
| Rent-1st Month + Deposit | $2,500 |
| Design Cost | $3,500 |
| First Week Promotion | $1,100 |
| Expensed Equipment | $3,500 |
| Total Start-up Expenses | $16,000 |
| Start-up Assets | |
| Cash Required | $3,000 |
| Start-up Inventory | $7,000 |
| Other Current Assets | $1,000 |
| Long-term Assets | $0 |
| Total Assets | $11,000 |
| Total Requirements | $27,000 |
| Start-up Funding | |
| Start-up Expenses to Fund | $16,000 |
| Start-up Assets to Fund | $11,000 |
| Total Funding Required | $27,000 |
| Assets | |
| Non-cash Assets from Start-up | $8,000 |
| Cash Requirements from Start-up | $3,000 |
| Additional Cash Raised | $0 |
| Cash Balance on Starting Date | $3,000 |
| Total Assets | $11,000 |
| Liabilities and Capital | |
| Liabilities | |
| Current Borrowing | $0 |
| Long-term Liabilities | $0 |
| Accounts Payable (Outstanding Bills) | $0 |
| Other Current Liabilities (interest-free) | $0 |
| Total Liabilities | $0 |
| Capital | |
| Planned Investment | |
| Owner | $0 |
| Investor | $0 |
| Additional Investment Requirement | $27,000 |
| Total Planned Investment | $27,000 |
| Loss at Start-up (Start-up Expenses) | ($16,000) |
| Total Capital | $11,000 |
| Total Capital and Liabilities | $11,000 |
| Total Funding | $27,000 |
2.3 Company Locations and Facilities
The company office is located in the owner’s residence, 1455 Portland St., Bend, OR 97701. The office is about 1,000 square feet and has ample space for the first three years of growth. Deliveries and shipments are serviced through the store located at 432 Smith Rock Drive, Redmond, OR 97756. The 5,000 square foot retail building is owned by The Boulder Stop and there is no excess storage capacity.
Products
Espresso is the big money maker for The Boulder Stop, with coffee peripherals coming in a close second. The sport climbing gear is a long-term sales project that will rely on future catalog and “word-of-mouth” sales to achieve a positive ROI.
The Boulder Stop sells high-quality sport climbing gear to serious climbers. The gear is checked by knowledgeable employees who use and recommend equipment to customers and management. The gear is purchased from well-known manufacturers like Black Diamond, Boreal, and Petzl. Management will rely on employees and customers to shorten the feedback loop in product and service offerings. Climbing gear is delivered every Thursday via UPS.
Straight espresso bean rebuys arrive on Mondays and Thursdays, ensuring the freshest beans possible. Modified rebuys begin on the first of each month. The owner will oversee all purchases, shipments, and deliveries.
3.1 Product Description
The Boulder Stop sells the entire raft of coffee drinks: lattes, mochas, cappuccino, espresso, and a delicious house blend. The coffee and espresso beans are freshly roasted by Espresso Harvest. Our team of two part-time high school students will create the beverages for customers. They will be trained in “The Art of Making the Proper Espresso Beverage” at Espresso Harvest, which hosts such classes once a month.
The Boulder Stop also sells carabiners, friends, nuts, ropes, webbing, shoes, and harnesses; our product mix is sufficient to satisfy even the most hard-core enthusiast. Below is a listing of some high-end products that we market:
- Black Diamond Camalot Camming Device – $50 to $100
- Wild Country Forged Friends with Sling – $35 to $65
- Hugh Banner HMS Locking Carabiner – $12 to $17
- The North Face Bouldering Sweatshirt, Men’s – $85 to $105
- Mammut Flash Duodess 10.5mm Dry Rope – $185 to $200
- Boreal Ace Rock Shoes – $150 to $170
All products are quality checked when they arrive and quality checked before the customer takes them home.
3.2 Competitive Comparison
The Boulder Stop has several advantages over its leading competitor.
- Newer inventory and more modern interior fixtures.
- Espresso drinks are made available to consumers while they shop, increasing marketing message impact. Our competitor offers the shopping experience that lacks the thrill of being able to sit down with friends, munch on a cookie, drink espresso and “talk shop”.
- The Boulder Stop is a fun, spacious store catering to both the climbing Pros and the inexperienced. Our competitor, Rockage, is an exclusive Pro shop that discourages some newcomers to the sport. Our positioning encourages those just getting started, a one-stop destination for equipment advice and purchasing opportunities, technique and safety instruction, and conversation with other enthusiasts.
- We expect a high degree of expertise and enthusiasm from our employees and we compensate them accordingly. All employees are hired for their expertise and enthusiasm and will be paid at a rate well above the minimum wage to facilitate low-turnover and long-term loyalty.
3.3 Sales Literature
The Boulder Stop will use advertising and sales programs to get the word out to customers.
- 2000 four-color brochures to be distributed throughout Bend-area facilities: outdoor clothing shops, hotels, ranger stations, chambers of commerce, tourism offices, eateries, and other tourist-frequented spots one month before May grand opening.
- Half-page newspaper advertisements in Oregon regional newspapers, advertising the following sales promotion: introductory rock-climbing classes, two days for $100 per person. Copy: magazine and newspaper advertisements.
- Web promotions: We will administer a website at www.boulder-stop.com. This website will present promotional material such as new marketing programs, product white papers, and contests. The site will allow for immediate purchase of gear online and will use a secure server to process transactions through Cybercash.
3.4 Future Products
Future expansion may allow for a horizontal increase of our product line by offering additional product categories: water sport gear, camping gear, and mountain biking accessories. We won’t rule out the possibility of vertically integrating through our own line of climbing gear and/or espresso. We will also explore new services such as gear storage lockers, cellular phone rentals, and same day guide services.
One dream the owner has is to develop an Internet environment within the store, not to remove people from those surrounding them, but to help them stay in touch with friends, family, and the latest information about rock climbing.
3.5 Sourcing
Sourcing is critical for any enterprise, especially a retail operation. The Espresso Harvest will be our coffee vendors, and will handle many in-store merchandising issues for their line of coffee products. Operational supplies for the coffee bar will be purchased from the regional supply wholesaler, who will handle special merchandising issues, such as point-of-sale materials. The sport and recreation inventory will be sourced directly from manufacturers like Black Diamond, Boreal, and Petzl.
We will solidify relationships with vendors so that we may achieve decreased cost-of-goods. Our competitor buys from some of the same vendors we do, yet we believe that through marketing programs and strategic alliances we will gain more loyalty from these vendors. This is our long-term strategy for gaining a sourcing competitive advantage.
Advertising costs are outsourced to [Omitted]. Most sales promotion and public relations work is handled in-house by Luke. Luke will write all product white-papers and combine those with literature supplied by the manufacturer.
Future seminars and climbing clinics will be handled either by the owner or by several certified and experienced tour and adventure professionals. We will use local contacts to research the availability of celebrity climbers to sponsor some of these clinics and events. We believe this tactic will build a grass-roots network of climbers that will help us to differentiate The Boulder Stop as a “hang-out” for serious and curious climbers.
3.6 Technology
We use off-the-shelf, PC-based software for accounting purposes, including AR/AP, inventory, purchasing, sales, and returns.
Our business plan is generated on an annual basis using Business Plan Pro® from Palo Alto Software, and reviewed quarterly for evaluation. Further functionality is provided by Palo Alto Software’s companion package, Marketing Plan Pro®, which allows us to make the most use of our marketing dollars by focusing our communications on target markets and enhancing our marketing knowledge.
We are in the process of implementing a website for The Boulder Stop. Online commerce is becoming an increasingly attractive option due to the relatively low cost-of-goods, the global reach of the medium, and the increasing security. Our business model could quite conceivably expand to include a form of Internet commerce in a variety of adventure equipment.
Market Analysis Summary
Consumer expenditures for sport climbing equipment rose to $4,000,000 in Central Oregon in 1997. We expect sales to increase steadily as Oregon’s population grows and the rock-climbing industry becomes increasingly popular.
The Western Oregon presence of several large universities helps fuel our business, as does the status of Smith Rock as an international destination spot for sport climbing enthusiasts. Individuals from as far away as Japan, Europe, South America, and Australia seek out Smith Rock as a beautiful and challenging sport and sport climbing destination. We count worldwide readers of such publications as Rock & Ice magazine and Outdoor Adventure among our target audience.
Our three main target markets are Weekend warriors, Hard-core climbers, and The curious. We predict that the number of Hard-core climbers will grow faster than the number of Weekend warriors. Climbing is becoming more and more technical, an “Insider’s sport” and we believe this will fuel the growth of dedicated, highly sophisticated climbers.
This market analysis is somewhat conservative when compared with Oregon’s predicted population growth of 2% per year and Bend’s 5% average gains over the last five years.
4.1 Market Segmentation
- The weekend warriors purchase during weekends. When these climbers are on a rock wall, they want to look COOL. They want to hang out at with their friends at Smith Rock and enjoy a nice pre-climb or post-climb espresso drink or ice cream cone. Weekend warriors pack special events with family members and friends. This market is our target for special events and climbing services such as tours and fun climbs.
- Hard-core climbers are very fickle about the gear they use. This segment is very brand loyal and provides the company with powerful word-of-mouth marketing. They are highly sophisticated climbers who know the jargon and want to let everyone know they are serious about the sport and its image.
- The Curious want to stop in for a gander on their way to their campsites or hotel rooms. They may be into hiking Smith Rock State Park, or just taking a driving tour, it doesn’t matter. They may be travelers or locals, depending upon the season and the event.
| Market Analysis | |||||||
| Year 1 | Year 2 | Year 3 | Year 4 | Year 5 | |||
| Potential Customers | Growth | CAGR | |||||
| Weekend Warriors | 2% | 40,000 | 40,800 | 41,616 | 42,448 | 43,297 | 2.00% |
| Hard-core Climbers | 2% | 2,300 | 2,346 | 2,393 | 2,441 | 2,490 | 2.00% |
| The Curious | 2% | 30,000 | 30,600 | 31,212 | 31,836 | 32,473 | 2.00% |
| Total | 2.00% | 72,300 | 73,746 | 75,221 | 76,725 | 78,260 | 2.00% |
4.2 Target Market Segment Strategy
We will focus on the highly discriminating Hard-core climber segment first, because these are the opinion leaders. Both the weekend warrior and The Curious will follow the Hard-core climbers. If we can attract and keep the Hard-core climbers, then they will attract others. To attract Hard-core climbers, we will carry all the best high-tech gear, know the jargon, use the latest technology, and become a “Futurist” product and services company.
We want to clearly differentiate the Weekend warriors from the Hard-core climbers. Less competitive, or at least at a different competitive level, these climbers are usually at Smith Rock to hike or explore. They respect the Hard-core climbers, but don’t want to be classified as having “Rock on the brain.” 20-30% of these climbers will respond to family events by bringing their families, the other 70-80% climb with friends and occasionally try to outdo each other. This market is highly susceptible to getting stuck in a coffee shop with friends, they will talk about their latest romance, conflicts with other friends, the future, or the fine espresso at The Boulder Stop. We will market the weekend warriors with a combination of amateur climbing events and family fun climbs.
4.2.1 Market Trends
Trends are in our favor. There are three major trends at work in our market:
- Outdoor sports in general and rock climbing in particular are gaining exposure. The rock climbing gyms in the Silicon Valley, Seattle, Eugene, and other locations are clear evidence of this trend.
- Central Oregon is becoming a major vacation destination and recreation spot.
- The gourmet coffee trend started in the Northwest, and is spreading throughout the nation. A growing number of people look to their high-end coffee drinks as a way to enjoy a moment, and as an integral part of any outing or activity.
4.2.2 Market Growth
- According to [the latest available studies], vacation spending in Oregon is growing more than 25 percent per year.
- Over the last five years, spending on climbing has been grown faster than spending on skiing or mountain biking, although from a much smaller base. According to [omitted], the industry will experience 130 percent growth over the next three years.
- Coffee spending is up 15 percent this year, according to the [omitted] annual report.
4.2.3 Market Needs
There are two important underlying needs, and the combination of gear and coffee serves both. In many ways the Boulder Stop mimics the positioning of a ski lodge; selling crucial gear while providing a place for coffee, snacks, and talk.
- There is a real need for a highly professional provider of climbing gear near the Smith Rock location. People forget to pack exactly what they need, and things break.
- There is also a practical need for coffee, a meeting place, and conversation. This is the activity focus of the location.
4.3 Industry Analysis
The rock-climbing industry is expanding faster than ever. Although climbing gear is priced at a premium, people buy it because it provides them with adventurous and, naturally, safer climbs.
High profit margins on coffee sales and low overhead costs lead to high profit margins in the espresso industry. Expansion of coffee and espresso retail outlets has increased exponentially in the last five years as large companies such as [omitted] have increased their reach to the East Coast in cities such as Boston, New York, and Washington D.C.
4.3.1 Competition and Buying Patterns
Climbers demand knowledgeable employees in a convenient location.
- Comparison: [Omitted] has placed its stores in urban industrial areas. [Omitted], a wholesaler, implements a similar strategy that draws the suburban dweller out of the house. This strategy keeps these customers isolated from the competition.
- Products and services are the most important factors when selling sport climbing gear. Brand name products sell well in stores that maintain a good selection, good location, and knowledgeable, friendly employees.
- Espresso shops need to be fast, efficient, and friendly. Fortunately, there are no espresso shops in close proximity to The Boulder Stop.
4.3.2 Main Competitors
Our nearest competitor is [Omitted]. Our next closest competitor is [Omitted], located in Redmond, 7 miles from our store. Neither of these retailers offer espresso to their customers.
- [Omitted] sells limited gear (clothes), they do not promote, or otherwise market their products extensively. They sell ice cream and carry more GenX apparel than The Boulder Stop. In fact, their biggest strength may be that they may potentially become our ally. We see their products as complementary to ours; Ice Cream<>Espresso. Their biggest weakness is limited store space.
- [Omitted] will be our toughest competitor, for they have already established themselves in the sport climbing community. They have a very experienced and knowledgeable staff of expert climbers, and are located on highway 97, 2 miles from Smith Rock. They carry 75-80% of the same gear that we do.
4.3.3 Industry Participants
The sport climbing gear industry is still fairly young. Climbing stores are generally small in size and community oriented. These stores seek to attract the most knowledgeable $6-8/hour employees. There are some bigger players, such as [omitted] that serve a larger, less targeted community with rock gear and gear for dozens of other outdoor sports. These national participants are consistent about their message and carry an impressive array of gear, but only the largest stores combine an espresso shop with the “Yuppie” shopping experience.
Participants in the espresso market are big name retailers such as [omitted] and [omitted] . These retailers focus on the standardized model. Under this model, a buyer will get the same service and same beverage in New York as the one they will get in downtown Bend. This leads to a backlash of sorts, as local consumers move to industry participants that differentiate their companies from the national standardized model. The product becomes localized and the buyer recognizes the value of supporting a business that keeps its profits in the community that created the profit.
4.3.4 Distribution Patterns
Traditional distribution channels are followed. The products are bought from wholesalers who have little say in how products are marketed, beyond the occasional sales promotion display provided via the manufacturer. This is beneficial in keeping the marketing and product costs low, while maintaining high profit margins.
Customers are very brand oriented and affect the distribution patterns (rebuys) on the retail end. As consumers become increasingly aware of the internet’s potential, they will begin to buy product directly from the manufacturer. This will not hurt our business because a) we have a website, direct distribution model of our own and b) our location and convenience create and advantage for us. We will create in-store kiosks linked to our website. For now we will build on the strengths of location. If distribution patterns shift to a direct model, we build our business under the direct model.
Strategy and Implementation Summary
The Boulder Stop uses a strategy of total market service.
Assumptions:
- Every person is a potential customer and all our potential markets will experience growth.
- Marketing to one segment of the population will lead to an expansion in overall market growth.
5.1 Strategy Pyramid
Our main strategy is to develop The Boulder Stop experience as part of the sport climbing activity. We don’t intend to be just a store, but rather a sport climbing cultural center for regulars and visitors to Smith Rock.
Underneath this strategy, our first tactic emphasizes the needs of the Hard-core climber. We assume that participation of the Hard-core set will generate interest for others.
5.2 Value Proposition
The Boulder Stop gives Smith Rock visitors the highest quality climbing gear, good coffee, and a place to meet, in a convenient locale.
5.3 Competitive Edge
Our location is a very important competitive edge. It will be difficult for our competitors to match our location.
The other competitive edge in development is our reputation and involvement with the community. The Boulder Stop is part of the Smith Rock experience, like the [Omitted] photography store used to be, in Yosemite Valley. That is why we are developing a community of employees who are sport climbing, and our sport climbing events, bulletin board, etc. This advantage is important to us because our prices are slightly higher than other cafes and other gear stores in Oregon.
5.4 Marketing Strategy
Our marketing strategy will focus on three segments. Those three segments are described in the following subtopics.
- The plan will benchmark our objectives for sales promotion, mass selling, and personal selling.
- We are focusing our marketing effort on the Weekend warriors and the Hard-core climbing community. We will implement a strategy that treats these customers as a community. This means our marketing resources will be centered around both sales promotions (events, displays) and personal sales (customer service, friendly atmosphere).
- The marketing budget will not exceed $5,000 per year.
- Marketing promotions will be consistent with the Mission Statement.
5.4.1 Promotion Strategy
The Boulder Stop will implement a strong sales promotion strategy. Advertising will be secondary.
- [Omitted] will be paid up to $4,000 to determine the needs of the surrounding population and how the company may best meet those needs with promotions, literature and other marketing programs.
- Promotional campaigns will be partially outsourced to [Omitted].
- Advertising will be consistent with [Omitted].
- Sales promotions and public relation strategies will work together to inform customers of new products, to encourage an image of community involvement for The Boulder Stop, and to limit environmental impact.
5.4.2 Distribution Strategy
The customers will buy our products directly from the store, in the store. We will also generate sales through our website and its secure server and we will ship all ordered products from the store. All telephone orders will be taken at the store through either our single (800) line or the local number. Mail orders will be processed at the main office in Bend and shipped from the store. All debits and credits, order transactions, charge backs, and price discounts will be accounted for on the SBT Accounting system at the Bend office.
5.4.3 Positioning Statement
For climbers who need a place to stop for gear and coffee near Smith Rock, The Boulder Stop offers high quality climbing gear, gourmet espresso drinks, and a comfortable place to meet and talk. Unlike our competitors, our store is near the park and offers exactly what most climbers and tourists need.
5.4.4 Pricing Strategy
We will encourage impulse buying, therefore it is important that we maintain a flexible pricing strategy.
- Our pricing strategy will be based on competitive parity guidelines. We will not exceed competitors’ prices by more than 10%, and if a customer sees a price elsewhere for less, we will give it to them for that price.
- Price says a lot about a product. The products that are innovative and not available elsewhere in the region will be marked up to meet the demand curve. We are not afraid of premium pricing a premium product.
- Espresso beverages will be priced slightly above the industry average. Although we will still be make money off our house coffee (not espresso), we consider this a “Loss Leader” product. WOM advertising brings customers in for the house coffee, simply to make them aware of our additional products and services.
5.5 Sales Strategy
We will promote to the Weekend warriors by hosting fun events like the “Fun Summer Climb ’98”. Our part-time sales clerks, also trained in the ways of promotional tactics, will call businesses within the Bend area and establish additional sponsors for these events. They will close the sale immediately if possible, enter the closure into the [Omitted] software accounting system, and provide post sales follow-up.
For in store sales, our strategy will be to maintain as much on-site point-of-purchase literature as is physically possible. Our part-timers will be responsible for informing customers of the products and creating the best fit between customer and product. Our salespeople will understand that selling is about filling a need, not pressuring the customer to buy. 70-80% of returns will be sent back to the distributor or vendor.
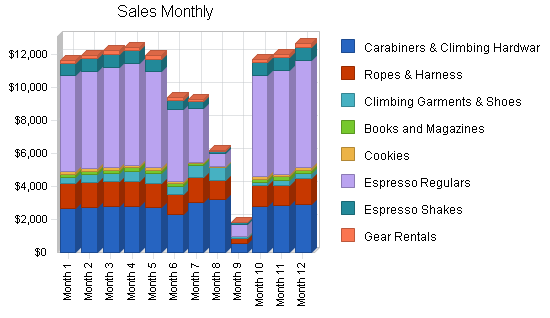
5.5.1 Sales Forecast
The following table and chart give a run down on forecasted sales. We expect sales to increase at a rate of 1-2% per month for each product in the first few months.
November through January may be slow months for The Boulder Stop. However, if we get our name out our target market we might benefit from holiday gift purchases of hardware and garments. For February through March, we expect 1% monthly sales growth becoming 2% growth as we reach the second summer. In 1999 and 2000, we expect solid 20-25% sales growth as The Boulder Stop becomes well-known in Central Oregon. 1999 and 2000 costs will decrease 4-7% due to lower agency and efficiency costs.
Note: For company purchases, the per-unit price of inventory purchases includes cost of shipping.

| Sales Forecast | |||
| Year 1 | Year 2 | Year 3 | |
| Sales | |||
| Carabiners & Climbing Hardware | $31,094 | $40,876 | $60,176 |
| Ropes & Harness | $15,893 | $18,749 | $21,686 |
| Climbing Garments & Shoes | $5,500 | $7,000 | $8,500 |
| Books and Magazines | $1,803 | $2,158 | $2,697 |
| Cookies | $1,573 | $1,888 | $2,360 |
| Espresso Regulars | $57,695 | $69,233 | $86,542 |
| Espresso Shakes | $7,418 | $8,901 | $11,127 |
| Gear Rentals | $1,960 | $2,353 | $2,941 |
| Total Sales | $122,936 | $151,158 | $196,029 |
| Direct Cost of Sales | Year 1 | Year 2 | Year 3 |
| Carabiners & Climbing Hardware | $12,438 | $16,350 | $24,070 |
| Ropes & Harness | $6,357 | $7,500 | $8,674 |
| Climbing Garments & Shoes | $1,375 | $3,500 | $4,250 |
| Books and Magazines | $1,098 | $1,170 | $995 |
| Cookies | $389 | $673 | $572 |
| Espresso Regulars | $17,973 | $27,134 | $23,064 |
| Espresso Shakes | $3,193 | $4,092 | $3,479 |
| Gear Rentals | $900 | $1,158 | $984 |
| Subtotal Direct Cost of Sales | $43,723 | $61,577 | $66,089 |
5.5.2 Sales Programs
Sales programs will include sales awards for highest sales and customer service awards for those employees who best exemplify The Boulder Stop’s commitment to customers. The owner will award these valuable employees yearly with a $200-300 vacation to the Sunriver Resort in Bend.
- We will request rebate info from manufacturers and use those rebates to drive traffic to the store. We will also offer coupons in local area newspapers. These coupons will offer buyers from 100% to 50% off any espresso drink and/or buy one get one free espresso programs.
- We will offer gear rentals all week. This will let climbers who don’t have 100% of the gear climb with their friends, creating goodwill and repeat customers. We will not rent carabiners, ropes, or cams; only shoes, bags, and helmets.
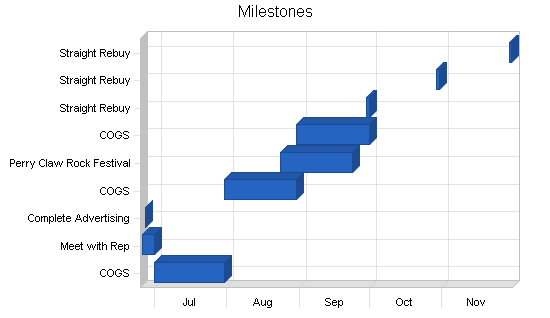
5.6 Milestones
The milestone table shows purchasing, sales, and marketing goals. The owner will conduct straight rebuys while touching base with the Espresso Harvest. We have paid a deposit of $700 (06/28/97) to establish a 30-day grace period on all purchases from Espresso Harvest. There is no franchise fee and Espresso Harvest will donate advertising, consulting, and literature, provided that all 40% of sales from Espresso Harvest mugs, cups, and T-shirts go directly to Espresso Harvest, Inc.
| Milestones | |||||
| Milestone | Start Date | End Date | Budget | Manager | Department |
| COGS | 6/30/1998 | 7/30/1998 | $4,000 | Luke Walsh | Purchasing |
| Meet with Rep | 6/25/1998 | 6/30/1998 | $700 | Luke Walsh | Sales |
| Complete Advertising | 6/26/1998 | 6/26/1998 | $500 | Luke Walsh | Marketing |
| COGS | 7/30/1998 | 8/30/1998 | $7,000 | Luke Walsh | Purchasing |
| Perry Claw Rock Festival | 8/23/1998 | 9/23/1998 | $650 | Luke Walsh | Marketing |
| COGS | 8/30/1998 | 9/30/1998 | $4,000 | Luke Walsh | Purchasing |
| Straight Rebuy | 9/29/1998 | 9/30/1998 | $4,000 | Luke Walsh | Purchasing |
| Straight Rebuy | 10/29/1998 | 10/30/1998 | $2,500 | Luke Walsh | Purchasing |
| Straight Rebuy | 11/29/1998 | 11/30/1998 | $500 | Luke Walsh | Purchasing |
| Totals | $23,850 | ||||
Management Summary
The owner of The Boulder Stop believes very strongly that relationships should be forthright, work should be structured with enough room for creativity, and pay should be commensurate with the amount and quality of work completed. The company is young enough that the only manager that this philosophy applies to IS the President.
The President will assess the productivity of the two part-time employees every six months.
6.1 Organizational Structure
The Boulder Stop is not departmentalized. The owner, Luke Walsh, is also the President, CFO, and lead manager. The company makes all decisions in accordance with the company mission. Employees are given specific tasks based upon their creativity, knowledge, and social ability.
6.2 Management Team
Luke Walsh: Manager and founder.
Luke spent four years selling shoes and apparel for Nordstrom, Inc. He graduated from the University of Oregon in 1997 with a degree in Business Management. Luke’s success at Nordstrom, the University, and in building a network of close friends has hinged upon his “common sense” approach to solving ambiguous problems, his ability to identify strengths and weaknesses in the marketplace and exploit them, as well as his commitment to building strong relationships through trust, not politics. These skills, combined with formal business training make him an ideal community leader and business owner.
6.3 Personnel Plan
The personnel plan is included in the following table. It shows the owner’s salary followed by two part-time salaries for espresso servers/gear experts. Part-time employees will not be included in the profit-sharing program until they have worked with the company for twelve months. All PT employees will start at $8/hr.
| Personnel Plan | |||
| Year 1 | Year 2 | Year 3 | |
| Owner | $36,000 | $36,000 | $40,000 |
| Part-time Employee #1 | $4,700 | $4,935 | $5,182 |
| Part-time Employee #2 | $4,700 | $4,935 | $5,182 |
| Total People | 3 | 3 | 3 |
| Total Payroll | $45,400 | $45,870 | $50,364 |
Financial Plan
- Growth will be moderate, cash balance always positive.
- Marketing will remain at or below 15% of sales.
- The company will invest residual profits into company expansion and personnel.
7.1 Important Assumptions
We do not sell anything on credit. The personnel burden is very low because benefits are not paid to part-timers. And the short-term interest rate is extra ordinarily low because of the owner’s long-standing relationship with the USAA Credit Union.
| General Assumptions | |||
| Year 1 | Year 2 | Year 3 | |
| Plan Month | 1 | 2 | 3 |
| Current Interest Rate | 7.00% | 7.00% | 7.00% |
| Long-term Interest Rate | 7.50% | 7.50% | 7.50% |
| Tax Rate | 30.00% | 30.00% | 30.00% |
| Other | 0 | 0 | 0 |
7.2 Key Financial Indicators
The following chart shows that inventory turns speed up as sales increase. This correlation is important when evaluating past inventory control techniques.

7.3 Break-even Analysis
The chart and table below show our projected break-even point.

| Break-even Analysis | |
| Monthly Revenue Break-even | $9,336 |
| Assumptions: | |
| Average Percent Variable Cost | 36% |
| Estimated Monthly Fixed Cost | $6,016 |
7.4 Projected Cash Flow
We are positioning ourselves in the market as a medium risk concern with steady cash flows. Accounts payable is paid at the end of each month while sales are in cash, this gives The Boulder Stop an excellent cash flow structure. Solid Net Working Capital and intelligent marketing will secure a strong cash balance by January 1, 2000. Any amounts above $10,000 will be invested into semi-liquid stock portfolios to decrease the opportunity cost of cash held. The interest will show up as – Dividends in the Cash Flow table and will be updated quarterly.

| Pro Forma Cash Flow | |||
| Year 1 | Year 2 | Year 3 | |
| Cash Received | |||
| Cash from Operations | |||
| Cash Sales | $122,936 | $151,158 | $196,029 |
| Subtotal Cash from Operations | $122,936 | $151,158 | $196,029 |
| Additional Cash Received | |||
| Sales Tax, VAT, HST/GST Received | $0 | $0 | $0 |
| New Current Borrowing | $0 | $0 | $0 |
| New Other Liabilities (interest-free) | $0 | $0 | $0 |
| New Long-term Liabilities | $0 | $0 | $0 |
| Sales of Other Current Assets | $0 | $0 | $0 |
| Sales of Long-term Assets | $0 | $0 | $0 |
| New Investment Received | $2,000 | $0 | $0 |
| Subtotal Cash Received | $124,936 | $151,158 | $196,029 |
| Expenditures | Year 1 | Year 2 | Year 3 |
| Expenditures from Operations | |||
| Cash Spending | $45,400 | $45,870 | $50,364 |
| Bill Payments | $63,201 | $94,460 | $108,279 |
| Subtotal Spent on Operations | $108,601 | $140,330 | $158,643 |
| Additional Cash Spent | |||
| Sales Tax, VAT, HST/GST Paid Out | $0 | $0 | $0 |
| Principal Repayment of Current Borrowing | $0 | $0 | $0 |
| Other Liabilities Principal Repayment | $0 | $0 | $0 |
| Long-term Liabilities Principal Repayment | $2,640 | $2,640 | $2,640 |
| Purchase Other Current Assets | $0 | $0 | $0 |
| Purchase Long-term Assets | $0 | $0 | $0 |
| Dividends | $0 | $0 | $0 |
| Subtotal Cash Spent | $111,241 | $142,970 | $161,283 |
| Net Cash Flow | $13,695 | $8,188 | $34,746 |
| Cash Balance | $16,695 | $24,882 | $59,629 |
7.5 Projected Profit and Loss
We predict advertising costs and consulting costs will go up in the next three years. This will give The Boulder Stop a strong profit-to-sales ratio % by the year 2000. Normally, a start-up concern will operate with negative profits through the first two years. We will avoid that kind of operating loss by knowing our competitors, our target markets, industry direction, and the products we sell.
Note that we predict we will exceed our gross margin % objective by the year 2000.


| Pro Forma Profit and Loss | |||
| Year 1 | Year 2 | Year 3 | |
| Sales | $122,936 | $151,158 | $196,029 |
| Direct Cost of Sales | $43,723 | $61,577 | $66,089 |
| Other Costs of Sales | $0 | $0 | $0 |
| Total Cost of Sales | $43,723 | $61,577 | $66,089 |
| Gross Margin | $79,213 | $89,581 | $129,940 |
| Gross Margin % | 64.43% | 59.26% | 66.29% |
| Expenses | |||
| Payroll | $45,400 | $45,870 | $50,364 |
| Marketing/Promotion | $4,040 | $3,100 | $3,500 |
| Depreciation | $0 | $0 | $0 |
| Rent | $20,400 | $21,012 | $21,642 |
| Utilities | $1,569 | $1,616 | $1,665 |
| Insurance | $780 | $803 | $828 |
| Payroll Taxes | $0 | $0 | $0 |
| Other | $0 | $0 | $0 |
| Total Operating Expenses | $72,189 | $72,401 | $77,999 |
| Profit Before Interest and Taxes | $7,024 | $17,180 | $51,941 |
| EBITDA | $7,024 | $17,180 | $51,941 |
| Interest Expense | ($107) | ($297) | ($495) |
| Taxes Incurred | $2,139 | $5,243 | $15,731 |
| Net Profit | $4,992 | $12,234 | $36,705 |
| Net Profit/Sales | 4.06% | 8.09% | 18.72% |
7.6 Projected Balance Sheet
All of our tables will be updated monthly to reflect past performance and future assumptions. Future assumptions will not be based on past performance but rather economic cycle activity, regional industry strength, and future cash flow possibilities. We expect solid growth in Net Worth beyond the year 2000.
| Pro Forma Balance Sheet | |||
| Year 1 | Year 2 | Year 3 | |
| Assets | |||
| Current Assets | |||
| Cash | $16,695 | $24,882 | $59,629 |
| Inventory | $4,882 | $6,876 | $7,380 |
| Other Current Assets | $1,000 | $1,000 | $1,000 |
| Total Current Assets | $22,577 | $32,758 | $68,008 |
| Long-term Assets | |||
| Long-term Assets | $0 | $0 | $0 |
| Accumulated Depreciation | $0 | $0 | $0 |
| Total Long-term Assets | $0 | $0 | $0 |
| Total Assets | $22,577 | $32,758 | $68,008 |
| Liabilities and Capital | Year 1 | Year 2 | Year 3 |
| Current Liabilities | |||
| Accounts Payable | $7,225 | $7,812 | $8,997 |
| Current Borrowing | $0 | $0 | $0 |
| Other Current Liabilities | $0 | $0 | $0 |
| Subtotal Current Liabilities | $7,225 | $7,812 | $8,997 |
| Long-term Liabilities | ($2,640) | ($5,280) | ($7,920) |
| Total Liabilities | $4,585 | $2,532 | $1,077 |
| Paid-in Capital | $29,000 | $29,000 | $29,000 |
| Retained Earnings | ($16,000) | ($11,008) | $1,226 |
| Earnings | $4,992 | $12,234 | $36,705 |
| Total Capital | $17,992 | $30,226 | $66,931 |
| Total Liabilities and Capital | $22,577 | $32,758 | $68,008 |
| Net Worth | $17,992 | $30,226 | $66,931 |
7.7 Business Ratios
We expect our net profit margin, gross margin, and ROA to increase steadily over the three-year period. ROE will decrease due to lower equity needs and higher cash inflow. Our net working capital will increase significantly by year three, proving that we have the cash flows to remain a going concern. The following table shows these important financial ratios. NAICS code 451110, Sporting Goods Stores, used for industry profile comparisons.
| Ratio Analysis | ||||
| Year 1 | Year 2 | Year 3 | Industry Profile | |
| Sales Growth | 0.00% | 22.96% | 29.68% | 6.95% |
| Percent of Total Assets | ||||
| Inventory | 21.63% | 20.99% | 10.85% | 32.04% |
| Other Current Assets | 4.43% | 3.05% | 1.47% | 23.52% |
| Total Current Assets | 100.00% | 100.00% | 100.00% | 89.81% |
| Long-term Assets | 0.00% | 0.00% | 0.00% | 10.19% |
| Total Assets | 100.00% | 100.00% | 100.00% | 100.00% |
| Current Liabilities | 32.00% | 23.85% | 13.23% | 36.90% |
| Long-term Liabilities | -11.69% | -16.12% | -11.65% | 9.38% |
| Total Liabilities | 20.31% | 7.73% | 1.58% | 46.28% |
| Net Worth | 79.69% | 92.27% | 98.42% | 53.72% |
| Percent of Sales | ||||
| Sales | 100.00% | 100.00% | 100.00% | 100.00% |
| Gross Margin | 64.43% | 59.26% | 66.29% | 31.30% |
| Selling, General & Administrative Expenses | 60.37% | 51.17% | 47.56% | 16.09% |
| Advertising Expenses | 0.00% | 0.00% | 0.00% | 1.20% |
| Profit Before Interest and Taxes | 5.71% | 11.37% | 26.50% | 2.45% |
| Main Ratios | ||||
| Current | 3.12 | 4.19 | 7.56 | 2.16 |
| Quick | 2.45 | 3.31 | 6.74 | 1.18 |
| Total Debt to Total Assets | 20.31% | 7.73% | 1.58% | 51.78% |
| Pre-tax Return on Net Worth | 39.64% | 57.82% | 78.34% | 7.58% |
| Pre-tax Return on Assets | 31.59% | 53.35% | 77.10% | 15.72% |
| Additional Ratios | Year 1 | Year 2 | Year 3 | |
| Net Profit Margin | 4.06% | 8.09% | 18.72% | n.a |
| Return on Equity | 27.75% | 40.47% | 54.84% | n.a |
| Activity Ratios | ||||
| Inventory Turnover | 10.66 | 10.47 | 9.27 | n.a |
| Accounts Payable Turnover | 9.75 | 12.17 | 12.17 | n.a |
| Payment Days | 27 | 29 | 28 | n.a |
| Total Asset Turnover | 5.45 | 4.61 | 2.88 | n.a |
| Debt Ratios | ||||
| Debt to Net Worth | 0.25 | 0.08 | 0.02 | n.a |
| Current Liab. to Liab. | 1.58 | 3.09 | 8.35 | n.a |
| Liquidity Ratios | ||||
| Net Working Capital | $15,352 | $24,946 | $59,011 | n.a |
| Interest Coverage | 0.00 | 0.00 | 0.00 | n.a |
| Additional Ratios | ||||
| Assets to Sales | 0.18 | 0.22 | 0.35 | n.a |
| Current Debt/Total Assets | 32% | 24% | 13% | n.a |
| Acid Test | 2.45 | 3.31 | 6.74 | n.a |
| Sales/Net Worth | 6.83 | 5.00 | 2.93 | n.a |
| Dividend Payout | 0.00 | 0.00 | 0.00 | n.a |
Appendix
| Sales Forecast | |||||||||||||
| Month 1 | Month 2 | Month 3 | Month 4 | Month 5 | Month 6 | Month 7 | Month 8 | Month 9 | Month 10 | Month 11 | Month 12 | ||
| Sales | |||||||||||||
| Carabiners & Climbing Hardware | 0% | $2,680 | $2,714 | $2,765 | $2,783 | $2,694 | $2,270 | $3,000 | $3,200 | $514 | $2,783 | $2,818 | $2,873 |
| Ropes & Harness | 0% | $1,480 | $1,500 | $1,530 | $1,540 | $1,488 | $1,241 | $1,556 | $1,139 | $325 | $1,240 | $1,261 | $1,593 |
| Climbing Garments & Shoes | 0% | $400 | $500 | $500 | $600 | $600 | $500 | $700 | $800 | $100 | $200 | $300 | $300 |
| Books and Magazines | 0% | $180 | $188 | $189 | $191 | $181 | $136 | $102 | $26 | $23 | $191 | $195 | $201 |
| Cookies | 0% | $158 | $161 | $165 | $167 | $159 | $119 | $89 | $22 | $20 | $167 | $170 | $176 |
| Espresso Regulars | 0% | $5,775 | $5,891 | $6,067 | $6,128 | $5,821 | $4,366 | $3,275 | $819 | $737 | $6,128 | $6,250 | $6,438 |
| Espresso Shakes | 0% | $743 | $757 | $780 | $788 | $748 | $561 | $421 | $105 | $95 | $788 | $804 | $828 |
| Gear Rentals | 0% | $200 | $204 | $210 | $212 | $202 | $151 | $113 | $28 | $26 | $200 | $204 | $210 |
| Total Sales | $11,616 | $11,915 | $12,206 | $12,409 | $11,893 | $9,344 | $9,256 | $6,139 | $1,840 | $11,697 | $12,002 | $12,619 | |
| Direct Cost of Sales | Month 1 | Month 2 | Month 3 | Month 4 | Month 5 | Month 6 | Month 7 | Month 8 | Month 9 | Month 10 | Month 11 | Month 12 | |
| Carabiners & Climbing Hardware | $1,072 | $1,086 | $1,106 | $1,113 | $1,078 | $908 | $1,200 | $1,280 | $206 | $1,113 | $1,127 | $1,149 | |
| Ropes & Harness | $592 | $600 | $612 | $616 | $595 | $496 | $622 | $456 | $130 | $496 | $504 | $637 | |
| Climbing Garments & Shoes | $100 | $125 | $125 | $150 | $150 | $125 | $175 | $200 | $25 | $50 | $75 | $75 | |
| Books and Magazines | $120 | $118 | $115 | $113 | $107 | $80 | $60 | $15 | $14 | $116 | $118 | $122 | |
| Cookies | $42 | $41 | $40 | $40 | $38 | $28 | $21 | $5 | $5 | $42 | $43 | $44 | |
| Espresso Regulars | $1,980 | $1,940 | $1,902 | $1,864 | $1,770 | $1,328 | $996 | $249 | $224 | $1,863 | $1,900 | $1,957 | |
| Espresso Shakes | $363 | $256 | $349 | $342 | $325 | $243 | $183 | $46 | $41 | $340 | $347 | $358 | |
| Gear Rentals | $92 | $94 | $96 | $97 | $93 | $69 | $52 | $13 | $12 | $92 | $94 | $96 | |
| Subtotal Direct Cost of Sales | $4,361 | $4,260 | $4,345 | $4,335 | $4,156 | $3,277 | $3,309 | $2,264 | $657 | $4,112 | $4,209 | $4,438 | |
| Personnel Plan | |||||||||||||
| Month 1 | Month 2 | Month 3 | Month 4 | Month 5 | Month 6 | Month 7 | Month 8 | Month 9 | Month 10 | Month 11 | Month 12 | ||
| Owner | 0% | $3,000 | $3,000 | $3,000 | $3,000 | $3,000 | $3,000 | $3,000 | $3,000 | $3,000 | $3,000 | $3,000 | $3,000 |
| Part-time Employee #1 | 0% | $500 | $500 | $500 | $500 | $500 | $550 | $0 | $0 | $0 | $550 | $550 | $550 |
| Part-time Employee #2 | 0% | $500 | $500 | $500 | $500 | $500 | $550 | $0 | $0 | $0 | $550 | $550 | $550 |
| Total People | 3 | 3 | 3 | 3 | 3 | 3 | 1 | 1 | 1 | 3 | 3 | 3 | |
| Total Payroll | $4,000 | $4,000 | $4,000 | $4,000 | $4,000 | $4,100 | $3,000 | $3,000 | $3,000 | $4,100 | $4,100 | $4,100 | |
| Pro Forma Profit and Loss | |||||||||||||
| Month 1 | Month 2 | Month 3 | Month 4 | Month 5 | Month 6 | Month 7 | Month 8 | Month 9 | Month 10 | Month 11 | Month 12 | ||
| Sales | $11,616 | $11,915 | $12,206 | $12,409 | $11,893 | $9,344 | $9,256 | $6,139 | $1,840 | $11,697 | $12,002 | $12,619 | |
| Direct Cost of Sales | $4,361 | $4,260 | $4,345 | $4,335 | $4,156 | $3,277 | $3,309 | $2,264 | $657 | $4,112 | $4,209 | $4,438 | |
| Other Costs of Sales | $0 | $0 | $0 | $0 | $0 | $0 | $0 | $0 | $0 | $0 | $0 | $0 | |
| Total Cost of Sales | $4,361 | $4,260 | $4,345 | $4,335 | $4,156 | $3,277 | $3,309 | $2,264 | $657 | $4,112 | $4,209 | $4,438 | |
| Gross Margin | $7,255 | $7,655 | $7,861 | $8,074 | $7,737 | $6,067 | $5,947 | $3,875 | $1,183 | $7,585 | $7,793 | $8,181 | |
| Gross Margin % | 62.46% | 64.25% | 64.40% | 65.06% | 65.06% | 64.93% | 64.25% | 63.13% | 64.32% | 64.84% | 64.93% | 64.83% | |
| Expenses | |||||||||||||
| Payroll | $4,000 | $4,000 | $4,000 | $4,000 | $4,000 | $4,100 | $3,000 | $3,000 | $3,000 | $4,100 | $4,100 | $4,100 | |
| Marketing/Promotion | $700 | $500 | $550 | $650 | $250 | $250 | $0 | $0 | $0 | $540 | $250 | $350 | |
| Depreciation | $0 | $0 | $0 | $0 | $0 | $0 | $0 | $0 | $0 | $0 | $0 | $0 | |
| Rent | $1,700 | $1,700 | $1,700 | $1,700 | $1,700 | $1,700 | $1,700 | $1,700 | $1,700 | $1,700 | $1,700 | $1,700 | |
| Utilities | $120 | $121 | $121 | $122 | $122 | $122 | $160 | $160 | $160 | $115 | $123 | $123 | |
| Insurance | $70 | $70 | $70 | $70 | $70 | $70 | $50 | $50 | $50 | $70 | $70 | $70 | |
| Payroll Taxes | 15% | $0 | $0 | $0 | $0 | $0 | $0 | $0 | $0 | $0 | $0 | $0 | $0 |
| Other | $0 | $0 | $0 | $0 | $0 | $0 | $0 | $0 | $0 | $0 | $0 | $0 | |
| Total Operating Expenses | $6,590 | $6,391 | $6,441 | $6,542 | $6,142 | $6,242 | $4,910 | $4,910 | $4,910 | $6,525 | $6,243 | $6,343 | |
| Profit Before Interest and Taxes | $665 | $1,264 | $1,420 | $1,532 | $1,595 | ($175) | $1,037 | ($1,035) | ($3,727) | $1,060 | $1,550 | $1,838 | |
| EBITDA | $665 | $1,264 | $1,420 | $1,532 | $1,595 | ($175) | $1,037 | ($1,035) | ($3,727) | $1,060 | $1,550 | $1,838 | |
| Interest Expense | ($1) | ($3) | ($4) | ($6) | ($7) | ($8) | ($10) | ($11) | ($12) | ($14) | ($15) | ($17) | |
| Taxes Incurred | $200 | $380 | $427 | $461 | $481 | ($50) | $314 | ($307) | ($1,114) | $322 | $470 | $556 | |
| Net Profit | $466 | $887 | $997 | $1,076 | $1,121 | ($117) | $732 | ($717) | ($2,600) | $751 | $1,096 | $1,298 | |
| Net Profit/Sales | 4.02% | 7.44% | 8.17% | 8.67% | 9.43% | -1.25% | 7.91% | -11.67% | -141.30% | 6.42% | 9.13% | 10.29% | |
| Pro Forma Cash Flow | |||||||||||||
| Month 1 | Month 2 | Month 3 | Month 4 | Month 5 | Month 6 | Month 7 | Month 8 | Month 9 | Month 10 | Month 11 | Month 12 | ||
| Cash Received | |||||||||||||
| Cash from Operations | |||||||||||||
| Cash Sales | $11,616 | $11,915 | $12,206 | $12,409 | $11,893 | $9,344 | $9,256 | $6,139 | $1,840 | $11,697 | $12,002 | $12,619 | |
| Subtotal Cash from Operations | $11,616 | $11,915 | $12,206 | $12,409 | $11,893 | $9,344 | $9,256 | $6,139 | $1,840 | $11,697 | $12,002 | $12,619 | |
| Additional Cash Received | |||||||||||||
| Sales Tax, VAT, HST/GST Received | 0.00% | $0 | $0 | $0 | $0 | $0 | $0 | $0 | $0 | $0 | $0 | $0 | $0 |
| New Current Borrowing | $0 | $0 | $0 | $0 | $0 | $0 | $0 | $0 | $0 | $0 | $0 | $0 | |
| New Other Liabilities (interest-free) | $0 | $0 | $0 | $0 | $0 | $0 | $0 | $0 | $0 | $0 | $0 | $0 | |
| New Long-term Liabilities | $0 | $0 | $0 | $0 | $0 | $0 | $0 | $0 | $0 | $0 | $0 | $0 | |
| Sales of Other Current Assets | $0 | $0 | $0 | $0 | $0 | $0 | $0 | $0 | $0 | $0 | $0 | $0 | |
| Sales of Long-term Assets | $0 | $0 | $0 | $0 | $0 | $0 | $0 | $0 | $0 | $0 | $0 | $0 | |
| New Investment Received | $0 | $0 | $0 | $0 | $0 | $0 | $0 | $0 | $2,000 | $0 | $0 | $0 | |
| Subtotal Cash Received | $11,616 | $11,915 | $12,206 | $12,409 | $11,893 | $9,344 | $9,256 | $6,139 | $3,840 | $11,697 | $12,002 | $12,619 | |
| Expenditures | Month 1 | Month 2 | Month 3 | Month 4 | Month 5 | Month 6 | Month 7 | Month 8 | Month 9 | Month 10 | Month 11 | Month 12 | |
| Expenditures from Operations | |||||||||||||
| Cash Spending | $4,000 | $4,000 | $4,000 | $4,000 | $4,000 | $4,100 | $3,000 | $3,000 | $3,000 | $4,100 | $4,100 | $4,100 | |
| Bill Payments | $165 | $5,012 | $6,929 | $7,304 | $7,297 | $6,502 | $4,434 | $5,464 | $2,641 | $1,075 | $9,448 | $6,931 | |
| Subtotal Spent on Operations | $4,165 | $9,012 | $10,929 | $11,304 | $11,297 | $10,602 | $7,434 | $8,464 | $5,641 | $5,175 | $13,548 | $11,031 | |
| Additional Cash Spent | |||||||||||||
| Sales Tax, VAT, HST/GST Paid Out | $0 | $0 | $0 | $0 | $0 | $0 | $0 | $0 | $0 | $0 | $0 | $0 | |
| Principal Repayment of Current Borrowing | $0 | $0 | $0 | $0 | $0 | $0 | $0 | $0 | $0 | $0 | $0 | $0 | |
| Other Liabilities Principal Repayment | $0 | $0 | $0 | $0 | $0 | $0 | $0 | $0 | $0 | $0 | $0 | $0 | |
| Long-term Liabilities Principal Repayment | $220 | $220 | $220 | $220 | $220 | $220 | $220 | $220 | $220 | $220 | $220 | $220 | |
| Purchase Other Current Assets | $0 | $0 | $0 | $0 | $0 | $0 | $0 | $0 | $0 | $0 | $0 | $0 | |
| Purchase Long-term Assets | $0 | $0 | $0 | $0 | $0 | $0 | $0 | $0 | $0 | $0 | $0 | $0 | |
| Dividends | $0 | $0 | $0 | $0 | $0 | $0 | $0 | $0 | $0 | $0 | $0 | $0 | |
| Subtotal Cash Spent | $4,385 | $9,232 | $11,149 | $11,524 | $11,517 | $10,822 | $7,654 | $8,684 | $5,861 | $5,395 | $13,768 | $11,251 | |
| Net Cash Flow | $7,231 | $2,683 | $1,057 | $885 | $376 | ($1,478) | $1,602 | ($2,545) | ($2,021) | $6,302 | ($1,766) | $1,368 | |
| Cash Balance | $10,231 | $12,914 | $13,970 | $14,856 | $15,232 | $13,754 | $15,356 | $12,812 | $10,791 | $17,093 | $15,326 | $16,695 | |
| Pro Forma Balance Sheet | |||||||||||||
| Month 1 | Month 2 | Month 3 | Month 4 | Month 5 | Month 6 | Month 7 | Month 8 | Month 9 | Month 10 | Month 11 | Month 12 | ||
| Assets | Starting Balances | ||||||||||||
| Current Assets | |||||||||||||
| Cash | $3,000 | $10,231 | $12,914 | $13,970 | $14,856 | $15,232 | $13,754 | $15,356 | $12,812 | $10,791 | $17,093 | $15,326 | $16,695 |
| Inventory | $7,000 | $4,797 | $4,686 | $4,780 | $4,769 | $4,571 | $3,605 | $3,640 | $2,490 | $1,833 | $4,523 | $4,629 | $4,882 |
| Other Current Assets | $1,000 | $1,000 | $1,000 | $1,000 | $1,000 | $1,000 | $1,000 | $1,000 | $1,000 | $1,000 | $1,000 | $1,000 | $1,000 |
| Total Current Assets | $11,000 | $16,028 | $18,599 | $19,750 | $20,625 | $20,803 | $18,359 | $19,997 | $16,302 | $13,624 | $22,616 | $20,956 | $22,577 |
| Long-term Assets | |||||||||||||
| Long-term Assets | $0 | $0 | $0 | $0 | $0 | $0 | $0 | $0 | $0 | $0 | $0 | $0 | $0 |
| Accumulated Depreciation | $0 | $0 | $0 | $0 | $0 | $0 | $0 | $0 | $0 | $0 | $0 | $0 | $0 |
| Total Long-term Assets | $0 | $0 | $0 | $0 | $0 | $0 | $0 | $0 | $0 | $0 | $0 | $0 | $0 |
| Total Assets | $11,000 | $16,028 | $18,599 | $19,750 | $20,625 | $20,803 | $18,359 | $19,997 | $16,302 | $13,624 | $22,616 | $20,956 | $22,577 |
| Liabilities and Capital | Month 1 | Month 2 | Month 3 | Month 4 | Month 5 | Month 6 | Month 7 | Month 8 | Month 9 | Month 10 | Month 11 | Month 12 | |
| Current Liabilities | |||||||||||||
| Accounts Payable | $0 | $4,782 | $6,686 | $7,060 | $7,078 | $6,355 | $4,248 | $5,374 | $2,615 | $757 | $9,218 | $6,682 | $7,225 |
| Current Borrowing | $0 | $0 | $0 | $0 | $0 | $0 | $0 | $0 | $0 | $0 | $0 | $0 | $0 |
| Other Current Liabilities | $0 | $0 | $0 | $0 | $0 | $0 | $0 | $0 | $0 | $0 | $0 | $0 | $0 |
| Subtotal Current Liabilities | $0 | $4,782 | $6,686 | $7,060 | $7,078 | $6,355 | $4,248 | $5,374 | $2,615 | $757 | $9,218 | $6,682 | $7,225 |
| Long-term Liabilities | $0 | ($220) | ($440) | ($660) | ($880) | ($1,100) | ($1,320) | ($1,540) | ($1,760) | ($1,980) | ($2,200) | ($2,420) | ($2,640) |
| Total Liabilities | $0 | $4,562 | $6,246 | $6,400 | $6,198 | $5,255 | $2,928 | $3,834 | $855 | ($1,223) | $7,018 | $4,262 | $4,585 |
| Paid-in Capital | $27,000 | $27,000 | $27,000 | $27,000 | $27,000 | $27,000 | $27,000 | $27,000 | $27,000 | $29,000 | $29,000 | $29,000 | $29,000 |
| Retained Earnings | ($16,000) | ($16,000) | ($16,000) | ($16,000) | ($16,000) | ($16,000) | ($16,000) | ($16,000) | ($16,000) | ($16,000) | ($16,000) | ($16,000) | ($16,000) |
| Earnings | $0 | $466 | $1,353 | $2,350 | $3,426 | $4,548 | $4,431 | $5,163 | $4,447 | $1,847 | $2,598 | $3,694 | $4,992 |
| Total Capital | $11,000 | $11,466 | $12,353 | $13,350 | $14,426 | $15,548 | $15,431 | $16,163 | $15,447 | $14,847 | $15,598 | $16,694 | $17,992 |
| Total Liabilities and Capital | $11,000 | $16,028 | $18,599 | $19,750 | $20,625 | $20,803 | $18,359 | $19,997 | $16,302 | $13,624 | $22,616 | $20,956 | $22,577 |
| Net Worth | $11,000 | $11,466 | $12,353 | $13,350 | $14,426 | $15,548 | $15,431 | $16,163 | $15,447 | $14,847 | $15,598 | $16,694 | $17,992 |
| General Assumptions | |||||||||||||
| Month 1 | Month 2 | Month 3 | Month 4 | Month 5 | Month 6 | Month 7 | Month 8 | Month 9 | Month 10 | Month 11 | Month 12 | ||
| Plan Month | 1 | 2 | 3 | 4 | 5 | 6 | 7 | 8 | 9 | 10 | 11 | 12 | |
| Current Interest Rate | 7.00% | 7.00% | 7.00% | 7.00% | 7.00% | 7.00% | 7.00% | 7.00% | 7.00% | 7.00% | 7.00% | 7.00% | |
| Long-term Interest Rate | 7.50% | 7.50% | 7.50% | 7.50% | 7.50% | 7.50% | 7.50% | 7.50% | 7.50% | 7.50% | 7.50% | 7.50% | |
| Tax Rate | 30.00% | 30.00% | 30.00% | 30.00% | 30.00% | 30.00% | 30.00% | 30.00% | 30.00% | 30.00% | 30.00% | 30.00% | |
| Other | 0 | 0 | 0 | 0 | 0 | 0 | 0 | 0 | 0 | 0 | 0 | 0 | |

