
Sportsuchtig
Executive Summary
The purpose of this business plan is to secure a seven-hundred thousand dollar ($700,000 to $800,000) conventional business loan from a financial institution in order to purchase the assets of the business known as Sportsuchtig. It will be purchased by Johnson Sporting Goods, LLC, a limited liability company formed for this purpose by John and Lisa Johnson. The business will continue to be known and operated as Sportsuchtig.
Sportsuchtig sells quality sporting goods equipment for the entire family, primarily focused on and specializing in baseball and softball equipment, apparel and accessories from major manufacturers such as Easton, Louisville Slugger, Wilson, Worth, Mizuno, Miken, and Under Armour. The company was established as a retail store in 1986 and created an Internet sports store in 1996. The company currently operates with 10 employees out of a 7,400 square foot facility which houses the combined retail store, call center, office, and product warehouse. Over the last 3 years the company has averaged $2.5 million in sales and a gross margin of 25%, with 52% of the sales generated by the website and 48% coming from the retail store.
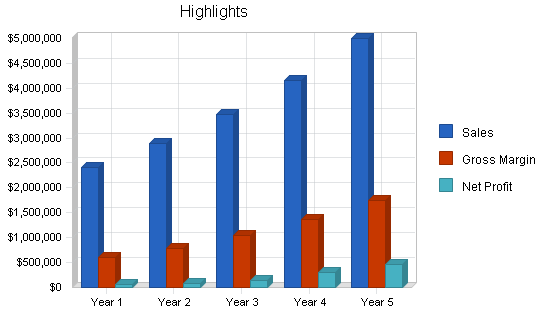
In the last 3 years, Sportsuchtig has generated verifiable pre-tax income averaging $194,000 and total owner’s benefit averaging over $323,000. This is a strong business that is positioned well for accelerated growth. We believe the business can reach revenue levels of over $5 million in 5 years by implementing this business plan. Sales are projected to be flat in year one and then grow at 20% in years 2-5. This growth forecast is based on the assumption that the company acts on these key opportunities:
- Redesign, upgrade and marketing of the Internet store.
- Relocating the existing retail store.
- Adding additional product lines for sports played in other seasons than baseball/softball.
- Creation of an outside sales team to gain a significant share of the team sales market.
- Optimization of inventory purchasing, management and tracking.
We will plan to relocate the business near the end of year 1 which should help position us for increased retail sales beginning in year 2. The website will be redesigned in the first 6 months and the Web marketing strategy will be timed to coincide with the implementation of the new site. Expansion into at least one new product participant segment will be planned for each year, beginning in year 1. An outside sales team manager will be hired in year 1, but ramp-up of the sales team is not planned until early in year 2.
The business will be managed by owner John Johnson who will act as President and CEO. Mr. Johnson’s high technology and sports business backgrounds, coupled with his entrepreneurial experience, makes him the ideal leader to drive this sporting goods retail/internet endeavor. He spent almost 20 years leading research and development efforts for high technology stalwarts such as Lucent Technologies and ;Motorola Systems, and was a founding employee and Vice President of a high-tech startup. Mr. Johnson also founded and currently owns two other businesses, Johnson Enterprises, LLC and Johnson Investments, LLC. Johnson Enterprises, LLC sells, designs, and constructs custom game courts (basketball, tennis, etc.), synthetic putting greens, and sporting goods products. Mr. Johnson received a Bachelor of Science in Computer Science from Stone College in Boulder, Colorado and a Masters in Business Administration from the University of Illinois.
1.1 Objectives
- Maintain or exceed in year 1 the recent two-year levels of sales ($2.5 million), gross margin (25%), and net margin (12%).
- Realize an annual sales growth rate of 20% in years 2-5, reaching over $5 million in sales by the end of year 5.
- Improve gross margins from 25% to 35% by the end of year 5.
- Improve net margins by the end of year 5.
- Redesign and upgrade the Internet e-commerce store by the end of the first year.
- Increase website site traffic 50% and sales 20% in years 1-5 by investing in aggressive Web search optimization and marketing.
- Enhance the retail store location in the second half of year 1 by relocating the current store from its current location to a more prime location in the metropolitan area.
- Establish relationships with local nonprofit organizations, to help underprivileged children build confidence and self esteem through youth sports programs.
- Run the business as a family-run and -oriented business with emphasis on truth, integrity, quality relationships, fun, and giving back to the community.
1.2 Mission
To become the sports equipment supplier of choice, based on product expertise, price, quality, and level of service, by developing a long term relationship with our customers. Become the “family expert” for sporting goods equipment by treating customers like friends and family and by maintaining an experienced, knowledgeable, and caring staff that can help the customer make the right purchase for them, whether they are individuals outfitting their family, or coaches, athletic directors and league representatives supplying their teams.
1.3 Keys to Success
- Upgrade the website so that it is more professional and user friendly, offers incentives, features, and promotions to draw customers back to the site repeatedly, and is optimized for maximum search results.
- Relocate the existing retail store to a more densely populated, growing location.
- Negotiate optimal agreements with the major suppliers that allow us to improve margins, hold down costs, and maximize the control and turnover of our inventory.
- Implement a state-of-the-art, computerized inventory management system to improve inventory turnover and tracking.
- Expand the product line by offering equipment for additional sports that are typically in demand during current Sportsuchtig slow seasons.
- Create an outside sales team that calls on schools, leagues, and associations and is known for product expertise and top service.
- Train employees on product features and on how to provide family-oriented sales and customer support.
- Train an existing employee, or hire from outside, a store manager to cover for and be the backup for the Owner/President.
- Advertise and market in areas where our target customer base can learn about our retail and internet stores.
- Build a reliable operations infrastructure that is ready to serve customers, prepare accurate billing and accounting, follow up on orders and shipping, manage the Web site, and maintain a close watch on expenses and collection of accounts receivable.
- Be an active member of the community by participating in nonprofit activities and by sponsoring local sports teams, leagues, and tournaments.
- Ensure through daily management practices that the values of The Sportsuchtig mission are followed, so that a successful and growth-oriented business is developed and maintained.
Company Summary
Sportsuchtig sells quality sporting goods equipment for the entire family, primarily focused on and specializing in baseball and softball equipment, apparel and accessories (although we do sell a small amount of volleyball, basketball and football equipment). The company was established as a retail store in 1986 and created an Internet sports store in 1998. The company currently operates out of a 7,400 square foot facility which houses the combined retail store, call center, office, and product warehouse. Over the last 3 years, the company has averaged $2.5 million in sales and a gross margin of 25%, with 52% of the sales generated by the website and 48% coming from the retail store.
The retail store is open Monday through Saturday from 9:00 am to 7:00 pm and is closed on Sunday. Orders are retrieved four to six times daily except on Sunday and the 800 call center number is staffed during retail store hours.
The growth opportunities for Sportsuchtig are many, including widening the product offerings to include other sports, enhancing the Website for ease of use and presentation, optimizing Web search engine results, relocating the retail store to a location that can tap into the fast developing residential areas in the metropolitan region, staffing a sales force to aggressively pursue team uniform sales, and implementing a consistent, integrated marketing plan.

2.1 Start-up Summary
The startup expenses include Legal Fees for services in regards to the purchase of the business such as the Letter of Intent, the Asset Purchase Agreement, due diligence activities, and the business organization. The Accounting fees are for services regarding the business evaluation and due diligence activities. Rent and insurance for the retail facility must be prepaid before the business takeover. Also listed are expenses related to the creation and production of this business plan.
The startup assets listed are the assets that are being purchased. The purchase price of $1 million for the business is based almost entirely on the value of the assets. The large majority of the company assets, almost $900,000 worth, will reside in inventory. The $25,000 of current assets include furniture, fixtures, display cases, and accounts receivable. The $25,000 of long term assets include 7 computers and a server, printers, and associated software.
The starting cash of $50,000 is working capital to cover 2 months of expenses ($45,000), to provide for initial marketing efforts and as a contingency fund to cover unforEseen expenses related to the takeover of the business.
The purpose of this business plan is to secure a $700,000 conventional or SBA loan for the purchase of the business. The remainder of the purchase and startup costs ($300,000) will be financed through owner investment.

| Start-up | |
| Requirements | |
| Start-up Expenses | |
| Rent | $6,000 |
| Insurance | $2,000 |
| Legal Fees | $10,000 |
| Business Plan production | $100 |
| Accounting Fees | $1,000 |
| Business Plan Software | $200 |
| Loan Closing Costs | $20,000 |
| Other | $1,000 |
| Total Start-up Expenses | $40,300 |
| Start-up Assets | |
| Cash Required | $50,000 |
| Start-up Inventory | $900,000 |
| Other Current Assets | $25,000 |
| Long-term Assets | $25,000 |
| Total Assets | $1,000,000 |
| Total Requirements | $1,040,300 |
2.2 Company Ownership
The assets of Sportsuchtig are being purchased by John and Lisa Johnson. The company will be organized initially as a Limited Liability Corporation named Johnson Sporting Goods, LLC, doing business as Sportsuchtig.
Products
Sportsuchtig will sell the latest and most popular name-brand sporting goods, apparel, and accessories. Consumers will be educated as to the proper size, style, fit, and design needed for their particular use. Initially these sporting goods will be for the sports of baseball, softball, volleyball, basketball, and football, with the focus primarily on softball and baseball.
The products are purchased from the top manufacturers in the world, such as Easton, Louisville Slugger, Wilson, Worth, Mizuno, Miken, Under Armour, Jugs, Adams, ATEC, Playmaker, TrueSports, Bike. Inventory is tracked through our POS cash register and computerized tracking system. Each day we will be aware of the style, size, and quantity of every item sold in the retail and internet stores.
The general list of products initially to be offered includes the following:
Baseball/Softball Equipment
Baseball Bats, Baseball Gloves, Batting Helmets, Batting Tees, Bases, Catcher’s Equipment, Bat Hangouts, Batting Gloves, Easy Toss Machine, Instant Screens/Nets, Hit-N-Stik, Equipment Bags, Hats, Training Aides, Sunglasses, Baseballs, Softballs, Shoes/Cleats, Umpire Equipment, Ball Buckets, Eye Black, Scorebooks, Pitching Machines, Backstop/Batting Cages, Ball Feeders, Protective Screens, Field Maintenance Equipment, Ankle/Knee Braces, Athletic Supporters, Sliding Shorts, Coaches’ Shorts, Coaching/Training Aids & Videos, Wraps, Ice Packs, First Aid, Mouth/Lip Guards, and Protective Aids.
Baseball/ Softball Uniforms & Apparel
Uniforms for Men, Women and Youth. Uniform Jerseys, Uniform Pants, Uniform Hats, Socks, and Belts. Custom screen printing of uniform names and numbers. Under Armour Gear – Heat, Cold, All Season, Turf, Loose, Performance, and Street. Manufacturer T-shirts and caps.
Volleyball
Volleyballs, Volleyball Bags, Portable Scoreboard, Knee Pads, ClipBoard, Volleyball Carts.
Basketball
Basketballs, Basketball Systems/Hoops, Basketball Courts, Basketball Fencing, Lighting Systems.
Football
Footballs, Shoulder Pads, Knee Pads, Thigh Pads, Helmets, Gloves, and WristCoach.
Golf
Synthetic putting greens.
Future Products
After the assumption of the business, we will look to increase our product line laterally by offering additional product categories. Initially, this will be done to increase revenue in months that are historically slower for Sportsuchtig. We will also significantly grow the existing Volleyball, Basketball, and Football lines in year 1.
We will evaluate introducing products for the sports of Soccer, Field Hockey, Lacrosse, Hockey, Golf, Swimming, Tennis, Wrestling, Running and Cheerleading. We will also evaluate the introduction of Major League and College sports team logo apparel such as NFL, NBA, MLB, NHL, NCAA and NHL.
In addition, in order to serve the older and more affluent sports participant, we will evaluate less vigorous and more relaxing sports lines such as camping, fishing, and golf.
Market Analysis Summary
The sporting goods market as a whole is a multi-billion dollar industry, with retail sales of sporting goods reaching $45.8 billion in 2003. Sales are expected to grow 2% in 2004 to $46.7 billion. The personal consumption of sporting goods is forecast to grow at an annual compounded rate of 4.8% between 2004 and 2007. Retail sales at sporting goods stores are very sensitive to the health of the economy, because most sports are a leisure activity. Spending on sporting goods correlates strongly with consumer confidence and level of personal disposable income.
The sporting goods market has a myriad of segments that can be categorized by product, sport, geography, behavior, participation, organization and standard demographics. Demographics play a big part in sporting goods sales, since population growth and age groups distinctly impact sport participation.
Our main sales categories break down customer groups by Sports Participation – ie., for which sport(s) the person is buying equipment. These customers have needs based on the specific sport(s) in which they participate. For example, Baseball participants are looking specifically for baseball equipment, uniforms, training aids, etc. We will initially focus on players of Baseball, Softball, Volleyball, Basketball, and Football.
However, in terms of marketing, we will take different approaches to attracting the attention of potential customers based on their relation to the sport or sports player (customer type), and on their buying method/location (retail/online).
- Customer Type – These customers have needs based upon the type of role they play in regards to the sports participants. For example, many times those making sporting goods purchases are not those actually participating in the sport, but instead are parents, athletic directors, and coaches. These segments include: Individual Participants, Parents, League Representatives, Independent Team Coaches, School Athletic Coaches and Directors, Sports Performance Businesses.
- Retail/Online – For retail stores, geographic and demographic divisions are critical, especially in understanding the different needs of our local and online customers. Appeals to soccer moms work one way in the local paper, where the convenience factor is a nearby location with great customer service, and a different way online, where convenience may come in the form of free shipping for larger orders, or free telephone assistance in choosing a size.
We believe that Sportsuchtig, with its multiple channels of operation – retail and internet stores – is well positioned to strategically attack these markets. We will first look to increase growth in the market segments we currently serve (baseball, softball) and then look to aggressively penetrate and increase sales to other sports participant segments, especially those that cater to the athletic tastes of aging baby boomers. There is great opportunity for growth in the “customer type” segments; we will initially look to increase our exposure and products to these segments, especially League Representatives and Independent Team Coaches in the metropolitan area. We will approach the 256 million participants nationwide through the internet store, which will be enhanced with an improved user experience and an aggressive Web marketing strategy.
4.1 Market Segmentation
Sportsuchtig’ market is both nationwide (even some international) via the internet store, and local, via the retail store, in the local metropolitan region. Market segmentation for Sportsuchtig has several layers and can be analyzed and targeted from many different angles.
The targeted customer market will be segmented in multiple layers as follows:
Sports Participation – These customers have needs based on the specific sport(s) in which they participate. For example Baseball participants are looking specifically for baseball equipment, uniforms, training aids, etc. The National Sporting Goods Association (NSGA) reports in a 2003 report on sports participation in the U.S. for those 7 years of age and older, that there were over 256 million sports participants in 2003 (some participated in multiple sports). The major sports participation segments initially for Sportsuchtig:
Baseball – According to the NSGA 2003 report, for those 7 years of age and older, over 14.6 million people participated in Baseball. Of these 14.6 million, 4.5 million were aged 7-11 and 4.1 million were aged 12-17.
Softball – According to the NSGA 2003 report, for those 7 years of age and older, over 11.8 million people participated in Softball. Of these 11.8 million, 1.9 million were aged 7-11 and 2.9 million were aged 12-17.
Volleyball – According to the NSGA 2003 report, for those 7 years of age and older, over 10.4 million people participated in Volleyball. Of these 10.4 million, 1.3 million were aged 7-11 and 3.4 million were aged 12-17.
Basketball – According to the NSGA 2003 report, for those 7 years of age and older, over 27.9 million people participated in Basketball. Of these 27.9 million, 6.3 million were aged 7-11 and 7.9 million were aged 12-17.
Football – According to the NSGA 2003 report, for those 7 years of age and older, over 8.7 million people participated in tackle Football and 9.3 million in touch Football.
Other Sports (Future for Sportsuchtig) – According to the NSGA 2003 report, for those 7 years of age and older, over 173.4 million people reported participating in other sports than those that Sportsuchtig currently targets. This represents a huge growth opportunity for Sportsuchtig as it moves to target these sports segments.
These millions of participants are all potential customers for the internet store. The local area has a large number of youth recreation, adult recreation, and school leagues for these sports.
Customer Type – These customers have needs based upon the type of role they play in regards to the sports participants. For example, many times those making sporting goods purchases are not those actually participating in the sport, but instead are parents, athletic directors, and coaches.
Individual Participants – These are the actual sports participants. Typically, these would be adult participants or older youths who have the technical knowledge and disposable income to purchase sporting goods equipment and apparel on their own.
Parents – Parents buy on their own, or are present during the purchase of over 90% of sporting goods purchases for youths ages 5-18. This segment can be heavily influenced by their children in regards to the “hot” or best products. They are also the segment in most need of technical assistance from sporting goods store staff.
League Representatives – Members of adult and youth athletic associations are responsible for league equipment and uniform purchases to outfit league teams. Long-term relationships and sponsorship participation are important to this segment. They usually have technical proficiency and want to deal with someone that is on or above their technical level of expertise. This segment is usually well informed about recent product offerings and can be a solid channel for introducing new products. They are also a marketing channel to all the participants and parents involved with their league.
Independent Team Coaches – Typically those organizing and coaching adult sports teams, or individual advanced youth teams (such as AAU teams), they are responsible for the design and purchase of their individual team uniforms.
School Athletic Coaches and Directors – Public and private middle and high school athletic directors must outfit their teams with high quality sporting goods equipment and uniforms. Establishing ;relationships with this segment is difficult, but can be lucrative if all of the school’s sporting goods needs can be met.
Sports Performance Businesses – These are organizations that sell services to enhance the participant’s performance in his or her sport. Many times, they operate recreational/training facilities and offer individual or team training programs. Selling equipment to these facilities provides a channel, not only to the facilities’ customers, but also to the many area school and league coaches, who are typically part-time employees of these companies.
Retail/Online – It is critical for us, as a retail store, to understand the demographics of our different sales bases.
National – The demographic for the internet store is truly nationwide. The potential customer segment is all of the 256 million sports participants that have access to the internet. Products have been sold and shipped from this site to most of the 50 states in the U.S. In fact, products have also been sold internationally in Japan, Singapore, etc.
Metropolitan Area – The metropolitan area has a population of just over 1 million. This area is made up of 13 counties and cities and grew 15% from 1990 to 2000. Jansen county is the county where most of Sportsuchtig current retail customers live. Jansen county has a population of 278 million and a recent growth rate of 2%. Jansen county alone has 52,000 students, 36 elementary schools, 12 middle schools, and 10 high schools. The other largest counties – Jefferson and Lucas – are growing at 1.5% and 2.3% respectively. We believe that relocating the retail store north will provide significantly better accessibility for the sports participants in these counties, especially with the opening of the new highway around the western edge of the metropolitan area.

| Market Analysis | |||||||
| Year 1 | Year 2 | Year 3 | Year 4 | Year 5 | |||
| Potential Customers | Growth | CAGR | |||||
| Baseball Participants | -1% | 14,600,000 | 14,454,000 | 14,309,460 | 14,166,365 | 14,024,701 | -1.00% |
| Softball Participants | -1% | 11,800,000 | 11,682,000 | 11,565,180 | 11,449,528 | 11,335,033 | -1.00% |
| Football Participants | 0% | 18,000,000 | 18,000,000 | 18,000,000 | 18,000,000 | 18,000,000 | 0.00% |
| Volleyball Participants | -1% | 10,400,000 | 10,296,000 | 10,193,040 | 10,091,110 | 9,990,199 | -1.00% |
| Basketball Participants | 1% | 27,900,000 | 28,179,000 | 28,460,790 | 28,745,398 | 29,032,852 | 1.00% |
| Other Sports Participants | 11% | 173,000,000 | 192,030,000 | 213,153,300 | 236,600,163 | 262,626,181 | 11.00% |
| Total | 7.78% | 255,700,000 | 274,641,000 | 295,681,770 | 319,052,564 | 345,008,966 | 7.78% |
4.2 Target Market Segment Strategy
The focus will initially be on the Baseball and Softball participant segment, because this is Sportsuchtig’ current core competency and because the number of participants, both nationally and locally, is quite large. We will look to leverage current Sportsuchtig relationships in this segment and move aggressively to increase sales and margins through a targeted marketing campaign.
We will then strategically target other participation segments to try and increase sales during the non-peak baseball/softball sales months. This is a huge opportunity for growth for the company, as evidenced by the large number of participants present in the other participant segments. Changing tastes in sports and strong sales of sporting goods in recent years partly reflect the changing composition of the U.S. population. In particular, the number of older (and more affluent) people has increased rapidly in the past decade. As the Baby Boomers age, they participate less in vigorous sports like baseball, basketball, and tennis, and more in relaxed sports like camping, fishing, and golf. We believe quickly moving into at least one sport that serves this aging market to be critical to meeting sales goals.
The “customer type” segments are currently-under served by Sportsuchtig. Although the company does have some relationships with various leagues and organizations – such as the U.S.S.A. (U.S. Softball Association) – there is room for significant segment penetration with the addition of targeted sales efforts and the staffing of a sales team.
Due to the fact that the company has both an internet store and a retail store it is important to understand the market segmentation and demographics on both a national and local level. The internet store has made substantial sales (almost 1.3 million in 2003) with a weak user presentation experience and basically no Web marketing strategy. The analysis of the number of sports participants nationwide, not to mention internationally, illuminates the fact that attacking this nationwide segment through a focused Web strategy could bring significant returns.
4.3 Industry Analysis
In the U.S., about 20,000 companies operate retail sporting goods stores, with combined annual revenue of $25 billion. Most operate a single retail location. Large chain operators include Sports Authority ($1.4 billion revenue), Gart Sports ($936 million), Dick’s Sporting Goods ($2 billion – including the recent acquisition of Galyan’s), and Hibbett Sporting Goods ($241 million). The industry is highly fragmented. There are 150 companies with more than 5 stores, but the 20 largest chains hold only about 35 percent of the national market.
Sporting goods stores vary according to format and merchandise. Large format stores (Dick’s, Sports Authority), also known as “Big Box” stores, are from 20,000 to 100,000 square feet, stock a large number of items, and are typically found as anchor stores in strip malls or in stand-alone locations. Traditional sporting goods’ retail stores (Happy Sports, Don’s Sporting Goods in the metro area) are from 5,000 to 20,000 square feet, carry a more limited number of items, and are typically found in strip or enclosed malls. Sportsuchtig falls into this traditional format with 7,400 square feet, 2.5 million in sales, and 10-12 employees. Large format stores typically have more than $5 million in annual revenue and more than 50 employees. raditional retail stores typically have $1-$5 million in sales and 10-50 employees. In the U.S., there are about 8,000 large-format and traditional sporting goods stores, with 50% of industry revenue.
Sporting goods are also sold by mass merchandisers like Wal-Mart, Kmart, and Target, and by catalog and Internet retailers like Cabela’s and L.L. Bean. Although large chains sell a broad range of merchandise at lower prices, small local stores can successfully compete by offering better service or specializing in a particular sport(s). Because the equipment of many sports is very technical, knowledgeable salespeople are a strong competitive factor. Employees must be trained to understand and explain differences. Companies typically try to recruit employees who are avid sports’ participants.
Marketing is typically through a combination of advertising and sports events. Advertising is most often through newspaper ads, inserts, direct mailings, and sometimes radio. Word-of-mouth advertising is especially important to traditional sporting goods stores that provide superior service and expertise. Many companies sponsor local sports events or competitions and host appearances by sports celebrities. Some stores provide technical services and “participation areas” like basketball hoops, putting greens, and climbing walls. In addition to selling individual items, many stores (Happy, Don’s) specialize in selling team uniforms and equipment to local schools and clubs.
Inventory management is a major concern for all sporting goods retailers because of the large numbers of items they sell and the short selling season for many sports. Insufficient inventory produces missed sales, but excess inventory can’t easily be sold once a sports season is over. Many companies use highly sophisticated computerized inventory management systems.
4.3.1 Competition and Buying Patterns
The competition for Sportsuchtig’ retail store in the metropolitan area includes one large format sporting goods chain with 4 locations, 2 well known traditional format sporting goods stores with 1 location each, and around 18 specialty, or niche, sporting goods stores.
The large format store is Dick’s Sporting Goods, which is based in Pittsburgh, Pennsylvania. With its recent purchase of Galyan’s Trading Company, Dick’s now has annual sales of over $2 billion and operates 221 stores in 32 states. Dick’s has 4 big box stores in the metropolitan area. Dick’s offers a very wide variety of sports equipment and products, but the selection within each sport is usually limited and narrow. Their stores are big and impressive and found in upscale areas. The stores appear to be under-staffed, as it is usually hard to find ready assistance. Once found, the employees are not very knowledgeable in regards to product offerings and/or location of the products in the store. Most of the time the employees are teenagers. Products are generally priced higher than the competition, although they do have frequent sales and discounts. They utilize a “Score Card” discount club program that allows frequent customers to benefit from specials and discounts once they reach a certain level of points based on past purchases. They actually give the customer a credit-card-sized card to present when making purchases. They utilize the information gathered during registration for this program to send direct mail and email offers to the members. Customers generally purchase from Dick’s when they don’t need technical assistance, a generic product with small selection is sufficient, and price is not a driver. Dick’s is the most dominant and visible player in the market, because of their advertising and high profile stores. Dick’s also has a Web store from which they sell products and provide store location services.
The two traditional sporting goods stores in the metropolitan area are Don’s Sporting Goods and Happy Sports. Both of these stores are very well known and have been in the local market for over 30 years. These 2 stores are in the same class and format as Sportsuchtig.
Don’s Sporting Goods had been a family owned business sice 1952, until it was sold in June of 2004 to a publicly traded company. Don’s had annual sales in 2003 of around $18 million and operates eight warehouses and showrooms in this region. It operates one showroom in the local area at its headquarters in the near west end. Don’s showrooms are usually around 3,000-3,500 square feet and contain many sports but very sparse selection. The store layout is changed frequently, following the seasonality of the sports. Typically their store staff members have technical knowledge and can help customers determine the right product for them. Don’s strength is in its 35-40 strong nationwide sales force that specializes in the distribution of team uniforms and school equipment. Don’s also has a nice Web site and e-commerce store from which they sell individual and team products.
Happy Sports is family-owned and opened in 1970. They operate one retail store in a west-end shopping center. The store is around 4,500 square feet and offers many different sports products. The store has been upgraded in recent years and the variety and selection are broader now than in previous years. They claim to have a knowledgeable staff but personal visits to this store have proven this not to be true. Happy also has a fairly strong Team Division which sells to schools and recreation leagues. Happy also utilizes a credit card size “Discount Card” that allows frequent customers to benefit from specials and discounts once they reach a certain level of points based on past purchases. They recently did an advertising campaign through local radio stations. They have a Web site that lists some of their products but it is not e-commerce, as you can not purchase products directly from the site.
Play It Again Sports is part of a 450-store national franchise chain that has been operating since 1988. They have 4 franchises in the local area. Play It Again’s niche is that they buy, sell, and trade used and new sports equipment. They claim that because their customers can sell or trade-in their used gear for cash or store credit that they are able to get deeper discounts and better prices on really great used and new equipment. Generally these stores appear to be poorly staffed, both from a numbers and a technical knowledge standpoint. We found their prices not much more competitive than those at Dick’s.
The 18 or so specialty stores found around the local metropolitan area specialize in golf, tennis, soccer, biking, swimming, running, etc. Most operate very small, 1,000-1,500 square foot, stores. As Sportsuchtig moves into other sports, some of these will become direct competitors. For example, All About Soccer operates 2 stores – one in the west end, and another on the south side. They focus purely on Soccer products – balls, shin guards, and cleats.
The competition for our Internet store is significant. There are many Internet sports stores vying for the online customer’s dollars – over 50. The most significant of these include big box stores like Dick’s and The Sports Authority, but also smaller more traditional ;companies such as Fog Dog, Blackwater, Annaconda, Direct Sports, Bassco, Big 5 Sporting Goods, Planet Sports, Baseball Corner, and Baseball Express. Most of these internet stores offer a full range of sports products and their Web sites are professionally done and usually feature tools designed to draw the customer back to the site repeatedly.
We believe the internet store has done extremely well to date against this competition and that with an improved Web site design and a Web marketing strategy we can significantly increase our sales through this channel. On the retail side, we believe our large selection and inventory, our staff’s technical knowledge, and our unique customer service will help us compete against our competitors in the local market.
Strategy and Implementation Summary
Sportsuchtig will leverage its expertise, product offerings, and marketing strategy to increase its customer base while driving sales and profit. The following sections review the various strategies that will support this effort.
5.1 Sales Strategy
Sportsuchtig will approach retail sales from a salesperson-customer relationship basis. All sales associates will be trained and encouraged to assist customers in a personal manner, utilizing first names and asking the questions needed to provide the customers with the services they desire. The current Point-Of-Sale system is already set up to collect the customer’s name, address, and purchases. Gathering key customer information and seeking performance feedback on the products and services offered will assist us in the following ways:
- Targeting our marketing efforts more effectively.
- Offering products and merchandising formats that will increase sales.
- Developing services that enhance the shopping experience.
- Training and developing sales associates in order to effectively service the customer.
- Increase awareness of Sportsuchtig within the retail consumer marketplace.
- Develop future sales opportunities that allow for continued growth of the business.
We want our customers to come back and specifically ask for a salesperson by name, because they were so satisfied with the service previously provided.
Currently the format of the retail store separates the customer from the merchandise. The customer must be assisted by a salesperson or they cannot touch or browse the merchandise. We believe this leads to walk-outs when all the available salespeople are tied up assisting other customers. Usually, these customers will leave and never return. We plan to reformat the store so that the products will be showcased via lifestyle merchandising that inspires and promotes multiple purchases. We look to create a strong visual impact, creating an invitation to touch and purchase.
In order to provide the customer with the most up-to-date products on the market and a wide selection, we will attend sporting goods trade shows which showcase all of the products manufactured within the sporting goods industry. Attending shows and seminars will not only allow us to ensure our product mix is current and up-to-date, but will also provide us with fresh, new store merchandising and display ideas. To stay abreast of market and product trends, we will utilize trade publications, trade associations, and their associated Web sites.
It is the goal of Sportsuchtig to offer selection and quality at a value to the consumer. Our pricing structure will support a 25-35% gross margin and position us competitively within the marketplace. Seasonal promotional offers, discounts for end of season, and sale “events” will encourage additional sales and multiple unit purchases.
Employees of Sportsuchtig are an integral part of the shopping experience for the customer. All employees will be developed for growth and advancement, and compensated fairly with effective training that will enable them to confidently service and sell the customer.
Currently there is no sales force to actively pursue sales to the League, School, and Team market segments. Key to the new sales strategy is direct sales calls on these market segments. Currently these sales calls are made by the current owner, by virtue of his background and knowledge of the products and competitors. Experience has proven that the more time he devotes to sales, the more sales result. Initially, this sales task will be transferred to the new managing owner, John Johnson. However, it is strategically necessary to hire and develop a sales team to attack these markets. The competition well-established with many of our potential customers, so a full-time team sales manager will be found and added as soon as possible. His/her task will be to grow the sales in these segments and to build the sales team. Without this person, too much of John Johnson’s time will be deflected away from his major role of strategically operating and growing the business.
There are currently 2 part-time commissioned external sales people. One of them is a well-known Softball pitching coach who has a small training facility/store in the area. She sells Sportsuchtig’ products to her students and others that come to her store. Her commission is 50% of the margin gained from these sales. There is another saleswoman who pulls a trailer of Sportsuchtig products with her when she goes to softball tournaments around the region. Her commission is also 50% of the gross margin on the sales. These relationships and channels for sales will be investigated and formalized into a sales program if deemed beneficial.
Web sales are handled electronically via the internet store Shopping Cart or via phone sales representatives taking calls on the 800 telephone number. There are currently 4 computer/phone stations for these sales reps. These sales representatives need to be thoroughly trained in product offerings and have good phone communication skills. They need to be trained to follow a general sales script when dealing with customers. Having good images of products and detailed product benefits and features on the Web site is critical to getting the customers to commit to an online purchase without talking with a sales representative. A functioning site search engine that helps customers locate product also needs to be added to the internet site.
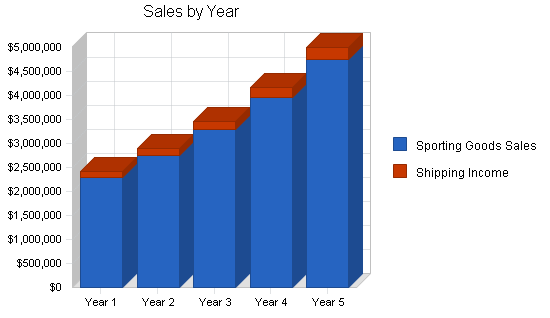
5.1.1 Sales Forecast
The following table and chart give a run down on forecasted sales. We expect sales in year 1 to be flat as the new owner comes into operating the business. Businesses generally see a sales decline in the first year of new ownership. We believe, however, that this business is strong and that we can at least maintain the current level of sales ($2.5 million) in year 1.
We have projected 20% sales growth in years 2-5, reaching over $5 million in sales by the end of year 5. This growth forecast is based on the assumption that the company acts on the keys to success outlined earlier in this plan: upgrade the website, relocate the existing retail store, negotiate optimal agreements with the major suppliers, expand the product line by offering equipment for additional sports, create an outside sales team that calls on schools, leagues, and associations, train employees, train or hire a store manager, advertisement and promotion, build a reliable operations infrastructure, be an active member of the community, and ensure through daily management practices that the values of The Sportsuchtig mission are followed.
We will look to relocate the store near the end of year 1, which should help position us for increased retail sales beginning in year 2. The website and internet store will be redesigned after the first 6 months and the Web marketing strategy will be timed to coincide with the implementation of the new site. Expansion into at least one new product participant segment will be planned for each year, beginning in year 1. An outside sales team manager will be hired in year 1 but ramp up of the sales team is not planned until early in year 2.
The other assumption built into the forecast is that gross margins will be flat in year 1 but able to be continually improved through years 2-5. This assumption is based on improved purchase agreements with major suppliers and better inventory management, so that fewer products have to be discounted at product season end.
The sales forecast could turn downward if the outside sales team has difficulty gaining traction. The competition is comfortably entrenched in the segments to be targeted, so success is not guaranteed.

| Sales Forecast | |||||
| Year 1 | Year 2 | Year 3 | Year 4 | Year 5 | |
| Sales | |||||
| Sporting Goods Sales | $2,288,184 | $2,745,821 | $3,294,985 | $3,953,982 | $4,744,779 |
| Shipping Income | $120,351 | $144,421 | $173,305 | $207,966 | $249,560 |
| Total Sales | $2,408,535 | $2,890,242 | $3,468,290 | $4,161,948 | $4,994,339 |
| Direct Cost of Sales | Year 1 | Year 2 | Year 3 | Year 4 | Year 5 |
| Cost of Goods Sold | $1,806,461 | $2,109,877 | $2,427,803 | $2,788,505 | $3,246,320 |
| Other | $0 | $0 | $0 | $0 | $0 |
| Subtotal Direct Cost of Sales | $1,806,461 | $2,109,877 | $2,427,803 | $2,788,505 | $3,246,320 |
5.2 Milestones
The accompanying milestone table highlights our plan with specific dates. This schedule reflects our strong committment to organization and detail. Milestone responsibility is assigned to the functional departments in the company – Sales, Marketing, HR, Operations, and President’s Office.
The Milestone table reflects critical dates for the acquisition and takeover schedule, systems reviews and upgrades, the website re-design and deployment, the retail store relocation, and new product identification and rollout. We also define our target dates for policy definition and implementation as well as documented employee training and evaluation processes.
| Milestones | |||||
| Milestone | Start Date | End Date | Budget | Manager | Department |
| Initial Business Plan | 9/8/2004 | 9/19/2004 | $200 | JJohnson | Acquisition |
| Letter of Intent | 9/17/2004 | 9/24/2004 | $500 | JJohnson | Acquisition |
| Apply for Loan | 9/20/2004 | 9/24/2004 | $0 | JJohnson | Acquisition |
| Contract to Purchase | 10/4/2004 | 10/22/2004 | $2,000 | JJohnson | Acquisition |
| Lease Agreement | 10/4/2004 | 10/22/2004 | $1,000 | JJohnson | Acquisition |
| Non-Compete Agreement | 10/4/2004 | 10/22/2004 | $500 | JJohnson | Acquisition |
| Loan Authorization Obtained | 10/15/2004 | 6/6/2009 | $0 | JJohnson | Acquisition |
| Secure Insurance – Business & Key Man | 10/25/2004 | 11/12/2004 | $2,000 | JJohnson | Acquisition |
| Due Diligence | 10/25/2004 | 11/19/2004 | $1,000 | JJohnson | Acquisition |
| Close Loan/Deal | 12/1/2004 | 12/1/2004 | $30,000 | JJohnson | Acquisition |
| Begin Operation | 12/1/2004 | 12/1/2004 | $0 | JJohnson | President |
| Owner Training Period | 12/1/2004 | 1/15/2005 | $0 | JJohnson | President |
| Computer Systems Disaster Recovery Evaluation and Implementation | 12/1/2004 | 12/31/2004 | $500 | JJohnson | Operations |
| Inventory System Review and Plan | 12/1/2004 | 12/31/2004 | $0 | JJohnson | Operations |
| Implement Staff Uniform | 12/10/2004 | 12/20/2004 | $500 | JJohnson | President |
| Retail Store Layout Modification Design | 1/2/2005 | 1/31/2005 | $500 | JJohnson | Sales |
| Shipping & Receiving Process Review & Plan | 1/2/2005 | 1/31/2005 | $0 | JJohnson | Operations |
| Accounting System Review & Plan | 1/2/2005 | 1/31/2005 | $500 | JJohnson | Operations |
| Policy and Procedures Manual | 1/2/2005 | 2/28/2005 | $500 | JJohnson | HR |
| Hire or Promote Store Manager | 1/15/2005 | 2/15/2005 | $200 | JJohnson | President |
| Business Plan Review | 1/15/2005 | 1/31/2005 | $0 | JJohnson | President |
| Point-of-Sale System Review & Plan | 2/1/2005 | 2/28/2005 | $0 | JJohnson | Operations |
| BNI Marketing | 2/1/2005 | 3/31/2005 | $0 | JJohnson | Marketing |
| Website Re-Design | 2/1/2005 | 2/28/2005 | $2,000 | JJohnson | Marketing |
| Hire Team Sales Manager | 2/1/2005 | 3/1/2005 | $200 | JJohnson | President |
| Retail Store Format Change | 2/20/2005 | 2/21/2005 | $500 | JJohnson | Sales |
| Begin Sunday Operation | 2/27/2005 | 2/27/2005 | $0 | JJohnson | Sales |
| WEB Site Development & Implementation | 3/1/2005 | 6/1/2005 | $10,000 | JJohnson | Operations |
| Determine League & Tournament Sponsorships for 2005 | 3/1/2005 | 3/15/2005 | $0 | JJohnson | Marketing |
| Flyer Marketing to Leagues | 3/1/2005 | 4/15/2005 | $5,000 | JJohnson | Marketing |
| Flyer Marketing to Mailboxes | 3/1/2005 | 4/15/2005 | $2,000 | JJohnson | Marketing |
| Article in Times Dispatch about Business Purchase | 3/1/2005 | 3/31/2005 | $0 | JJohnson | Marketing |
| Team Sales – Sales Plan | 3/1/2005 | 3/31/2005 | $0 | JJohnson | Sales |
| Identify New Fall Sport Segment(s) | 3/1/2005 | 3/31/2005 | $0 | JJohnson | Sales |
| Determine New Store Location | 3/1/2005 | 5/1/2005 | $0 | JJohnson | President |
| Negotiate and Order New Sport Inventory | 4/1/2005 | 4/30/2005 | $0 | JJohnson | President |
| Marketing Plan for New Product(s) | 4/1/2005 | 4/30/2005 | $0 | JJohnson | Marketing |
| Employee Training Plans | 5/1/2005 | 5/31/2005 | $500 | JJohnson | HR |
| Supplier Agreements/Relationships Review & Plan | 5/1/2005 | 5/31/2005 | $0 | JJohnson | President |
| Sign New Location Lease Agreement | 5/1/2005 | 5/15/2005 | $1,000 | JJohnson | President |
| New Store Layout Design | 5/1/2005 | 6/1/2005 | $1,000 | JJohnson | Sales |
| New Warehouse Design | 5/1/2005 | 6/1/2005 | $1,000 | JJohnson | Operations |
| Inventory System Upgrade | 5/15/2005 | 6/15/2005 | $3,000 | JJohnson | Operations |
| Employee Review Process | 6/1/2005 | 6/30/2005 | $500 | JJohnson | HR |
| New Location Buildout | 6/1/2005 | 7/31/2005 | $5,000 | JJohnson | Operations |
| New Store Marketing Plan | 6/1/2005 | 7/15/2005 | $0 | JJohnson | Marketing |
| Website Live Deployment | 6/15/2005 | 6/15/2005 | $0 | JJohnson | Operations |
| Web Marketing Plan Execution | 6/16/2005 | 12/31/2005 | $15,000 | JJohnson | Marketing |
| New Store Marketing Execution | 7/15/2005 | 12/31/2005 | $20,000 | JJohnson | Marketing |
| New Store Stock and Set-Up | 8/1/2005 | 8/12/2005 | $0 | JJohnson | Operations |
| New Product(s) Marketing Plan Execution | 8/1/2005 | 12/31/2005 | $10,000 | JJohnson | Marketing |
| Store Move | 8/13/2005 | 8/14/2005 | $2,000 | JJohnson | Operations |
| New Store Opening | 8/15/2005 | 8/15/2005 | $0 | JJohnson | President |
| New Store Grand Opening | 8/20/2005 | 8/21/2005 | $0 | JJohnson | President |
| Identify Non-Profit Partner | 10/1/2005 | 10/31/2005 | $0 | JJohnson | President |
| Accounting System Upgrade | 11/1/2005 | 11/30/2005 | $1,000 | JJohnson | Operations |
| Company Christmas Party | 12/15/2005 | 12/20/2005 | $200 | JJohnson | President |
| Evaluate Discount Card Program | 1/2/2006 | 1/31/2006 | $0 | JJohnson | Marketing |
| Order Spring Inventory | 9/15/2009 | 11/1/2005 | $0 | JJohnson | Sales |
| Totals | $119,800 | ||||
5.3 Marketing Strategy
The marketing strategy of Sportsuchtig centers on defining our market niche in terms that benefit our customer. Retail and internet store marketing will be integrated and synchronized. We plan to establish a consistent and coherent marketing plan and calendar that take into account and utilize all effective forms of publicity, advertising, and other marketing tools. Specific strategies that will potentially be used are as follows:
- Newspaper/Print Ads – It will be necessary to keep the Sportsuchtig name in front of the customer while getting established will be necessary. We plan on running limited-space ads in the local newspapers to keep our name and phone number in front of the consumer. We may offer clip out coupons as an incentive to visit the store and also as a way to track revenue from the ads. Use of magazine print ads is deemed to have little potential return.
- Press Releases – The local paper has regular sections that highlight business purchases and new business openings. We will make sure they give coverage to the grand opening when the store relocates and any time we sponsor or are involved with local nonprofit organizations.
- Team/Tournament Sponsorship – We will selectively sponsor local teams and leagues, preferably by providing equipment or uniforms versus cash. We will encourage links to/from our Web site with these entities. We will look to sponsor a “Sportsuchtig” softball and/or baseball tournament once a year.
- Event Sponsorship – We will investigate opportunities for being sponsors of large area events, especially those managed by the local sports facilitation group, such as a marathon, and biking or ironman events.
- Decals – We will have decals/stickers manufactured with the Sportsuchtig logo. We will include these with all of the orders that we ship. Children in particular enjoy displaying decals/stickers on just about everything.
- Apparel – We will outfit our retail staff with Sportsuchtig branded shirts and have shirts, hats, and other apparel available for event and sales giveaways.
- Grand Opening – A Grand Opening is the most successful of any in-store promotions. With manufacturer support, a large number of door prizes can be given away while instantly building a mailing list. Loss leader pricing on a few high volume consumable products will attract in-store traffic. Vendors will subsidize loss leader pricing with a rebate. Appearances by local celebrities would also expose potential customers to Sportsuchtig. A planned series of events, such as demonstrations, free clinics, celebrity appearances, registration for free prize giveaways, and competitions can all be utilized to extend the grand opening and continually draw customers back so they become familiar and comfortable with the store.
- Trade Shows – We will attend industry trade shows in order to keep abreast of new products and trends. This will also allow us to make and maintain industry contacts.
- Word of Mouth – By giving first-time customers great service and a fair price, the word is sure to spread. Also, the many sports contacts that we already have in the area will prove to be most beneficial in spreading the word.
- Yellow Pages – We will advertise in the local yellow pages.
- Flyers – Flyers will be distributed to all local leagues at season start. These flyers will offer discounts for purchasing from the retail and internet stores. These discounts could be structured so that a certain percentage of the discount goes directly to the customer and other percentages go to the customer’s league or a nonprofit entity being sponsored by Sportsuchtig.
- MailBox Flyers – We will also evaluate placing flyers in local area neighborhood mailboxes.
- Customer Discount Card – The implementation of a customer discount program and card will be investigated to entice customers to shop repeatedly with Sportsuchtig. Information gathered through this program can be utilized to feed direct mail and email campaigns for special program discounts or information.
- Business Networking – Business networking organizations, such as Business Network International, will be visited and potentially joined as a way to increase awareness and create a virtual sales force.
- Direct Mail – A direct mail program utilizing low-cost postcards or other mechanism will be evaluated.
- Radio – A radio campaign will be investigated. Happy Sports recently ran a campaign with some success.
- Catalog – The creation and distribution of a product catalog will be evaluated.
- Web Marketing – A variety of Web marketing channels and vehicles will be researched and tested.
- Press releases, articles, and/or advertising on local internet sites.
- Search engine marketing
- Banner Ads
- URL Links to/from organizations, teams, leagues, co-marketers
- Email marketing
- Trivia questions with weekly winners
- Sports Tickers
- Retail store event publicity and schedule
- Participation Areas and Contests – When the store is relocated we will, if possible and feasible, leverage the TrueSports product line from the owner’s other business and build a basketball court and putting green into the layout and flooring of the new store. This will allow us to have areas where promotional competitions, demonstrations, clinics, and customer product tryout can be conducted. This will draw customers to the store and also allow a showcase for the TrueCourt and TrueTurf product lines.
- Non-Profit Relationship(s) – Sportsuchtig will build a relationship with, and be an on-going sponsor for, at least one nonprofit organization. Events will be held or sponsored in order to raise money for the nonprofit, or a percentage of profits for certain Sportsuchtig promotions will be credited to the nonprofit for its use in exchanging that credit for Sportsuchtig products. In addition to giving back to the community, we anticipate significant free publicity because of this community support program. Because we are giving help to these organizations, they will get the word out to their benefactors/customers/employees/partners about Sportsuchtig. Word of mouth has always proven to be the greatest advertising program a company can instill. In addition, the media will be more than willing to promote the charitable aspects of Sportsuchtig and provide the opportunity for more exposure every time we provide assistance to another organization.
All marketing decisions with regard to specific media choices, frequency, size, and expenditures will be conducted on an on-going basis with careful considerations of returns generated. All marketing vehicles and channels will be tracked for results.
5.4 Competitive Edge
Sportsuchtig looks to establish itself competitively as a unique sporting goods provider in the local metropolitan area and internet sports market through its product offerings, the scope and level of services it provides, and the expertise of its employees.
Products: Sourced through established and internationally-known manufacturers, the products offered provide a high level of quality and value to the consumer. The depth and range of products will be extensive, separating us from others in the marketplace.
Services: Connecting with the customer is a key focus for Sportsuchtig. It is our desire that customers look to us as their valued resource to obtain the equipment, apparel and accessories that meet their needs. Our internet store will provide prompt courteous service, and deliver products at reasonable shipping rates within expected time frames.
Employees: Employees of Sportsuchtig will enjoy a friendly, fair and creative work environment, which respects diversity, new ideas and hard work. Development through experience and training will be a primary focus. It is our desire that employees are long-term, ensuring an expertise that will support the customer experience. Our employees will be a competitive advantage because their technical product knowledge will be superior to that of the competition. We want customers to form a relationship with a salesperson and ask for them by name when they return for a subsequent purchase.
Web Plan Summary
Sportsuchtig has an existing Website that has been generating $1.3 million in sales the last 2 years. However, we believe that a user interface redesign would generate significantly more revenue. According to market research from the Gartner Group, more than 50% of Web sales are lost because visitors can’t find the content they’re looking for. Another study by usability consultants Creative Good estimated that improving the customer experience increases the number of buyers by 40% and increases overall order size by 10%. We plan to redesign and implement a new website in year 1.
The new site will be designed and coded with internet marketing optimization at the forefront of requirements. The basis for our Website marketing strategy is to utilize search engine optimization, keyword density, direct navigation, targeted link popularity and systematic submissions. It is critical to sales growth that the website gains and maintains a high search engine placement. A full website marketing plan will be developed and implemented.
The website is a primary sales channel for us and is critical to the sales goals of the company. We will implement the new site to showcase the product offerings and provide technical information and assistance to help the customer in their product selection. To further show off its expertise, the website will provide a resources area, offering articles, research, product information and website links of interest to its customers.
The website will mirror the image and branding elements showcased in the retail store and at the same time, keep up with the latest trends in user interface design. The key to the website strategy will be combining a well designed front-end, an excellent and fast shopping cart experience, and a back-end capable of capturing “hits” and customer data for use in future marketing endeavors.
6.1 Website Marketing Strategy
The basis for our website marketing strategy is to utilize search engine optimization, keyword density, direct navigation, targeted link popularity and systematic submissions. Our Website marketing strategy will adhere to each search engine’s no-Spam policies, while generating highly-qualified web traffic. We believe a successful marketing system is much more than simply optimizing our website to be search-engine friendly. The system should also provide support for other strategies, such as link popularity, site design and content, the “stickiness” of our site, consistent search engine submissions, and ethical marketing practices.
It is extremely important to gain and maintain a high search engine placement. A December 2002 study by DoubleClick revealed that people prefer to use search engines almost 2 to 1 over any other source to find products and services on the Internet. 85% of all searches on the internet start on search engines.
In addition, we will implement the following mechanisms to make our website URL and domain name visible and effective:
- We will place our Web address on every form of literature that goes out of our business, such as letterhead, business cards, envelopes, invoices, payments, etc.
- We will place our Web address in all print advertising, such as newspaper ads, magazine ads, professional trade magazines, etc.
- Our internet Web address will be part of our on-hold or answering systems for both the internet 800 numbers and the retail store phone.
- Electronic advertisements such as radio ads will feature our Web address.
- We will develop our new website from inception, and modify the existing one as practical, with Web marketing as a key objective. There are huge advantages to developing the site with marketing in mind. Position of keyword phrases in the text, the alt tag description, the titles of the pages, the page URL, and Meta Tags in the heading area all have a role to play.
- We will avoid using frames on our website because many browsers do not support frames and many search engines do not rank sites with frames very high.
- Although we need pictures to display our many products, we will try to avoid putting too many graphics on a page, so we don’t reduce the page load time to a crawl. If a site does not start to download within 8 seconds a prospective customer will go to another site, and customers with dial-up links find sites with too many images make it painfully slow to load pages.
6.2 Development Requirements
A full development plan will be generated as documented in the milestones. Costs that Sportsuchtig will expect to incur with development of its new website include:
Development Costs
- User interface design – $3,000.
- Site development and testing – $6,000.
- Site Implementation – $1,000.
This development will be outsourced.
Ongoing Costs
- Website name registration – $70 per year.
- Site Hosting – $30 or less per month.
- Site design changes, updates and maintenance are considered part of Marketing.
Management Summary
Owner John Johnson will act as President and CEO and will be responsible for all aspects of managing and operating the company. Mr. Johnson spent almost 20 years leading research and development efforts for high technology stalwarts such as Lucent Technologies and Motorola Systems, and was a founding employee of a high-tech start-up. As the Vice President of Development for the start-up, he built the research and development team from the ground up and developed it into an 80 person team which produced leading-edge software technology that enticed Motorola Systems to purchase the company. In late 2002, Mr. Johnson made the decision to apply his entrepreneurial experience and drive to a business of his own and founded Johnson Enterprises, LLC. Johnson Enterprises is a leader in the design and construction of custom indoor and outdoor sports recreation facilities, and specializes in game courts (basketball, tennis, etc.), synthetic putting greens, and sporting goods products. Mr. Johnson also started Johnson Investments, LLC in 2004, a company that specializes in residential and commercial real estate investment.
Mr. Johnson received a Bachelor of Science in Computer Science degree from Stone College in Boulder, Colorado and a Masters in Business Administration degree from the University of Illinois in Champaign, Illinois. He is married with two sons, 10 and 14.
Mr. Johnson’s high technology and sports business backgrounds, coupled with his entrepreneurial experience, makes him the ideal leader to drive this sporting goods retail/internet endeavor.
Overhead for management will be kept to a minimum and all managers will be “hands-on” workers. There is no intention of having a top-heavy organization that drains profits and complicates decisions. At the zenith of this five-year plan, there will be managers for Warehouse/Shipping and Receiving, Team Sales, and two Retail Store managers. John Johnson will be responsible for overall Retail and Internet Sales management, although the Store Managers will also be responsible for sales performance and will have sales-based incentives. Accounting functions could potentially be outsourced. The website management and computer systems management and maintenance will be initially be managed by Mr. Johnson, but will be outsourced in the future. Mr. Johnson will be directly responsible for purchasing, inventory management and control, and marketing (although some marketing will be outsourced).
Currently the company has 10 employees: two warehouse/shipping and receiving clerks, one accounting person that also does internet phone sales, two internet phone salespeople, 4 part-time retail salespeople, and a clerk that does retail sales and is also responsible for answering the retail store phone. The number of employees will grow progressively over time to 25 by the end of year 5.
7.1 Personnel Plan
The Sportsuchtig retail store and phone sales hours are currently Monday through Saturday, 9:00 a.m. to 7:00 p.m. and closed on Sunday. These hours will be evaluated, with the hours most likely being changed to 10:00 a.m. to 7:00 p.m. Monday through Saturday and open on Sunday from 12 p.m. to 5:00 p.m. The Personnel Plan, as detailed in the table following, has been developed to support these store hours and expected volumes, as per the Sales Forecast section.
Assumptions regarding personnel have been made for year 1 through year 5 as follows:
- Year 1 Ending October 2005 – The number of employees inherited from the previous owners are sufficient to operate the business in order to reach the Year 1 sales goals – which is equal to the previous year. John Johnson will be acting President and CEO and will take $60,000 salary in the first year. The support of a trusted and experienced employee will be needed to enable John to be away from the store when necessary and to manage coordination of the planned store relocation, the website redesign/implementation, and to sell products. In January of 2005, a Store Manager will be hired or promoted to fill this need.
- Year 2 Ending October, 2006 – Based on sales volume, it will be necessary to add another Retail Sales person. Salary for John Johnson will increase to $75,000 beginning in November 2006. Current full-time and part-time employees will be provided salary reviews and given appropriate salary increases – 5% has been factored in. In November 2005, a Team Sales Manager will be hired to take over Team Sales from Mr. Johnson and to start aggressively targeting the team segments.
- Year 3 Ending October, 2007 – Salary for John Johnson will increase to $100,000 beginning in November 2007. Current full-time and part-time employees will be provided salary reviews and given appropriate salary increases – 5% has been factored in. Increased sales volume will drive the hiring of 6 new employees. Another Retail Salesperson and an assistant accounting/retail phone clerk will be hired. Increased sales from the website will drive the hiring of an additional Warehouse/Shipping & Receiving clerk and also an additional Internet Phone Salesperson. An additional Store Manager will be hired to relieve Mr. Johnson from day to day store management tasks. We will also hire an additional Salesperson for the Team Sales team.
- Year 4 Ending October, 2008 – Salary for John Johnson will increase to $125,000 beginning in November 2008. Current full-time and part-time employees will be provided salary reviews and given appropriate salary increases – 5% has been factored in. Increased sales volume will drive the hiring of 2 new employees, another Retail Salesperson and an Internet Phone Salesperson.
- Year 5 Ending October, 2009 – Salary for John Johnson will increase to $150,000 beginning in November 2009. Current full-time and part-time employees will be provided salary reviews and given appropriate salary increases – 5% has been factored in. Increased sales volume will drive the hiring of 4 new employees. Increased sales from the website will drive the hiring of an additional Warehouse/Shipping & Receiving clerk and also an additional Internet Phone Salesperson. An additional Retail Salesperson and an additional Salesperson for the Team Sales team will be added.
| Personnel Plan | |||||
| Year 1 | Year 2 | Year 3 | Year 4 | Year 5 | |
| Warehouse/Shipping & Receiving Manager | $23,000 | $24,150 | $25,360 | $26,625 | $28,000 |
| Warehouse/Shipping & Receiving Clerk | $18,800 | $19,740 | $20,700 | $21,800 | $22,850 |
| Warehouse/Shipping & Receiving Clerk | $0 | $0 | $18,800 | $20,700 | $21,800 |
| Warehouse/Shipping & Receiving Clerk | $0 | $0 | $0 | $0 | $18,800 |
| Accounting | $13,412 | $24,150 | $25,360 | $26,625 | $28,000 |
| Retail Phone / Accounting Assistant | $0 | $0 | $17,000 | $17,850 | $18,740 |
| Internet Phone Sales | $17,000 | $17,850 | $18,740 | $19,680 | $20,660 |
| Internet Phone Sales | $17,000 | $17,850 | $18,740 | $19,680 | $20,660 |
| Internet Phone Sales | $9,924 | $17,850 | $18,740 | $19,680 | $20,660 |
| Internet Phone Sales | $0 | $0 | $17,000 | $17,850 | $18,740 |
| Internet Phone Sales | $0 | $0 | $0 | $17,000 | $17,850 |
| Internet Phone Sales | $0 | $0 | $0 | $0 | $17,000 |
| Retail Sales PT | $2,500 | $2,625 | $2,756 | $2,894 | $3,038 |
| Retail Sales PT | $2,500 | $2,625 | $2,756 | $2,894 | $3,038 |
| Retail Sales PT | $2,500 | $2,625 | $2,756 | $2,894 | $3,038 |
| Retail Sales PT | $2,500 | $2,625 | $2,756 | $2,894 | $3,038 |
| Retail Sales PT | $0 | $2,500 | $2,625 | $2,756 | $2,894 |
| Retail Sales PT | $0 | $0 | $2,500 | $2,625 | $2,756 |
| Retail Sales PT | $0 | $0 | $0 | $2,500 | $2,625 |
| Retail Sales PT | $0 | $0 | $0 | $0 | $2,500 |
| Store Manager | $25,000 | $31,500 | $33,075 | $34,730 | $36,470 |
| Store Manager | $0 | $0 | $30,000 | $31,500 | $33,075 |
| Team Sales Manager | $0 | $30,000 | $31,500 | $33,075 | $34,730 |
| Team Sales | $0 | $0 | $25,000 | $26,250 | $27,570 |
| Team Sales | $0 | $0 | $0 | $0 | $25,000 |
| President & CEO | $60,000 | $75,000 | $100,000 | $125,000 | $150,000 |
| Total People | 10 | 14 | 19 | 21 | 25 |
| Total Payroll | $194,136 | $271,090 | $416,164 | $477,502 | $583,532 |
Financial Plan
The Sportsuchtig financial picture is quite promising. Since Sportsuchtig is a currently operating business, there will be sales and cash coming into the business on day 1 when the operation is taken over by the Johnson’s. An initial working capital investment of $50,000 dollars will be necessary to assure that expenses are covered in the first 2 months, but after that it is assumed that cash from operations will be sufficient to fund and reach the milestones in this plan.
The owners have a personal equity line sufficient to finance any monthly cash-flow shortage; however, a business line of credit will be established as soon as possible. We anticipate very few accounts receivables initially, with 95% of sales cash and carry (cash, checks, credit cards). Marketing and advertising will remain at or below 5% of sales. We will continue to reinvest residual profits into company expansion, and personnel.
8.1 Start-up Funding
An approximately $700,000 loan will be obtained from a conventional or SBA lender. At least $340,000 capital will be provided by the purchasers/owners – the Johnsons. It is possible that some financing may be provided by an active investor or partner in exchange for some level of ownership in the business. If an agreement with an investor or partner cannot be reached, then the owners will contribute all of the funding outside of the loan funding.
| Start-up Funding | |
| Start-up Expenses to Fund | $40,300 |
| Start-up Assets to Fund | $1,000,000 |
| Total Funding Required | $1,040,300 |
| Assets | |
| Non-cash Assets from Start-up | $950,000 |
| Cash Requirements from Start-up | $50,000 |
| Additional Cash Raised | $0 |
| Cash Balance on Starting Date | $50,000 |
| Total Assets | $1,000,000 |
| Liabilities and Capital | |
| Liabilities | |
| Current Borrowing | $0 |
| Long-term Liabilities | $740,300 |
| Accounts Payable (Outstanding Bills) | $0 |
| Other Current Liabilities (interest-free) | $0 |
| Total Liabilities | $740,300 |
| Capital | |
| Planned Investment | |
| Owner – John Johnson | $250,000 |
| Owner – Jane Johnson | $50,000 |
| Additional Investment Requirement | $0 |
| Total Planned Investment | $300,000 |
| Loss at Start-up (Start-up Expenses) | ($40,300) |
| Total Capital | $259,700 |
| Total Capital and Liabilities | $1,000,000 |
| Total Funding | $1,040,300 |
8.2 Important Assumptions
The financial plan depends on important assumptions, most of which are shown in the following table. The key underlying assumptions are:
- We assume access to financing sufficient to maintain our financial plan as shown in the tables.
- We assume inventory can be turned in 6-8 months.
- Accounts receivable are small except for periodic sales to teams. Everything else is cash/credit and carry. We accept cash and checks, Visa, MasterCard, Discover and American Express. All sales paid via credit cards will be deposited in our business checking account within 48 hours.
- We anticipate that we will be able to complete required financing, lease documents, and due diligence to allow for a November or December 2004 closing and business take over.
- We assume a slow-growth economy, without major recession.
8.3 Break-even Analysis
For our break-even analysis, we assume running costs which include payroll, rent, utilities, interest expense on the funding loan, and an estimation of other running costs. These estimations are based on real financial history data provided by the sellers of the business. Our sales forecast indicates that monthly sales are expected to be much greater than the break-even point.

| Break-even Analysis | |
| Monthly Revenue Break-even | $149,547 |
| Assumptions: | |
| Average Percent Variable Cost | 75% |
| Estimated Monthly Fixed Cost | $37,383 |
8.4 Projected Profit and Loss
The projected Profit and Loss for five years is detailed in the table and charts following. Monthly projected Profit and Loss for year 1 is available in the Appendix. Some assumptions and inclusions to be noted are:
- First year expense and revenue projections are based on the previous 2 years of actual financial data provided by the business seller. Since this is an existing business being purchased, we have lots of real historical financial information to analyze for trends.
- Insurance includes: Business property and inventory, liability and interruption, and key person life insurance.
- We have made assumptions, based on past results, that certain expenses will rise in direct proportion to sales. For example, Bank Card Debit & Service Fees will rise in direct proportion to sales because more sales results in more credit cards being used for purchase transactions. Also, Freight In will rise in proportion because more inventory will need to be shipped in as sales rise. Other expenses that have been projected proportionally to sales increases include Insurance (for inventory), Office Supplies, and Telephone.
- Freight In historically has been .5% of gross sales.
- Bank Card and Debit Service Fees incurred because of credit card sales are calculated at 2.0%.
- Rent increases significantly in years 2-5 because of the retail store and warehouse relocation.
- Marketing/Promotion expenditures will be increased significantly from the past in years 1 and 2 and then be increased as the business grows and expands.
- Payroll expenses will increase as the business grows and we need to hire additional staff.
We expect to be profitable in the first year, with net profits increasing steadily as the reputation of our business, its employees, and services become apparent to the local market and we reap the expected revenue gains from relocating the retail store, enhancing the Website, and expanding into additional products.


| Pro Forma Profit and Loss | |||||
| Year 1 | Year 2 | Year 3 | Year 4 | Year 5 | |
| Sales | $2,408,535 | $2,890,242 | $3,468,290 | $4,161,948 | $4,994,339 |
| Direct Cost of Sales | $1,806,461 | $2,109,877 | $2,427,803 | $2,788,505 | $3,246,320 |
| Other Costs of Sales | $0 | $0 | $0 | $0 | $0 |
| Total Cost of Sales | $1,806,461 | $2,109,877 | $2,427,803 | $2,788,505 | $3,246,320 |
| Gross Margin | $602,074 | $780,365 | $1,040,487 | $1,373,443 | $1,748,019 |
| Gross Margin % | 25.00% | 27.00% | 30.00% | 33.00% | 35.00% |
| Expenses | |||||
| Payroll | $194,136 | $271,090 | $416,164 | $477,502 | $583,532 |
| Marketing/Promotion | $25,000 | $35,000 | $50,000 | $75,000 | $90,000 |
| Depreciation | $3,000 | $3,000 | $3,000 | $3,000 | $3,000 |
| Rent | $36,000 | $90,000 | $90,000 | $90,000 | $90,000 |
| Utilities | $11,960 | $15,900 | $16,000 | $16,100 | $16,200 |
| Insurance | $25,200 | $27,720 | $30,492 | $33,541 | $36,895 |
| Bad Checks | $600 | $720 | $864 | $1,037 | $1,244 |
| Bank Card Debit & Service Fees | $48,896 | $58,672 | $70,406 | $84,488 | $101,385 |
| Repairs and Maintenance | $3,960 | $4,000 | $4,000 | $4,000 | $4,000 |
| Taxes and Licenses | $8,000 | $8,000 | $8,000 | $8,000 | $8,000 |
| Freight In | $13,065 | $15,896 | $19,075 | $22,890 | $27,470 |
| Interest Expense | $37,152 | $34,106 | $30,440 | $24,954 | $21,645 |
| Janitorial Supplies | $396 | $400 | $400 | $400 | $400 |
| Legal/Professional Fees | $4,030 | $3,500 | $3,500 | $3,500 | $3,500 |
| Travel & Entertainment | $2,000 | $3,000 | $3,500 | $4,000 | $4,500 |
| Membership Dues & Sub | $900 | $1,000 | $1,000 | $1,500 | $1,500 |
| Office Supplies | $6,000 | $8,000 | $10,000 | $13,000 | $16,000 |
| Personal Property Tax | $250 | $300 | $350 | $400 | $500 |
| Security | $1,050 | $1,000 | $1,000 | $1,000 | $1,000 |
| Internet Services | $2,400 | $2,400 | $2,400 | $2,400 | $2,400 |
| WEB Page Services | $4,000 | $6,000 | $6,000 | $6,000 | $6,000 |
| Postage | $600 | $1,000 | $1,200 | $1,400 | $1,700 |
| Telephone | $20,000 | $22,000 | $24,200 | $26,620 | $29,282 |
| Total Operating Expenses | $448,595 | $612,704 | $791,991 | $900,732 | $1,050,153 |
| Profit Before Interest and Taxes | $155,879 | $170,537 | $251,886 | $476,841 | $702,866 |
| EBITDA | $158,879 | $173,537 | $254,886 | $479,841 | $705,866 |
| Interest Expense | $71,129 | $65,776 | $59,900 | $53,643 | $46,835 |
| Taxes Incurred | $25,425 | $31,428 | $57,596 | $126,960 | $196,809 |
| Other Income | |||||
| Interest Income | $1,920 | $2,300 | $2,700 | $3,300 | $4,000 |
| Miscellaneous Income | $480 | $576 | $690 | $830 | $1,000 |
| Purchase Discounts Taken | $0 | $0 | $0 | $0 | $0 |
| Total Other Income | $2,400 | $2,876 | $3,390 | $4,130 | $5,000 |
| Other Expense | |||||
| Other Expense Account Name | $0 | $0 | $0 | $0 | $0 |
| Other Expense Account Name | $0 | $0 | $0 | $0 | $0 |
| Total Other Expense | $0 | $0 | $0 | $0 | $0 |
| Net Other Income | $2,400 | $2,876 | $3,390 | $4,130 | $5,000 |
| Net Profit | $59,325 | $73,333 | $134,390 | $296,239 | $459,221 |
| Net Profit/Sales | 2.46% | 2.54% | 3.87% | 7.12% | 9.19% |
8.5 Projected Cash Flow
Cash flow will have to be carefully monitored, as in any business, but Sportsuchtig has the advantage of operating a primarily cash and carry business. After the initial investment and start-up costs are covered, the business will become relatively self-sustaining. The principle payments to service the $700,000 funding loan are reflected in the Cash Flow table.
The key to managing cash flow is to understand the current monthly sales data and to successfully manage the timing of inventory purchases. Sales for Sportsuchtig typically spike in the spring months of February, March, April, May and June. Inventory for this spring season is purchased in bulk from the four major suppliers in the fall months and can cost between $500,000 to $800,000, depending upon the extent of the orders. The suppliers provide significant price breaks on the bulk orders and do not require payment until April 1. Some of the payables associated with this inventory are paid over the 5-6 months before April 1, but the majority is kept in the cash account until full payment on April 1. Additional orders besides the fall bulk orders are also placed as needed throughout the rest of the year. Terms on these inventory orders are typically Net 30 and they are paid in in 30 days. Inventory levels are usually maintained at high levels, due to the need to have product in stock and available when customers need it and it is turned every 6-8 months. We will focus on reducing inventory levels in order to improve cash flow.
The significant cash flow negative in April is expected and is a result of paying the inventory accounts payable that have accrued over the 5-6 months between purchase and the April 1 payment.
Any amounts above $50,000 will be invested into semi-liquid stock portfolios to decrease the opportunity cost of cash held. The interest will show up as Interest Income in the Profit and Loss table and will be updated quarterly.
Cash flow projections are critical to our success. The following table shows cash flow for the first five years, and the chart illustrates monthly cash flow in the first year. Monthly cash flow projections are included in the appendix.

| Pro Forma Cash Flow | |||||
| Year 1 | Year 2 | Year 3 | Year 4 | Year 5 | |
| Cash Received | |||||
| Cash from Operations | |||||
| Cash Sales | $2,360,364 | $2,832,437 | $3,398,924 | $4,078,709 | $4,894,452 |
| Subtotal Cash from Operations | $2,406,437 | $2,889,822 | $3,467,787 | $4,161,344 | $4,993,614 |
| Additional Cash Received | |||||
| Sales Tax, VAT, HST/GST Received | $0 | $0 | $0 | $0 | $0 |
| New Current Borrowing | $0 | $0 | $0 | $0 | $0 |
| New Other Liabilities (interest-free) | $0 | $0 | $0 | $0 | $0 |
| New Long-term Liabilities | $0 | $0 | $0 | $0 | $0 |
| Sales of Other Current Assets | $0 | $0 | $0 | $0 | $0 |
| Sales of Long-term Assets | $0 | $0 | $0 | $0 | $0 |
| New Investment Received | $0 | $0 | $0 | $0 | $0 |
| Subtotal Cash Received | $2,408,837 | $2,892,698 | $3,471,177 | $4,165,474 | $4,998,614 |
| Expenditures | Year 1 | Year 2 | Year 3 | Year 4 | Year 5 |
| Expenditures from Operations | |||||
| Cash Spending | $194,136 | $271,090 | $416,164 | $477,502 | $583,532 |
| Bill Payments | $1,782,738 | $2,440,385 | $2,983,554 | $3,493,660 | $4,081,465 |
| Subtotal Spent on Operations | $1,976,874 | $2,711,475 | $3,399,718 | $3,971,162 | $4,664,997 |
| Additional Cash Spent | |||||
| Sales Tax, VAT, HST/GST Paid Out | $0 | $0 | $0 | $0 | $0 |
| Principal Repayment of Current Borrowing | $0 | $0 | $0 | $0 | $0 |
| Other Liabilities Principal Repayment | $0 | $0 | $0 | $0 | $0 |
| Long-term Liabilities Principal Repayment | $54,012 | $57,056 | $60,468 | $64,677 | $71,465 |
| Purchase Other Current Assets | $0 | $0 | $0 | $0 | $0 |
| Purchase Long-term Assets | $0 | $0 | $0 | $0 | $0 |
| Dividends | $0 | $0 | $0 | $0 | $0 |
| Subtotal Cash Spent | $2,030,886 | $2,768,531 | $3,460,186 | $4,035,839 | $4,736,462 |
| Net Cash Flow | $377,951 | $124,168 | $10,991 | $129,635 | $262,152 |
| Cash Balance | $427,951 | $552,119 | $563,109 | $692,744 | $954,896 |
8.6 Projected Balance Sheet
Sportsuchtig’ projected balance sheet shows an increase in net worth by 2009, at which point it expects to be making significant after-tax profit on sales of $5 million. With the present financial projections, Sportsuchtig expects to build a company with strong profit potential, and a solid balance sheet that will be asset heavy and flush with cash at the end of five years. We plan on using the excess cash for continued growth.
The projected Balance Sheet for five years is detailed in the table following. Monthly projections for the first year Balance Sheet are available for review in the Appendix.
| Pro Forma Balance Sheet | |||||
| Year 1 | Year 2 | Year 3 | Year 4 | Year 5 | |
| Assets | |||||
| Current Assets | |||||
| Cash | $427,951 | $552,119 | $563,109 | $692,744 | $954,896 |
| Accounts Receivable | $2,098 | $2,517 | $3,021 | $3,625 | $4,350 |
| Inventory | $547,750 | $639,751 | $736,152 | $883,382 | $1,060,059 |
| Other Current Assets | $25,000 | $25,000 | $25,000 | $25,000 | $25,000 |
| Total Current Assets | $1,002,799 | $1,219,387 | $1,327,281 | $1,604,751 | $2,044,304 |
| Long-term Assets | |||||
| Long-term Assets | $25,000 | $25,000 | $25,000 | $25,000 | $25,000 |
| Accumulated Depreciation | $3,000 | $6,000 | $9,000 | $12,000 | $15,000 |
| Total Long-term Assets | $22,000 | $19,000 | $16,000 | $13,000 | $10,000 |
| Total Assets | $1,024,799 | $1,238,387 | $1,343,281 | $1,617,751 | $2,054,304 |
| Liabilities and Capital | Year 1 | Year 2 | Year 3 | Year 4 | Year 5 |
| Current Liabilities | |||||
| Accounts Payable | $19,486 | $216,797 | $247,769 | $290,677 | $339,474 |
| Current Borrowing | $0 | $0 | $0 | $0 | $0 |
| Other Current Liabilities | $0 | $0 | $0 | $0 | $0 |
| Subtotal Current Liabilities | $19,486 | $216,797 | $247,769 | $290,677 | $339,474 |
| Long-term Liabilities | $686,288 | $629,232 | $568,764 | $504,087 | $432,622 |
| Total Liabilities | $705,774 | $846,029 | $816,533 | $794,764 | $772,096 |
| Paid-in Capital | $300,000 | $300,000 | $300,000 | $300,000 | $300,000 |
| Retained Earnings | ($40,300) | $19,025 | $92,358 | $226,748 | $522,987 |
| Earnings | $59,325 | $73,333 | $134,390 | $296,239 | $459,221 |
| Total Capital | $319,025 | $392,358 | $526,748 | $822,987 | $1,282,208 |
| Total Liabilities and Capital | $1,024,799 | $1,238,387 | $1,343,281 | $1,617,751 | $2,054,304 |
| Net Worth | $319,025 | $392,358 | $526,748 | $822,987 | $1,282,208 |
8.7 Business Ratios
Business ratios for the years of this plan are shown below. Industry profile ratios based on the Standard Industrial Classification (SIC) code 5941, Sporting Goods and Bicycle Shops, are shown for comparison.
| Ratio Analysis | ||||||
| Year 1 | Year 2 | Year 3 | Year 4 | Year 5 | Industry Profile | |
| Sales Growth | 0.00% | 20.00% | 20.00% | 20.00% | 20.00% | 4.63% |
| Percent of Total Assets | ||||||
| Accounts Receivable | 0.20% | 0.20% | 0.22% | 0.22% | 0.21% | 15.78% |
| Inventory | 53.45% | 51.66% | 54.80% | 54.61% | 51.60% | 38.67% |
| Other Current Assets | 2.44% | 2.02% | 1.86% | 1.55% | 1.22% | 26.26% |
| Total Current Assets | 97.85% | 98.47% | 98.81% | 99.20% | 99.51% | 80.71% |
| Long-term Assets | 2.15% | 1.53% | 1.19% | 0.80% | 0.49% | 19.29% |
| Total Assets | 100.00% | 100.00% | 100.00% | 100.00% | 100.00% | 100.00% |
| Current Liabilities | 1.90% | 17.51% | 18.45% | 17.97% | 16.52% | 37.39% |
| Long-term Liabilities | 66.97% | 50.81% | 42.34% | 31.16% | 21.06% | 14.93% |
| Total Liabilities | 68.87% | 68.32% | 60.79% | 49.13% | 37.58% | 52.32% |
| Net Worth | 31.13% | 31.68% | 39.21% | 50.87% | 62.42% | 47.68% |
| Percent of Sales | ||||||
| Sales | 100.00% | 100.00% | 100.00% | 100.00% | 100.00% | 100.00% |
| Gross Margin | 25.00% | 27.00% | 30.00% | 33.00% | 35.00% | 30.33% |
| Selling, General & Administrative Expenses | 22.53% | 24.46% | 26.13% | 25.88% | 25.81% | 19.32% |
| Advertising Expenses | 0.00% | 0.00% | 0.00% | 0.00% | 0.00% | 1.52% |
| Profit Before Interest and Taxes | 6.47% | 5.90% | 7.26% | 11.46% | 14.07% | 1.44% |
| Main Ratios | ||||||
| Current | 51.46 | 5.62 | 5.36 | 5.52 | 6.02 | 1.89 |
| Quick | 23.35 | 2.67 | 2.39 | 2.48 | 2.90 | 0.77 |
| Total Debt to Total Assets | 68.87% | 68.32% | 60.79% | 49.13% | 37.58% | 59.80% |
| Pre-tax Return on Net Worth | 26.57% | 26.70% | 36.45% | 51.42% | 51.16% | 3.15% |
| Pre-tax Return on Assets | 8.27% | 8.46% | 14.29% | 26.16% | 31.93% | 7.84% |
| Additional Ratios | Year 1 | Year 2 | Year 3 | Year 4 | Year 5 | |
| Net Profit Margin | 2.46% | 2.54% | 3.87% | 7.12% | 9.19% | n.a |
| Return on Equity | 18.60% | 18.69% | 25.51% | 36.00% | 35.81% | n.a |
| Activity Ratios | ||||||
| Accounts Receivable Turnover | 22.96 | 22.96 | 22.96 | 22.96 | 22.96 | n.a |
| Collection Days | 29 | 15 | 15 | 15 | 15 | n.a |
| Inventory Turnover | 2.30 | 3.55 | 3.53 | 3.44 | 3.34 | n.a |
| Accounts Payable Turnover | 92.49 | 12.17 | 12.17 | 12.17 | 12.17 | n.a |
| Payment Days | 27 | 16 | 28 | 28 | 28 | n.a |
| Total Asset Turnover | 2.35 | 2.33 | 2.58 | 2.57 | 2.43 | n.a |
| Debt Ratios | ||||||
| Debt to Net Worth | 2.21 | 2.16 | 1.55 | 0.97 | 0.60 | n.a |
| Current Liab. to Liab. | 0.03 | 0.26 | 0.30 | 0.37 | 0.44 | n.a |
| Liquidity Ratios | ||||||
| Net Working Capital | $983,313 | $1,002,590 | $1,079,512 | $1,314,074 | $1,704,830 | n.a |
| Interest Coverage | 2.19 | 2.59 | 4.21 | 8.89 | 15.01 | n.a |
| Additional Ratios | ||||||
| Assets to Sales | 0.43 | 0.43 | 0.39 | 0.39 | 0.41 | n.a |
| Current Debt/Total Assets | 2% | 18% | 18% | 18% | 17% | n.a |
| Acid Test | 23.25 | 2.66 | 2.37 | 2.47 | 2.89 | n.a |
| Sales/Net Worth | 7.55 | 7.37 | 6.58 | 5.06 | 3.90 | n.a |
| Dividend Payout | 0.00 | 0.00 | 0.00 | 0.00 | 0.00 | n.a |
Appendix
| Sales Forecast | |||||||||||||
| Month 1 | Month 2 | Month 3 | Month 4 | Month 5 | Month 6 | Month 7 | Month 8 | Month 9 | Month 10 | Month 11 | Month 12 | ||
| Sales | |||||||||||||
| Sporting Goods Sales | 0% | $83,709 | $131,575 | $108,300 | $223,300 | $385,600 | $322,100 | $238,450 | $239,400 | $169,100 | $139,175 | $144,400 | $103,075 |
| Shipping Income | 0% | $4,406 | $6,925 | $5,700 | $11,700 | $20,320 | $16,900 | $12,550 | $12,600 | $8,900 | $7,325 | $7,600 | $5,425 |
| Total Sales | $88,115 | $138,500 | $114,000 | $235,000 | $405,920 | $339,000 | $251,000 | $252,000 | $178,000 | $146,500 | $152,000 | $108,500 | |
| Direct Cost of Sales | Month 1 | Month 2 | Month 3 | Month 4 | Month 5 | Month 6 | Month 7 | Month 8 | Month 9 | Month 10 | Month 11 | Month 12 | |
| Cost of Goods Sold | $66,086 | $103,875 | $85,500 | $176,250 | $304,500 | $254,250 | $188,250 | $189,000 | $133,500 | $109,875 | $114,000 | $81,375 | |
| Other | $0 | $0 | $0 | $0 | $0 | $0 | $0 | $0 | $0 | $0 | $0 | $0 | |
| Subtotal Direct Cost of Sales | $66,086 | $103,875 | $85,500 | $176,250 | $304,500 | $254,250 | $188,250 | $189,000 | $133,500 | $109,875 | $114,000 | $81,375 | |
| Personnel Plan | |||||||||||||
| Month 1 | Month 2 | Month 3 | Month 4 | Month 5 | Month 6 | Month 7 | Month 8 | Month 9 | Month 10 | Month 11 | Month 12 | ||
| Warehouse/Shipping & Receiving Manager | 0% | $1,916 | $1,916 | $1,916 | $1,916 | $1,916 | $1,916 | $1,916 | $1,916 | $1,916 | $1,916 | $1,916 | $1,924 |
| Warehouse/Shipping & Receiving Clerk | 0% | $1,567 | $1,567 | $1,567 | $1,567 | $1,567 | $1,567 | $1,567 | $1,567 | $1,567 | $1,567 | $1,567 | $1,563 |
| Warehouse/Shipping & Receiving Clerk | 0% | $0 | $0 | $0 | $0 | $0 | $0 | $0 | $0 | $0 | $0 | $0 | $0 |
| Warehouse/Shipping & Receiving Clerk | 0% | $0 | $0 | $0 | $0 | $0 | $0 | $0 | $0 | $0 | $0 | $0 | $0 |
| Accounting | 0% | $1,916 | $1,916 | $958 | $958 | $958 | $958 | $958 | $958 | $958 | $958 | $958 | $958 |
| Retail Phone / Accounting Assistant | 0% | $0 | $0 | $0 | $0 | $0 | $0 | $0 | $0 | $0 | $0 | $0 | $0 |
| Internet Phone Sales | 0% | $1,417 | $1,417 | $1,417 | $1,417 | $1,417 | $1,417 | $1,417 | $1,417 | $1,417 | $1,417 | $1,417 | $1,413 |
| Internet Phone Sales | 0% | $1,417 | $1,417 | $1,417 | $1,417 | $1,417 | $1,417 | $1,417 | $1,417 | $1,417 | $1,417 | $1,417 | $1,413 |
| Internet Phone Sales | 0% | $1,417 | $1,417 | $709 | $709 | $709 | $709 | $709 | $709 | $709 | $709 | $709 | $709 |
| Internet Phone Sales | 0% | $0 | $0 | $0 | $0 | $0 | $0 | $0 | $0 | $0 | $0 | $0 | $0 |
| Internet Phone Sales | 0% | $0 | $0 | $0 | $0 | $0 | $0 | $0 | $0 | $0 | $0 | $0 | $0 |
| Internet Phone Sales | 0% | $0 | $0 | $0 | $0 | $0 | $0 | $0 | $0 | $0 | $0 | $0 | $0 |
| Retail Sales PT | 0% | $208 | $208 | $208 | $208 | $208 | $208 | $208 | $208 | $208 | $208 | $208 | $212 |
| Retail Sales PT | 0% | $208 | $208 | $208 | $208 | $208 | $208 | $208 | $208 | $208 | $208 | $208 | $212 |
| Retail Sales PT | 0% | $208 | $208 | $208 | $208 | $208 | $208 | $208 | $208 | $208 | $208 | $212 | $208 |
| Retail Sales PT | 0% | $208 | $208 | $208 | $208 | $208 | $208 | $208 | $208 | $212 | $208 | $208 | $208 |
| Retail Sales PT | 0% | $0 | $0 | $0 | $0 | $0 | $0 | $0 | $0 | $0 | $0 | $0 | $0 |
| Retail Sales PT | 0% | $0 | $0 | $0 | $0 | $0 | $0 | $0 | $0 | $0 | $0 | $0 | $0 |
| Retail Sales PT | 0% | $0 | $0 | $0 | $0 | $0 | $0 | $0 | $0 | $0 | $0 | $0 | $0 |
| Retail Sales PT | 0% | $0 | $0 | $0 | $0 | $0 | $0 | $0 | $0 | $0 | $0 | $0 | $0 |
| Store Manager | 0% | $0 | $0 | $2,500 | $2,500 | $2,500 | $2,500 | $2,500 | $2,500 | $2,500 | $2,500 | $2,500 | $2,500 |
| Store Manager | 0% | $0 | $0 | $0 | $0 | $0 | $0 | $0 | $0 | $0 | $0 | $0 | $0 |
| Team Sales Manager | 0% | $0 | $0 | $0 | $0 | $0 | $0 | $0 | $0 | $0 | $0 | $0 | $0 |
| Team Sales | 0% | $0 | $0 | $0 | $0 | $0 | $0 | $0 | $0 | $0 | $0 | $0 | $0 |
| Team Sales | 0% | $0 | $0 | $0 | $0 | $0 | $0 | $0 | $0 | $0 | $0 | $0 | $0 |
| President & CEO | 0% | $5,000 | $5,000 | $5,000 | $5,000 | $5,000 | $5,000 | $5,000 | $5,000 | $5,000 | $5,000 | $5,000 | $5,000 |
| Total People | 10 | 10 | 10 | 10 | 10 | 10 | 10 | 10 | 10 | 10 | 10 | 10 | |
| Total Payroll | $15,482 | $15,482 | $16,316 | $16,316 | $16,316 | $16,316 | $16,316 | $16,316 | $16,320 | $16,316 | $16,320 | $16,320 | |
| Pro Forma Profit and Loss | |||||||||||||
| Month 1 | Month 2 | Month 3 | Month 4 | Month 5 | Month 6 | Month 7 | Month 8 | Month 9 | Month 10 | Month 11 | Month 12 | ||
| Sales | $88,115 | $138,500 | $114,000 | $235,000 | $405,920 | $339,000 | $251,000 | $252,000 | $178,000 | $146,500 | $152,000 | $108,500 | |
| Direct Cost of Sales | $66,086 | $103,875 | $85,500 | $176,250 | $304,500 | $254,250 | $188,250 | $189,000 | $133,500 | $109,875 | $114,000 | $81,375 | |
| Other Costs of Sales | $0 | $0 | $0 | $0 | $0 | $0 | $0 | $0 | $0 | $0 | $0 | $0 | |
| Total Cost of Sales | $66,086 | $103,875 | $85,500 | $176,250 | $304,500 | $254,250 | $188,250 | $189,000 | $133,500 | $109,875 | $114,000 | $81,375 | |
| Gross Margin | $22,029 | $34,625 | $28,500 | $58,750 | $101,420 | $84,750 | $62,750 | $63,000 | $44,500 | $36,625 | $38,000 | $27,125 | |
| Gross Margin % | 25.00% | 25.00% | 25.00% | 25.00% | 24.99% | 25.00% | 25.00% | 25.00% | 25.00% | 25.00% | 25.00% | 25.00% | |
| Expenses | |||||||||||||
| Payroll | $15,482 | $15,482 | $16,316 | $16,316 | $16,316 | $16,316 | $16,316 | $16,316 | $16,320 | $16,316 | $16,320 | $16,320 | |
| Marketing/Promotion | $1,500 | $2,000 | $500 | $2,500 | $2,500 | $2,500 | $1,500 | $1,500 | $5,000 | $2,500 | $1,500 | $1,500 | |
| Depreciation | $250 | $250 | $250 | $250 | $250 | $250 | $250 | $250 | $250 | $250 | $250 | $250 | |
| Rent | $3,000 | $3,000 | $3,000 | $3,000 | $3,000 | $3,000 | $3,000 | $3,000 | $3,000 | $3,000 | $3,000 | $3,000 | |
| Utilities | $720 | $740 | $820 | $840 | $930 | $840 | $750 | $720 | $800 | $1,600 | $1,600 | $1,600 | |
| Insurance | $2,100 | $2,100 | $2,100 | $2,100 | $2,100 | $2,100 | $2,100 | $2,100 | $2,100 | $2,100 | $2,100 | $2,100 | |
| Bad Checks | $50 | $50 | $50 | $50 | $50 | $50 | $50 | $50 | $50 | $50 | $50 | $50 | |
| Bank Card Debit & Service Fees | $1,789 | $2,812 | $2,314 | $4,770 | $8,242 | $6,882 | $5,095 | $5,116 | $3,613 | $2,974 | $3,086 | $2,203 | |
| Repairs and Maintenance | $330 | $330 | $330 | $330 | $330 | $330 | $330 | $330 | $330 | $330 | $330 | $330 | |
| Taxes and Licenses | $2,000 | $0 | $0 | $0 | $0 | $2,000 | $0 | $0 | $2,000 | $0 | $0 | $2,000 | |
| Freight In | $2,900 | $2,200 | $1,580 | $510 | $1,700 | $1,200 | $700 | $575 | $400 | $400 | $500 | $400 | |
| Interest Expense | $3,208 | $3,188 | $3,168 | $3,148 | $3,127 | $3,107 | $3,086 | $3,066 | $3,045 | $3,024 | $3,003 | $2,982 | |
| Janitorial Supplies | $33 | $33 | $33 | $33 | $33 | $33 | $33 | $33 | $33 | $33 | $33 | $33 | |
| Legal/Professional Fees | $500 | $170 | $170 | $170 | $1,000 | $170 | $170 | $170 | $170 | $1,000 | $170 | $170 | |
| Travel & Entertainment | $0 | $0 | $0 | $0 | $0 | $0 | $0 | $2,000 | $0 | $0 | $0 | $0 | |
| Membership Dues & Sub | $200 | $0 | $200 | $0 | $0 | $0 | $0 | $0 | $500 | $0 | $0 | $0 | |
| Office Supplies | $500 | $500 | $500 | $500 | $500 | $500 | $500 | $500 | $500 | $500 | $500 | $500 | |
| Personal Property Tax | $0 | $0 | $0 | $0 | $0 | $0 | $250 | $0 | $0 | $0 | $0 | $0 | |
| Security | $500 | $50 | $50 | $50 | $50 | $50 | $50 | $50 | $50 | $50 | $50 | $50 | |
| Internet Services | $200 | $200 | $200 | $200 | $200 | $200 | $200 | $200 | $200 | $200 | $200 | $200 | |
| WEB Page Services | $250 | $250 | $250 | $250 | $250 | $250 | $250 | $250 | $500 | $500 | $500 | $500 | |
| Postage | 15% | $50 | $50 | $50 | $50 | $50 | $50 | $50 | $50 | $50 | $50 | $50 | $50 |
| Telephone | $800 | $1,500 | $1,200 | $2,000 | $2,500 | $3,000 | $2,500 | $1,800 | $1,700 | $1,200 | $1,000 | $800 | |
| Total Operating Expenses | $36,362 | $34,905 | $33,081 | $37,067 | $43,128 | $42,828 | $37,180 | $38,076 | $40,611 | $36,077 | $34,242 | $35,038 | |
| Profit Before Interest and Taxes | ($14,133) | ($80) | ($4,381) | $21,883 | $58,492 | $42,122 | $25,770 | $25,124 | $4,089 | $748 | $3,958 | ($7,713) | |
| EBITDA | ($13,883) | $170 | ($4,131) | $22,133 | $58,742 | $42,372 | $26,020 | $25,374 | $4,339 | $998 | $4,208 | ($7,463) | |
| Interest Expense | $6,133 | $6,096 | $6,059 | $6,022 | $5,985 | $5,947 | $5,910 | $5,872 | $5,834 | $5,796 | $5,758 | $5,719 | |
| Taxes Incurred | ($6,080) | ($1,853) | ($3,132) | $4,758 | $15,752 | $10,852 | $5,958 | $5,776 | ($523) | ($1,514) | ($540) | ($4,030) | |
| Other Income | |||||||||||||
| Interest Income | $160 | $160 | $160 | $160 | $160 | $160 | $160 | $160 | $160 | $160 | $160 | $160 | |
| Miscellaneous Income | $40 | $40 | $40 | $40 | $40 | $40 | $40 | $40 | $40 | $40 | $40 | $40 | |
| Purchase Discounts Taken | $0 | $0 | $0 | $0 | $0 | $0 | $0 | $0 | $0 | $0 | $0 | $0 | |
| Total Other Income | $200 | $200 | $200 | $200 | $200 | $200 | $200 | $200 | $200 | $200 | $200 | $200 | |
| Other Expense | |||||||||||||
| Other Expense Account Name | $0 | $0 | $0 | $0 | $0 | $0 | $0 | $0 | $0 | $0 | $0 | $0 | |
| Other Expense Account Name | $0 | $0 | $0 | $0 | $0 | $0 | $0 | $0 | $0 | $0 | $0 | $0 | |
| Total Other Expense | $0 | $0 | $0 | $0 | $0 | $0 | $0 | $0 | $0 | $0 | $0 | $0 | |
| Net Other Income | $200 | $200 | $200 | $200 | $200 | $200 | $200 | $200 | $200 | $200 | $200 | $200 | |
| Net Profit | ($14,186) | ($4,323) | ($7,308) | $11,103 | $36,755 | $25,322 | $13,902 | $13,477 | ($1,221) | ($3,533) | ($1,260) | ($9,402) | |
| Net Profit/Sales | -16.10% | -3.12% | -6.41% | 4.72% | 9.05% | 7.47% | 5.54% | 5.35% | -0.69% | -2.41% | -0.83% | -8.67% | |
| Pro Forma Cash Flow | |||||||||||||
| Month 1 | Month 2 | Month 3 | Month 4 | Month 5 | Month 6 | Month 7 | Month 8 | Month 9 | Month 10 | Month 11 | Month 12 | ||
| Cash Received | |||||||||||||
| Cash from Operations | |||||||||||||
| Cash Sales | $86,353 | $135,730 | $111,720 | $230,300 | $397,802 | $332,220 | $245,980 | $246,960 | $174,440 | $143,570 | $148,960 | $106,330 | |
| Subtotal Cash from Operations | $86,411 | $137,526 | $114,474 | $232,661 | $402,616 | $340,294 | $252,701 | $251,981 | $179,431 | $147,109 | $151,894 | $109,341 | |
| Additional Cash Received | |||||||||||||
| Sales Tax, VAT, HST/GST Received | 0.00% | $0 | $0 | $0 | $0 | $0 | $0 | $0 | $0 | $0 | $0 | $0 | $0 |
| New Current Borrowing | $0 | $0 | $0 | $0 | $0 | $0 | $0 | $0 | $0 | $0 | $0 | $0 | |
| New Other Liabilities (interest-free) | $0 | $0 | $0 | $0 | $0 | $0 | $0 | $0 | $0 | $0 | $0 | $0 | |
| New Long-term Liabilities | $0 | $0 | $0 | $0 | $0 | $0 | $0 | $0 | $0 | $0 | $0 | $0 | |
| Sales of Other Current Assets | $0 | $0 | $0 | $0 | $0 | $0 | $0 | $0 | $0 | $0 | $0 | $0 | |
| Sales of Long-term Assets | $0 | $0 | $0 | $0 | $0 | $0 | $0 | $0 | $0 | $0 | $0 | $0 | |
| New Investment Received | $0 | $0 | $0 | $0 | $0 | $0 | $0 | $0 | $0 | $0 | $0 | $0 | |
| Subtotal Cash Received | $86,611 | $137,726 | $114,674 | $232,861 | $402,816 | $340,494 | $252,901 | $252,181 | $179,631 | $147,309 | $152,094 | $109,541 | |
| Expenditures | Month 1 | Month 2 | Month 3 | Month 4 | Month 5 | Month 6 | Month 7 | Month 8 | Month 9 | Month 10 | Month 11 | Month 12 | |
| Expenditures from Operations | |||||||||||||
| Cash Spending | $15,482 | $15,482 | $16,316 | $16,316 | $16,316 | $16,316 | $16,316 | $16,316 | $16,320 | $16,316 | $16,320 | $16,320 | |
| Bill Payments | $689 | $20,774 | $23,284 | $27,727 | $287,919 | $845,041 | $236,042 | $32,504 | $33,031 | $29,166 | $30,429 | $216,132 | |
| Subtotal Spent on Operations | $16,171 | $36,256 | $39,600 | $44,043 | $304,235 | $861,357 | $252,358 | $48,820 | $49,351 | $45,482 | $46,749 | $232,452 | |
| Additional Cash Spent | |||||||||||||
| Sales Tax, VAT, HST/GST Paid Out | $0 | $0 | $0 | $0 | $0 | $0 | $0 | $0 | $0 | $0 | $0 | $0 | |
| Principal Repayment of Current Borrowing | $0 | $0 | $0 | $0 | $0 | $0 | $0 | $0 | $0 | $0 | $0 | $0 | |
| Other Liabilities Principal Repayment | $0 | $0 | $0 | $0 | $0 | $0 | $0 | $0 | $0 | $0 | $0 | $0 | |
| Long-term Liabilities Principal Repayment | $4,389 | $4,409 | $4,429 | $4,449 | $4,470 | $4,490 | $4,511 | $4,531 | $4,552 | $4,573 | $4,594 | $4,615 | |
| Purchase Other Current Assets | $0 | $0 | $0 | $0 | $0 | $0 | $0 | $0 | $0 | $0 | $0 | $0 | |
| Purchase Long-term Assets | $0 | $0 | $0 | $0 | $0 | $0 | $0 | $0 | $0 | $0 | $0 | $0 | |
| Dividends | $0 | $0 | $0 | $0 | $0 | $0 | $0 | $0 | $0 | $0 | $0 | $0 | |
| Subtotal Cash Spent | $20,560 | $40,665 | $44,029 | $48,492 | $308,705 | $865,847 | $256,869 | $53,351 | $53,903 | $50,055 | $51,343 | $237,067 | |
| Net Cash Flow | $66,051 | $97,061 | $70,645 | $184,369 | $94,110 | ($525,353) | ($3,968) | $198,829 | $125,728 | $97,254 | $100,751 | ($127,526) | |
| Cash Balance | $116,051 | $213,112 | $283,757 | $468,126 | $562,236 | $36,883 | $32,915 | $231,744 | $357,472 | $454,726 | $555,477 | $427,951 | |
| Pro Forma Balance Sheet | |||||||||||||
| Month 1 | Month 2 | Month 3 | Month 4 | Month 5 | Month 6 | Month 7 | Month 8 | Month 9 | Month 10 | Month 11 | Month 12 | ||
| Assets | Starting Balances | ||||||||||||
| Current Assets | |||||||||||||
| Cash | $50,000 | $116,051 | $213,112 | $283,757 | $468,126 | $562,236 | $36,883 | $32,915 | $231,744 | $357,472 | $454,726 | $555,477 | $427,951 |
| Accounts Receivable | $0 | $1,704 | $2,678 | $2,204 | $4,543 | $7,848 | $6,554 | $4,853 | $4,872 | $3,441 | $2,832 | $2,939 | $2,098 |
| Inventory | $900,000 | $833,914 | $730,039 | $644,539 | $705,000 | $1,218,000 | $1,163,750 | $975,500 | $786,500 | $653,000 | $543,125 | $629,125 | $547,750 |
| Other Current Assets | $25,000 | $25,000 | $25,000 | $25,000 | $25,000 | $25,000 | $25,000 | $25,000 | $25,000 | $25,000 | $25,000 | $25,000 | $25,000 |
| Total Current Assets | $975,000 | $976,669 | $970,829 | $955,500 | $1,202,669 | $1,813,084 | $1,232,187 | $1,038,268 | $1,048,116 | $1,038,914 | $1,025,684 | $1,212,541 | $1,002,799 |
| Long-term Assets | |||||||||||||
| Long-term Assets | $25,000 | $25,000 | $25,000 | $25,000 | $25,000 | $25,000 | $25,000 | $25,000 | $25,000 | $25,000 | $25,000 | $25,000 | $25,000 |
| Accumulated Depreciation | $0 | $250 | $500 | $750 | $1,000 | $1,250 | $1,500 | $1,750 | $2,000 | $2,250 | $2,500 | $2,750 | $3,000 |
| Total Long-term Assets | $25,000 | $24,750 | $24,500 | $24,250 | $24,000 | $23,750 | $23,500 | $23,250 | $23,000 | $22,750 | $22,500 | $22,250 | $22,000 |
| Total Assets | $1,000,000 | $1,001,419 | $995,329 | $979,750 | $1,226,669 | $1,836,834 | $1,255,687 | $1,061,518 | $1,071,116 | $1,061,664 | $1,048,184 | $1,234,791 | $1,024,799 |
| Liabilities and Capital | Month 1 | Month 2 | Month 3 | Month 4 | Month 5 | Month 6 | Month 7 | Month 8 | Month 9 | Month 10 | Month 11 | Month 12 | |
| Current Liabilities | |||||||||||||
| Accounts Payable | $0 | $19,993 | $22,636 | $18,794 | $259,059 | $836,939 | $234,960 | $31,399 | $32,052 | $28,373 | $22,999 | $215,460 | $19,486 |
| Current Borrowing | $0 | $0 | $0 | $0 | $0 | $0 | $0 | $0 | $0 | $0 | $0 | $0 | $0 |
| Other Current Liabilities | $0 | $0 | $0 | $0 | $0 | $0 | $0 | $0 | $0 | $0 | $0 | $0 | $0 |
| Subtotal Current Liabilities | $0 | $19,993 | $22,636 | $18,794 | $259,059 | $836,939 | $234,960 | $31,399 | $32,052 | $28,373 | $22,999 | $215,460 | $19,486 |
| Long-term Liabilities | $740,300 | $735,911 | $731,502 | $727,073 | $722,624 | $718,154 | $713,664 | $709,153 | $704,622 | $700,070 | $695,497 | $690,903 | $686,288 |
| Total Liabilities | $740,300 | $755,904 | $754,138 | $745,867 | $981,683 | $1,555,093 | $948,624 | $740,552 | $736,674 | $728,443 | $718,496 | $906,363 | $705,774 |
| Paid-in Capital | $300,000 | $300,000 | $300,000 | $300,000 | $300,000 | $300,000 | $300,000 | $300,000 | $300,000 | $300,000 | $300,000 | $300,000 | $300,000 |
| Retained Earnings | ($40,300) | ($40,300) | ($40,300) | ($40,300) | ($40,300) | ($40,300) | ($40,300) | ($40,300) | ($40,300) | ($40,300) | ($40,300) | ($40,300) | ($40,300) |
| Earnings | $0 | ($14,186) | ($18,509) | ($25,817) | ($14,714) | $22,041 | $47,363 | $61,266 | $74,742 | $73,521 | $69,987 | $68,728 | $59,325 |
| Total Capital | $259,700 | $245,514 | $241,191 | $233,883 | $244,986 | $281,741 | $307,063 | $320,966 | $334,442 | $333,221 | $329,687 | $328,428 | $319,025 |
| Total Liabilities and Capital | $1,000,000 | $1,001,419 | $995,329 | $979,750 | $1,226,669 | $1,836,834 | $1,255,687 | $1,061,518 | $1,071,116 | $1,061,664 | $1,048,184 | $1,234,791 | $1,024,799 |
| Net Worth | $259,700 | $245,514 | $241,191 | $233,883 | $244,986 | $281,741 | $307,063 | $320,966 | $334,442 | $333,221 | $329,687 | $328,428 | $319,025 |

