
Chicano Stylez
Executive Summary
Chicano Stylez (CS) is a dazzling clothing and accessories store aimed at the growing Chicano/Hispanic population in Eugene, Oregon. We are here to provide unique products from Los Angeles to South America. It is the goal of CS to become Oregon’s top cultural retail store. We hope to obtain both high profits and a reputation for great customer satisfaction by offering a large variety of high quality and rare products to our customers.
Located in downtown Eugene, we provide a central location for the growing Hispanic community. We believe it is important to create an atmosphere of acceptance and community care, as well as a place where individuals can identify and bond with aspects of their culture. Our company takes pride in giving back to the community by offering free services to children, such as story nights, art lessons, and lessons in music appreciation.
Chicano Stylez encourages a creative work environment for it’s employees, as well as a deep respect for diversity. In addition to this, we offer employee goals such as profit sharing with company growth.

1.1 Objectives
- To make Chicano Stylez the number one cultural retail store in Oregon.
- To receive a modest profit margin within the first year.
- To have a customer base of 5,000 by the end of year one.
- To achieve a positive net profit by year two.
1.2 Keys to Success
In order for Chicano Stylez to succeed we must:
- Offer high-quality products
- Provide excellent customer service
- Be a helpful and respected member of the community
- Create continued customer loyalty, resulting in repeat purchases
Company Summary
Chicano Stylez is a contemporary retail clothing outlet designed to attract the Chicano/Hispanic population. In addition, CS will provide styles to the population of Eugene who wishes to dress and accessorize in the latest, hip fashions.
The store will remain involved with the community through our outreach program, to be described in later sections. We encourage diversity, and do not wish to only target the Hispanic market; we want ALL of Eugene to come to our store.
2.1 Company Ownership
This will be a simple sole proprietorship owned by Sandra Adams. We intend to wait until the business grows before we incorporate, if at all.
2.2 Start-up Summary
Assets will make up 80% of start-up costs.
The start-up expenses are fairly low in comparison. Start-up costs focus on inventory for my clothing and accessories which are extremely important. Expenses include:
- Pricing tools
- Cash register
- Advertising and design of brochures
- Legal fees for security
- Consulting fees to help with merchandising and layout of the store to obtain maximum benefit
- Start-up costs will be financed by the owner and a combination of investors

| Start-up | |
| Requirements | |
| Start-up Expenses | |
| Legal | $1,000 |
| Stationery etc. | $2,000 |
| Brochures | $500 |
| Consultants | $2,500 |
| Insurance | $300 |
| Rent | $1,000 |
| Research and development | $500 |
| Expensed equipment | $3,500 |
| Other | $1,000 |
| Total Start-up Expenses | $12,300 |
| Start-up Assets | |
| Cash Required | $20,000 |
| Start-up Inventory | $8,000 |
| Other Current Assets | $27,000 |
| Long-term Assets | $0 |
| Total Assets | $55,000 |
| Total Requirements | $67,300 |
| Start-up Funding | |
| Start-up Expenses to Fund | $12,300 |
| Start-up Assets to Fund | $55,000 |
| Total Funding Required | $67,300 |
| Assets | |
| Non-cash Assets from Start-up | $35,000 |
| Cash Requirements from Start-up | $20,000 |
| Additional Cash Raised | $0 |
| Cash Balance on Starting Date | $20,000 |
| Total Assets | $55,000 |
| Liabilities and Capital | |
| Liabilities | |
| Current Borrowing | $0 |
| Long-term Liabilities | $12,000 |
| Accounts Payable (Outstanding Bills) | $10,000 |
| Other Current Liabilities (interest-free) | $0 |
| Total Liabilities | $22,000 |
| Capital | |
| Planned Investment | |
| Investor 1 | $20,000 |
| Investor 2 | $15,000 |
| Other | $10,300 |
| Additional Investment Requirement | $0 |
| Total Planned Investment | $45,300 |
| Loss at Start-up (Start-up Expenses) | ($12,300) |
| Total Capital | $33,000 |
| Total Capital and Liabilities | $55,000 |
| Total Funding | $67,300 |
2.3 Company Locations and Facilities
Located in downtown Eugene, we provide a central location for the growing Hispanic community. We believe it is important to create an atmosphere of acceptance and community care, as well as a place where individuals can identify and bond with all aspects of their culture.
Products
Product descriptions, beyond general categories of clothing and accessories, have been omitted from this sample plan because they were considered proprietary and wouldn’t be useful to anybody else.
3.1 Competitive Comparison
Chicano Stylez has many advantages over its leading competitors.
- New inventory from the hottest and most renowned Latin-American markets.
- Literature, art, and music are an essential part of our store’s atmosphere. We offer these cultural aspects, at no cost, to all children.
- In addition to Latin-American products, we offer clothing and accessories from swap meets and cultural sub-communities, like Olvera Street in Los Angeles. Our aim is to bond with the high Chicano population in Eugene, by offering products that combine both the Latin and American cultures.
- Ambiance of creativity, uniqueness, and a sense of comfort that comes with both recognition of our products.
- Friendly staff who foster a respect and appreciation for diversity.
Market Analysis Summary
The primary target customers of Chicano Stylez are the adult Chicano/Hispanic. CS offers clothing and accessories from the top Latin markets of the world, therefore we assume they are most appealing to people from or familiar with this culture. We believe that the Chicano/Hispanic customers will increasingly grow as the population in Oregon does.
The secondary target customers of CS are teenagers. We offer unique products to this area, and expect an increasing interest amongst young people who generally like to experience new things. CS also drives to be very competitive with prices and on top of the latest styles around the world. Teenagers tend to keep up with the latest fads, therefore, we expect to see a steady increase in this customer segment.
The last target customers of CS is listed as Other. We expect to see a wide variety of people interested in something new and different, from business people to international students. CS believes that we offer great customer service and an overall welcoming, warm, and educating atmosphere, which will keep a variety of customers coming back.
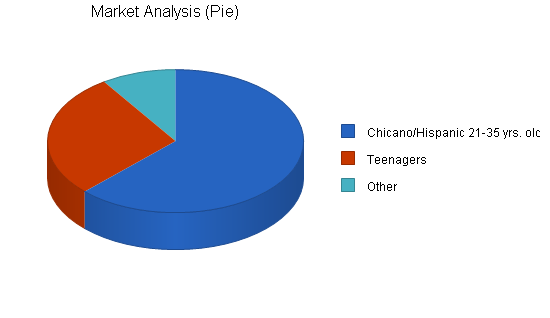
4.1 Market Segmentation
The Chicano/Hispanic population in the Whittaker Eugene area is dominant, therefore leading to a high percentage of our expected customers.
CS offers a wide variety of items from Latin markets around the world. Teenagers are amongst the largest group of trend setters and consumers in today’s market. CS feels that by offering a unique product to the Eugene area, many teenagers will be attracted, therefore leading to the second highest percentage of our customer based population.
The last area of potential customers is labeled as Other. Chicano Stylez offers a high-quality product that is new to many different types of people, both young and old. Our cultural ambiance will attract many interested shoppers, and our customer service will keep people both coming back, and spreading the word to others. This last segment is quite diverse, however we do not expect it to be overwhelming in numbers.
| Market Analysis | |||||||
| Year 1 | Year 2 | Year 3 | Year 4 | Year 5 | |||
| Potential Customers | Growth | CAGR | |||||
| Chicano/Hispanic 21-35 yrs. old | 10% | 2,000 | 2,200 | 2,420 | 2,662 | 2,928 | 10.00% |
| Teenagers | 6% | 900 | 954 | 1,011 | 1,072 | 1,136 | 5.99% |
| Other | 4% | 300 | 312 | 324 | 337 | 350 | 3.93% |
| Total | 8.37% | 3,200 | 3,466 | 3,755 | 4,071 | 4,414 | 8.37% |
4.2 Target Market Segment Strategy
Chicano Stylez has three major trends that help its potential success tremendously.
- Within the last two to three years there has been world-wide media attention regarding the “Latin Explosion.”
- The population increase in the city of Eugene over the past ten years has been exponential.
- The downtown Eugene Whittaker area envelops a high population of the Hispanic/Chicano population, as well as other small stores, restaurants, and a latino center for career and social help.
According to the latest studies, Latin American awareness has increased dramatically, a well as an interest in this cultural lifestyle, clothing, religion, etc.

The three market segments each have their own specific needs, CS intends to target each segment’s needs individually.
Chicano/Hispanic 21-35 years old: CS provides the population with a variety of products expressing the Latin culture.
Teenagers: Young people strive on uniqueness and trendiness, which we offer in the latest styles from around the top Latin markets.
Other: The Hispanic culture is amongst the fastest growing sub-culture in the United States today. People of all races are drawn to elements of the Hispanic culture and it’s peoples.
4.3 Main Competitors
Our competitors share our Whittaker community population. La Tiendita/Taco Loco, Carneceria Lupita, and La Fiesta offer a variety of products, however none of these retailers offers free education to children, or such a wide variety of products from the top Latin-American markets.
- La Tiendita located in Taco Loco combines the atmosphere of a restaurant with shopping. They do not promote their retail products as much as they do their restaurant, which is their biggest weakness.
- Carneceria Lupita is a meat store primarily, although it offers several food products from different countries as well as in bulk quantity. In addition to selling meat, they sell spices, candles, some clothing, and other accessories. The biggest weakness for this store is the small size in which it has to operate.
- La Fiesta is located in the restaurant Las Brasas which adds to its flow of customers. La Fiesta offers some clothing and accessories, but the bulk of the success of the store stems from its focus on video rental and selling jewelry. One of the greatest weaknesses of this retailer is that it has a small operating space and no real defined product.
Strategy and Implementation Summary
The following sections will outline the marketing and sales strategy for CS.
5.1 Value Proposition
Chicano Stylez offers customers high quality clothing, unique and diverse products, a cultural community center, and educational services for children.
5.2 Competitive Edge
The following components make up the competitive edge for CS.
- Location
- Unique and high quality products and services
- Cultural atmosphere
- Loyalty amongst customers
5.3 Marketing Strategy
Our marketing strategy will focus on pricing, promotion, distribution, sales strategy, and forecast.
We are focusing our market on the Hispanic/Chicano population of downtown Eugene. Our strategy will embrace these customers as a community with respect and esteem. To do this, our marketing resources are centered around customer loyalty and satisfaction. Our strategy also embraces the idea of consistency.
- The marketing budget will not exceed $5,000 a year.
- Our marketing promotions will remain true to our company objectives and mission statement.
Positioning Statement:
We target people who look for a high quality and unique product as well as a cultural atmosphere. Unlike other Latin based retailers, we offer community involvement.
Pricing Strategy:
- CS is a store for continued customer purchase and loyalty. It is crucial to maintain a consistent pricing strategy.
- We will not exceed a competitor’s price by more than 5-10%, and will always honor a competitor’s price when dealing with a customer.
Promotion Strategy:
- CS will maintain an advertising plan that will consist of a radio advertisement on the local spanish station and a display in the phone book.
- Publicity is the essential strategy for CS. We aim to involve the community through public relations and utilizing different forms of media to get our name out.
Marketing programs:
Our most important marketing programs are:
- Publicity: Through media, get our story and mission statement out in the community.
- Sales promotion: Have a prominent booth at the park to collectively speak to the community and offer our products for free.
Sales Strategy:
- Encourage employees to sell by giving bonuses based on performance.
- Have a large base knowledge of products so that we can sell quality to the customers.
- Display sample items and have a great return policy to build trust and loyalty to increase customer base.
5.4 Sales Forecast
We expect sales to increase at a steady rate of approximately 2-5% for the first year. It will begin slow as we open, but will quickly pick up as our customer base increases. In December it will jump to 9% due to the holidays.
CS would like to see an increase of 20% for the year 2002, and an increase of 30% for the year 2003. We feel that we can accomplish this steady goal and maintain this amount of sales.


| Sales Forecast | |||
| Year 1 | Year 2 | Year 3 | |
| Sales | |||
| Clothing and Accesories | $90,200 | $108,240 | $140,712 |
| Other | $0 | $0 | $0 |
| Total Sales | $90,200 | $108,240 | $140,712 |
| Direct Cost of Sales | Year 1 | Year 2 | Year 3 |
| Clothing and Accesories | $22,550 | $27,060 | $35,178 |
| Other | $0 | $0 | $0 |
| Subtotal Direct Cost of Sales | $22,550 | $27,060 | $35,178 |
Management Summary
The founder of Chicano Stylez, Sandra Adams, believes that employee relationships are of utmost importance to the success of the business. Within this relationship should lie a high respect for creativity and growth. Pay will be constantly evaluated and based on performance and quality of work performed. It is a high priority to expand on each other’s strengths and continue to build.
Organizational Structure:
CS does not separate into departments. The owner, Sandra Adams is the one lead manager who relates all of the decisions to the initial goal of the company. Employees are encouraged to work within their creative and physical boundaries. An evaluation and possible promotion or bonus will be given every 6 months.
Management Team:
Sandra Adams received her degree in the area of Spanish and cultural learning. She has been a member of a highly dominated Hispanic community in Los Angeles for the greater part of her life, and realizes the importance of a cultural community bond. Adams seeks to use her knowledge and personal vision for the Eugene area to create an atmosphere of equality, awareness, and respect.
| Personnel Plan | |||
| Year 1 | Year 2 | Year 3 | |
| Manager | $23,600 | $24,780 | $26,019 |
| Employee | $12,000 | $12,600 | $13,230 |
| Total People | 0 | 0 | 0 |
| Total Payroll | $35,600 | $37,380 | $39,249 |
Financial Plan
The following sections outline the financial plan for Chicano Stylez.
7.1 Important Assumptions
The table below highlights the important assumptions for the company.
| General Assumptions | |||
| Year 1 | Year 2 | Year 3 | |
| Plan Month | 1 | 2 | 3 |
| Current Interest Rate | 10.00% | 10.00% | 10.00% |
| Long-term Interest Rate | 10.00% | 10.00% | 10.00% |
| Tax Rate | 25.42% | 25.00% | 25.42% |
| Other | 0 | 0 | 0 |
7.2 Projected Profit and Loss
The table below provides the expected profit and loss for the company.


| Pro Forma Profit and Loss | |||
| Year 1 | Year 2 | Year 3 | |
| Sales | $90,200 | $108,240 | $140,712 |
| Direct Cost of Sales | $22,550 | $27,060 | $35,178 |
| Other | $0 | $0 | $0 |
| Total Cost of Sales | $22,550 | $27,060 | $35,178 |
| Gross Margin | $67,650 | $81,180 | $105,534 |
| Gross Margin % | 75.00% | 75.00% | 75.00% |
| Expenses | |||
| Payroll | $35,600 | $37,380 | $39,249 |
| Sales and Marketing and Other Expenses | $14,400 | $16,500 | $16,900 |
| Depreciation | $0 | $0 | $0 |
| Leased Equipment | $2,400 | $2,000 | $1,500 |
| Utilities | $3,600 | $3,800 | $4,000 |
| Insurance | $3,600 | $3,600 | $3,600 |
| Rent | $12,000 | $13,000 | $14,000 |
| Payroll Taxes | $0 | $0 | $0 |
| Other | $0 | $0 | $0 |
| Total Operating Expenses | $71,600 | $76,280 | $79,249 |
| Profit Before Interest and Taxes | ($3,950) | $4,900 | $26,285 |
| EBITDA | ($3,950) | $4,900 | $26,285 |
| Interest Expense | $1,070 | $840 | $600 |
| Taxes Incurred | $0 | $1,015 | $6,528 |
| Net Profit | ($5,020) | $3,045 | $19,157 |
| Net Profit/Sales | -5.57% | 2.81% | 13.61% |
7.3 Break-even Analysis
The chart and table below indicate the Break-even Analysis for CS.

| Break-even Analysis | |
| Monthly Revenue Break-even | $7,956 |
| Assumptions: | |
| Average Percent Variable Cost | 25% |
| Estimated Monthly Fixed Cost | $5,967 |
7.4 Projected Cash Flow
The cash flow statement can be found in the chart and table below.

| Pro Forma Cash Flow | |||
| Year 1 | Year 2 | Year 3 | |
| Cash Received | |||
| Cash from Operations | |||
| Cash Sales | $90,200 | $108,240 | $140,712 |
| Subtotal Cash from Operations | $90,200 | $108,240 | $140,712 |
| Additional Cash Received | |||
| Sales Tax, VAT, HST/GST Received | $0 | $0 | $0 |
| New Current Borrowing | $0 | $0 | $0 |
| New Other Liabilities (interest-free) | $0 | $0 | $0 |
| New Long-term Liabilities | $0 | $0 | $0 |
| Sales of Other Current Assets | $0 | $0 | $0 |
| Sales of Long-term Assets | $0 | $0 | $0 |
| New Investment Received | $0 | $0 | $0 |
| Subtotal Cash Received | $90,200 | $108,240 | $140,712 |
| Expenditures | Year 1 | Year 2 | Year 3 |
| Expenditures from Operations | |||
| Cash Spending | $35,600 | $37,380 | $39,249 |
| Bill Payments | $55,718 | $68,977 | $81,568 |
| Subtotal Spent on Operations | $91,318 | $106,357 | $120,817 |
| Additional Cash Spent | |||
| Sales Tax, VAT, HST/GST Paid Out | $0 | $0 | $0 |
| Principal Repayment of Current Borrowing | $0 | $0 | $0 |
| Other Liabilities Principal Repayment | $0 | $0 | $0 |
| Long-term Liabilities Principal Repayment | $2,400 | $2,400 | $2,400 |
| Purchase Other Current Assets | $0 | $0 | $0 |
| Purchase Long-term Assets | $0 | $0 | $0 |
| Dividends | $0 | $0 | $0 |
| Subtotal Cash Spent | $93,718 | $108,757 | $123,217 |
| Net Cash Flow | ($3,518) | ($517) | $17,495 |
| Cash Balance | $16,482 | $15,966 | $33,461 |
7.5 Projected Balance Sheet
The Balance Sheet is found in the following table.
| Pro Forma Balance Sheet | |||
| Year 1 | Year 2 | Year 3 | |
| Assets | |||
| Current Assets | |||
| Cash | $16,482 | $15,966 | $33,461 |
| Inventory | $3,080 | $3,696 | $4,805 |
| Other Current Assets | $27,000 | $27,000 | $27,000 |
| Total Current Assets | $46,562 | $46,662 | $65,266 |
| Long-term Assets | |||
| Long-term Assets | $0 | $0 | $0 |
| Accumulated Depreciation | $0 | $0 | $0 |
| Total Long-term Assets | $0 | $0 | $0 |
| Total Assets | $46,562 | $46,662 | $65,266 |
| Liabilities and Capital | Year 1 | Year 2 | Year 3 |
| Current Liabilities | |||
| Accounts Payable | $8,982 | $8,437 | $10,284 |
| Current Borrowing | $0 | $0 | $0 |
| Other Current Liabilities | $0 | $0 | $0 |
| Subtotal Current Liabilities | $8,982 | $8,437 | $10,284 |
| Long-term Liabilities | $9,600 | $7,200 | $4,800 |
| Total Liabilities | $18,582 | $15,637 | $15,084 |
| Paid-in Capital | $45,300 | $45,300 | $45,300 |
| Retained Earnings | ($12,300) | ($17,320) | ($14,275) |
| Earnings | ($5,020) | $3,045 | $19,157 |
| Total Capital | $27,980 | $31,025 | $50,182 |
| Total Liabilities and Capital | $46,562 | $46,662 | $65,266 |
| Net Worth | $27,980 | $31,025 | $50,182 |
7.6 Business Ratios
The following table contains important ratios from the retail clothing industry, Code 5999, as determined by the Standard Industry Classification (SIC) Index.
| Ratio Analysis | ||||
| Year 1 | Year 2 | Year 3 | Industry Profile | |
| Sales Growth | 0.00% | 20.00% | 30.00% | 6.30% |
| Percent of Total Assets | ||||
| Inventory | 6.61% | 7.92% | 7.36% | 39.30% |
| Other Current Assets | 57.99% | 57.86% | 41.37% | 23.90% |
| Total Current Assets | 100.00% | 100.00% | 100.00% | 80.10% |
| Long-term Assets | 0.00% | 0.00% | 0.00% | 19.90% |
| Total Assets | 100.00% | 100.00% | 100.00% | 100.00% |
| Current Liabilities | 19.29% | 18.08% | 15.76% | 46.00% |
| Long-term Liabilities | 20.62% | 15.43% | 7.35% | 14.00% |
| Total Liabilities | 39.91% | 33.51% | 23.11% | 60.00% |
| Net Worth | 60.09% | 66.49% | 76.89% | 40.00% |
| Percent of Sales | ||||
| Sales | 100.00% | 100.00% | 100.00% | 100.00% |
| Gross Margin | 75.00% | 75.00% | 75.00% | 34.10% |
| Selling, General & Administrative Expenses | 95.57% | 56.75% | 49.76% | 19.80% |
| Advertising Expenses | 7.22% | 6.88% | 5.45% | 2.60% |
| Profit Before Interest and Taxes | -4.38% | 4.53% | 18.68% | 1.10% |
| Main Ratios | ||||
| Current | 5.18 | 5.53 | 6.35 | 1.77 |
| Quick | 4.84 | 5.09 | 5.88 | 0.67 |
| Total Debt to Total Assets | 39.91% | 33.51% | 23.11% | 60.00% |
| Pre-tax Return on Net Worth | -17.94% | 13.09% | 51.18% | 2.60% |
| Pre-tax Return on Assets | -10.78% | 8.70% | 39.35% | 6.50% |
| Additional Ratios | Year 1 | Year 2 | Year 3 | |
| Net Profit Margin | -5.57% | 2.81% | 13.61% | n.a |
| Return on Equity | -17.94% | 9.81% | 38.17% | n.a |
| Activity Ratios | ||||
| Inventory Turnover | 7.55 | 7.99 | 8.28 | n.a |
| Accounts Payable Turnover | 6.09 | 8.11 | 8.11 | n.a |
| Payment Days | 47 | 46 | 41 | n.a |
| Total Asset Turnover | 1.94 | 2.32 | 2.16 | n.a |
| Debt Ratios | ||||
| Debt to Net Worth | 0.66 | 0.50 | 0.30 | n.a |
| Current Liab. to Liab. | 0.48 | 0.54 | 0.68 | n.a |
| Liquidity Ratios | ||||
| Net Working Capital | $37,580 | $38,225 | $54,982 | n.a |
| Interest Coverage | -3.69 | 5.83 | 43.81 | n.a |
| Additional Ratios | ||||
| Assets to Sales | 0.52 | 0.43 | 0.46 | n.a |
| Current Debt/Total Assets | 19% | 18% | 16% | n.a |
| Acid Test | 4.84 | 5.09 | 5.88 | n.a |
| Sales/Net Worth | 3.22 | 3.49 | 2.80 | n.a |
| Dividend Payout | 0.00 | 0.00 | 0.00 | n.a |
Appendix
| Sales Forecast | |||||||||||||
| Month 1 | Month 2 | Month 3 | Month 4 | Month 5 | Month 6 | Month 7 | Month 8 | Month 9 | Month 10 | Month 11 | Month 12 | ||
| Sales | |||||||||||||
| Clothing and Accesories | 25% | $5,000 | $6,000 | $6,500 | $6,500 | $7,000 | $7,000 | $7,500 | $7,500 | $8,000 | $8,500 | $9,500 | $11,200 |
| Other | 0% | $0 | $0 | $0 | $0 | $0 | $0 | $0 | $0 | $0 | $0 | $0 | $0 |
| Total Sales | $5,000 | $6,000 | $6,500 | $6,500 | $7,000 | $7,000 | $7,500 | $7,500 | $8,000 | $8,500 | $9,500 | $11,200 | |
| Direct Cost of Sales | Month 1 | Month 2 | Month 3 | Month 4 | Month 5 | Month 6 | Month 7 | Month 8 | Month 9 | Month 10 | Month 11 | Month 12 | |
| Clothing and Accesories | $1,250 | $1,500 | $1,625 | $1,625 | $1,750 | $1,750 | $1,875 | $1,875 | $2,000 | $2,125 | $2,375 | $2,800 | |
| Other | $0 | $0 | $0 | $0 | $0 | $0 | $0 | $0 | $0 | $0 | $0 | $0 | |
| Subtotal Direct Cost of Sales | $1,250 | $1,500 | $1,625 | $1,625 | $1,750 | $1,750 | $1,875 | $1,875 | $2,000 | $2,125 | $2,375 | $2,800 | |
| Personnel Plan | |||||||||||||
| Month 1 | Month 2 | Month 3 | Month 4 | Month 5 | Month 6 | Month 7 | Month 8 | Month 9 | Month 10 | Month 11 | Month 12 | ||
| Manager | 0% | $1,000 | $1,000 | $1,500 | $1,500 | $1,700 | $2,000 | $2,000 | $2,000 | $2,500 | $2,550 | $2,850 | $3,000 |
| Employee | 0% | $800 | $800 | $850 | $850 | $900 | $900 | $900 | $1,000 | $1,000 | $1,000 | $1,500 | $1,500 |
| Total People | 2 | 0 | 0 | 0 | 0 | 0 | 0 | 0 | 0 | 0 | 0 | 0 | |
| Total Payroll | $1,800 | $1,800 | $2,350 | $2,350 | $2,600 | $2,900 | $2,900 | $3,000 | $3,500 | $3,550 | $4,350 | $4,500 | |
| General Assumptions | |||||||||||||
| Month 1 | Month 2 | Month 3 | Month 4 | Month 5 | Month 6 | Month 7 | Month 8 | Month 9 | Month 10 | Month 11 | Month 12 | ||
| Plan Month | 1 | 2 | 3 | 4 | 5 | 6 | 7 | 8 | 9 | 10 | 11 | 12 | |
| Current Interest Rate | 10.00% | 10.00% | 10.00% | 10.00% | 10.00% | 10.00% | 10.00% | 10.00% | 10.00% | 10.00% | 10.00% | 10.00% | |
| Long-term Interest Rate | 10.00% | 10.00% | 10.00% | 10.00% | 10.00% | 10.00% | 10.00% | 10.00% | 10.00% | 10.00% | 10.00% | 10.00% | |
| Tax Rate | 30.00% | 25.00% | 25.00% | 25.00% | 25.00% | 25.00% | 25.00% | 25.00% | 25.00% | 25.00% | 25.00% | 25.00% | |
| Other | 0 | 0 | 0 | 0 | 0 | 0 | 0 | 0 | 0 | 0 | 0 | 0 | |
| Pro Forma Profit and Loss | |||||||||||||
| Month 1 | Month 2 | Month 3 | Month 4 | Month 5 | Month 6 | Month 7 | Month 8 | Month 9 | Month 10 | Month 11 | Month 12 | ||
| Sales | $5,000 | $6,000 | $6,500 | $6,500 | $7,000 | $7,000 | $7,500 | $7,500 | $8,000 | $8,500 | $9,500 | $11,200 | |
| Direct Cost of Sales | $1,250 | $1,500 | $1,625 | $1,625 | $1,750 | $1,750 | $1,875 | $1,875 | $2,000 | $2,125 | $2,375 | $2,800 | |
| Other | $0 | $0 | $0 | $0 | $0 | $0 | $0 | $0 | $0 | $0 | $0 | $0 | |
| Total Cost of Sales | $1,250 | $1,500 | $1,625 | $1,625 | $1,750 | $1,750 | $1,875 | $1,875 | $2,000 | $2,125 | $2,375 | $2,800 | |
| Gross Margin | $3,750 | $4,500 | $4,875 | $4,875 | $5,250 | $5,250 | $5,625 | $5,625 | $6,000 | $6,375 | $7,125 | $8,400 | |
| Gross Margin % | 75.00% | 75.00% | 75.00% | 75.00% | 75.00% | 75.00% | 75.00% | 75.00% | 75.00% | 75.00% | 75.00% | 75.00% | |
| Expenses | |||||||||||||
| Payroll | $1,800 | $1,800 | $2,350 | $2,350 | $2,600 | $2,900 | $2,900 | $3,000 | $3,500 | $3,550 | $4,350 | $4,500 | |
| Sales and Marketing and Other Expenses | $1,300 | $1,300 | $900 | $1,300 | $1,300 | $1,100 | $1,300 | $1,100 | $1,300 | $1,300 | $900 | $1,300 | |
| Depreciation | $0 | $0 | $0 | $0 | $0 | $0 | $0 | $0 | $0 | $0 | $0 | $0 | |
| Leased Equipment | $200 | $200 | $200 | $200 | $200 | $200 | $200 | $200 | $200 | $200 | $200 | $200 | |
| Utilities | $300 | $300 | $300 | $300 | $300 | $300 | $300 | $300 | $300 | $300 | $300 | $300 | |
| Insurance | $300 | $300 | $300 | $300 | $300 | $300 | $300 | $300 | $300 | $300 | $300 | $300 | |
| Rent | $1,000 | $1,000 | $1,000 | $1,000 | $1,000 | $1,000 | $1,000 | $1,000 | $1,000 | $1,000 | $1,000 | $1,000 | |
| Payroll Taxes | 15% | $0 | $0 | $0 | $0 | $0 | $0 | $0 | $0 | $0 | $0 | $0 | $0 |
| Other | $0 | $0 | $0 | $0 | $0 | $0 | $0 | $0 | $0 | $0 | $0 | $0 | |
| Total Operating Expenses | $4,900 | $4,900 | $5,050 | $5,450 | $5,700 | $5,800 | $6,000 | $5,900 | $6,600 | $6,650 | $7,050 | $7,600 | |
| Profit Before Interest and Taxes | ($1,150) | ($400) | ($175) | ($575) | ($450) | ($550) | ($375) | ($275) | ($600) | ($275) | $75 | $800 | |
| EBITDA | ($1,150) | ($400) | ($175) | ($575) | ($450) | ($550) | ($375) | ($275) | ($600) | ($275) | $75 | $800 | |
| Interest Expense | $98 | $97 | $95 | $93 | $92 | $90 | $88 | $87 | $85 | $83 | $82 | $80 | |
| Taxes Incurred | $0 | $0 | $0 | $0 | $0 | $0 | $0 | $0 | $0 | $0 | $0 | $0 | |
| Net Profit | ($1,248) | ($497) | ($270) | ($668) | ($542) | ($640) | ($463) | ($362) | ($685) | ($358) | ($7) | $720 | |
| Net Profit/Sales | -24.97% | -8.28% | -4.15% | -10.28% | -7.74% | -9.14% | -6.18% | -4.82% | -8.56% | -4.22% | -0.07% | 6.43% | |
| Pro Forma Cash Flow | |||||||||||||
| Month 1 | Month 2 | Month 3 | Month 4 | Month 5 | Month 6 | Month 7 | Month 8 | Month 9 | Month 10 | Month 11 | Month 12 | ||
| Cash Received | |||||||||||||
| Cash from Operations | |||||||||||||
| Cash Sales | $5,000 | $6,000 | $6,500 | $6,500 | $7,000 | $7,000 | $7,500 | $7,500 | $8,000 | $8,500 | $9,500 | $11,200 | |
| Subtotal Cash from Operations | $5,000 | $6,000 | $6,500 | $6,500 | $7,000 | $7,000 | $7,500 | $7,500 | $8,000 | $8,500 | $9,500 | $11,200 | |
| Additional Cash Received | |||||||||||||
| Sales Tax, VAT, HST/GST Received | 0.00% | $0 | $0 | $0 | $0 | $0 | $0 | $0 | $0 | $0 | $0 | $0 | $0 |
| New Current Borrowing | $0 | $0 | $0 | $0 | $0 | $0 | $0 | $0 | $0 | $0 | $0 | $0 | |
| New Other Liabilities (interest-free) | $0 | $0 | $0 | $0 | $0 | $0 | $0 | $0 | $0 | $0 | $0 | $0 | |
| New Long-term Liabilities | $0 | $0 | $0 | $0 | $0 | $0 | $0 | $0 | $0 | $0 | $0 | $0 | |
| Sales of Other Current Assets | $0 | $0 | $0 | $0 | $0 | $0 | $0 | $0 | $0 | $0 | $0 | $0 | |
| Sales of Long-term Assets | $0 | $0 | $0 | $0 | $0 | $0 | $0 | $0 | $0 | $0 | $0 | $0 | |
| New Investment Received | $0 | $0 | $0 | $0 | $0 | $0 | $0 | $0 | $0 | $0 | $0 | $0 | |
| Subtotal Cash Received | $5,000 | $6,000 | $6,500 | $6,500 | $7,000 | $7,000 | $7,500 | $7,500 | $8,000 | $8,500 | $9,500 | $11,200 | |
| Expenditures | Month 1 | Month 2 | Month 3 | Month 4 | Month 5 | Month 6 | Month 7 | Month 8 | Month 9 | Month 10 | Month 11 | Month 12 | |
| Expenditures from Operations | |||||||||||||
| Cash Spending | $1,800 | $1,800 | $2,350 | $2,350 | $2,600 | $2,900 | $2,900 | $3,000 | $3,500 | $3,550 | $4,350 | $4,500 | |
| Bill Payments | $6,667 | $3,928 | $4,309 | $2,982 | $3,007 | $4,086 | $4,799 | $4,986 | $5,020 | $5,107 | $5,388 | $5,438 | |
| Subtotal Spent on Operations | $8,467 | $5,728 | $6,659 | $5,332 | $5,607 | $6,986 | $7,699 | $7,986 | $8,520 | $8,657 | $9,738 | $9,938 | |
| Additional Cash Spent | |||||||||||||
| Sales Tax, VAT, HST/GST Paid Out | $0 | $0 | $0 | $0 | $0 | $0 | $0 | $0 | $0 | $0 | $0 | $0 | |
| Principal Repayment of Current Borrowing | $0 | $0 | $0 | $0 | $0 | $0 | $0 | $0 | $0 | $0 | $0 | $0 | |
| Other Liabilities Principal Repayment | $0 | $0 | $0 | $0 | $0 | $0 | $0 | $0 | $0 | $0 | $0 | $0 | |
| Long-term Liabilities Principal Repayment | $200 | $200 | $200 | $200 | $200 | $200 | $200 | $200 | $200 | $200 | $200 | $200 | |
| Purchase Other Current Assets | $0 | $0 | $0 | $0 | $0 | $0 | $0 | $0 | $0 | $0 | $0 | $0 | |
| Purchase Long-term Assets | $0 | $0 | $0 | $0 | $0 | $0 | $0 | $0 | $0 | $0 | $0 | $0 | |
| Dividends | $0 | $0 | $0 | $0 | $0 | $0 | $0 | $0 | $0 | $0 | $0 | $0 | |
| Subtotal Cash Spent | $8,667 | $5,928 | $6,859 | $5,532 | $5,807 | $7,186 | $7,899 | $8,186 | $8,720 | $8,857 | $9,938 | $10,138 | |
| Net Cash Flow | ($3,667) | $72 | ($359) | $968 | $1,193 | ($186) | ($399) | ($686) | ($720) | ($357) | ($438) | $1,062 | |
| Cash Balance | $16,333 | $16,405 | $16,047 | $17,014 | $18,207 | $18,021 | $17,622 | $16,936 | $16,216 | $15,859 | $15,421 | $16,482 | |
| Pro Forma Balance Sheet | |||||||||||||
| Month 1 | Month 2 | Month 3 | Month 4 | Month 5 | Month 6 | Month 7 | Month 8 | Month 9 | Month 10 | Month 11 | Month 12 | ||
| Assets | Starting Balances | ||||||||||||
| Current Assets | |||||||||||||
| Cash | $20,000 | $16,333 | $16,405 | $16,047 | $17,014 | $18,207 | $18,021 | $17,622 | $16,936 | $16,216 | $15,859 | $15,421 | $16,482 |
| Inventory | $8,000 | $6,750 | $5,250 | $3,625 | $2,000 | $1,925 | $1,925 | $2,063 | $2,063 | $2,200 | $2,338 | $2,613 | $3,080 |
| Other Current Assets | $27,000 | $27,000 | $27,000 | $27,000 | $27,000 | $27,000 | $27,000 | $27,000 | $27,000 | $27,000 | $27,000 | $27,000 | $27,000 |
| Total Current Assets | $55,000 | $50,083 | $48,655 | $46,672 | $46,014 | $47,132 | $46,946 | $46,685 | $45,999 | $45,416 | $45,196 | $45,033 | $46,562 |
| Long-term Assets | |||||||||||||
| Long-term Assets | $0 | $0 | $0 | $0 | $0 | $0 | $0 | $0 | $0 | $0 | $0 | $0 | $0 |
| Accumulated Depreciation | $0 | $0 | $0 | $0 | $0 | $0 | $0 | $0 | $0 | $0 | $0 | $0 | $0 |
| Total Long-term Assets | $0 | $0 | $0 | $0 | $0 | $0 | $0 | $0 | $0 | $0 | $0 | $0 | $0 |
| Total Assets | $55,000 | $50,083 | $48,655 | $46,672 | $46,014 | $47,132 | $46,946 | $46,685 | $45,999 | $45,416 | $45,196 | $45,033 | $46,562 |
| Liabilities and Capital | Month 1 | Month 2 | Month 3 | Month 4 | Month 5 | Month 6 | Month 7 | Month 8 | Month 9 | Month 10 | Month 11 | Month 12 | |
| Current Liabilities | |||||||||||||
| Accounts Payable | $10,000 | $6,532 | $5,800 | $4,287 | $4,498 | $6,357 | $7,011 | $7,413 | $7,289 | $7,591 | $7,930 | $7,973 | $8,982 |
| Current Borrowing | $0 | $0 | $0 | $0 | $0 | $0 | $0 | $0 | $0 | $0 | $0 | $0 | $0 |
| Other Current Liabilities | $0 | $0 | $0 | $0 | $0 | $0 | $0 | $0 | $0 | $0 | $0 | $0 | $0 |
| Subtotal Current Liabilities | $10,000 | $6,532 | $5,800 | $4,287 | $4,498 | $6,357 | $7,011 | $7,413 | $7,289 | $7,591 | $7,930 | $7,973 | $8,982 |
| Long-term Liabilities | $12,000 | $11,800 | $11,600 | $11,400 | $11,200 | $11,000 | $10,800 | $10,600 | $10,400 | $10,200 | $10,000 | $9,800 | $9,600 |
| Total Liabilities | $22,000 | $18,332 | $17,400 | $15,687 | $15,698 | $17,357 | $17,811 | $18,013 | $17,689 | $17,791 | $17,930 | $17,773 | $18,582 |
| Paid-in Capital | $45,300 | $45,300 | $45,300 | $45,300 | $45,300 | $45,300 | $45,300 | $45,300 | $45,300 | $45,300 | $45,300 | $45,300 | $45,300 |
| Retained Earnings | ($12,300) | ($12,300) | ($12,300) | ($12,300) | ($12,300) | ($12,300) | ($12,300) | ($12,300) | ($12,300) | ($12,300) | ($12,300) | ($12,300) | ($12,300) |
| Earnings | $0 | ($1,248) | ($1,745) | ($2,015) | ($2,683) | ($3,225) | ($3,865) | ($4,328) | ($4,690) | ($5,375) | ($5,733) | ($5,740) | ($5,020) |
| Total Capital | $33,000 | $31,752 | $31,255 | $30,985 | $30,317 | $29,775 | $29,135 | $28,672 | $28,310 | $27,625 | $27,267 | $27,260 | $27,980 |
| Total Liabilities and Capital | $55,000 | $50,083 | $48,655 | $46,672 | $46,014 | $47,132 | $46,946 | $46,685 | $45,999 | $45,416 | $45,196 | $45,033 | $46,562 |
| Net Worth | $33,000 | $31,752 | $31,255 | $30,985 | $30,317 | $29,775 | $29,135 | $28,672 | $28,310 | $27,625 | $27,267 | $27,260 | $27,980 |

