
Morningstar Bakery
Executive Summary
Morningstar Bakery is a new organic bakery specializing in gluten, wheat and dairy free products. Within the last three years there has been significant increases in demand for these bakery products. This can be explained to a large degree by the fact that up until recently Americans have had food allergies that have been undiagnosed. It has been only in the last few years that medical doctors have begun to diagnosis food allergies correctly. What was once an unknown problem that affected so many people with no recourse has become a manageable ailment that is easily dealt with through modification of diets. This is very positive for both those people that are affected as well as bakeries such as Morningstar that specialize in these products.
The Products
Morningstar offers a wide range of exciting products. The first group is spelt breads, muffins, and pastries. Spelt is used as there are far fewer people that are allergic to this grain. Yeast allergies are also common and Morningstar offers a menu of yeast free breads. Dairy free muffins and pastries are offered for vegans. Lastly, egg free breads, muffins, and pastries are offered.
Customers
Morningstar will focus on three distinct customer segments. The first group is the Allergy group. This segment is growing at 15% a year with 32,000 potential customers. The second niche is the Doctor group. This segment is also growing at 15% with 14,200 potential people. The last group is the Dieters group. This segment is typically making modifications to their diet based on their desire to lose weight. This niche also is growing at 15% with 48,000 possible customers.
Management Team
Recognizing the importance of human capital, Morningstar has assembled a strong management team. The team is led by Donna Sharp. Donna comes to Morningstar with 10 years of baking experience. In addition to her industry specific experience, Donna has had 2 years of management experience. Donovan Bailey brings financial skills to Morningstar after a 15 year CPA career. Tara Juniper-Reid will lead the marketing efforts having participated in her own PR firm. Lastly, Lucy Hamilton will be on the team as an assistant baker with over five years of experience.
Morningstar is an exciting opportunity that combines, fresh baked goods with spelt, yeast free, dairy free, and egg free products, addressing the recent need for these new products. Demand for these products is expected to grow exponentially as medical doctors become more and more aware of food allergies Americans are afflicted with. Profitability is forecasted to occur by month three. Through a combination of a strong management team, a solid business model, and exciting, market demanded products will allow Morningstar to quickly gain market penetration and cash richness.

1.1 Objectives
- To establish a working storefront for Morningstar bakery.
- To develop the strong presence in the community needed to support sales goals.
- To develop a full menu by the end of the second quarter.
1.2 Mission
Morningstar Bakery aims to be a cornerstone in the community creating a neighborhood atmosphere where customers feel comfortable and become instant regulars. We are sensitive to the often over-looked population of allergy sufferers and cater to their needs for healthy, delicious baked goods. We seek fair and responsible profit, enough to keep the company financially healthy for the long term and to fairly compensate owners and investors for their money and risk.
Company Summary
Morningstar Bakery will be located in downtown [Name omitted] in a historical building. This downtown district is a very popular destination because of the historical architecture for weekenders and tourists. It is also a prime location for all the employees of the surrounding downtown businesses. The bakery sells non-wheat and other health specific breads, sweets and pastries to the surrounding community every Tuesday through Sunday.
2.1 Company Ownership
Currently Morningstar Bakery is a sole proprietorship owned by Donna Sharp. Eventually, as the company becomes established, Morningstar Bakery will apply to be incorporated.
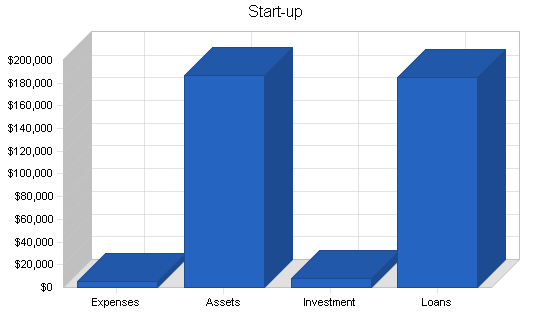
2.2 Start-up Summary
The primary expense to establish the Morningstar Bakery is the mortgage loan estimated at $175,000 to purchase the vacant space on [Name omitted] street. The building was previously used as a bakery and we plan to buy the used equipment along with the space. This cost is also calculated into the loan estimate. Donna Sharp intends to invest $7,500 of her savings to cover the other cost of start-up.
These costs include:
- Advertising brochures.
- Bakery ingredients.
- Insurance.
- Bakery accessories, i.e. paper bags, cartons, etc.
| Start-up | |
| Requirements | |
| Start-up Expenses | |
| Legal | $0 |
| Stationery etc. | $0 |
| Brochures | $2,500 |
| Consultants | $0 |
| Insurance | $150 |
| Mortgage | $1,258 |
| Research and development | $0 |
| Bakery Ingredients | $500 |
| Other | $1,000 |
| Total Start-up Expenses | $5,408 |
| Start-up Assets | |
| Cash Required | $12,092 |
| Other Current Assets | $0 |
| Long-term Assets | $175,000 |
| Total Assets | $187,092 |
| Total Requirements | $192,500 |
| Start-up Funding | |
| Start-up Expenses to Fund | $5,408 |
| Start-up Assets to Fund | $187,092 |
| Total Funding Required | $192,500 |
| Assets | |
| Non-cash Assets from Start-up | $175,000 |
| Cash Requirements from Start-up | $12,092 |
| Additional Cash Raised | $0 |
| Cash Balance on Starting Date | $12,092 |
| Total Assets | $187,092 |
| Liabilities and Capital | |
| Liabilities | |
| Current Borrowing | $0 |
| Long-term Liabilities | $173,000 |
| Accounts Payable (Outstanding Bills) | $0 |
| Other Current Liabilities (interest-free) | $12,000 |
| Total Liabilities | $185,000 |
| Capital | |
| Planned Investment | |
| Untitled | $0 |
| Donna Sharp | $7,500 |
| Other | $0 |
| Additional Investment Requirement | $0 |
| Total Planned Investment | $7,500 |
| Loss at Start-up (Start-up Expenses) | ($5,408) |
| Total Capital | $2,092 |
| Total Capital and Liabilities | $187,092 |
| Total Funding | $192,500 |
Products
Morningstar Bakery provides non-gluten baked goods and pastries to diet-conscious and wheat-allergic consumers. Special considerations are made for all common food allergies such as dairy, yeast, wheat, and eggs.
Example of goods:
Spelt breads, muffins and pastries
Spelt flour is the most common wheat-alternative flour as it has the same characteristics as wheat which provides similar taste, consistency and behaviors creating goods that are just as good as any wheat baked good.
Yeast-free breads
Many people have an allergy to yeast, or have been warned by their doctors not to eat it. We provide a line of yeast-free breads.
Dairy-free muffins and pastries
Most breads do not require any dairy products, so they are not a consideration. Muffins and pastries most often require butter. To avoid this, we use a soy substitute.
Egg-free breads, muffins and pastries
Eggs are most common in muffins and pastries. Applesauce can be used as a substitute as it provides the same amount of moisture that is required.
Market Analysis Summary
Our target market includes people who are health conscious and/or have common food allergies. This is a niche market since most bakeries do not cater to these needs with the exception of high-fiber diets.
4.1 Market Segmentation
Our target market consists of three groups:
The Allergy Group
According to Health Magazine, one out of five people suffer from a common food allergy, however many bakeries do not cater to their needs.
The Doctor Diet Group
For health reasons, many people are warned off certain foods by their doctors because of high cholesterol and blood pressure. Currently the main killer in the U.S. is heart disease according the American Heart Association. Many Americans aged 50+ are going on special diets to prevent heart disease.
The Diet Craze Group
According to Self Magazine, the year 2000 saw 20 new diet fads that discouraged certain foods such as wheat and dairy. The best selling book on the New York Time list for health was the “Blood Type Diet” which encourages readers to eat only non-gluten flours such as spelt, and to avoid dairy. While this target market is quite large, it is ever fluctuating since most people who diet yo-yo between different diets (Self Magazine September 2000).


| Market Analysis | |||||||
| Year 1 | Year 2 | Year 3 | Year 4 | Year 5 | |||
| Potential Customers | Growth | CAGR | |||||
| The Allergy Group | 15% | 32,000 | 36,800 | 42,320 | 48,668 | 55,968 | 15.00% |
| The Doctor Group | 15% | 19,200 | 22,080 | 25,392 | 29,201 | 33,581 | 15.00% |
| The Dieters Group | 15% | 48,000 | 55,200 | 63,480 | 73,002 | 83,952 | 15.00% |
| Total | 15.00% | 99,200 | 114,080 | 131,192 | 150,871 | 173,501 | 15.00% |
4.2 Target Market Segment Strategy
In our target market, we will mainly focus on the “allergy group” since they are the most prevalent and steady of customers. We expect that the “doctor diet group” and the ‘”diet craze” group will make up a smaller portion of our customers. We have not listed “regular customers” as a target group since the customers who do not fit into any of our groups are too varied to segment. We are specifically filling the needs of the “allergy group” so we expect the most business from this group.
4.3 Industry Analysis
Morningstar bakery competes in the Food Services Industry. In addition to competing with other organic and non-wheat bakeries, it competes with all restaurants, delis, bakeries and supermarkets for a share of its customers’s food dollar. Morningstar is most concerned with competitors who differentiate their products and services with a healthy, organic focus. Because this group is so large, Morningstar has chosen to limit its analysis to other gluten-free bakeries.
4.3.1 Competition and Buying Patterns
Currently there are two bakeries in town that provide non-wheat goods.
Great Harvest Bread Company
Strengths: Makes spelt bread, muffins and cookies every Monday, Wednesday and Friday. Well-established bakery in town. Sells breads in local grocery stores.
Weaknesses: Does not provide a wide selection of non-wheat goods. Furthermore the texture and flavor of their spelt goods is very dense and flavorless. They use whole spelt bread which makes a denser, crumby consistency bread. We use white spelt in our spelt breads and other goods which has a texture and flavor similar to wheat.
The Sweet Life Patisserie
Strengths: Makes spelt bread, muffins and brownies every day. Will make custom-ordered non-gluten cakes.
Weaknesses: Does not produce a wide selection or large quantity of non-wheat goods. Their main focus is wheat goods.
Strategy and Implementation Summary
Our strategy focuses on serving a niche market with quality goods. We are determined to become a part of the community – an establishment that becomes as much of the community as a church or local grocery store. To achieve these goals, we will provide the following:
- Friendly, neighborhood-feel atmosphere.
- Quality baked goods for everyone to enjoy at a fair price.
- Special diet menus in relation to the advice of local healthcare providers.
5.1 Sales Strategy
Our strategy focuses on building a customer base by providing good customer experience. With the addition of the coffee bar and lunch menu in early spring, we hope to have customers make the bakery their one-stop destination for breakfast or lunch. In the summer, when we open the outdoor patio, more and more customers will make the bakery a destination for their lunches more often since the atmosphere will be so pleasing.
We would also like to work closely with local doctors and elder care homes to bring in customers with health problems. We are already in negotiations with Dr. Goodman’s office to insure referrals to the bakery for his patients.
5.1.1 Sales Forecast
Our sales forecast assumes the following changes:
- Bread sales in the summer months will be slightly higher since more people will be having BBQs and picnics requiring items such as hamburger and hotdog buns.
- Bread and pastry sales will be higher in November and December because of the food-oriented holidays.
- Coffee sales will be higher in winter months, and for summer months sales of sodas and iced beverages will increase.


| Sales Forecast | |||
| Year 1 | Year 2 | Year 3 | |
| Sales | |||
| Breads | $75,900 | $96,000 | $120,000 |
| Coffee/Beverages | $36,400 | $48,000 | $60,000 |
| Lunch Items (Soups & Sandwiches) | $80,000 | $96,000 | $120,000 |
| Pastries/Sweets | $59,400 | $84,000 | $100,000 |
| Total Sales | $251,700 | $324,000 | $400,000 |
| Direct Cost of Sales | Year 1 | Year 2 | Year 3 |
| Breads | $22,770 | $28,800 | $36,000 |
| Coffee/Beverages | $10,920 | $14,400 | $18,000 |
| Lunch Items (Soups & Sandwiches) | $32,000 | $38,400 | $48,000 |
| Pastries/Sweets | $23,760 | $33,600 | $40,000 |
| Subtotal Direct Cost of Sales | $89,450 | $115,200 | $142,000 |
5.2 Competitive Edge
Our competitive edge is our quality of goods. We use only organic flours of the highest quality that create incredible non-gluten goods that can’t be matched anywhere else in town. We also focus mainly on non-gluten goods. The other bakeries in town focus on wheat goods and sometimes, as an afterthought, use alternative flours.
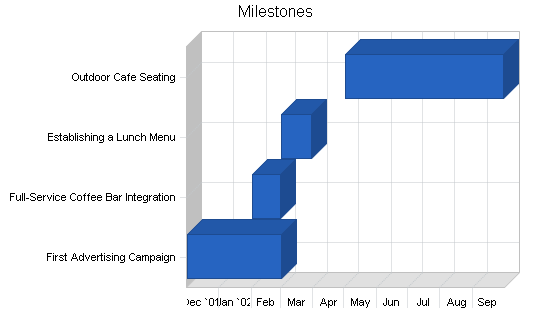
5.3 Milestones
The table below displays the milestones that Morningstar Bakery would like to accomplish in the first three years. Emphasis in the first year will be on advertising to make the Morningstar Bakery an established business in town.
| Milestones | |||||
| Milestone | Start Date | End Date | Budget | Manager | Department |
| First Advertising Campaign | 12/1/2001 | 3/1/2002 | $5,000 | Tara Juniper-Reid | Marketing |
| Full-Service Coffee Bar Integration | 2/1/2002 | 2/28/2002 | $5,000 | Donna Sharp | Bakery |
| Establishing a Lunch Menu | 3/1/2002 | 3/30/2002 | $1,000 | Donna Sharp | Bakery |
| Outdoor Cafe Seating | 5/1/2002 | 9/30/2002 | $10,000 | Donna Sharp | Bakery |
| Totals | $21,000 | ||||
Management Summary
Donna Sharp is the founder of Morningstar Bakery. She brings to the bakery her experience as a baker and as an entrepreneur. She has worked as a baker for over 10 years including two years as an apprentice in a well-known Paris patisserie. As a teenager she helped her parents at the family’s general store, both in sales and marketing. For her last two years at her family’s store, she was the general employee manager. Her duties at the bakery will include employee hiring and training, head baker and store management.
Donovan Bailey has run his own successful CPA consulting firm for 15 years. His duties will include the bookkeeping, inventory management and stock fulfillment.
Tara Juniper-Reid runs her own PR company and will be assisting the Morningstar Bakery in its marketing campaigns on a part-time basis.
Lucy Hamilton has worked as a baker for over five years and will be the assistant baker. Her responsibilities will also include the management of the bakery shopping list.
6.1 Personnel Plan
Once the bakery becomes established and the cash flow is steady, we would like to hire one person for counter help and another assistant baker.
The table below illustrates the needs of the current employees, plus the integration of two more employees within three months of operation. The new hirings will coincide with the opening of a lunch menu and coffee bar which will most certainly require more help.
| Personnel Plan | |||
| Year 1 | Year 2 | Year 3 | |
| Donna Sharp – Head Baker | $24,000 | $26,400 | $29,040 |
| Lucy Hamilton | $21,000 | $23,100 | $25,410 |
| Tara Juniper-Reid – Part-time | $9,000 | $9,900 | $10,890 |
| Counter Help – Full Time | $18,000 | $19,800 | $21,780 |
| Assistant Baker – Part time | $9,000 | $9,900 | $10,890 |
| Donovan Hamilton – Bookkeeper | $24,000 | $26,400 | $29,040 |
| Total People | 6 | 6 | 6 |
| Total Payroll | $105,000 | $115,500 | $127,050 |
Financial Plan
The following sections will outline important financial assumptions.
7.1 Important Assumptions
The current economic climate in the U.S. appears to be on the brink of recession. However, we do not believe that if the country does enter a recession that our business will be unduly affected. Since our products are ones that help contribute to and maintain good health, we believe that people will continue to buy our products over traditional wheat bread. We are operating in a niche market, and in addition, the price of our breads and sweets although slightly higher than traditional bakeries they are not positioned as expensive, luxury items.
| General Assumptions | |||
| Year 1 | Year 2 | Year 3 | |
| Plan Month | 1 | 2 | 3 |
| Current Interest Rate | 9.00% | 9.00% | 9.00% |
| Long-term Interest Rate | 8.50% | 8.50% | 8.50% |
| Tax Rate | 25.42% | 25.00% | 25.42% |
| Other | 0 | 0 | 0 |
7.2 Break-even Analysis
Our Break-Even Analysis includes running costs of production. These are fairly low since we manufacture all of our goods at a low cost to us. Here are the items included in the average percent variable cost:
- Manufacturing ingredients, i.e. flour, sugar, yeast and butter.
- Payroll.
- Mortgage.
- Utilities.
- Advertising.
The Break-Even Analysis as it appears below indicates that the break-even point will be attainable each month.

| Break-even Analysis | |
| Monthly Revenue Break-even | $19,036 |
| Assumptions: | |
| Average Percent Variable Cost | 36% |
| Estimated Monthly Fixed Cost | $12,271 |
7.3 Projected Profit and Loss
The following table shows the projected profit and loss for Morningstar Bakery.


| Pro Forma Profit and Loss | |||
| Year 1 | Year 2 | Year 3 | |
| Sales | $251,700 | $324,000 | $400,000 |
| Direct Cost of Sales | $89,450 | $115,200 | $142,000 |
| Other | $0 | $0 | $0 |
| Total Cost of Sales | $89,450 | $115,200 | $142,000 |
| Gross Margin | $162,250 | $208,800 | $258,000 |
| Gross Margin % | 64.46% | 64.44% | 64.50% |
| Expenses | |||
| Payroll | $105,000 | $115,500 | $127,050 |
| Sales and Marketing and Other Expenses | $13,040 | $14,640 | $16,640 |
| Depreciation | $3,492 | $3,492 | $3,492 |
| Utilities | $519 | $600 | $800 |
| Insurance | $1,800 | $2,400 | $2,800 |
| Mortgage | $10,800 | $15,096 | $15,096 |
| Payroll Taxes | $12,600 | $13,860 | $15,246 |
| Other | $0 | $0 | $0 |
| Total Operating Expenses | $147,251 | $165,588 | $181,124 |
| Profit Before Interest and Taxes | $14,999 | $43,212 | $76,876 |
| EBITDA | $18,491 | $46,704 | $80,368 |
| Interest Expense | $14,705 | $14,705 | $14,705 |
| Taxes Incurred | ($473) | $7,127 | $15,802 |
| Net Profit | $767 | $21,380 | $46,369 |
| Net Profit/Sales | 0.30% | 6.60% | 11.59% |
7.4 Projected Cash Flow
The following chart illustrates a healthy cash balance for the first three years, enabling the company to grow through reinvestment.

| Pro Forma Cash Flow | |||
| Year 1 | Year 2 | Year 3 | |
| Cash Received | |||
| Cash from Operations | |||
| Cash Sales | $251,700 | $324,000 | $400,000 |
| Subtotal Cash from Operations | $251,700 | $324,000 | $400,000 |
| Additional Cash Received | |||
| Sales Tax, VAT, HST/GST Received | $0 | $0 | $0 |
| New Current Borrowing | $0 | $0 | $0 |
| New Other Liabilities (interest-free) | $0 | $0 | $0 |
| New Long-term Liabilities | $0 | $0 | $0 |
| Sales of Other Current Assets | $0 | $0 | $0 |
| Sales of Long-term Assets | $0 | $0 | $0 |
| New Investment Received | $0 | $0 | $0 |
| Subtotal Cash Received | $251,700 | $324,000 | $400,000 |
| Expenditures | Year 1 | Year 2 | Year 3 |
| Expenditures from Operations | |||
| Cash Spending | $105,000 | $115,500 | $127,050 |
| Bill Payments | $128,199 | $182,776 | $219,845 |
| Subtotal Spent on Operations | $233,199 | $298,276 | $346,895 |
| Additional Cash Spent | |||
| Sales Tax, VAT, HST/GST Paid Out | $0 | $0 | $0 |
| Principal Repayment of Current Borrowing | $0 | $0 | $0 |
| Other Liabilities Principal Repayment | $0 | $0 | $0 |
| Long-term Liabilities Principal Repayment | $0 | $0 | $0 |
| Purchase Other Current Assets | $0 | $0 | $0 |
| Purchase Long-term Assets | $0 | $0 | $0 |
| Dividends | $0 | $0 | $0 |
| Subtotal Cash Spent | $233,199 | $298,276 | $346,895 |
| Net Cash Flow | $18,501 | $25,724 | $53,105 |
| Cash Balance | $30,593 | $56,316 | $109,421 |
7.5 Projected Balance Sheet
The following table represents the financial position of the Morningstar Bakery at the end of each of the three upcoming fiscal years.
| Pro Forma Balance Sheet | |||
| Year 1 | Year 2 | Year 3 | |
| Assets | |||
| Current Assets | |||
| Cash | $30,593 | $56,316 | $109,421 |
| Other Current Assets | $0 | $0 | $0 |
| Total Current Assets | $30,593 | $56,316 | $109,421 |
| Long-term Assets | |||
| Long-term Assets | $175,000 | $175,000 | $175,000 |
| Accumulated Depreciation | $3,492 | $6,984 | $10,476 |
| Total Long-term Assets | $171,508 | $168,016 | $164,524 |
| Total Assets | $202,101 | $224,332 | $273,945 |
| Liabilities and Capital | Year 1 | Year 2 | Year 3 |
| Current Liabilities | |||
| Accounts Payable | $14,241 | $15,093 | $18,336 |
| Current Borrowing | $0 | $0 | $0 |
| Other Current Liabilities | $12,000 | $12,000 | $12,000 |
| Subtotal Current Liabilities | $26,241 | $27,093 | $30,336 |
| Long-term Liabilities | $173,000 | $173,000 | $173,000 |
| Total Liabilities | $199,241 | $200,093 | $203,336 |
| Paid-in Capital | $7,500 | $7,500 | $7,500 |
| Retained Earnings | ($5,408) | ($4,641) | $16,740 |
| Earnings | $767 | $21,380 | $46,369 |
| Total Capital | $2,859 | $24,240 | $70,609 |
| Total Liabilities and Capital | $202,101 | $224,332 | $273,945 |
| Net Worth | $2,859 | $24,240 | $70,609 |
7.6 Business Ratios
Business ratios for the years of this plan are shown below. Industry profile ratios based on the Standard Industrial Classification (SIC) code 5461, Retail Bakeries, are shown for comparison.
| Ratio Analysis | ||||
| Year 1 | Year 2 | Year 3 | Industry Profile | |
| Sales Growth | 0.00% | 28.72% | 23.46% | 2.58% |
| Percent of Total Assets | ||||
| Other Current Assets | 0.00% | 0.00% | 0.00% | 29.82% |
| Total Current Assets | 15.14% | 25.10% | 39.94% | 55.20% |
| Long-term Assets | 84.86% | 74.90% | 60.06% | 44.80% |
| Total Assets | 100.00% | 100.00% | 100.00% | 100.00% |
| Current Liabilities | 12.98% | 12.08% | 11.07% | 25.40% |
| Long-term Liabilities | 85.60% | 77.12% | 63.15% | 23.07% |
| Total Liabilities | 98.59% | 89.19% | 74.23% | 48.47% |
| Net Worth | 1.41% | 10.81% | 25.77% | 51.53% |
| Percent of Sales | ||||
| Sales | 100.00% | 100.00% | 100.00% | 100.00% |
| Gross Margin | 64.46% | 64.44% | 64.50% | 36.64% |
| Selling, General & Administrative Expenses | 64.14% | 57.51% | 52.56% | 23.68% |
| Advertising Expenses | 4.13% | 3.70% | 3.50% | 1.65% |
| Profit Before Interest and Taxes | 5.96% | 13.34% | 19.22% | 1.92% |
| Main Ratios | ||||
| Current | 1.17 | 2.08 | 3.61 | 1.70 |
| Quick | 1.17 | 2.08 | 3.61 | 0.96 |
| Total Debt to Total Assets | 98.59% | 89.19% | 74.23% | 5.56% |
| Pre-tax Return on Net Worth | 10.28% | 117.61% | 88.05% | 56.30% |
| Pre-tax Return on Assets | 0.15% | 12.71% | 22.69% | 12.72% |
| Additional Ratios | Year 1 | Year 2 | Year 3 | |
| Net Profit Margin | 0.30% | 6.60% | 11.59% | n.a |
| Return on Equity | 26.84% | 88.20% | 65.67% | n.a |
| Activity Ratios | ||||
| Accounts Payable Turnover | 10.00 | 12.17 | 12.17 | n.a |
| Payment Days | 27 | 29 | 27 | n.a |
| Total Asset Turnover | 1.25 | 1.44 | 1.46 | n.a |
| Debt Ratios | ||||
| Debt to Net Worth | 69.68 | 8.25 | 2.88 | n.a |
| Current Liab. to Liab. | 0.13 | 0.14 | 0.15 | n.a |
| Liquidity Ratios | ||||
| Net Working Capital | $4,351 | $29,224 | $79,085 | n.a |
| Interest Coverage | 1.02 | 2.94 | 5.23 | n.a |
| Additional Ratios | ||||
| Assets to Sales | 0.80 | 0.69 | 0.68 | n.a |
| Current Debt/Total Assets | 13% | 12% | 11% | n.a |
| Acid Test | 1.17 | 2.08 | 3.61 | n.a |
| Sales/Net Worth | 88.03 | 13.37 | 5.67 | n.a |
| Dividend Payout | 0.00 | 0.00 | 0.00 | n.a |
Appendix
| Sales Forecast | |||||||||||||
| Month 1 | Month 2 | Month 3 | Month 4 | Month 5 | Month 6 | Month 7 | Month 8 | Month 9 | Month 10 | Month 11 | Month 12 | ||
| Sales | |||||||||||||
| Breads | 0% | $3,000 | $4,800 | $6,000 | $6,000 | $6,800 | $7,000 | $7,000 | $7,000 | $6,800 | $6,000 | $7,500 | $8,000 |
| Coffee/Beverages | 0% | $0 | $3,500 | $3,500 | $3,000 | $3,000 | $3,200 | $3,200 | $3,200 | $3,200 | $3,400 | $3,500 | $3,700 |
| Lunch Items (Soups & Sandwiches) | 0% | $0 | $0 | $8,000 | $8,000 | $8,000 | $8,000 | $8,000 | $8,000 | $8,000 | $8,000 | $8,000 | $8,000 |
| Pastries/Sweets | 0% | $2,000 | $4,600 | $5,000 | $5,000 | $5,000 | $5,000 | $5,000 | $5,000 | $5,000 | $5,000 | $6,000 | $6,800 |
| Total Sales | $5,000 | $12,900 | $22,500 | $22,000 | $22,800 | $23,200 | $23,200 | $23,200 | $23,000 | $22,400 | $25,000 | $26,500 | |
| Direct Cost of Sales | Month 1 | Month 2 | Month 3 | Month 4 | Month 5 | Month 6 | Month 7 | Month 8 | Month 9 | Month 10 | Month 11 | Month 12 | |
| Breads | $900 | $1,440 | $1,800 | $1,800 | $2,040 | $2,100 | $2,100 | $2,100 | $2,040 | $1,800 | $2,250 | $2,400 | |
| Coffee/Beverages | $0 | $1,050 | $1,050 | $900 | $900 | $960 | $960 | $960 | $960 | $1,020 | $1,050 | $1,110 | |
| Lunch Items (Soups & Sandwiches) | $0 | $0 | $3,200 | $3,200 | $3,200 | $3,200 | $3,200 | $3,200 | $3,200 | $3,200 | $3,200 | $3,200 | |
| Pastries/Sweets | $800 | $1,840 | $2,000 | $2,000 | $2,000 | $2,000 | $2,000 | $2,000 | $2,000 | $2,000 | $2,400 | $2,720 | |
| Subtotal Direct Cost of Sales | $1,700 | $4,330 | $8,050 | $7,900 | $8,140 | $8,260 | $8,260 | $8,260 | $8,200 | $8,020 | $8,900 | $9,430 | |
| Personnel Plan | |||||||||||||
| Month 1 | Month 2 | Month 3 | Month 4 | Month 5 | Month 6 | Month 7 | Month 8 | Month 9 | Month 10 | Month 11 | Month 12 | ||
| Donna Sharp – Head Baker | 0% | $2,000 | $2,000 | $2,000 | $2,000 | $2,000 | $2,000 | $2,000 | $2,000 | $2,000 | $2,000 | $2,000 | $2,000 |
| Lucy Hamilton | 0% | $1,750 | $1,750 | $1,750 | $1,750 | $1,750 | $1,750 | $1,750 | $1,750 | $1,750 | $1,750 | $1,750 | $1,750 |
| Tara Juniper-Reid – Part-time | 0% | $750 | $750 | $750 | $750 | $750 | $750 | $750 | $750 | $750 | $750 | $750 | $750 |
| Counter Help – Full Time | 0% | $1,500 | $1,500 | $1,500 | $1,500 | $1,500 | $1,500 | $1,500 | $1,500 | $1,500 | $1,500 | $1,500 | $1,500 |
| Assistant Baker – Part time | 0% | $750 | $750 | $750 | $750 | $750 | $750 | $750 | $750 | $750 | $750 | $750 | $750 |
| Donovan Hamilton – Bookkeeper | 0% | $2,000 | $2,000 | $2,000 | $2,000 | $2,000 | $2,000 | $2,000 | $2,000 | $2,000 | $2,000 | $2,000 | $2,000 |
| Total People | 6 | 6 | 6 | 6 | 6 | 6 | 6 | 6 | 6 | 6 | 6 | 6 | |
| Total Payroll | $8,750 | $8,750 | $8,750 | $8,750 | $8,750 | $8,750 | $8,750 | $8,750 | $8,750 | $8,750 | $8,750 | $8,750 | |
| General Assumptions | |||||||||||||
| Month 1 | Month 2 | Month 3 | Month 4 | Month 5 | Month 6 | Month 7 | Month 8 | Month 9 | Month 10 | Month 11 | Month 12 | ||
| Plan Month | 1 | 2 | 3 | 4 | 5 | 6 | 7 | 8 | 9 | 10 | 11 | 12 | |
| Current Interest Rate | 9.00% | 9.00% | 9.00% | 9.00% | 9.00% | 9.00% | 9.00% | 9.00% | 9.00% | 9.00% | 9.00% | 9.00% | |
| Long-term Interest Rate | 8.50% | 8.50% | 8.50% | 8.50% | 8.50% | 8.50% | 8.50% | 8.50% | 8.50% | 8.50% | 8.50% | 8.50% | |
| Tax Rate | 30.00% | 25.00% | 25.00% | 25.00% | 25.00% | 25.00% | 25.00% | 25.00% | 25.00% | 25.00% | 25.00% | 25.00% | |
| Other | 0 | 0 | 0 | 0 | 0 | 0 | 0 | 0 | 0 | 0 | 0 | 0 | |
| Pro Forma Profit and Loss | |||||||||||||
| Month 1 | Month 2 | Month 3 | Month 4 | Month 5 | Month 6 | Month 7 | Month 8 | Month 9 | Month 10 | Month 11 | Month 12 | ||
| Sales | $5,000 | $12,900 | $22,500 | $22,000 | $22,800 | $23,200 | $23,200 | $23,200 | $23,000 | $22,400 | $25,000 | $26,500 | |
| Direct Cost of Sales | $1,700 | $4,330 | $8,050 | $7,900 | $8,140 | $8,260 | $8,260 | $8,260 | $8,200 | $8,020 | $8,900 | $9,430 | |
| Other | $0 | $0 | $0 | $0 | $0 | $0 | $0 | $0 | $0 | $0 | $0 | $0 | |
| Total Cost of Sales | $1,700 | $4,330 | $8,050 | $7,900 | $8,140 | $8,260 | $8,260 | $8,260 | $8,200 | $8,020 | $8,900 | $9,430 | |
| Gross Margin | $3,300 | $8,570 | $14,450 | $14,100 | $14,660 | $14,940 | $14,940 | $14,940 | $14,800 | $14,380 | $16,100 | $17,070 | |
| Gross Margin % | 66.00% | 66.43% | 64.22% | 64.09% | 64.30% | 64.40% | 64.40% | 64.40% | 64.35% | 64.20% | 64.40% | 64.42% | |
| Expenses | |||||||||||||
| Payroll | $8,750 | $8,750 | $8,750 | $8,750 | $8,750 | $8,750 | $8,750 | $8,750 | $8,750 | $8,750 | $8,750 | $8,750 | |
| Sales and Marketing and Other Expenses | $1,820 | $1,820 | $1,820 | $720 | $720 | $1,220 | $720 | $720 | $720 | $720 | $1,020 | $1,020 | |
| Depreciation | $291 | $291 | $291 | $291 | $291 | $291 | $291 | $291 | $291 | $291 | $291 | $291 | |
| Utilities | $50 | $50 | $48 | $45 | $45 | $35 | $35 | $35 | $35 | $45 | $48 | $48 | |
| Insurance | $150 | $150 | $150 | $150 | $150 | $150 | $150 | $150 | $150 | $150 | $150 | $150 | |
| Mortgage | $900 | $900 | $900 | $900 | $900 | $900 | $900 | $900 | $900 | $900 | $900 | $900 | |
| Payroll Taxes | 12% | $1,050 | $1,050 | $1,050 | $1,050 | $1,050 | $1,050 | $1,050 | $1,050 | $1,050 | $1,050 | $1,050 | $1,050 |
| Other | $0 | $0 | $0 | $0 | $0 | $0 | $0 | $0 | $0 | $0 | $0 | $0 | |
| Total Operating Expenses | $13,011 | $13,011 | $13,009 | $11,906 | $11,906 | $12,396 | $11,896 | $11,896 | $11,896 | $11,906 | $12,209 | $12,209 | |
| Profit Before Interest and Taxes | ($9,711) | ($4,441) | $1,441 | $2,194 | $2,754 | $2,544 | $3,044 | $3,044 | $2,904 | $2,474 | $3,891 | $4,861 | |
| EBITDA | ($9,420) | ($4,150) | $1,732 | $2,485 | $3,045 | $2,835 | $3,335 | $3,335 | $3,195 | $2,765 | $4,182 | $5,152 | |
| Interest Expense | $1,225 | $1,225 | $1,225 | $1,225 | $1,225 | $1,225 | $1,225 | $1,225 | $1,225 | $1,225 | $1,225 | $1,225 | |
| Taxes Incurred | ($3,281) | ($1,417) | $54 | $242 | $382 | $330 | $455 | $455 | $420 | $312 | $666 | $909 | |
| Net Profit | ($7,655) | ($4,250) | $162 | $726 | $1,146 | $989 | $1,364 | $1,364 | $1,259 | $936 | $1,999 | $2,727 | |
| Net Profit/Sales | -153.11% | -32.94% | 0.72% | 3.30% | 5.03% | 4.26% | 5.88% | 5.88% | 5.47% | 4.18% | 8.00% | 10.29% | |
| Pro Forma Cash Flow | |||||||||||||
| Month 1 | Month 2 | Month 3 | Month 4 | Month 5 | Month 6 | Month 7 | Month 8 | Month 9 | Month 10 | Month 11 | Month 12 | ||
| Cash Received | |||||||||||||
| Cash from Operations | |||||||||||||
| Cash Sales | $5,000 | $12,900 | $22,500 | $22,000 | $22,800 | $23,200 | $23,200 | $23,200 | $23,000 | $22,400 | $25,000 | $26,500 | |
| Subtotal Cash from Operations | $5,000 | $12,900 | $22,500 | $22,000 | $22,800 | $23,200 | $23,200 | $23,200 | $23,000 | $22,400 | $25,000 | $26,500 | |
| Additional Cash Received | |||||||||||||
| Sales Tax, VAT, HST/GST Received | 0.00% | $0 | $0 | $0 | $0 | $0 | $0 | $0 | $0 | $0 | $0 | $0 | $0 |
| New Current Borrowing | $0 | $0 | $0 | $0 | $0 | $0 | $0 | $0 | $0 | $0 | $0 | $0 | |
| New Other Liabilities (interest-free) | $0 | $0 | $0 | $0 | $0 | $0 | $0 | $0 | $0 | $0 | $0 | $0 | |
| New Long-term Liabilities | $0 | $0 | $0 | $0 | $0 | $0 | $0 | $0 | $0 | $0 | $0 | $0 | |
| Sales of Other Current Assets | $0 | $0 | $0 | $0 | $0 | $0 | $0 | $0 | $0 | $0 | $0 | $0 | |
| Sales of Long-term Assets | $0 | $0 | $0 | $0 | $0 | $0 | $0 | $0 | $0 | $0 | $0 | $0 | |
| New Investment Received | $0 | $0 | $0 | $0 | $0 | $0 | $0 | $0 | $0 | $0 | $0 | $0 | |
| Subtotal Cash Received | $5,000 | $12,900 | $22,500 | $22,000 | $22,800 | $23,200 | $23,200 | $23,200 | $23,000 | $22,400 | $25,000 | $26,500 | |
| Expenditures | Month 1 | Month 2 | Month 3 | Month 4 | Month 5 | Month 6 | Month 7 | Month 8 | Month 9 | Month 10 | Month 11 | Month 12 | |
| Expenditures from Operations | |||||||||||||
| Cash Spending | $8,750 | $8,750 | $8,750 | $8,750 | $8,750 | $8,750 | $8,750 | $8,750 | $8,750 | $8,750 | $8,750 | $8,750 | |
| Bill Payments | $120 | $3,764 | $8,282 | $13,262 | $12,245 | $12,631 | $13,158 | $12,795 | $12,792 | $12,691 | $12,474 | $13,986 | |
| Subtotal Spent on Operations | $8,870 | $12,514 | $17,032 | $22,012 | $20,995 | $21,381 | $21,908 | $21,545 | $21,542 | $21,441 | $21,224 | $22,736 | |
| Additional Cash Spent | |||||||||||||
| Sales Tax, VAT, HST/GST Paid Out | $0 | $0 | $0 | $0 | $0 | $0 | $0 | $0 | $0 | $0 | $0 | $0 | |
| Principal Repayment of Current Borrowing | $0 | $0 | $0 | $0 | $0 | $0 | $0 | $0 | $0 | $0 | $0 | $0 | |
| Other Liabilities Principal Repayment | $0 | $0 | $0 | $0 | $0 | $0 | $0 | $0 | $0 | $0 | $0 | $0 | |
| Long-term Liabilities Principal Repayment | $0 | $0 | $0 | $0 | $0 | $0 | $0 | $0 | $0 | $0 | $0 | $0 | |
| Purchase Other Current Assets | $0 | $0 | $0 | $0 | $0 | $0 | $0 | $0 | $0 | $0 | $0 | $0 | |
| Purchase Long-term Assets | $0 | $0 | $0 | $0 | $0 | $0 | $0 | $0 | $0 | $0 | $0 | $0 | |
| Dividends | $0 | $0 | $0 | $0 | $0 | $0 | $0 | $0 | $0 | $0 | $0 | $0 | |
| Subtotal Cash Spent | $8,870 | $12,514 | $17,032 | $22,012 | $20,995 | $21,381 | $21,908 | $21,545 | $21,542 | $21,441 | $21,224 | $22,736 | |
| Net Cash Flow | ($3,870) | $386 | $5,468 | ($12) | $1,805 | $1,819 | $1,292 | $1,655 | $1,458 | $959 | $3,776 | $3,764 | |
| Cash Balance | $8,222 | $8,607 | $14,075 | $14,064 | $15,868 | $17,687 | $18,980 | $20,635 | $22,093 | $23,052 | $26,828 | $30,593 | |
| Pro Forma Balance Sheet | |||||||||||||
| Month 1 | Month 2 | Month 3 | Month 4 | Month 5 | Month 6 | Month 7 | Month 8 | Month 9 | Month 10 | Month 11 | Month 12 | ||
| Assets | Starting Balances | ||||||||||||
| Current Assets | |||||||||||||
| Cash | $12,092 | $8,222 | $8,607 | $14,075 | $14,064 | $15,868 | $17,687 | $18,980 | $20,635 | $22,093 | $23,052 | $26,828 | $30,593 |
| Other Current Assets | $0 | $0 | $0 | $0 | $0 | $0 | $0 | $0 | $0 | $0 | $0 | $0 | $0 |
| Total Current Assets | $12,092 | $8,222 | $8,607 | $14,075 | $14,064 | $15,868 | $17,687 | $18,980 | $20,635 | $22,093 | $23,052 | $26,828 | $30,593 |
| Long-term Assets | |||||||||||||
| Long-term Assets | $175,000 | $175,000 | $175,000 | $175,000 | $175,000 | $175,000 | $175,000 | $175,000 | $175,000 | $175,000 | $175,000 | $175,000 | $175,000 |
| Accumulated Depreciation | $0 | $291 | $582 | $873 | $1,164 | $1,455 | $1,746 | $2,037 | $2,328 | $2,619 | $2,910 | $3,201 | $3,492 |
| Total Long-term Assets | $175,000 | $174,709 | $174,418 | $174,127 | $173,836 | $173,545 | $173,254 | $172,963 | $172,672 | $172,381 | $172,090 | $171,799 | $171,508 |
| Total Assets | $187,092 | $182,931 | $183,025 | $188,202 | $187,900 | $189,413 | $190,941 | $191,943 | $193,307 | $194,474 | $195,142 | $198,627 | $202,101 |
| Liabilities and Capital | Month 1 | Month 2 | Month 3 | Month 4 | Month 5 | Month 6 | Month 7 | Month 8 | Month 9 | Month 10 | Month 11 | Month 12 | |
| Current Liabilities | |||||||||||||
| Accounts Payable | $0 | $3,494 | $7,839 | $12,854 | $11,825 | $12,192 | $12,731 | $12,369 | $12,369 | $12,277 | $12,008 | $13,494 | $14,241 |
| Current Borrowing | $0 | $0 | $0 | $0 | $0 | $0 | $0 | $0 | $0 | $0 | $0 | $0 | $0 |
| Other Current Liabilities | $12,000 | $12,000 | $12,000 | $12,000 | $12,000 | $12,000 | $12,000 | $12,000 | $12,000 | $12,000 | $12,000 | $12,000 | $12,000 |
| Subtotal Current Liabilities | $12,000 | $15,494 | $19,839 | $24,854 | $23,825 | $24,192 | $24,731 | $24,369 | $24,369 | $24,277 | $24,008 | $25,494 | $26,241 |
| Long-term Liabilities | $173,000 | $173,000 | $173,000 | $173,000 | $173,000 | $173,000 | $173,000 | $173,000 | $173,000 | $173,000 | $173,000 | $173,000 | $173,000 |
| Total Liabilities | $185,000 | $188,494 | $192,839 | $197,854 | $196,825 | $197,192 | $197,731 | $197,369 | $197,369 | $197,277 | $197,008 | $198,494 | $199,241 |
| Paid-in Capital | $7,500 | $7,500 | $7,500 | $7,500 | $7,500 | $7,500 | $7,500 | $7,500 | $7,500 | $7,500 | $7,500 | $7,500 | $7,500 |
| Retained Earnings | ($5,408) | ($5,408) | ($5,408) | ($5,408) | ($5,408) | ($5,408) | ($5,408) | ($5,408) | ($5,408) | ($5,408) | ($5,408) | ($5,408) | ($5,408) |
| Earnings | $0 | ($7,655) | ($11,905) | ($11,744) | ($11,017) | ($9,871) | ($8,882) | ($7,518) | ($6,154) | ($4,895) | ($3,959) | ($1,959) | $767 |
| Total Capital | $2,092 | ($5,563) | ($9,813) | ($9,652) | ($8,925) | ($7,779) | ($6,790) | ($5,426) | ($4,062) | ($2,803) | ($1,867) | $133 | $2,859 |
| Total Liabilities and Capital | $187,092 | $182,931 | $183,025 | $188,202 | $187,900 | $189,413 | $190,941 | $191,943 | $193,307 | $194,474 | $195,142 | $198,627 | $202,101 |
| Net Worth | $2,092 | ($5,563) | ($9,813) | ($9,652) | ($8,925) | ($7,779) | ($6,790) | ($5,426) | ($4,062) | ($2,803) | ($1,867) | $133 | $2,859 |


