
Visions
Executive Summary
Visions (VS) is a socially and environmentally conscious health club that is concerned not only with physical beauty but also with mental well being. It is a health club with environmental and social concerns that sets it apart from other clubs; all products used are plant safe and cruelty free. We at VS feel that pampering our clients’ leads to the health and well being of the greater society, therefore, we address the special health concerns of our clients with exercise, yoga, and meditation.
The goals of our company are to be profitable and build a product line through name recognition. It is the immediate goal to launch an additional product line into the beauty market, while the long-term goal is to go public with several health club facilities and an active product line.

1.1 Keys to Success
- Create an environment for people to feel good about themselves, both physically and mentally.
- Provide services for those seeking natural means to strengthen and heal their bodies due to injury or illness.
- Provide services for the needs of women in shelters and those struggling financially.
- Provide special activities for various holidays.
1.2 Objectives
- Break even by the end of year two.
- Have an increase in new clients quarterly.
- Have the company’s work in the community covered in the local media.
- Ability to increase the percentage of profits donated to charities.
1.3 Mission
The goal of our company is to enhance the lives of men and women by providing an atmosphere that aids the body with relaxation techniques and health conscious alternatives.
Company Summary
Visions has been a dream for the founders; it was essential for a salon/health club/spa to nurture mind, body, and spirit. This combination is hard to come by in Seattle, and so the four founders decided to create the Visions health club and sought the backing of three angel investors.
VS is located in the Queen Anne Hill district of Seattle, Washington, and provides a magical setting for this soothing building. It is downtown and in the heart of our target market.
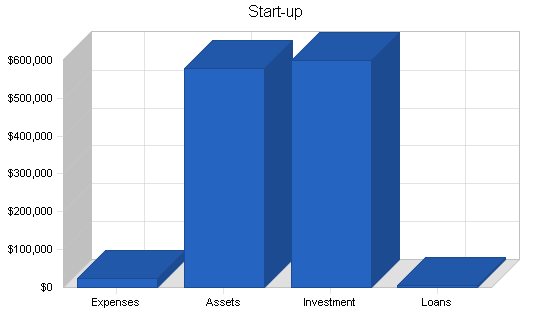
2.1 Start-up Summary
The table that follows details projected starting costs.
| Start-up | |
| Requirements | |
| Start-up Expenses | |
| Legal | $7,500 |
| Stationery etc. | $500 |
| Brochures | $5,000 |
| Consultants | $0 |
| Insurance | $500 |
| Rent | $4,500 |
| Research and development | $0 |
| Expensed equipment | $2,500 |
| Other | $4,500 |
| Total Start-up Expenses | $25,000 |
| Start-up Assets | |
| Cash Required | $500,000 |
| Start-up Inventory | $5,000 |
| Other Current Assets | $75,000 |
| Long-term Assets | $0 |
| Total Assets | $580,000 |
| Total Requirements | $605,000 |
| Start-up Funding | |
| Start-up Expenses to Fund | $25,000 |
| Start-up Assets to Fund | $580,000 |
| Total Funding Required | $605,000 |
| Assets | |
| Non-cash Assets from Start-up | $80,000 |
| Cash Requirements from Start-up | $500,000 |
| Additional Cash Raised | $0 |
| Cash Balance on Starting Date | $500,000 |
| Total Assets | $580,000 |
| Liabilities and Capital | |
| Liabilities | |
| Current Borrowing | $0 |
| Long-term Liabilities | $0 |
| Accounts Payable (Outstanding Bills) | $5,000 |
| Other Current Liabilities (interest-free) | $0 |
| Total Liabilities | $5,000 |
| Capital | |
| Planned Investment | |
| Investor 1 | $200,000 |
| Investor 2 | $200,000 |
| Invertor 3 | $200,000 |
| Additional Investment Requirement | $0 |
| Total Planned Investment | $600,000 |
| Loss at Start-up (Start-up Expenses) | ($25,000) |
| Total Capital | $575,000 |
| Total Capital and Liabilities | $580,000 |
| Total Funding | $605,000 |
Services
Visions is a combination salon, spa, and health club. We specialize in improving the mind, body, and soul. Each part of the club offers different services: haircuts, color, and styling in the salon, full-body pampering in the spa, and fitness classes in the health club. Each of these services is designed to nurture one’s complete self, and, in turn, improve self image.
Future services include a product line that is pure and natural: no animal testing, and the use of only organic ingredients. Another goal for the future is making our kitchen available for rent by start-up restaurants hoping to introduce their food to our clientele. Ideally, VS would like to create similar clubs in other cities as well.
Market Analysis Summary
The initial market for VS is Seattle, Washington. With its growing population of moderate to high income professionals, Seattle provides an ideal market. It is also one of the fastest growing areas in the country, with a continually expanding consumer base. Another advantage to the Seattle market is the high level of travel to the area, especially among professionals. This also increases our possible consumer base.
VS aims to provide health and spa services to those seeking physical and mental well being. Women between the ages of 18 and 70 are the vast market, with an emphasis on professional women in their mid twenties through their mid fifties. Also, women battling or recovering from a serious injury or illness are another specific target market. For men, professionals concerned about their appearance are our main market. They are often in their late twenties through their mid forties. We target anyone who is searching for a natural method to heal body and soul, regardless of age or income.
4.1 Market Segmentation
Our market segmentation is specific to two target groups. Our first target market is the corporate workers of Seattle. We have chosen these people, ranging from early twenties to mid forties, because they are in stressful jobs and could use relaxation and exercise. They also have the financial opportunity to regularly treat themselves to a facial or massage. Often in the working world it is necessary to look healthy and fit, therefore, we offer exercise facilities to keep people fit and happy.
The second group we target is people either recovering from an injury or people who have a condition which needs special attention. We wanted to create a safe environment where people feel comfortable and get the attention they need with out feeling ostracized or sick. We offer special classes, massage, and homeopathic opportunities for people with specific needs.
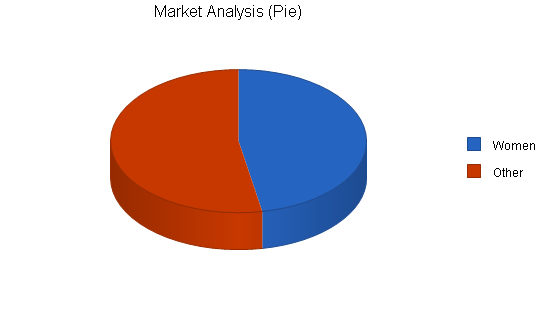
The chart and table below outline the target markets we have chosen; however, for simplicity’s sake, we break our market into two segments: Women and Other. We firmly believe that women would take advantage of our services more often than men would.
| Market Analysis | |||||||
| Year 1 | Year 2 | Year 3 | Year 4 | Year 5 | |||
| Potential Customers | Growth | CAGR | |||||
| Women | 4% | 400,000 | 416,000 | 432,640 | 449,946 | 467,944 | 4.00% |
| Other | 5% | 450,000 | 472,500 | 496,125 | 520,931 | 546,978 | 5.00% |
| Total | 4.53% | 850,000 | 888,500 | 928,765 | 970,877 | 1,014,922 | 4.53% |
4.2 Target Market Segment Strategy
We have designed several ways to receive positive attention and publicity for our first year. We plan to open on Mother’s day, offering people a tour of the facilities, facials, manicures, and brunch. People will be allowed to purchase tickets for $20 each and will be offered special benefits and packages.
To continue customer awareness, we have created a monthly newsletter, highlighting monthly specials and other events that are important to the company.
4.3 Market Needs
Our market’s needs are simple: people want to look and feel good. We aim to please people who want this. It has been determined that our target markets are also interested in social issues such as the environment and community. These ideals provide VS with a competitive edge because we are committed not only to the needs of the community, but it’s concerns as well.
4.3.1 Competition
Our indirect competition includes salons, health clubs, and spas in the Seattle area. Because VS is a full-service salon, there is no direct competition.
Strategy and Implementation Summary
The Visions name will became familiar to the Seattle community on different levels and by various methods. Interacting and volunteering with local hospitals and survivor support groups makes the health and homeopathic healing area known. Community outreach to women’s shelters and special days at the salon and spa help women nurture their spirit to help them become more productive. Advertising in local Seattle magazines and newspapers helps get VS to the mass public. Initial corporate discounts provide for a demand on the salon as early as the grand opening, and mailings and newsletters keep our client base in touch.

All these promotional methods mesh together to form a sturdy advertising base for the company to grow on.
5.1 Competitive Edge
Our competitive edge is that we offer a relaxing atmosphere that can refresh the mind, body, and soul. Offering special classes for those with serious health concerns sets us apart, as does the availability of all services under one roof.
5.2 Sales Strategy
Our revenue is earned in several ways. First, with memberships in which there is a monthly charge that provides discounts on services; full price is charged to non-members for services. Our main goal is to foster relationships with clients and keep them through quality of service and products. The second method of sales will be encouraged through repeat business and word-of-mouth advertising.
5.2.1 Sales Forecast
The Sales Forecast is in monthly detail in the chart, and the summary follows in the table.

| Sales Forecast | |||
| Year 1 | Year 2 | Year 3 | |
| Unit Sales | |||
| Salon | 3,275 | 6,500 | 9,000 |
| Exercise/Therapy | 14,755 | 18,000 | 22,000 |
| Spa | 2,425 | 3,500 | 4,300 |
| Other | 600 | 800 | 1,000 |
| Total Unit Sales | 21,055 | 28,800 | 36,300 |
| Unit Prices | Year 1 | Year 2 | Year 3 |
| Salon | $55.00 | $57.00 | $60.00 |
| Exercise/Therapy | $8.50 | $9.00 | $9.00 |
| Spa | $45.00 | $45.00 | $45.00 |
| Other | $10.00 | $12.00 | $15.00 |
| Sales | |||
| Salon | $180,125 | $370,500 | $540,000 |
| Exercise/Therapy | $125,418 | $162,000 | $198,000 |
| Spa | $109,125 | $157,500 | $193,500 |
| Other | $6,000 | $9,600 | $15,000 |
| Total Sales | $420,668 | $699,600 | $946,500 |
| Direct Unit Costs | Year 1 | Year 2 | Year 3 |
| Salon | $1.00 | $1.00 | $1.00 |
| Exercise/Therapy | $0.00 | $0.00 | $0.00 |
| Spa | $1.00 | $1.00 | $1.00 |
| Other | $3.00 | $3.00 | $3.00 |
| Direct Cost of Sales | |||
| Salon | $3,275 | $6,500 | $9,000 |
| Exercise/Therapy | $0 | $0 | $0 |
| Spa | $2,425 | $3,500 | $4,300 |
| Other | $1,800 | $2,400 | $3,000 |
| Subtotal Direct Cost of Sales | $7,500 | $12,400 | $16,300 |
Management Summary
Vision’s location in Seattle will be staffed according to department. The salon will have two full-time stylists and the spa with be staffed with a full-time beauty technician and masseur. The health department will have three part-time instructors working on rotating shifts.
Management will have four managers, each with specific areas of expertise: financials, publicity, human resources, and ongoing development.
6.1 Personnel Plan
The Personnel Plan follows. Details are in the appendix.
| Personnel Plan | |||
| Year 1 | Year 2 | Year 3 | |
| Management | $240,000 | $275,000 | $325,000 |
| Salon | $30,720 | $31,000 | $32,000 |
| Spa | $30,720 | $31,000 | $32,000 |
| Health | $34,560 | $35,000 | $36,000 |
| Other | $0 | $0 | $0 |
| Total People | 11 | 11 | 11 |
| Total Payroll | $336,000 | $372,000 | $425,000 |
Financial Plan
The plan for Visions’ financial future is steady growth. With a foundation of start-up investment from angel investors, VS has a solid cash base from which to establish itself and build name recognition. The eventual goal is to go public with a product line and locations around the country. The company will break-even shortly after the second year, making the location self supporting.
Leasing the location with the option to purchase the property is ideal for the company. The equipment, including exercise equipment, was purchased with start-up funds, leaving VS with little monthly costs beyond rent, utilities, and payroll. VS has a small staff of service providers whose payroll is subsidized by tips from clients. The managers are paid modestly,with their pay tied to the success of the company.
7.1 Important Assumptions
The main assumptions are the continued market need and the ability to deliver. We have included financial assumptions below.
| General Assumptions | |||
| Year 1 | Year 2 | Year 3 | |
| Plan Month | 1 | 2 | 3 |
| Current Interest Rate | 8.00% | 8.00% | 8.00% |
| Long-term Interest Rate | 7.25% | 7.25% | 7.25% |
| Tax Rate | 25.42% | 25.00% | 25.42% |
| Other | 0 | 0 | 0 |
7.2 Key Financial Indicators
Key to the financial success of VS is continued annual growth. While there are times of the year, especially holidays, where sales are expected to rise substantially, annual growth is imperative. The direct costs of providing our services is small, so increasing the number of clients receiving services will aid the bottom line. The inventory turnover increase shown in the chart is the result of rounding, our inventory remains steady at approximately two months in stock.

7.3 Break-even Analysis
The Break-even Analysis in this plan makes many assumptions to achieve an estimate. Almost all cost in the operations will remained fixed. Salary for employees, lease, and utility costs are all considered as fixed costs.

| Break-even Analysis | |
| Monthly Units Break-even | 2,653 |
| Monthly Revenue Break-even | $53,005 |
| Assumptions: | |
| Average Per-Unit Revenue | $19.98 |
| Average Per-Unit Variable Cost | $0.36 |
| Estimated Monthly Fixed Cost | $52,060 |
7.4 Projected Profit and Loss
We expect to return increasing profits over the next three years.


| Pro Forma Profit and Loss | |||
| Year 1 | Year 2 | Year 3 | |
| Sales | $420,668 | $699,600 | $946,500 |
| Direct Cost of Sales | $7,500 | $12,400 | $16,300 |
| Other | $0 | $0 | $0 |
| Total Cost of Sales | $7,500 | $12,400 | $16,300 |
| Gross Margin | $413,168 | $687,200 | $930,200 |
| Gross Margin % | 98.22% | 98.23% | 98.28% |
| Expenses | |||
| Payroll | $336,000 | $372,000 | $425,000 |
| Sales and Marketing and Other Expenses | $98,520 | $107,000 | $112,000 |
| Depreciation | $0 | $0 | $0 |
| Leased Equipment | $0 | $0 | $0 |
| Utilities | $40,200 | $45,000 | $45,000 |
| Insurance | $12,000 | $12,000 | $12,000 |
| Rent | $54,000 | $54,000 | $54,000 |
| Payroll Taxes | $84,000 | $93,000 | $106,250 |
| Other | $0 | $0 | $0 |
| Total Operating Expenses | $624,720 | $683,000 | $754,250 |
| Profit Before Interest and Taxes | ($211,553) | $4,200 | $175,950 |
| EBITDA | ($211,553) | $4,200 | $175,950 |
| Interest Expense | $0 | $0 | $0 |
| Taxes Incurred | $0 | $1,050 | $44,721 |
| Net Profit | ($211,553) | $3,150 | $131,229 |
| Net Profit/Sales | -50.29% | 0.45% | 13.86% |
7.5 Projected Cash Flow
The following chart and table show the cash flow for Visions.

| Pro Forma Cash Flow | |||
| Year 1 | Year 2 | Year 3 | |
| Cash Received | |||
| Cash from Operations | |||
| Cash Sales | $420,668 | $699,600 | $946,500 |
| Subtotal Cash from Operations | $420,668 | $699,600 | $946,500 |
| Additional Cash Received | |||
| Sales Tax, VAT, HST/GST Received | $0 | $0 | $0 |
| New Current Borrowing | $0 | $0 | $0 |
| New Other Liabilities (interest-free) | $0 | $0 | $0 |
| New Long-term Liabilities | $0 | $0 | $0 |
| Sales of Other Current Assets | $0 | $0 | $0 |
| Sales of Long-term Assets | $0 | $0 | $0 |
| New Investment Received | $0 | $0 | $0 |
| Subtotal Cash Received | $420,668 | $699,600 | $946,500 |
| Expenditures | Year 1 | Year 2 | Year 3 |
| Expenditures from Operations | |||
| Cash Spending | $336,000 | $372,000 | $425,000 |
| Bill Payments | $272,635 | $323,767 | $385,657 |
| Subtotal Spent on Operations | $608,635 | $695,767 | $810,657 |
| Additional Cash Spent | |||
| Sales Tax, VAT, HST/GST Paid Out | $0 | $0 | $0 |
| Principal Repayment of Current Borrowing | $0 | $0 | $0 |
| Other Liabilities Principal Repayment | $0 | $0 | $0 |
| Long-term Liabilities Principal Repayment | $0 | $0 | $0 |
| Purchase Other Current Assets | $0 | $0 | $0 |
| Purchase Long-term Assets | $0 | $0 | $0 |
| Dividends | $0 | $0 | $0 |
| Subtotal Cash Spent | $608,635 | $695,767 | $810,657 |
| Net Cash Flow | ($187,968) | $3,833 | $135,843 |
| Cash Balance | $312,033 | $315,865 | $451,708 |
7.6 Projected Balance Sheet
The following table shows the projected Balance sheet.
| Pro Forma Balance Sheet | |||
| Year 1 | Year 2 | Year 3 | |
| Assets | |||
| Current Assets | |||
| Cash | $312,033 | $315,865 | $451,708 |
| Inventory | $1,500 | $2,480 | $3,260 |
| Other Current Assets | $75,000 | $75,000 | $75,000 |
| Total Current Assets | $388,533 | $393,345 | $529,968 |
| Long-term Assets | |||
| Long-term Assets | $0 | $0 | $0 |
| Accumulated Depreciation | $0 | $0 | $0 |
| Total Long-term Assets | $0 | $0 | $0 |
| Total Assets | $388,533 | $393,345 | $529,968 |
| Liabilities and Capital | Year 1 | Year 2 | Year 3 |
| Current Liabilities | |||
| Accounts Payable | $25,085 | $26,748 | $32,141 |
| Current Borrowing | $0 | $0 | $0 |
| Other Current Liabilities | $0 | $0 | $0 |
| Subtotal Current Liabilities | $25,085 | $26,748 | $32,141 |
| Long-term Liabilities | $0 | $0 | $0 |
| Total Liabilities | $25,085 | $26,748 | $32,141 |
| Paid-in Capital | $600,000 | $600,000 | $600,000 |
| Retained Earnings | ($25,000) | ($236,553) | ($233,403) |
| Earnings | ($211,553) | $3,150 | $131,229 |
| Total Capital | $363,448 | $366,598 | $497,827 |
| Total Liabilities and Capital | $388,533 | $393,345 | $529,968 |
| Net Worth | $363,448 | $366,598 | $497,827 |
7.7 Business Ratios
Industry profile ratios based on the Standard Industrial Classification (SIC) code 7991, Physical Fitness Facilities, are shown for comparison.
| Ratio Analysis | ||||
| Year 1 | Year 2 | Year 3 | Industry Profile | |
| Sales Growth | 0.00% | 66.31% | 35.29% | 15.90% |
| Percent of Total Assets | ||||
| Inventory | 0.39% | 0.63% | 0.62% | 3.60% |
| Other Current Assets | 19.30% | 19.07% | 14.15% | 31.10% |
| Total Current Assets | 100.00% | 100.00% | 100.00% | 39.00% |
| Long-term Assets | 0.00% | 0.00% | 0.00% | 61.00% |
| Total Assets | 100.00% | 100.00% | 100.00% | 100.00% |
| Current Liabilities | 6.46% | 6.80% | 6.06% | 34.80% |
| Long-term Liabilities | 0.00% | 0.00% | 0.00% | 27.60% |
| Total Liabilities | 6.46% | 6.80% | 6.06% | 62.40% |
| Net Worth | 93.54% | 93.20% | 93.94% | 37.60% |
| Percent of Sales | ||||
| Sales | 100.00% | 100.00% | 100.00% | 100.00% |
| Gross Margin | 98.22% | 98.23% | 98.28% | 0.00% |
| Selling, General & Administrative Expenses | 148.51% | 97.78% | 84.34% | 73.20% |
| Advertising Expenses | 18.54% | 11.44% | 8.45% | 2.40% |
| Profit Before Interest and Taxes | -50.29% | 0.60% | 18.59% | 2.70% |
| Main Ratios | ||||
| Current | 15.49 | 14.71 | 16.49 | 1.10 |
| Quick | 15.43 | 14.61 | 16.39 | 0.73 |
| Total Debt to Total Assets | 6.46% | 6.80% | 6.06% | 62.40% |
| Pre-tax Return on Net Worth | -58.21% | 1.15% | 35.34% | 3.00% |
| Pre-tax Return on Assets | -54.45% | 1.07% | 33.20% | 7.90% |
| Additional Ratios | Year 1 | Year 2 | Year 3 | |
| Net Profit Margin | -50.29% | 0.45% | 13.86% | n.a |
| Return on Equity | -58.21% | 0.86% | 26.36% | n.a |
| Activity Ratios | ||||
| Inventory Turnover | 3.53 | 6.23 | 5.68 | n.a |
| Accounts Payable Turnover | 11.67 | 12.17 | 12.17 | n.a |
| Payment Days | 28 | 29 | 27 | n.a |
| Total Asset Turnover | 1.08 | 1.78 | 1.79 | n.a |
| Debt Ratios | ||||
| Debt to Net Worth | 0.07 | 0.07 | 0.06 | n.a |
| Current Liab. to Liab. | 1.00 | 1.00 | 1.00 | n.a |
| Liquidity Ratios | ||||
| Net Working Capital | $363,448 | $366,598 | $497,827 | n.a |
| Interest Coverage | 0.00 | 0.00 | 0.00 | n.a |
| Additional Ratios | ||||
| Assets to Sales | 0.92 | 0.56 | 0.56 | n.a |
| Current Debt/Total Assets | 6% | 7% | 6% | n.a |
| Acid Test | 15.43 | 14.61 | 16.39 | n.a |
| Sales/Net Worth | 1.16 | 1.91 | 1.90 | n.a |
| Dividend Payout | 0.00 | 0.00 | 0.00 | n.a |
Appendix
| Sales Forecast | |||||||||||||
| Month 1 | Month 2 | Month 3 | Month 4 | Month 5 | Month 6 | Month 7 | Month 8 | Month 9 | Month 10 | Month 11 | Month 12 | ||
| Unit Sales | |||||||||||||
| Salon | 0% | 160 | 210 | 260 | 300 | 300 | 275 | 290 | 310 | 290 | 300 | 280 | 300 |
| Exercise/Therapy | 0% | 900 | 960 | 1,100 | 1,100 | 1,200 | 1,350 | 1,350 | 1,275 | 1,430 | 1,390 | 1,350 | 1,350 |
| Spa | 0% | 120 | 150 | 180 | 200 | 220 | 200 | 225 | 260 | 240 | 240 | 200 | 190 |
| Other | 0% | 50 | 50 | 50 | 50 | 50 | 50 | 50 | 50 | 50 | 50 | 50 | 50 |
| Total Unit Sales | 1,230 | 1,370 | 1,590 | 1,650 | 1,770 | 1,875 | 1,915 | 1,895 | 2,010 | 1,980 | 1,880 | 1,890 | |
| Unit Prices | Month 1 | Month 2 | Month 3 | Month 4 | Month 5 | Month 6 | Month 7 | Month 8 | Month 9 | Month 10 | Month 11 | Month 12 | |
| Salon | $55.00 | $55.00 | $55.00 | $55.00 | $55.00 | $55.00 | $55.00 | $55.00 | $55.00 | $55.00 | $55.00 | $55.00 | |
| Exercise/Therapy | $8.50 | $8.50 | $8.50 | $8.50 | $8.50 | $8.50 | $8.50 | $8.50 | $8.50 | $8.50 | $8.50 | $8.50 | |
| Spa | $45.00 | $45.00 | $45.00 | $45.00 | $45.00 | $45.00 | $45.00 | $45.00 | $45.00 | $45.00 | $45.00 | $45.00 | |
| Other | $10.00 | $10.00 | $10.00 | $10.00 | $10.00 | $10.00 | $10.00 | $10.00 | $10.00 | $10.00 | $10.00 | $10.00 | |
| Sales | |||||||||||||
| Salon | $8,800 | $11,550 | $14,300 | $16,500 | $16,500 | $15,125 | $15,950 | $17,050 | $15,950 | $16,500 | $15,400 | $16,500 | |
| Exercise/Therapy | $7,650 | $8,160 | $9,350 | $9,350 | $10,200 | $11,475 | $11,475 | $10,838 | $12,155 | $11,815 | $11,475 | $11,475 | |
| Spa | $5,400 | $6,750 | $8,100 | $9,000 | $9,900 | $9,000 | $10,125 | $11,700 | $10,800 | $10,800 | $9,000 | $8,550 | |
| Other | $500 | $500 | $500 | $500 | $500 | $500 | $500 | $500 | $500 | $500 | $500 | $500 | |
| Total Sales | $22,350 | $26,960 | $32,250 | $35,350 | $37,100 | $36,100 | $38,050 | $40,088 | $39,405 | $39,615 | $36,375 | $37,025 | |
| Direct Unit Costs | Month 1 | Month 2 | Month 3 | Month 4 | Month 5 | Month 6 | Month 7 | Month 8 | Month 9 | Month 10 | Month 11 | Month 12 | |
| Salon | 0.00% | $1.00 | $1.00 | $1.00 | $1.00 | $1.00 | $1.00 | $1.00 | $1.00 | $1.00 | $1.00 | $1.00 | $1.00 |
| Exercise/Therapy | 0.00% | $0.00 | $0.00 | $0.00 | $0.00 | $0.00 | $0.00 | $0.00 | $0.00 | $0.00 | $0.00 | $0.00 | $0.00 |
| Spa | 0.00% | $1.00 | $1.00 | $1.00 | $1.00 | $1.00 | $1.00 | $1.00 | $1.00 | $1.00 | $1.00 | $1.00 | $1.00 |
| Other | 0.00% | $3.00 | $3.00 | $3.00 | $3.00 | $3.00 | $3.00 | $3.00 | $3.00 | $3.00 | $3.00 | $3.00 | $3.00 |
| Direct Cost of Sales | |||||||||||||
| Salon | $160 | $210 | $260 | $300 | $300 | $275 | $290 | $310 | $290 | $300 | $280 | $300 | |
| Exercise/Therapy | $0 | $0 | $0 | $0 | $0 | $0 | $0 | $0 | $0 | $0 | $0 | $0 | |
| Spa | $120 | $150 | $180 | $200 | $220 | $200 | $225 | $260 | $240 | $240 | $200 | $190 | |
| Other | $150 | $150 | $150 | $150 | $150 | $150 | $150 | $150 | $150 | $150 | $150 | $150 | |
| Subtotal Direct Cost of Sales | $430 | $510 | $590 | $650 | $670 | $625 | $665 | $720 | $680 | $690 | $630 | $640 | |
| Personnel Plan | |||||||||||||
| Month 1 | Month 2 | Month 3 | Month 4 | Month 5 | Month 6 | Month 7 | Month 8 | Month 9 | Month 10 | Month 11 | Month 12 | ||
| Management | 0% | $20,000 | $20,000 | $20,000 | $20,000 | $20,000 | $20,000 | $20,000 | $20,000 | $20,000 | $20,000 | $20,000 | $20,000 |
| Salon | 0% | $2,560 | $2,560 | $2,560 | $2,560 | $2,560 | $2,560 | $2,560 | $2,560 | $2,560 | $2,560 | $2,560 | $2,560 |
| Spa | 0% | $2,560 | $2,560 | $2,560 | $2,560 | $2,560 | $2,560 | $2,560 | $2,560 | $2,560 | $2,560 | $2,560 | $2,560 |
| Health | 0% | $2,880 | $2,880 | $2,880 | $2,880 | $2,880 | $2,880 | $2,880 | $2,880 | $2,880 | $2,880 | $2,880 | $2,880 |
| Other | 0% | $0 | $0 | $0 | $0 | $0 | $0 | $0 | $0 | $0 | $0 | $0 | $0 |
| Total People | 11 | 11 | 11 | 11 | 11 | 11 | 11 | 11 | 11 | 11 | 11 | 11 | |
| Total Payroll | $28,000 | $28,000 | $28,000 | $28,000 | $28,000 | $28,000 | $28,000 | $28,000 | $28,000 | $28,000 | $28,000 | $28,000 | |
| General Assumptions | |||||||||||||
| Month 1 | Month 2 | Month 3 | Month 4 | Month 5 | Month 6 | Month 7 | Month 8 | Month 9 | Month 10 | Month 11 | Month 12 | ||
| Plan Month | 1 | 2 | 3 | 4 | 5 | 6 | 7 | 8 | 9 | 10 | 11 | 12 | |
| Current Interest Rate | 8.00% | 8.00% | 8.00% | 8.00% | 8.00% | 8.00% | 8.00% | 8.00% | 8.00% | 8.00% | 8.00% | 8.00% | |
| Long-term Interest Rate | 7.25% | 7.25% | 7.25% | 7.25% | 7.25% | 7.25% | 7.25% | 7.25% | 7.25% | 7.25% | 7.25% | 7.25% | |
| Tax Rate | 30.00% | 25.00% | 25.00% | 25.00% | 25.00% | 25.00% | 25.00% | 25.00% | 25.00% | 25.00% | 25.00% | 25.00% | |
| Other | 0 | 0 | 0 | 0 | 0 | 0 | 0 | 0 | 0 | 0 | 0 | 0 | |
| Pro Forma Profit and Loss | |||||||||||||
| Month 1 | Month 2 | Month 3 | Month 4 | Month 5 | Month 6 | Month 7 | Month 8 | Month 9 | Month 10 | Month 11 | Month 12 | ||
| Sales | $22,350 | $26,960 | $32,250 | $35,350 | $37,100 | $36,100 | $38,050 | $40,088 | $39,405 | $39,615 | $36,375 | $37,025 | |
| Direct Cost of Sales | $430 | $510 | $590 | $650 | $670 | $625 | $665 | $720 | $680 | $690 | $630 | $640 | |
| Other | $0 | $0 | $0 | $0 | $0 | $0 | $0 | $0 | $0 | $0 | $0 | $0 | |
| Total Cost of Sales | $430 | $510 | $590 | $650 | $670 | $625 | $665 | $720 | $680 | $690 | $630 | $640 | |
| Gross Margin | $21,920 | $26,450 | $31,660 | $34,700 | $36,430 | $35,475 | $37,385 | $39,368 | $38,725 | $38,925 | $35,745 | $36,385 | |
| Gross Margin % | 98.08% | 98.11% | 98.17% | 98.16% | 98.19% | 98.27% | 98.25% | 98.20% | 98.27% | 98.26% | 98.27% | 98.27% | |
| Expenses | |||||||||||||
| Payroll | $28,000 | $28,000 | $28,000 | $28,000 | $28,000 | $28,000 | $28,000 | $28,000 | $28,000 | $28,000 | $28,000 | $28,000 | |
| Sales and Marketing and Other Expenses | $5,000 | $6,070 | $6,700 | $6,750 | $9,250 | $9,250 | $9,250 | $9,250 | $9,250 | $9,250 | $9,250 | $9,250 | |
| Depreciation | $0 | $0 | $0 | $0 | $0 | $0 | $0 | $0 | $0 | $0 | $0 | $0 | |
| Leased Equipment | $0 | $0 | $0 | $0 | $0 | $0 | $0 | $0 | $0 | $0 | $0 | $0 | |
| Utilities | $2,500 | $3,300 | $3,700 | $3,800 | $3,400 | $2,800 | $3,200 | $3,700 | $3,600 | $3,600 | $3,400 | $3,200 | |
| Insurance | $1,000 | $1,000 | $1,000 | $1,000 | $1,000 | $1,000 | $1,000 | $1,000 | $1,000 | $1,000 | $1,000 | $1,000 | |
| Rent | $4,500 | $4,500 | $4,500 | $4,500 | $4,500 | $4,500 | $4,500 | $4,500 | $4,500 | $4,500 | $4,500 | $4,500 | |
| Payroll Taxes | 25% | $7,000 | $7,000 | $7,000 | $7,000 | $7,000 | $7,000 | $7,000 | $7,000 | $7,000 | $7,000 | $7,000 | $7,000 |
| Other | $0 | $0 | $0 | $0 | $0 | $0 | $0 | $0 | $0 | $0 | $0 | $0 | |
| Total Operating Expenses | $48,000 | $49,870 | $50,900 | $51,050 | $53,150 | $52,550 | $52,950 | $53,450 | $53,350 | $53,350 | $53,150 | $52,950 | |
| Profit Before Interest and Taxes | ($26,080) | ($23,420) | ($19,240) | ($16,350) | ($16,720) | ($17,075) | ($15,565) | ($14,083) | ($14,625) | ($14,425) | ($17,405) | ($16,565) | |
| EBITDA | ($26,080) | ($23,420) | ($19,240) | ($16,350) | ($16,720) | ($17,075) | ($15,565) | ($14,083) | ($14,625) | ($14,425) | ($17,405) | ($16,565) | |
| Interest Expense | $0 | $0 | $0 | $0 | $0 | $0 | $0 | $0 | $0 | $0 | $0 | $0 | |
| Taxes Incurred | $0 | $0 | $0 | $0 | $0 | $0 | $0 | $0 | $0 | $0 | $0 | $0 | |
| Net Profit | ($26,080) | ($23,420) | ($19,240) | ($16,350) | ($16,720) | ($17,075) | ($15,565) | ($14,083) | ($14,625) | ($14,425) | ($17,405) | ($16,565) | |
| Net Profit/Sales | -116.69% | -86.87% | -59.66% | -46.25% | -45.07% | -47.30% | -40.91% | -35.13% | -37.11% | -36.41% | -47.85% | -44.74% | |
| Pro Forma Cash Flow | |||||||||||||
| Month 1 | Month 2 | Month 3 | Month 4 | Month 5 | Month 6 | Month 7 | Month 8 | Month 9 | Month 10 | Month 11 | Month 12 | ||
| Cash Received | |||||||||||||
| Cash from Operations | |||||||||||||
| Cash Sales | $22,350 | $26,960 | $32,250 | $35,350 | $37,100 | $36,100 | $38,050 | $40,088 | $39,405 | $39,615 | $36,375 | $37,025 | |
| Subtotal Cash from Operations | $22,350 | $26,960 | $32,250 | $35,350 | $37,100 | $36,100 | $38,050 | $40,088 | $39,405 | $39,615 | $36,375 | $37,025 | |
| Additional Cash Received | |||||||||||||
| Sales Tax, VAT, HST/GST Received | 0.00% | $0 | $0 | $0 | $0 | $0 | $0 | $0 | $0 | $0 | $0 | $0 | $0 |
| New Current Borrowing | $0 | $0 | $0 | $0 | $0 | $0 | $0 | $0 | $0 | $0 | $0 | $0 | |
| New Other Liabilities (interest-free) | $0 | $0 | $0 | $0 | $0 | $0 | $0 | $0 | $0 | $0 | $0 | $0 | |
| New Long-term Liabilities | $0 | $0 | $0 | $0 | $0 | $0 | $0 | $0 | $0 | $0 | $0 | $0 | |
| Sales of Other Current Assets | $0 | $0 | $0 | $0 | $0 | $0 | $0 | $0 | $0 | $0 | $0 | $0 | |
| Sales of Long-term Assets | $0 | $0 | $0 | $0 | $0 | $0 | $0 | $0 | $0 | $0 | $0 | $0 | |
| New Investment Received | $0 | $0 | $0 | $0 | $0 | $0 | $0 | $0 | $0 | $0 | $0 | $0 | |
| Subtotal Cash Received | $22,350 | $26,960 | $32,250 | $35,350 | $37,100 | $36,100 | $38,050 | $40,088 | $39,405 | $39,615 | $36,375 | $37,025 | |
| Expenditures | Month 1 | Month 2 | Month 3 | Month 4 | Month 5 | Month 6 | Month 7 | Month 8 | Month 9 | Month 10 | Month 11 | Month 12 | |
| Expenditures from Operations | |||||||||||||
| Cash Spending | $28,000 | $28,000 | $28,000 | $28,000 | $28,000 | $28,000 | $28,000 | $28,000 | $28,000 | $28,000 | $28,000 | $28,000 | |
| Bill Payments | $5,667 | $20,062 | $21,904 | $22,905 | $23,120 | $25,130 | $24,563 | $25,000 | $26,447 | $26,317 | $25,377 | $26,143 | |
| Subtotal Spent on Operations | $33,667 | $48,062 | $49,904 | $50,905 | $51,120 | $53,130 | $52,563 | $53,000 | $54,447 | $54,317 | $53,377 | $54,143 | |
| Additional Cash Spent | |||||||||||||
| Sales Tax, VAT, HST/GST Paid Out | $0 | $0 | $0 | $0 | $0 | $0 | $0 | $0 | $0 | $0 | $0 | $0 | |
| Principal Repayment of Current Borrowing | $0 | $0 | $0 | $0 | $0 | $0 | $0 | $0 | $0 | $0 | $0 | $0 | |
| Other Liabilities Principal Repayment | $0 | $0 | $0 | $0 | $0 | $0 | $0 | $0 | $0 | $0 | $0 | $0 | |
| Long-term Liabilities Principal Repayment | $0 | $0 | $0 | $0 | $0 | $0 | $0 | $0 | $0 | $0 | $0 | $0 | |
| Purchase Other Current Assets | $0 | $0 | $0 | $0 | $0 | $0 | $0 | $0 | $0 | $0 | $0 | $0 | |
| Purchase Long-term Assets | $0 | $0 | $0 | $0 | $0 | $0 | $0 | $0 | $0 | $0 | $0 | $0 | |
| Dividends | $0 | $0 | $0 | $0 | $0 | $0 | $0 | $0 | $0 | $0 | $0 | $0 | |
| Subtotal Cash Spent | $33,667 | $48,062 | $49,904 | $50,905 | $51,120 | $53,130 | $52,563 | $53,000 | $54,447 | $54,317 | $53,377 | $54,143 | |
| Net Cash Flow | ($11,317) | ($21,102) | ($17,654) | ($15,555) | ($14,020) | ($17,030) | ($14,513) | ($12,913) | ($15,042) | ($14,702) | ($17,002) | ($17,118) | |
| Cash Balance | $488,683 | $467,581 | $449,927 | $434,372 | $420,352 | $403,322 | $388,808 | $375,896 | $360,854 | $346,153 | $329,151 | $312,033 | |
| Pro Forma Balance Sheet | |||||||||||||
| Month 1 | Month 2 | Month 3 | Month 4 | Month 5 | Month 6 | Month 7 | Month 8 | Month 9 | Month 10 | Month 11 | Month 12 | ||
| Assets | Starting Balances | ||||||||||||
| Current Assets | |||||||||||||
| Cash | $500,000 | $488,683 | $467,581 | $449,927 | $434,372 | $420,352 | $403,322 | $388,808 | $375,896 | $360,854 | $346,153 | $329,151 | $312,033 |
| Inventory | $5,000 | $4,570 | $4,060 | $3,470 | $2,820 | $2,150 | $1,525 | $860 | $1,140 | $1,460 | $770 | $1,140 | $1,500 |
| Other Current Assets | $75,000 | $75,000 | $75,000 | $75,000 | $75,000 | $75,000 | $75,000 | $75,000 | $75,000 | $75,000 | $75,000 | $75,000 | $75,000 |
| Total Current Assets | $580,000 | $568,253 | $546,641 | $528,397 | $512,192 | $497,502 | $479,847 | $464,668 | $452,036 | $437,314 | $421,923 | $405,291 | $388,533 |
| Long-term Assets | |||||||||||||
| Long-term Assets | $0 | $0 | $0 | $0 | $0 | $0 | $0 | $0 | $0 | $0 | $0 | $0 | $0 |
| Accumulated Depreciation | $0 | $0 | $0 | $0 | $0 | $0 | $0 | $0 | $0 | $0 | $0 | $0 | $0 |
| Total Long-term Assets | $0 | $0 | $0 | $0 | $0 | $0 | $0 | $0 | $0 | $0 | $0 | $0 | $0 |
| Total Assets | $580,000 | $568,253 | $546,641 | $528,397 | $512,192 | $497,502 | $479,847 | $464,668 | $452,036 | $437,314 | $421,923 | $405,291 | $388,533 |
| Liabilities and Capital | Month 1 | Month 2 | Month 3 | Month 4 | Month 5 | Month 6 | Month 7 | Month 8 | Month 9 | Month 10 | Month 11 | Month 12 | |
| Current Liabilities | |||||||||||||
| Accounts Payable | $5,000 | $19,333 | $21,141 | $22,137 | $22,282 | $24,312 | $23,732 | $24,118 | $25,568 | $25,472 | $24,505 | $25,278 | $25,085 |
| Current Borrowing | $0 | $0 | $0 | $0 | $0 | $0 | $0 | $0 | $0 | $0 | $0 | $0 | $0 |
| Other Current Liabilities | $0 | $0 | $0 | $0 | $0 | $0 | $0 | $0 | $0 | $0 | $0 | $0 | $0 |
| Subtotal Current Liabilities | $5,000 | $19,333 | $21,141 | $22,137 | $22,282 | $24,312 | $23,732 | $24,118 | $25,568 | $25,472 | $24,505 | $25,278 | $25,085 |
| Long-term Liabilities | $0 | $0 | $0 | $0 | $0 | $0 | $0 | $0 | $0 | $0 | $0 | $0 | $0 |
| Total Liabilities | $5,000 | $19,333 | $21,141 | $22,137 | $22,282 | $24,312 | $23,732 | $24,118 | $25,568 | $25,472 | $24,505 | $25,278 | $25,085 |
| Paid-in Capital | $600,000 | $600,000 | $600,000 | $600,000 | $600,000 | $600,000 | $600,000 | $600,000 | $600,000 | $600,000 | $600,000 | $600,000 | $600,000 |
| Retained Earnings | ($25,000) | ($25,000) | ($25,000) | ($25,000) | ($25,000) | ($25,000) | ($25,000) | ($25,000) | ($25,000) | ($25,000) | ($25,000) | ($25,000) | ($25,000) |
| Earnings | $0 | ($26,080) | ($49,500) | ($68,740) | ($85,090) | ($101,810) | ($118,885) | ($134,450) | ($148,533) | ($163,158) | ($177,583) | ($194,988) | ($211,553) |
| Total Capital | $575,000 | $548,920 | $525,500 | $506,260 | $489,910 | $473,190 | $456,115 | $440,550 | $426,468 | $411,843 | $397,418 | $380,013 | $363,448 |
| Total Liabilities and Capital | $580,000 | $568,253 | $546,641 | $528,397 | $512,192 | $497,502 | $479,847 | $464,668 | $452,036 | $437,314 | $421,923 | $405,291 | $388,533 |
| Net Worth | $575,000 | $548,920 | $525,500 | $506,260 | $489,910 | $473,190 | $456,115 | $440,550 | $426,468 | $411,843 | $397,418 | $380,012 | $363,448 |


