
Sun Heat
Executive Summary
Sun Heat is a start-up company registered in California offering solar home water heating systems lead by Sara Clark.
The Market
The market for solar heating is huge in Southern California where they get over 245 days of sun a year. Sun Heat has identified two distinct market segments that they will market their products to. The first segment is the DIY segment of individuals. The second segment is people that will utilize a skilled installer to have the system implemented at their home. The DIY segment has an annual growth rate of 9% and 3.9 million potential customers. The professional install market has a 8% annual growth rate and 2.7 million possible customers.
The Products
Sun Heat will sell two different versions of a solar home water heating system: a do-it-yourself system and a unit installed by a licensed installer. Both groups are cost conscious and environmentally aware.
Sun Heat’s system can save the individual family from 70%-90% of the total amount spent on the electricity used for heating water.
Management
Sun Heat is being lead by Sara Clark who has the education and experience to execute on this proven business model. Sara has an undergraduate degree in environmental studies and Masters degrees in engineering and business administration. Sales are forecasted to grow substantially in year two and year three. Net profit will be correspondingly growing for years two and three.

1.1 Objectives
- To become the premier manufacturer of solar based water heating systems.
- To quickly gain market penetration within the first three years.
- To develop a customer-centric organization based on cutting edge technology.
1.2 Mission
Sun Heat’s mission is to become the premier solar water heater company offering the highest quality products and customer service while saving customers money and making positive contributions to our environment.
1.3 Keys to Success
Sun Heat has identified three keys to success that help the company grow into a mature market leader:
- Providing cutting edge, reliable, and simple-to-install and maintain solar water heating systems.
- Broadening the market of solar heating into a mainstream energy source.
- Designing and implementing strict financial controls.
Company Summary
Sun Heat has been formed as a California registered Corporation. The main shareholder is Sara Clark.
2.1 Company Ownership
Sun Heat has been established as a CA corporation. The main shareholder is Sara Clark, Founder and President.
2.2 Start-up Summary
Sun Heat will require the following items for start up of the business:
- Computer system- the required components of this system include seven terminals, four laster printers, one central server, broadband Internet connections, and Microsoft Office for all computers, two ACT! licenses, and two QuickBooks Pro licenses.
- Laptop computer and LCD projector.
- Website development.
- Office furniture including desks, cabinets and chairs for seven stations.
- Waiting room furniture.
- Eight extension telephone system including a hardware-based voice mail system.
- Three large white boards.
- Sales room promotional displays.
- Fax machine and copier.
- Racks and shelving for the warehouse.
- Forklift.
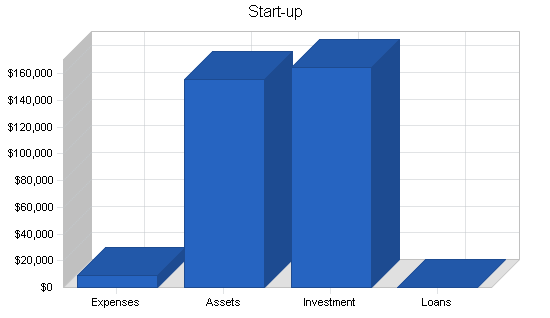
| Start-up Funding | |
| Start-up Expenses to Fund | $9,000 |
| Start-up Assets to Fund | $156,000 |
| Total Funding Required | $165,000 |
| Assets | |
| Non-cash Assets from Start-up | $62,000 |
| Cash Requirements from Start-up | $94,000 |
| Additional Cash Raised | $0 |
| Cash Balance on Starting Date | $94,000 |
| Total Assets | $156,000 |
| Liabilities and Capital | |
| Liabilities | |
| Current Borrowing | $0 |
| Long-term Liabilities | $0 |
| Accounts Payable (Outstanding Bills) | $0 |
| Other Current Liabilities (interest-free) | $0 |
| Total Liabilities | $0 |
| Capital | |
| Planned Investment | |
| Investor 1 | $60,000 |
| Investor 2 | $55,000 |
| Other | $50,000 |
| Additional Investment Requirement | $0 |
| Total Planned Investment | $165,000 |
| Loss at Start-up (Start-up Expenses) | ($9,000) |
| Total Capital | $156,000 |
| Total Capital and Liabilities | $156,000 |
| Total Funding | $165,000 |
| Start-up | |
| Requirements | |
| Start-up Expenses | |
| Legal | $4,000 |
| Stationery etc. | $1,000 |
| Brochures | $1,000 |
| Consultants | $2,000 |
| Insurance | $1,000 |
| Total Start-up Expenses | $9,000 |
| Start-up Assets | |
| Cash Required | $94,000 |
| Other Current Assets | $0 |
| Long-term Assets | $62,000 |
| Total Assets | $156,000 |
| Total Requirements | $165,000 |
Products
Sun Heat will sell two versions of a solar home water heating system. One will be a unit sold as a do-it-yourself model. The second model is sold as a unit to be installed by a licensed installer. By providing two models, Sun Heat will appeal to two different customer segments, one that likes the challenge of projects and has the skills to execute the plans, and people who desire a solar heating system but have no desire or skills to install it themselves.
The sun is the planet’s most powerful source of energy and also the most unused source of energy by humans. Solar power is a clean, environmentally friendly source of energy. It is renewable meaning it is impossible to consume the energy at a faster rate than it takes to replenish it for future users. There are no toxic by products or emissions. Sun Heat is an effective system that harnesses the sun’s energy for family water heating needs.
Solar water heating systems are in high demand. Typically 30%-40% of a family’s electricity bill is devoted to devoted water. Sun Heat’s system can save the individual family from 70%-90% of the total amount spent on the electricity used for heating water. The system generally meets all of the summer time heating needs. During times of decreased sunlight, the system will preheat the water then bring it up to temperature by the conventional water heating system all ready in place.
The Sun Heat system is designed for single family dwellings. The Sun Heat system consists of a solar collector, a large storage container, a pump, and different valves throughout the system. This system is an open loop set up. The plumbing from the storage tank to the collectors is affected by city water pressure, it is “on the grid.” A closed system would not be connected to city water and heat exchangers would be needed, increasing complexity and cost while decreasing efficiency.
Usually solar collectors or solar panels are located on the roof of the house. To get the full benefit of a solar heater there must be an area available that has sufficient exposure to the sun. The facing angle may be in any direction within 30 degrees of due south. The panels have insulated tubes within the collectors that heat the water. A pump moves hot water from the collectors to the storage tank and moves cold water into the collectors for heating. Several valves are used as safeguards within the system. A pressure and temperature relief valve is located near the steam vent. If a system or power failure occurs this valve protects against overheating inside the solar panels which could cause damage. Safety relief valves are located throughout the system to protect it should other components fail.
Sun Heat’s products are manufactured by a large industry supplier and shipped to the Sun Heat factory for partial assembly. With this procurement/manufacturing method, Sun Heat is able to minimize large capital expenditures for manufacturing while being able to offer high quality products.
Sun Heat provides a five year warranty on their products against manufacturer’s defects. Five years is the industry standard. Additionally, Sun Heat will require all of their licensed installers to offer an 18-month warranty on the installation labor. This requirement ensures that Sun Heat products are installed properly and minimizes the risk of decreasing brand equity due to faulty installation.
Market Analysis Summary
Sun Heat has identified two distinct market segments for marketing their products. The first segment is the “DIY” segment of handy individuals. The second is the “Convenience” segment that will utilize a skilled installer to have the system installed at their home. The solar water heating industry is reasonably diverse. There are some companies that sell kits that must be assembled and then installed by the individual. There are other companies that only sell professional installed systems. Some companies sell solar water heaters specifically for swimming pools, others market their products for households.

4.1 Market Segmentation
Sun Heat has identified two market segments to target.
DIY
These people do a lot of repairs and upgrades on their home. They have lots of building and repair skills and like to tackle projects while learning new skills. This customer segment has a variety of motivations for do-it-yourself work. One motivation is saving money. Another is the satisfaction of completing the project on their own. Additionally, customizing the project may be appealing. Some demographic information of this group includes:
- Age 29-56.
- Primarily male.
- Married with at least one child at home.
- Household income ranges from $50,000-$80,000.
- 73% have an undergraduate degree.
- Undertake at least one project every three months.
- Spend $250-$3000 per year on assorted projects at home stores such as Lowes or Home Depot.
Convenience
This segment is looking for the advantages of a solar based water heating system without the challenge of installation. They appreciate the value of the solar heating system. This group recognizes the environmental and/or economic benefits of solar water heating and will choose a professional installer. Demographic information is as follows:
- Ages 35-65.
- Married with at least one child at home.
- Household incomes of $62,000-$110,000.
- 79% have an undergraduate degree.
- 27% have a graduate degree or post undergraduate coursework.
- Have paid a contractor to carry out at least one home improvement project within the last 12 months.
Market Channels
Sun Heat will be be sold through several channels:
- DIY Retailers: This channel purchases Sun Heat products in quantity and then resells them to individuals to install.
- Professional Installers: This channel is comprised of approved Sun Heat installers.

| Market Analysis | |||||||
| Year 1 | Year 2 | Year 3 | Year 4 | Year 5 | |||
| Potential Customers | Growth | CAGR | |||||
| DIY | 9% | 3,968,987 | 4,326,196 | 4,715,554 | 5,139,954 | 5,602,550 | 9.00% |
| Convenience | 8% | 2,789,254 | 3,012,394 | 3,253,386 | 3,513,657 | 3,794,750 | 8.00% |
| Total | 8.59% | 6,758,241 | 7,338,590 | 7,968,940 | 8,653,611 | 9,397,300 | 8.59% |
4.2 Target Market Segment Strategy
Sun Heat has decided to concentrate on these two market segments for several reasons. One reason is the lack of high quality products currently available to the DIY crowd. Another is the sheer size of the do-it-yourself market. This segment participates within the $23 billion DIY home improvement market and within the last six years has grown at double digit rates largely fueled by the Internet making information available to assist do-it-yourselfers in completing home improvement projects. The increase in size and activity within the available market makes it particularly attractive.
The new wave of environmentalism provides another reason of targeting these two market segments. More and more people want to reduce their negative impact on the environment and solar hot water heating is an easy and economical way to do it.
4.3 Industry Analysis
The industry is composed of many different manufacturers of solar water heating components and systems. Some companies operate serving the industrial market, others serve the residential market. There are several companies that make components they sell to different assemblers. There are other companies that make all the components for their systems in-house. Some solar heating systems are complex using computers to make adjustments such as the angle of the collectors based on the sun’s position. Others systems are quite basic. It is interesting to note that almost no one competes within different markets, each company has chosen a different niche and sticks with that one alone. To be noted in section 5.1 is part of Sun Heat’s competitive edge, serving two markets. This makes perfect sense since the products for the two markets are quite similar.
4.3.1 Competition and Buying Patterns
Sun Heat has several competitors. Its main competition comes from:
- Mega Sun: This is a Helioakami company. Their products are good but because they are made in the EU (Greece) shipping and manufacturing costs make their prices less competitive.
- Solar Energy Systems: This company, based in CA manufactures very basic, do-it-yourself systems. Their products are noticeably cheaper but are of poor quality with few features.
- Shell Solar: This is a high end manufacturer pioneering the use of copper to increase efficiency. While their product is more efficient, the cost of copper makes their products too expensive for much of Sun Heat’s target market.
- Imagination Solar: A simple but inefficient DIY system.
- Go Solar Company: This company currently manufactures solar electric systems but will be releasing a solar water heating system within the next 11 months.
The buying patterns of customers is as follows:
- DIY: These customers will typically go into a Lowes or Home Depot and solicit the advice of the floor sales agents.
- Professional Installs: These customers typically rely on word of mouth or advice from their contractors.
Strategy and Implementation Summary
Sun Heat has two competitive edges to gain market penetration. The first is the ability to serve both the DIY and the professional install market. No competitors do that. The quality of Sun Heat’s systems will also allow the company to expand market penetration. Marketing will be focused on education about the environmental and economic benefits of installing a solar water heating system
5.1 Competitive Edge
Sun Heat has two competitive edges that will distinguish them from the competition. First, Sun serves both the DIY market and the professional install market. This is a competitive edge because Sun Heat can reconfigure one product for both market segments, immediately increasing the number of potential customers, at minimal costs to Sun Heat. The equipment is the same with minor changes to packaging and installation instructions. The DIY system will also include some tools.
The second competitive edge, related to the first is the benchmark level of product quality for the DIY customers. By serving the two markets and meeting the need of a high quality product for professional install segment, Sun Heat is able to then offer the same high quality product to the DIY segment. Currently, Sun Heat competitors only offer DIYers very basic models whose quality does not approach Sun Heat’s.
5.2 Marketing Strategy
Sun Heat’s marketing campaign focuses on raising awareness about the environmental and economic benefits of having a solar-based water heating system. Environmental benefits include using a renewable resource and no toxic discharge or emissions, thus allowing individuals to make serious commitments to the Earth. Customers will also enjoy the economic savings afforded by a solar water heating system.
Sun Heat’s marketing will focus on advertising and trade shows. In each of these venues they will target the DIY and professional install markets along with retailers carrying Sun Heat products. In addition, Sun Heat will develop relationships with utilities in an attempt to offer rebates or other financial incentives for utility customers using the alternative energy source.
5.3 Sales Strategy
The two-part sales strategy addresses each customer segment. As mentioned in the previous section, to reach the DIY segment, Sun Heat will work with retailers selling DIY units to inform them about the product and its superiority to the competition. Retailers sell the DIY units, it is important to have good relationships with them and to support them with as much information and resources as possible.
Sun Heat is in the process of developing a licensing program to address the professional install market segment. This program includes product information, installation training and certification of installers. The licensing program is the foundation of the relationship between installers and Sun Heat. To support this relationship, Sun Heat assigns each installer an account executive for technical support. By offering this unmatched assistance, installers will more readily recommend Sun Heat, thereby driving sales.
For the professional install market, participation in trade shows will be the first step in the relationship between Sun Heat and the installer. In order to develop a strong network of installers, Sun Heat will offer an excellent margin system to installers using Sun Heat units. The margin will be similar to the margin that Sun Heat offers the DIY retailers, so for every sale that the installer makes, he makes a commission as well as revenue from the installation. This system provides the installer with an incentive to recommend Sun Heat over the competition. Installers will be sold the product on credit with enough time for them to collect from their customer before paying Sun Heat. Promotions will be used to help generate sales and will typically occur during the trade shows, giving Sun Heat an opportunity when they are face to face with the installer. High quality sales literature will be passed out to each customer segment illustrating the superior quality of Sun Heat products.
5.3.1 Sales Forecast
As a start up organization, sales will increase in a slow but steady fashion. Sun Heat has adopted a conservative sales forecast to increase the likelihood of reaching the goals. Please review the following table which provides detailed sales information by month for the first year and yearly forecasts for the following two years. Following the table are two graphs, one for sales by month, the other is sales by year.


| Sales Forecast | |||
| Year 1 | Year 2 | Year 3 | |
| Sales | |||
| Professional install | $131,573 | $216,025 | $279,887 |
| DIY | $108,736 | $187,942 | $243,502 |
| Total Sales | $240,309 | $403,967 | $523,389 |
| Direct Cost of Sales | Year 1 | Year 2 | Year 3 |
| Professional install | $59,208 | $97,211 | $125,949 |
| DIY | $48,931 | $84,574 | $109,576 |
| Subtotal Direct Cost of Sales | $108,139 | $181,785 | $235,525 |
5.4 Milestones
Sun Heat has several milestones to use as goals for the organization. The following table details the pertinent information.

| Milestones | |||||
| Milestone | Start Date | End Date | Budget | Manager | Department |
| Completion of business plan | 1/1/2003 | 1/15/2003 | $0 | Sara | Marketing |
| First large DIY contract | 1/1/2003 | 4/30/2003 | $0 | Sales | Department |
| Revenue exceeding $200K | 1/1/2003 | 11/1/2003 | $0 | Sales | Department |
| Profitability | 1/1/2003 | 3/1/2004 | $0 | Sara | Department |
| Totals | $0 | ||||
Web Plan Summary
Sun Heat will create a website to distribute product information. This will be an efficient source of disbursement since once the site is complete, maintenance costs are low and the site can serve a large number of potential users. The site also will be a source of technical information for current owners Sun Heat units.
6.1 Website Marketing Strategy
The marketing and sales department will be instructed to rely heavily on the website as a clearinghouse for information about Sun Heat products. Energy saving estimates, technical requirements, installations guidelines as well as product comparisons will be available. All printed materials will refer to the website as an information source. Sun Heat recognizes the value of the website and will promote it accordingly.
6.2 Development Requirements
Sun Heat has identified a programmer (after reviewing their portfolio) who has the time, technical skills, and artistic vision to create Sun Heat’s site. The site will take four to six weeks to complete and then require bi-monthly updates.
Management Summary
Sara Clark will lead Sun Heat. Sara has undergraduate degrees in environmental studies and Masters in engineering and business administration. While pursuing this degree, Sara worked with a photovoltaic manufacturer, she worked on a team and took an idea of a solar panel for charging cellular batteries from the conceptual stage to the sales stage.
7.1 Personnel Plan
- Sara: product design, component procurement, business development, marketing/sales, high level accounting.
- Sales (2): set up licensing program, installer support, retail resellers sales and support, as well as direct sales.
- Warehouse (2): inventory, sales fulfillment.
- Customer support (1): all aspects of customer service.
- Bookkeeper (1): this person will be responsible for accounts payable/receivable as well as some HR functions.
| Personnel Plan | |||
| Year 1 | Year 2 | Year 3 | |
| Sara | $24,000 | $30,000 | $36,000 |
| Sales | $22,000 | $24,000 | $26,000 |
| Sales | $18,000 | $24,000 | $26,000 |
| Warehouse | $14,300 | $15,600 | $15,600 |
| Warehouse | $11,700 | $15,600 | $15,600 |
| Customer service | $13,000 | $15,600 | $15,600 |
| Bookkeeper/ HR | $15,400 | $16,800 | $16,800 |
| Total People | 7 | 7 | 7 |
| Total Payroll | $118,400 | $141,600 | $151,600 |
Financial Plan
The following sections will outline important financial information.
8.1 Important Assumptions
The following table details important Financial Assumptions.
| General Assumptions | |||
| Year 1 | Year 2 | Year 3 | |
| Plan Month | 1 | 2 | 3 |
| Current Interest Rate | 10.00% | 10.00% | 10.00% |
| Long-term Interest Rate | 10.00% | 10.00% | 10.00% |
| Tax Rate | 30.00% | 30.00% | 30.00% |
| Other | 0 | 0 | 0 |
8.2 Break-even Analysis
The Break-even Analysis indicates what will be needed in monthly revenue to reach the break-even point.

| Break-even Analysis | |
| Monthly Revenue Break-even | $29,872 |
| Assumptions: | |
| Average Percent Variable Cost | 45% |
| Estimated Monthly Fixed Cost | $16,430 |
8.3 Projected Profit and Loss
The following table will indicate Projected Profit and Loss.


| Pro Forma Profit and Loss | |||
| Year 1 | Year 2 | Year 3 | |
| Sales | $240,309 | $403,967 | $523,389 |
| Direct Cost of Sales | $108,139 | $181,785 | $235,525 |
| Other Costs of Goods | $0 | $0 | $0 |
| Total Cost of Sales | $108,139 | $181,785 | $235,525 |
| Gross Margin | $132,170 | $222,182 | $287,864 |
| Gross Margin % | 55.00% | 55.00% | 55.00% |
| Expenses | |||
| Payroll | $118,400 | $141,600 | $151,600 |
| Sales and Marketing and Other Expenses | $5,400 | $5,400 | $5,400 |
| Depreciation | $12,396 | $1,033 | $1,033 |
| Rent | $24,000 | $25,000 | $26,000 |
| Utilities | $9,000 | $750 | $750 |
| Insurance | $7,800 | $7,800 | $7,800 |
| Payroll Taxes | $17,760 | $21,240 | $22,740 |
| Other | $2,400 | $2,400 | $2,400 |
| Total Operating Expenses | $197,156 | $205,223 | $217,723 |
| Profit Before Interest and Taxes | ($64,986) | $16,959 | $70,141 |
| EBITDA | ($52,590) | $17,992 | $71,174 |
| Interest Expense | $0 | $0 | $0 |
| Taxes Incurred | $0 | $5,088 | $21,042 |
| Net Profit | ($64,986) | $11,871 | $49,099 |
| Net Profit/Sales | -27.04% | 2.94% | 9.38% |
8.4 Projected Cash Flow
The following chart and table will indicate Projected Cash Flow.

| Pro Forma Cash Flow | |||
| Year 1 | Year 2 | Year 3 | |
| Cash Received | |||
| Cash from Operations | |||
| Cash Sales | $60,077 | $100,992 | $130,847 |
| Cash from Receivables | $136,262 | $273,031 | $370,691 |
| Subtotal Cash from Operations | $196,340 | $374,022 | $501,538 |
| Additional Cash Received | |||
| Sales Tax, VAT, HST/GST Received | $0 | $0 | $0 |
| New Current Borrowing | $0 | $0 | $0 |
| New Other Liabilities (interest-free) | $0 | $0 | $0 |
| New Long-term Liabilities | $0 | $0 | $0 |
| Sales of Other Current Assets | $0 | $0 | $0 |
| Sales of Long-term Assets | $0 | $0 | $0 |
| New Investment Received | $0 | $0 | $0 |
| Subtotal Cash Received | $196,340 | $374,022 | $501,538 |
| Expenditures | Year 1 | Year 2 | Year 3 |
| Expenditures from Operations | |||
| Cash Spending | $118,400 | $141,600 | $151,600 |
| Bill Payments | $155,929 | $247,529 | $315,723 |
| Subtotal Spent on Operations | $274,329 | $389,129 | $467,323 |
| Additional Cash Spent | |||
| Sales Tax, VAT, HST/GST Paid Out | $0 | $0 | $0 |
| Principal Repayment of Current Borrowing | $0 | $0 | $0 |
| Other Liabilities Principal Repayment | $0 | $0 | $0 |
| Long-term Liabilities Principal Repayment | $0 | $0 | $0 |
| Purchase Other Current Assets | $0 | $0 | $0 |
| Purchase Long-term Assets | $0 | $0 | $0 |
| Dividends | $0 | $0 | $0 |
| Subtotal Cash Spent | $274,329 | $389,129 | $467,323 |
| Net Cash Flow | ($77,989) | ($15,107) | $34,215 |
| Cash Balance | $16,011 | $904 | $35,119 |
8.5 Projected Balance Sheet
The following table will indicate the Projected Balance Sheet.
| Pro Forma Balance Sheet | |||
| Year 1 | Year 2 | Year 3 | |
| Assets | |||
| Current Assets | |||
| Cash | $16,011 | $904 | $35,119 |
| Accounts Receivable | $43,969 | $73,914 | $95,765 |
| Other Current Assets | $0 | $0 | $0 |
| Total Current Assets | $59,980 | $74,818 | $130,883 |
| Long-term Assets | |||
| Long-term Assets | $62,000 | $62,000 | $62,000 |
| Accumulated Depreciation | $12,396 | $13,429 | $14,462 |
| Total Long-term Assets | $49,604 | $48,571 | $47,538 |
| Total Assets | $109,584 | $123,389 | $178,421 |
| Liabilities and Capital | Year 1 | Year 2 | Year 3 |
| Current Liabilities | |||
| Accounts Payable | $18,570 | $20,504 | $26,438 |
| Current Borrowing | $0 | $0 | $0 |
| Other Current Liabilities | $0 | $0 | $0 |
| Subtotal Current Liabilities | $18,570 | $20,504 | $26,438 |
| Long-term Liabilities | $0 | $0 | $0 |
| Total Liabilities | $18,570 | $20,504 | $26,438 |
| Paid-in Capital | $165,000 | $165,000 | $165,000 |
| Retained Earnings | ($9,000) | ($73,986) | ($62,115) |
| Earnings | ($64,986) | $11,871 | $49,099 |
| Total Capital | $91,014 | $102,885 | $151,984 |
| Total Liabilities and Capital | $109,584 | $123,389 | $178,421 |
| Net Worth | $91,014 | $102,885 | $151,984 |
8.6 Business Ratios
The following table details important Business Ratios specific to Sun Heat as well as industry ratios for the Other Electric Power Generation industry, NAICS code 221119.
| Ratio Analysis | ||||
| Year 1 | Year 2 | Year 3 | Industry Profile | |
| Sales Growth | 0.00% | 68.10% | 29.56% | 10.72% |
| Percent of Total Assets | ||||
| Accounts Receivable | 40.12% | 59.90% | 53.67% | 10.41% |
| Other Current Assets | 0.00% | 0.00% | 0.00% | 40.72% |
| Total Current Assets | 54.73% | 60.64% | 73.36% | 51.79% |
| Long-term Assets | 45.27% | 39.36% | 26.64% | 48.21% |
| Total Assets | 100.00% | 100.00% | 100.00% | 100.00% |
| Current Liabilities | 16.95% | 16.62% | 14.82% | 12.65% |
| Long-term Liabilities | 0.00% | 0.00% | 0.00% | 40.12% |
| Total Liabilities | 16.95% | 16.62% | 14.82% | 52.77% |
| Net Worth | 83.05% | 83.38% | 85.18% | 47.23% |
| Percent of Sales | ||||
| Sales | 100.00% | 100.00% | 100.00% | 100.00% |
| Gross Margin | 55.00% | 55.00% | 55.00% | 47.48% |
| Selling, General & Administrative Expenses | 82.04% | 52.06% | 45.62% | 13.69% |
| Advertising Expenses | 0.00% | 0.00% | 0.00% | 0.03% |
| Profit Before Interest and Taxes | -27.04% | 4.20% | 13.40% | 9.26% |
| Main Ratios | ||||
| Current | 3.23 | 3.65 | 4.95 | 2.10 |
| Quick | 3.23 | 3.65 | 4.95 | 1.69 |
| Total Debt to Total Assets | 16.95% | 16.62% | 14.82% | 60.03% |
| Pre-tax Return on Net Worth | -71.40% | 16.48% | 46.15% | 7.72% |
| Pre-tax Return on Assets | -59.30% | 13.74% | 39.31% | 19.31% |
| Additional Ratios | Year 1 | Year 2 | Year 3 | |
| Net Profit Margin | -27.04% | 2.94% | 9.38% | n.a |
| Return on Equity | -71.40% | 11.54% | 32.31% | n.a |
| Activity Ratios | ||||
| Accounts Receivable Turnover | 4.10 | 4.10 | 4.10 | n.a |
| Collection Days | 56 | 71 | 79 | n.a |
| Accounts Payable Turnover | 9.40 | 12.17 | 12.17 | n.a |
| Payment Days | 27 | 29 | 27 | n.a |
| Total Asset Turnover | 2.19 | 3.27 | 2.93 | n.a |
| Debt Ratios | ||||
| Debt to Net Worth | 0.20 | 0.20 | 0.17 | n.a |
| Current Liab. to Liab. | 1.00 | 1.00 | 1.00 | n.a |
| Liquidity Ratios | ||||
| Net Working Capital | $41,410 | $54,314 | $104,446 | n.a |
| Interest Coverage | 0.00 | 0.00 | 0.00 | n.a |
| Additional Ratios | ||||
| Assets to Sales | 0.46 | 0.31 | 0.34 | n.a |
| Current Debt/Total Assets | 17% | 17% | 15% | n.a |
| Acid Test | 0.86 | 0.04 | 1.33 | n.a |
| Sales/Net Worth | 2.64 | 3.93 | 3.44 | n.a |
| Dividend Payout | 0.00 | 0.00 | 0.00 | n.a |
Appendix
| Sales Forecast | |||||||||||||
| Month 1 | Month 2 | Month 3 | Month 4 | Month 5 | Month 6 | Month 7 | Month 8 | Month 9 | Month 10 | Month 11 | Month 12 | ||
| Sales | |||||||||||||
| Professional install | 0% | $0 | $0 | $6,589 | $9,854 | $11,454 | $13,545 | $13,989 | $14,022 | $14,585 | $15,655 | $15,878 | $16,002 |
| DIY | 0% | $0 | $0 | $0 | $8,573 | $9,965 | $11,784 | $12,170 | $12,199 | $12,689 | $13,620 | $13,814 | $13,922 |
| Total Sales | $0 | $0 | $6,589 | $18,427 | $21,419 | $25,329 | $26,159 | $26,221 | $27,274 | $29,275 | $29,692 | $29,924 | |
| Direct Cost of Sales | Month 1 | Month 2 | Month 3 | Month 4 | Month 5 | Month 6 | Month 7 | Month 8 | Month 9 | Month 10 | Month 11 | Month 12 | |
| Professional install | $0 | $0 | $2,965 | $4,434 | $5,154 | $6,095 | $6,295 | $6,310 | $6,563 | $7,045 | $7,145 | $7,201 | |
| DIY | $0 | $0 | $0 | $3,858 | $4,484 | $5,303 | $5,477 | $5,490 | $5,710 | $6,129 | $6,216 | $6,265 | |
| Subtotal Direct Cost of Sales | $0 | $0 | $2,965 | $8,292 | $9,639 | $11,398 | $11,772 | $11,800 | $12,273 | $13,174 | $13,361 | $13,466 | |
| Personnel Plan | |||||||||||||
| Month 1 | Month 2 | Month 3 | Month 4 | Month 5 | Month 6 | Month 7 | Month 8 | Month 9 | Month 10 | Month 11 | Month 12 | ||
| Sara | 0% | $2,000 | $2,000 | $2,000 | $2,000 | $2,000 | $2,000 | $2,000 | $2,000 | $2,000 | $2,000 | $2,000 | $2,000 |
| Sales | 0% | $0 | $2,000 | $2,000 | $2,000 | $2,000 | $2,000 | $2,000 | $2,000 | $2,000 | $2,000 | $2,000 | $2,000 |
| Sales | 0% | $0 | $0 | $0 | $2,000 | $2,000 | $2,000 | $2,000 | $2,000 | $2,000 | $2,000 | $2,000 | $2,000 |
| Warehouse | 0% | $0 | $1,300 | $1,300 | $1,300 | $1,300 | $1,300 | $1,300 | $1,300 | $1,300 | $1,300 | $1,300 | $1,300 |
| Warehouse | 0% | $0 | $0 | $0 | $1,300 | $1,300 | $1,300 | $1,300 | $1,300 | $1,300 | $1,300 | $1,300 | $1,300 |
| Customer service | 0% | $0 | $0 | $1,300 | $1,300 | $1,300 | $1,300 | $1,300 | $1,300 | $1,300 | $1,300 | $1,300 | $1,300 |
| Bookkeeper/ HR | 0% | $0 | $1,400 | $1,400 | $1,400 | $1,400 | $1,400 | $1,400 | $1,400 | $1,400 | $1,400 | $1,400 | $1,400 |
| Total People | 1 | 4 | 5 | 7 | 7 | 7 | 7 | 7 | 7 | 7 | 7 | 7 | |
| Total Payroll | $2,000 | $6,700 | $8,000 | $11,300 | $11,300 | $11,300 | $11,300 | $11,300 | $11,300 | $11,300 | $11,300 | $11,300 | |
| General Assumptions | |||||||||||||
| Month 1 | Month 2 | Month 3 | Month 4 | Month 5 | Month 6 | Month 7 | Month 8 | Month 9 | Month 10 | Month 11 | Month 12 | ||
| Plan Month | 1 | 2 | 3 | 4 | 5 | 6 | 7 | 8 | 9 | 10 | 11 | 12 | |
| Current Interest Rate | 10.00% | 10.00% | 10.00% | 10.00% | 10.00% | 10.00% | 10.00% | 10.00% | 10.00% | 10.00% | 10.00% | 10.00% | |
| Long-term Interest Rate | 10.00% | 10.00% | 10.00% | 10.00% | 10.00% | 10.00% | 10.00% | 10.00% | 10.00% | 10.00% | 10.00% | 10.00% | |
| Tax Rate | 30.00% | 30.00% | 30.00% | 30.00% | 30.00% | 30.00% | 30.00% | 30.00% | 30.00% | 30.00% | 30.00% | 30.00% | |
| Other | 0 | 0 | 0 | 0 | 0 | 0 | 0 | 0 | 0 | 0 | 0 | 0 | |
| Pro Forma Profit and Loss | |||||||||||||
| Month 1 | Month 2 | Month 3 | Month 4 | Month 5 | Month 6 | Month 7 | Month 8 | Month 9 | Month 10 | Month 11 | Month 12 | ||
| Sales | $0 | $0 | $6,589 | $18,427 | $21,419 | $25,329 | $26,159 | $26,221 | $27,274 | $29,275 | $29,692 | $29,924 | |
| Direct Cost of Sales | $0 | $0 | $2,965 | $8,292 | $9,639 | $11,398 | $11,772 | $11,800 | $12,273 | $13,174 | $13,361 | $13,466 | |
| Other Costs of Goods | $0 | $0 | $0 | $0 | $0 | $0 | $0 | $0 | $0 | $0 | $0 | $0 | |
| Total Cost of Sales | $0 | $0 | $2,965 | $8,292 | $9,639 | $11,398 | $11,772 | $11,800 | $12,273 | $13,174 | $13,361 | $13,466 | |
| Gross Margin | $0 | $0 | $3,624 | $10,135 | $11,780 | $13,931 | $14,388 | $14,422 | $15,001 | $16,101 | $16,331 | $16,458 | |
| Gross Margin % | 0.00% | 0.00% | 55.00% | 55.00% | 55.00% | 55.00% | 55.00% | 55.00% | 55.00% | 55.00% | 55.00% | 55.00% | |
| Expenses | |||||||||||||
| Payroll | $2,000 | $6,700 | $8,000 | $11,300 | $11,300 | $11,300 | $11,300 | $11,300 | $11,300 | $11,300 | $11,300 | $11,300 | |
| Sales and Marketing and Other Expenses | $450 | $450 | $450 | $450 | $450 | $450 | $450 | $450 | $450 | $450 | $450 | $450 | |
| Depreciation | $1,033 | $1,033 | $1,033 | $1,033 | $1,033 | $1,033 | $1,033 | $1,033 | $1,033 | $1,033 | $1,033 | $1,033 | |
| Rent | $2,000 | $2,000 | $2,000 | $2,000 | $2,000 | $2,000 | $2,000 | $2,000 | $2,000 | $2,000 | $2,000 | $2,000 | |
| Utilities | $750 | $750 | $750 | $750 | $750 | $750 | $750 | $750 | $750 | $750 | $750 | $750 | |
| Insurance | $650 | $650 | $650 | $650 | $650 | $650 | $650 | $650 | $650 | $650 | $650 | $650 | |
| Payroll Taxes | 15% | $300 | $1,005 | $1,200 | $1,695 | $1,695 | $1,695 | $1,695 | $1,695 | $1,695 | $1,695 | $1,695 | $1,695 |
| Other | $200 | $200 | $200 | $200 | $200 | $200 | $200 | $200 | $200 | $200 | $200 | $200 | |
| Total Operating Expenses | $7,383 | $12,788 | $14,283 | $18,078 | $18,078 | $18,078 | $18,078 | $18,078 | $18,078 | $18,078 | $18,078 | $18,078 | |
| Profit Before Interest and Taxes | ($7,383) | ($12,788) | ($10,659) | ($7,943) | ($6,298) | ($4,147) | ($3,690) | ($3,656) | ($3,077) | ($1,977) | ($1,747) | ($1,620) | |
| EBITDA | ($6,350) | ($11,755) | ($9,626) | ($6,910) | ($5,265) | ($3,114) | ($2,657) | ($2,623) | ($2,044) | ($944) | ($714) | ($587) | |
| Interest Expense | $0 | $0 | $0 | $0 | $0 | $0 | $0 | $0 | $0 | $0 | $0 | $0 | |
| Taxes Incurred | $0 | $0 | $0 | $0 | $0 | $0 | $0 | $0 | $0 | $0 | $0 | $0 | |
| Net Profit | ($7,383) | ($12,788) | ($10,659) | ($7,943) | ($6,298) | ($4,147) | ($3,690) | ($3,656) | ($3,077) | ($1,977) | ($1,747) | ($1,620) | |
| Net Profit/Sales | 0.00% | 0.00% | -161.77% | -43.11% | -29.40% | -16.37% | -14.11% | -13.94% | -11.28% | -6.75% | -5.89% | -5.41% | |
| Pro Forma Cash Flow | |||||||||||||
| Month 1 | Month 2 | Month 3 | Month 4 | Month 5 | Month 6 | Month 7 | Month 8 | Month 9 | Month 10 | Month 11 | Month 12 | ||
| Cash Received | |||||||||||||
| Cash from Operations | |||||||||||||
| Cash Sales | $0 | $0 | $1,647 | $4,607 | $5,355 | $6,332 | $6,540 | $6,555 | $6,818 | $7,319 | $7,423 | $7,481 | |
| Cash from Receivables | $0 | $0 | $0 | $165 | $5,238 | $13,895 | $16,162 | $19,018 | $19,621 | $19,692 | $20,505 | $21,967 | |
| Subtotal Cash from Operations | $0 | $0 | $1,647 | $4,771 | $10,592 | $20,227 | $22,702 | $25,573 | $26,440 | $27,011 | $27,928 | $29,447 | |
| Additional Cash Received | |||||||||||||
| Sales Tax, VAT, HST/GST Received | 0.00% | $0 | $0 | $0 | $0 | $0 | $0 | $0 | $0 | $0 | $0 | $0 | $0 |
| New Current Borrowing | $0 | $0 | $0 | $0 | $0 | $0 | $0 | $0 | $0 | $0 | $0 | $0 | |
| New Other Liabilities (interest-free) | $0 | $0 | $0 | $0 | $0 | $0 | $0 | $0 | $0 | $0 | $0 | $0 | |
| New Long-term Liabilities | $0 | $0 | $0 | $0 | $0 | $0 | $0 | $0 | $0 | $0 | $0 | $0 | |
| Sales of Other Current Assets | $0 | $0 | $0 | $0 | $0 | $0 | $0 | $0 | $0 | $0 | $0 | $0 | |
| Sales of Long-term Assets | $0 | $0 | $0 | $0 | $0 | $0 | $0 | $0 | $0 | $0 | $0 | $0 | |
| New Investment Received | $0 | $0 | $0 | $0 | $0 | $0 | $0 | $0 | $0 | $0 | $0 | $0 | |
| Subtotal Cash Received | $0 | $0 | $1,647 | $4,771 | $10,592 | $20,227 | $22,702 | $25,573 | $26,440 | $27,011 | $27,928 | $29,447 | |
| Expenditures | Month 1 | Month 2 | Month 3 | Month 4 | Month 5 | Month 6 | Month 7 | Month 8 | Month 9 | Month 10 | Month 11 | Month 12 | |
| Expenditures from Operations | |||||||||||||
| Cash Spending | $2,000 | $6,700 | $8,000 | $11,300 | $11,300 | $11,300 | $11,300 | $11,300 | $11,300 | $11,300 | $11,300 | $11,300 | |
| Bill Payments | $145 | $4,374 | $5,160 | $8,409 | $14,082 | $15,442 | $17,156 | $17,518 | $17,560 | $18,048 | $18,925 | $19,110 | |
| Subtotal Spent on Operations | $2,145 | $11,074 | $13,160 | $19,709 | $25,382 | $26,742 | $28,456 | $28,818 | $28,860 | $29,348 | $30,225 | $30,410 | |
| Additional Cash Spent | |||||||||||||
| Sales Tax, VAT, HST/GST Paid Out | $0 | $0 | $0 | $0 | $0 | $0 | $0 | $0 | $0 | $0 | $0 | $0 | |
| Principal Repayment of Current Borrowing | $0 | $0 | $0 | $0 | $0 | $0 | $0 | $0 | $0 | $0 | $0 | $0 | |
| Other Liabilities Principal Repayment | $0 | $0 | $0 | $0 | $0 | $0 | $0 | $0 | $0 | $0 | $0 | $0 | |
| Long-term Liabilities Principal Repayment | $0 | $0 | $0 | $0 | $0 | $0 | $0 | $0 | $0 | $0 | $0 | $0 | |
| Purchase Other Current Assets | $0 | $0 | $0 | $0 | $0 | $0 | $0 | $0 | $0 | $0 | $0 | $0 | |
| Purchase Long-term Assets | $0 | $0 | $0 | $0 | $0 | $0 | $0 | $0 | $0 | $0 | $0 | $0 | |
| Dividends | $0 | $0 | $0 | $0 | $0 | $0 | $0 | $0 | $0 | $0 | $0 | $0 | |
| Subtotal Cash Spent | $2,145 | $11,074 | $13,160 | $19,709 | $25,382 | $26,742 | $28,456 | $28,818 | $28,860 | $29,348 | $30,225 | $30,410 | |
| Net Cash Flow | ($2,145) | ($11,074) | ($11,513) | ($14,938) | ($14,790) | ($6,515) | ($5,754) | ($3,245) | ($2,421) | ($2,337) | ($2,296) | ($962) | |
| Cash Balance | $91,855 | $80,782 | $69,268 | $54,331 | $39,541 | $33,026 | $27,273 | $24,028 | $21,607 | $19,270 | $16,973 | $16,011 | |
| Pro Forma Balance Sheet | |||||||||||||
| Month 1 | Month 2 | Month 3 | Month 4 | Month 5 | Month 6 | Month 7 | Month 8 | Month 9 | Month 10 | Month 11 | Month 12 | ||
| Assets | Starting Balances | ||||||||||||
| Current Assets | |||||||||||||
| Cash | $94,000 | $91,855 | $80,782 | $69,268 | $54,331 | $39,541 | $33,026 | $27,273 | $24,028 | $21,607 | $19,270 | $16,973 | $16,011 |
| Accounts Receivable | $0 | $0 | $0 | $4,942 | $18,597 | $29,424 | $34,526 | $37,983 | $38,631 | $39,466 | $41,730 | $43,493 | $43,969 |
| Other Current Assets | $0 | $0 | $0 | $0 | $0 | $0 | $0 | $0 | $0 | $0 | $0 | $0 | $0 |
| Total Current Assets | $94,000 | $91,855 | $80,782 | $74,210 | $72,928 | $68,965 | $67,552 | $65,256 | $62,659 | $61,073 | $60,999 | $60,466 | $59,980 |
| Long-term Assets | |||||||||||||
| Long-term Assets | $62,000 | $62,000 | $62,000 | $62,000 | $62,000 | $62,000 | $62,000 | $62,000 | $62,000 | $62,000 | $62,000 | $62,000 | $62,000 |
| Accumulated Depreciation | $0 | $1,033 | $2,066 | $3,099 | $4,132 | $5,165 | $6,198 | $7,231 | $8,264 | $9,297 | $10,330 | $11,363 | $12,396 |
| Total Long-term Assets | $62,000 | $60,967 | $59,934 | $58,901 | $57,868 | $56,835 | $55,802 | $54,769 | $53,736 | $52,703 | $51,670 | $50,637 | $49,604 |
| Total Assets | $156,000 | $152,822 | $140,716 | $133,111 | $130,796 | $125,800 | $123,354 | $120,025 | $116,395 | $113,776 | $112,669 | $111,103 | $109,584 |
| Liabilities and Capital | Month 1 | Month 2 | Month 3 | Month 4 | Month 5 | Month 6 | Month 7 | Month 8 | Month 9 | Month 10 | Month 11 | Month 12 | |
| Current Liabilities | |||||||||||||
| Accounts Payable | $0 | $4,205 | $4,887 | $7,941 | $13,569 | $14,871 | $16,572 | $16,933 | $16,960 | $17,418 | $18,288 | $18,469 | $18,570 |
| Current Borrowing | $0 | $0 | $0 | $0 | $0 | $0 | $0 | $0 | $0 | $0 | $0 | $0 | $0 |
| Other Current Liabilities | $0 | $0 | $0 | $0 | $0 | $0 | $0 | $0 | $0 | $0 | $0 | $0 | $0 |
| Subtotal Current Liabilities | $0 | $4,205 | $4,887 | $7,941 | $13,569 | $14,871 | $16,572 | $16,933 | $16,960 | $17,418 | $18,288 | $18,469 | $18,570 |
| Long-term Liabilities | $0 | $0 | $0 | $0 | $0 | $0 | $0 | $0 | $0 | $0 | $0 | $0 | $0 |
| Total Liabilities | $0 | $4,205 | $4,887 | $7,941 | $13,569 | $14,871 | $16,572 | $16,933 | $16,960 | $17,418 | $18,288 | $18,469 | $18,570 |
| Paid-in Capital | $165,000 | $165,000 | $165,000 | $165,000 | $165,000 | $165,000 | $165,000 | $165,000 | $165,000 | $165,000 | $165,000 | $165,000 | $165,000 |
| Retained Earnings | ($9,000) | ($9,000) | ($9,000) | ($9,000) | ($9,000) | ($9,000) | ($9,000) | ($9,000) | ($9,000) | ($9,000) | ($9,000) | ($9,000) | ($9,000) |
| Earnings | $0 | ($7,383) | ($20,171) | ($30,830) | ($38,773) | ($45,071) | ($49,218) | ($52,908) | ($56,564) | ($59,642) | ($61,619) | ($63,366) | ($64,986) |
| Total Capital | $156,000 | $148,617 | $135,829 | $125,170 | $117,227 | $110,929 | $106,782 | $103,092 | $99,436 | $96,358 | $94,381 | $92,634 | $91,014 |
| Total Liabilities and Capital | $156,000 | $152,822 | $140,716 | $133,111 | $130,796 | $125,800 | $123,354 | $120,025 | $116,395 | $113,776 | $112,669 | $111,103 | $109,584 |
| Net Worth | $156,000 | $148,617 | $135,829 | $125,170 | $117,227 | $110,929 | $106,782 | $103,092 | $99,436 | $96,358 | $94,381 | $92,634 | $91,014 |


