
Creative Concepts Computer Design
Executive Summary
Introduction
Creative Concepts Computer Design will provide computer and technical consulting to local small businesses as well as home PC users. In doing so the company will focus on marketing, responsiveness, quality, and creating and retaining customer relations.
The Company
Creative Concepts will initially be a sole proprietorship with minimum outside financing. Creative Concepts will be a home office start-up, utilizing one studio room in the owner’s home and serving customers in the local Eugene, Oregon area.
Creative Concepts will be initially owned by Bram Ekstrand. Depending on growth, the company will possibly add additional employees and expand operations.
The Market
Market research indicates an available market niche able to be occupied by additional businesses of this nature. The very nature of the computing industry, with its extraordinary rate of technological development, creates a constant need for businesses skilled in updating and advising customers on computer-related issues. Home PC users will provide the majority of our business revenue. These jobs will typically consist of minor upgrades services and advising. Business Week expects the computing industry to grow at a rate of 12% and the processor speeds to continue to expand for years to come, providing a rich resource for sales.
Creative Concepts has decided to focus mainly on the home PC market for many reasons. These home customers typically request jobs that are easier, faster, and less resource intensive then the opposing small business customer. In addition, this market tends to offer more flexibility for service times allowing a more productive workday.
Our target market will focus on Eugene and the surrounding areas. Market research indicates there is an abundance of business for a small company such as Creative Concepts. If a need exists for increased business, such promotional mediums as radio or print ads will be explored.
There are two main competitors for the computer upgrade business in the greater Eugene/Springfield area. These companies are VOS and Suntech Computers. Both of these companies charge rates in excess of Creative Concepts, therefore we expect to be able to attract the price-sensitive market without much work.
Financial Considerations
Total start-up expenses are modest. Since this is a service business and not product oriented, operational costs should remain low through the start-up process.
Fixed costs have been set at a reasonably accurate monthly level. This should allow for equipment maintenance and purchase or replacement of basic tools used in performing our services. Variable costs have been set per unit to allow for additional expenses such as gas or other travel costs specific to each job.
1.1 Objectives
- To provide a service to the community that is in sufficient demand as to generate a profit.
- Gain a strong repeat customer base to maximize growth.
- Become a positive influence in the community in which we operate.
1.2 Mission
To become a contributing unit of society while delivering a product of exceptional quality, value, and in a timely fashion. We will treat every customer as if they were our only customer.

1.3 Keys to Success
- Marketing and Networking (being known to the public).
- Responsiveness (being an on-call computer paramedic with fast response time).
- Quality (getting the job done right the first time, offering 100% guarantee).
- Relationships (developing loyal repeat customers–retainers).
Company Summary
Creative Concepts will initially be a sole proprietorship.
The goal will be to start the venture as inexpensively as possible, with minimal outside financing.
Creative Concepts will be a home office start-up, utilizing one studio room in the owner’s home.
2.1 Company Ownership
Creative Concepts will be initially owned by Bram Ekstrand as a sole proprietorship. Possibly later adding additional employees and expanding operations as well as clientele.
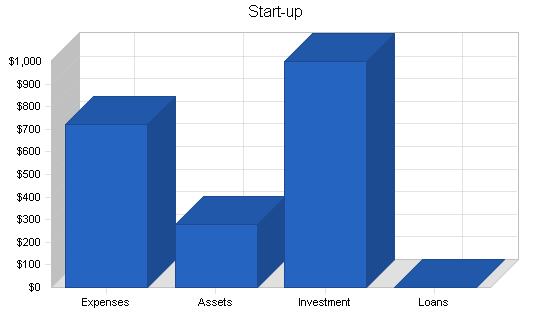
2.2 Start-up Summary
Total start-up expenses are modest. This is composed of mostly equipment costs along with a few dollars for research of consumer wants and desires and a few pads of stationary. Exact allocations are shown on the table. Since this is a service business and not product oriented, operational costs should remain low through the start-up process.
| Start-up | |
| Requirements | |
| Start-up Expenses | |
| Legal | $150 |
| Stationery etc. | $50 |
| Brochures | $0 |
| Consultants | $0 |
| Insurance | $0 |
| Rent | $0 |
| Research and development | $20 |
| Expensed equipment | $500 |
| Other | $0 |
| Total Start-up Expenses | $720 |
| Start-up Assets | |
| Cash Required | $280 |
| Other Current Assets | $0 |
| Long-term Assets | $0 |
| Total Assets | $280 |
| Total Requirements | $1,000 |
| Start-up Funding | |
| Start-up Expenses to Fund | $720 |
| Start-up Assets to Fund | $280 |
| Total Funding Required | $1,000 |
| Assets | |
| Non-cash Assets from Start-up | $0 |
| Cash Requirements from Start-up | $280 |
| Additional Cash Raised | $0 |
| Cash Balance on Starting Date | $280 |
| Total Assets | $280 |
| Liabilities and Capital | |
| Liabilities | |
| Current Borrowing | $0 |
| Long-term Liabilities | $0 |
| Accounts Payable (Outstanding Bills) | $0 |
| Other Current Liabilities (interest-free) | $0 |
| Total Liabilities | $0 |
| Capital | |
| Planned Investment | |
| Investor 1 | $1,000 |
| Investor 2 | $0 |
| Other | $0 |
| Additional Investment Requirement | $0 |
| Total Planned Investment | $1,000 |
| Loss at Start-up (Start-up Expenses) | ($720) |
| Total Capital | $280 |
| Total Capital and Liabilities | $280 |
| Total Funding | $1,000 |
Services
Creative Concepts will offer computer support and upgrade service to clients of two major categories, home PC users and small office users. These categories will define 95% of our operations.
3.1 Service Description
Our services can be obtained through direct hourly compensation, or if preferred or more applicable, through a contract situation with pre-defined limits.
3.2 Competitive Comparison
Our services are more thorough and precise than any existing competition in the surrounding metro area. Since we have no extravagant overhead we can be focused on delivering exactly what the customer wants, something other computer support providers in this area have a hard time with.
3.3 Technology
Creative Concepts will operate in an environment with technology that is constantly evolving. Keeping up to date will be of vital importance to the profitability of this venture. Keeping this in mind, we will maintain working, as well as functional, knowledge of all the latest software available to the public. Our customers will receive the most current versions of all software and hardware upgrades requested.
Market Analysis Summary
Creative Concepts Computer Design will provide computer support in both a consulting and technical capacity to home PC users as well as small business owners. Since Creative Concepts is currently a one man operation it will be limited in growth to the capacity of work able to be completed. Personal market research indicates an available market niche able to be occupied by additional businesses of this nature. The very nature of the computing industry, with its extraordinary rate of technological development, creates a constant need for businesses skilled in updating and advising customers on computer-related issues.
4.1 Market Segmentation
The existing computer service market is so extensive categorizing it is a rather difficult task. For our revenue-oriented purposes we will define the market into home PC users and small business clients. Home PC users will provide the majority of our business revenue. These jobs will typically consist of minor upgrades services and advising. The small business market will be defined as customers with five or more computers or a network requiring service or repair.

| Market Analysis | |||||||
| Year 1 | Year 2 | Year 3 | Year 4 | Year 5 | |||
| Potential Customers | Growth | CAGR | |||||
| Home PC Users | 2% | 25,000 | 25,500 | 26,010 | 26,530 | 27,061 | 2.00% |
| Small Business Contracts | 1% | 10,000 | 10,100 | 10,201 | 10,303 | 10,406 | 1.00% |
| Other | 0% | 0 | 0 | 0 | 0 | 0 | 0.00% |
| Total | 1.72% | 35,000 | 35,600 | 36,211 | 36,833 | 37,467 | 1.72% |
4.2 Target Market Segment Strategy
Creative Concepts has decided to focus mainly on the home PC market for many reasons. These home customers typically requests jobs that are easier, faster, and less resource intensive then the opposing small business customer. In addition, this market tends to offer more flexibility for service times allowing a more productive workday.

4.2.1 Market Needs
As reported by ComputingNet magazine, there is a substantial need for individuals capable of performing computer upgrades and repairs in a timely and cost-effective manner in this region. Creative Concepts is directed specifically at that market niche.
4.2.2 Market Trends
Both the software and hardware side of the computer industry continue to turn out new and revised computer components at alarming rates. For Creative Concepts this means job security well into the future.
4.2.3 Market Growth
As reported by the Wall Street Journal, there seems to be no end to the development of the computer market. Business Week expects the computing industry to grow at a rate of 12% and the processor speeds to continue to expand for years to come.
4.3 Service Business Analysis
Secondary market research shows computer service customers tend to be very loyal providers that do good work and satisfy their needs. An analysis of Creative Concepts’ main competitors shows no overwhelming strengths that would be significant barriers to possible success. Likewise, identifying competitor’s weaknesses has illuminated several areas that Creative Concepts can target as marketing strategies.
4.3.1 Main Competitors
There are two main competitors for the computer upgrade business in this area.
- VOS. They are a well established provider of computer upgrades and services.
- Suntech Computers. Smaller and less known then VOS, Suntech provides many services for residents living in East and South Eugene.
Both of these companies charge rates in excess of Creative Concepts, we will be able to attract the price-sensitive market without much work. Our second main advantage is the accessibility of our services. The time conscientious customer will appreciate our swift work.
4.3.2 Competition and Buying Patterns
As previously noted, there are other providers of similar services in the area. Our services will be second to no one and our prices will be rock bottom. By providing superior service word of mouth alone will bring in many new clients. The satisfaction our consumers find will keep them as our business.
Strategy and Implementation Summary
A value proposition of timely and practical solutions, at a reasonable rate, coupled with a 100% guarantee.
A competitive edge based on cultivating existing customer relationships.
Our target market will focus on Eugene and the surrounding areas. Market research indicates there is an abundance of business for a small company such as Creative Concepts. If apparent a need exists for increased business, such promotional mediums as radio or print ad could be explored.
5.1 Competitive Edge
Our competitive advantage will be our ability to quickly take in a request from a customer and complete the requested task in a timely fashion. Typically we will strive for a 48-hour completion of most home PC user requests and slightly longer for small business obligations. In addition we will conduct our services at the going wage or slightly below. Setting marginal revenue to marginal cost until we establish a substantial customer base if not forever. With this strategy we can undercut most competitors and gain local market power.
5.2 Value Proposition
Our business will be simple. Provide quality services at reasonable prices and take care of the customer, for they are your business.
5.3 Sales Strategy
Happy customers will be repeat customers. If the customer feels satisfied he will tell his friends and more business will come in the door.
Sales forecast figures are based on industry figures for the typical growth of a consulting start-up and reflect repeat business generated through meeting customer needs.
5.3.1 Sales Forecast
The sales strategy is a prediction of slow, controllable growth. Since I am the sole employee I will be focusing on quality and attention to detail especially in the beginning to avoid some potential pitfalls encountered by many new businesses. The predicted growth is very moderate in the home PC market and the small business arenas. This should allow for careful examination of variations in demand with regards to season or holidays and still allow enough flexibility to sufficiently compensate.


| Sales Forecast | |||
| Year 1 | Year 2 | Year 3 | |
| Unit Sales | |||
| Home PC Unit | 396 | 475 | 570 |
| Small Business Unit | 214 | 235 | 259 |
| Other | 0 | 0 | 0 |
| Total Unit Sales | 610 | 710 | 829 |
| Unit Prices | Year 1 | Year 2 | Year 3 |
| Home PC Unit | $30.00 | $33.00 | $36.30 |
| Small Business Unit | $30.00 | $36.00 | $43.20 |
| Other | $0.00 | $0.00 | $0.00 |
| Sales | |||
| Home PC Unit | $11,874 | $15,674 | $20,690 |
| Small Business Unit | $6,415 | $8,468 | $11,178 |
| Other | $0 | $0 | $0 |
| Total Sales | $18,289 | $24,142 | $31,868 |
| Direct Unit Costs | Year 1 | Year 2 | Year 3 |
| Home PC Unit | $5.00 | $7.00 | $10.00 |
| Small Business Unit | $7.00 | $10.00 | $13.00 |
| Other | $0.00 | $0.00 | $0.00 |
| Direct Cost of Sales | |||
| Home PC Unit | $1,979 | $3,325 | $5,700 |
| Small Business Unit | $1,497 | $2,352 | $3,364 |
| Other | $0 | $0 | $0 |
| Subtotal Direct Cost of Sales | $3,476 | $5,677 | $9,063 |
5.4 Milestones
The milestones, listed in the table below, outline the major events that will promote, as well as insure the success of, Creative Concepts and keep it a going concern well into the future.
| Milestones | |||||
| Milestone | Start Date | End Date | Budget | Manager | Department |
| Aquisition of Capital for initial opening | 8/1/2002 | 9/1/2002 | $0 | BNE | Admin |
| Procurement of materials for opening | 9/1/2002 | 10/1/2002 | $500 | BNE | Admin |
| Open for Business | 10/1/2002 | Never | $0 | BNE | Admin |
| Name me | 3/1/1999 | 4/1/1999 | $0 | ABC | Department |
| Totals | $500 | ||||
Management Summary
Since Creative Concepts is a sole proprietorship, this topic is currently not valid. However, if employees are added in the future this will be revised at that time.
6.1 Personnel Plan
The following table shows my expected compensation. Since I am the sole employee I am the only one on the books. I have decided to have my pay directly reflective of the businesses success. Additionally, I have decided to leave a residual amount of income with the company each month. This is intended to allow a means of adaptation or evolution of the business should circumstances dictate expansion or the hiring of additional employees in the future.
| Personnel Plan | |||
| Year 1 | Year 2 | Year 3 | |
| Owner | $8,102 | $12,071 | $15,934 |
| Other | $0 | $0 | $0 |
| Total People | 0 | 0 | 0 |
| Total Payroll | $8,102 | $12,071 | $15,934 |
Financial Plan
The following sections include the annual estimates for the standard set of financial tables. Detailed monthly pro-forma tables are included in the appendix.
7.1 Important Assumptions
Creative Concepts customer base would fluctuate if there was a recess in the economy or other extenuating circumstances that pertain directly to consumer or industry behavior.
| General Assumptions | |||
| Year 1 | Year 2 | Year 3 | |
| Plan Month | 1 | 2 | 3 |
| Current Interest Rate | 10.00% | 10.00% | 10.00% |
| Long-term Interest Rate | 10.00% | 10.00% | 10.00% |
| Tax Rate | 25.42% | 25.00% | 25.42% |
| Other | 0 | 0 | 0 |
7.2 Break-even Analysis
Fixed costs have been set at a reasonably accurate monthly level. This should allow for equipment maintenance and purchase or replacement of basic tools used in performing our services. Variable costs have been set per unit to allow for additional expenses such as gas or other travel costs specific to each job.

| Break-even Analysis | |
| Monthly Units Break-even | 28 |
| Monthly Revenue Break-even | $834 |
| Assumptions: | |
| Average Per-Unit Revenue | $29.98 |
| Average Per-Unit Variable Cost | $5.70 |
| Estimated Monthly Fixed Cost | $675 |
7.3 Projected Profit and Loss
The profit and loss shown for this company is a source of inspiration. For the first year of operation the books show a modest net profit. This should allow for great flexibility and survival in the start-up phase in case of unexpected problems or expenses. The profit margin declines incrementally in the following two years as greater payroll allocations are made. These increased allocations will be contingent upon the continued success of this going concern. Additionally, since this business is operated out of the home, expenses such as rent, utilities, and insurance are sunk costs and not reflective of the business venture.


| Pro Forma Profit and Loss | |||
| Year 1 | Year 2 | Year 3 | |
| Sales | $18,289 | $24,142 | $31,868 |
| Direct Cost of Sales | $3,476 | $5,677 | $9,063 |
| Other | $0 | $0 | $0 |
| Total Cost of Sales | $3,476 | $5,677 | $9,063 |
| Gross Margin | $14,814 | $18,465 | $22,804 |
| Gross Margin % | 80.99% | 76.48% | 71.56% |
| Expenses | |||
| Payroll | $8,102 | $12,071 | $15,934 |
| Sales and Marketing and Other Expenses | $0 | $0 | $0 |
| Depreciation | $0 | $0 | $0 |
| Leased Equipment | $0 | $0 | $0 |
| Utilities | $0 | $0 | $0 |
| Insurance | $0 | $0 | $0 |
| Rent | $0 | $0 | $0 |
| Payroll Taxes | $0 | $0 | $0 |
| Other | $0 | $0 | $0 |
| Total Operating Expenses | $8,102 | $12,071 | $15,934 |
| Profit Before Interest and Taxes | $6,711 | $6,394 | $6,870 |
| EBITDA | $6,711 | $6,394 | $6,870 |
| Interest Expense | $0 | $0 | $0 |
| Taxes Incurred | $1,702 | $1,598 | $1,746 |
| Net Profit | $5,009 | $4,795 | $5,124 |
| Net Profit/Sales | 27.39% | 19.86% | 16.08% |
7.4 Projected Cash Flow
This information is presented in the chart and table below.

| Pro Forma Cash Flow | |||
| Year 1 | Year 2 | Year 3 | |
| Cash Received | |||
| Cash from Operations | |||
| Cash Sales | $0 | $0 | $0 |
| Cash from Receivables | $12,657 | $22,340 | $29,488 |
| Subtotal Cash from Operations | $12,657 | $22,340 | $29,488 |
| Additional Cash Received | |||
| Sales Tax, VAT, HST/GST Received | $0 | $0 | $0 |
| New Current Borrowing | $0 | $0 | $0 |
| New Other Liabilities (interest-free) | $0 | $0 | $0 |
| New Long-term Liabilities | $0 | $0 | $0 |
| Sales of Other Current Assets | $0 | $0 | $0 |
| Sales of Long-term Assets | $0 | $0 | $0 |
| New Investment Received | $0 | $0 | $0 |
| Subtotal Cash Received | $12,657 | $22,340 | $29,488 |
| Expenditures | Year 1 | Year 2 | Year 3 |
| Expenditures from Operations | |||
| Cash Spending | $8,102 | $12,071 | $15,934 |
| Bill Payments | $4,391 | $7,464 | $10,519 |
| Subtotal Spent on Operations | $12,493 | $19,535 | $26,453 |
| Additional Cash Spent | |||
| Sales Tax, VAT, HST/GST Paid Out | $0 | $0 | $0 |
| Principal Repayment of Current Borrowing | $0 | $0 | $0 |
| Other Liabilities Principal Repayment | $0 | $0 | $0 |
| Long-term Liabilities Principal Repayment | $0 | $0 | $0 |
| Purchase Other Current Assets | $0 | $0 | $0 |
| Purchase Long-term Assets | $0 | $0 | $0 |
| Dividends | $0 | $0 | $0 |
| Subtotal Cash Spent | $12,493 | $19,535 | $26,453 |
| Net Cash Flow | $164 | $2,804 | $3,035 |
| Cash Balance | $444 | $3,248 | $6,283 |
7.5 Projected Balance Sheet
This information is presented in the table below.
| Pro Forma Balance Sheet | |||
| Year 1 | Year 2 | Year 3 | |
| Assets | |||
| Current Assets | |||
| Cash | $444 | $3,248 | $6,283 |
| Accounts Receivable | $5,633 | $7,435 | $9,815 |
| Other Current Assets | $0 | $0 | $0 |
| Total Current Assets | $6,076 | $10,683 | $16,098 |
| Long-term Assets | |||
| Long-term Assets | $0 | $0 | $0 |
| Accumulated Depreciation | $0 | $0 | $0 |
| Total Long-term Assets | $0 | $0 | $0 |
| Total Assets | $6,076 | $10,683 | $16,098 |
| Liabilities and Capital | Year 1 | Year 2 | Year 3 |
| Current Liabilities | |||
| Accounts Payable | $787 | $598 | $888 |
| Current Borrowing | $0 | $0 | $0 |
| Other Current Liabilities | $0 | $0 | $0 |
| Subtotal Current Liabilities | $787 | $598 | $888 |
| Long-term Liabilities | $0 | $0 | $0 |
| Total Liabilities | $787 | $598 | $888 |
| Paid-in Capital | $1,000 | $1,000 | $1,000 |
| Retained Earnings | ($720) | $4,289 | $9,085 |
| Earnings | $5,009 | $4,795 | $5,124 |
| Total Capital | $5,289 | $10,085 | $15,209 |
| Total Liabilities and Capital | $6,076 | $10,683 | $16,098 |
| Net Worth | $5,289 | $10,085 | $15,209 |
7.6 Business Ratios
Business ratios for the years of this plan are shown below. Industry profile ratios based on the Standard Industrial Classification (SIC) code 7379, Computer Related Services NEC, are shown for comparison.
| Ratio Analysis | ||||
| Year 1 | Year 2 | Year 3 | Industry Profile | |
| Sales Growth | 0.00% | 32.00% | 32.00% | 7.20% |
| Percent of Total Assets | ||||
| Accounts Receivable | 92.70% | 69.60% | 60.97% | 21.70% |
| Other Current Assets | 0.00% | 0.00% | 0.00% | 46.70% |
| Total Current Assets | 100.00% | 100.00% | 100.00% | 71.90% |
| Long-term Assets | 0.00% | 0.00% | 0.00% | 28.10% |
| Total Assets | 100.00% | 100.00% | 100.00% | 100.00% |
| Current Liabilities | 12.95% | 5.60% | 5.52% | 51.40% |
| Long-term Liabilities | 0.00% | 0.00% | 0.00% | 19.10% |
| Total Liabilities | 12.95% | 5.60% | 5.52% | 70.50% |
| Net Worth | 87.05% | 94.40% | 94.48% | 29.50% |
| Percent of Sales | ||||
| Sales | 100.00% | 100.00% | 100.00% | 100.00% |
| Gross Margin | 80.99% | 76.48% | 71.56% | 0.00% |
| Selling, General & Administrative Expenses | 38.70% | 65.72% | 64.96% | 80.70% |
| Advertising Expenses | 0.00% | 0.00% | 0.00% | 1.20% |
| Profit Before Interest and Taxes | 36.69% | 26.48% | 21.56% | 1.70% |
| Main Ratios | ||||
| Current | 7.72 | 17.86 | 18.12 | 1.27 |
| Quick | 7.72 | 17.86 | 18.12 | 1.01 |
| Total Debt to Total Assets | 12.95% | 5.60% | 5.52% | 70.50% |
| Pre-tax Return on Net Worth | 126.88% | 63.40% | 45.17% | 3.50% |
| Pre-tax Return on Assets | 110.45% | 59.85% | 42.68% | 11.80% |
| Additional Ratios | Year 1 | Year 2 | Year 3 | |
| Net Profit Margin | 27.39% | 19.86% | 16.08% | n.a |
| Return on Equity | 94.71% | 47.55% | 33.69% | n.a |
| Activity Ratios | ||||
| Accounts Receivable Turnover | 3.25 | 3.25 | 3.25 | n.a |
| Collection Days | 55 | 99 | 99 | n.a |
| Accounts Payable Turnover | 6.58 | 12.17 | 12.17 | n.a |
| Payment Days | 27 | 35 | 25 | n.a |
| Total Asset Turnover | 3.01 | 2.26 | 1.98 | n.a |
| Debt Ratios | ||||
| Debt to Net Worth | 0.15 | 0.06 | 0.06 | n.a |
| Current Liab. to Liab. | 1.00 | 1.00 | 1.00 | n.a |
| Liquidity Ratios | ||||
| Net Working Capital | $5,289 | $10,085 | $15,209 | n.a |
| Interest Coverage | 0.00 | 0.00 | 0.00 | n.a |
| Additional Ratios | ||||
| Assets to Sales | 0.33 | 0.44 | 0.51 | n.a |
| Current Debt/Total Assets | 13% | 6% | 6% | n.a |
| Acid Test | 0.56 | 5.43 | 7.07 | n.a |
| Sales/Net Worth | 3.46 | 2.39 | 2.10 | n.a |
| Dividend Payout | 0.00 | 0.00 | 0.00 | n.a |
Appendix
| Sales Forecast | |||||||||||||
| Month 1 | Month 2 | Month 3 | Month 4 | Month 5 | Month 6 | Month 7 | Month 8 | Month 9 | Month 10 | Month 11 | Month 12 | ||
| Unit Sales | |||||||||||||
| Home PC Unit | 0% | 10 | 12 | 14 | 17 | 21 | 25 | 30 | 36 | 43 | 52 | 62 | 74 |
| Small Business Unit | 0% | 10 | 11 | 12 | 13 | 15 | 16 | 18 | 19 | 21 | 24 | 26 | 29 |
| Other | 0% | 0 | 0 | 0 | 0 | 0 | 0 | 0 | 0 | 0 | 0 | 0 | 0 |
| Total Unit Sales | 20 | 23 | 27 | 31 | 35 | 41 | 48 | 55 | 64 | 75 | 88 | 103 | |
| Unit Prices | Month 1 | Month 2 | Month 3 | Month 4 | Month 5 | Month 6 | Month 7 | Month 8 | Month 9 | Month 10 | Month 11 | Month 12 | |
| Home PC Unit | $30.00 | $30.00 | $30.00 | $30.00 | $30.00 | $30.00 | $30.00 | $30.00 | $30.00 | $30.00 | $30.00 | $30.00 | |
| Small Business Unit | $30.00 | $30.00 | $30.00 | $30.00 | $30.00 | $30.00 | $30.00 | $30.00 | $30.00 | $30.00 | $30.00 | $30.00 | |
| Other | $0.00 | $0.00 | $0.00 | $0.00 | $0.00 | $0.00 | $0.00 | $0.00 | $0.00 | $0.00 | $0.00 | $0.00 | |
| Sales | |||||||||||||
| Home PC Unit | $300 | $360 | $432 | $518 | $622 | $746 | $896 | $1,075 | $1,290 | $1,548 | $1,858 | $2,229 | |
| Small Business Unit | $300 | $330 | $363 | $399 | $439 | $483 | $531 | $585 | $643 | $707 | $778 | $856 | |
| Other | $0 | $0 | $0 | $0 | $0 | $0 | $0 | $0 | $0 | $0 | $0 | $0 | |
| Total Sales | $600 | $690 | $795 | $918 | $1,061 | $1,230 | $1,427 | $1,660 | $1,933 | $2,255 | $2,636 | $3,085 | |
| Direct Unit Costs | Month 1 | Month 2 | Month 3 | Month 4 | Month 5 | Month 6 | Month 7 | Month 8 | Month 9 | Month 10 | Month 11 | Month 12 | |
| Home PC Unit | 0.00% | $5.00 | $5.00 | $5.00 | $5.00 | $5.00 | $5.00 | $5.00 | $5.00 | $5.00 | $5.00 | $5.00 | $5.00 |
| Small Business Unit | 0.00% | $7.00 | $7.00 | $7.00 | $7.00 | $7.00 | $7.00 | $7.00 | $7.00 | $7.00 | $7.00 | $7.00 | $7.00 |
| Other | 0.00% | $0.00 | $0.00 | $0.00 | $0.00 | $0.00 | $0.00 | $0.00 | $0.00 | $0.00 | $0.00 | $0.00 | $0.00 |
| Direct Cost of Sales | |||||||||||||
| Home PC Unit | $50 | $60 | $72 | $86 | $104 | $124 | $149 | $179 | $215 | $258 | $310 | $372 | |
| Small Business Unit | $70 | $77 | $85 | $93 | $102 | $113 | $124 | $136 | $150 | $165 | $182 | $200 | |
| Other | $0 | $0 | $0 | $0 | $0 | $0 | $0 | $0 | $0 | $0 | $0 | $0 | |
| Subtotal Direct Cost of Sales | $120 | $137 | $157 | $180 | $206 | $237 | $273 | $316 | $365 | $423 | $491 | $571 | |
| Personnel Plan | |||||||||||||
| Month 1 | Month 2 | Month 3 | Month 4 | Month 5 | Month 6 | Month 7 | Month 8 | Month 9 | Month 10 | Month 11 | Month 12 | ||
| Owner | 0% | $0 | $0 | $0 | $459 | $531 | $615 | $714 | $830 | $967 | $1,128 | $1,318 | $1,542 |
| Other | 0% | $0 | $0 | $0 | $0 | $0 | $0 | $0 | $0 | $0 | $0 | $0 | $0 |
| Total People | 0 | 0 | 0 | 0 | 0 | 0 | 0 | 0 | 0 | 0 | 0 | 0 | |
| Total Payroll | $0 | $0 | $0 | $459 | $531 | $615 | $714 | $830 | $967 | $1,128 | $1,318 | $1,542 | |
| General Assumptions | |||||||||||||
| Month 1 | Month 2 | Month 3 | Month 4 | Month 5 | Month 6 | Month 7 | Month 8 | Month 9 | Month 10 | Month 11 | Month 12 | ||
| Plan Month | 1 | 2 | 3 | 4 | 5 | 6 | 7 | 8 | 9 | 10 | 11 | 12 | |
| Current Interest Rate | 10.00% | 10.00% | 10.00% | 10.00% | 10.00% | 10.00% | 10.00% | 10.00% | 10.00% | 10.00% | 10.00% | 10.00% | |
| Long-term Interest Rate | 10.00% | 10.00% | 10.00% | 10.00% | 10.00% | 10.00% | 10.00% | 10.00% | 10.00% | 10.00% | 10.00% | 10.00% | |
| Tax Rate | 30.00% | 25.00% | 25.00% | 25.00% | 25.00% | 25.00% | 25.00% | 25.00% | 25.00% | 25.00% | 25.00% | 25.00% | |
| Other | 0 | 0 | 0 | 0 | 0 | 0 | 0 | 0 | 0 | 0 | 0 | 0 | |
| Pro Forma Profit and Loss | |||||||||||||
| Month 1 | Month 2 | Month 3 | Month 4 | Month 5 | Month 6 | Month 7 | Month 8 | Month 9 | Month 10 | Month 11 | Month 12 | ||
| Sales | $600 | $690 | $795 | $918 | $1,061 | $1,230 | $1,427 | $1,660 | $1,933 | $2,255 | $2,636 | $3,085 | |
| Direct Cost of Sales | $120 | $137 | $157 | $180 | $206 | $237 | $273 | $316 | $365 | $423 | $491 | $571 | |
| Other | $0 | $0 | $0 | $0 | $0 | $0 | $0 | $0 | $0 | $0 | $0 | $0 | |
| Total Cost of Sales | $120 | $137 | $157 | $180 | $206 | $237 | $273 | $316 | $365 | $423 | $491 | $571 | |
| Gross Margin | $480 | $553 | $638 | $738 | $855 | $992 | $1,154 | $1,344 | $1,568 | $1,832 | $2,144 | $2,514 | |
| Gross Margin % | 80.00% | 80.14% | 80.29% | 80.43% | 80.57% | 80.71% | 80.85% | 80.98% | 81.12% | 81.24% | 81.37% | 81.48% | |
| Expenses | |||||||||||||
| Payroll | $0 | $0 | $0 | $459 | $531 | $615 | $714 | $830 | $967 | $1,128 | $1,318 | $1,542 | |
| Sales and Marketing and Other Expenses | $0 | $0 | $0 | $0 | $0 | $0 | $0 | $0 | $0 | $0 | $0 | $0 | |
| Depreciation | $0 | $0 | $0 | $0 | $0 | $0 | $0 | $0 | $0 | $0 | $0 | $0 | |
| Leased Equipment | $0 | $0 | $0 | $0 | $0 | $0 | $0 | $0 | $0 | $0 | $0 | $0 | |
| Utilities | $0 | $0 | $0 | $0 | $0 | $0 | $0 | $0 | $0 | $0 | $0 | $0 | |
| Insurance | $0 | $0 | $0 | $0 | $0 | $0 | $0 | $0 | $0 | $0 | $0 | $0 | |
| Rent | $0 | $0 | $0 | $0 | $0 | $0 | $0 | $0 | $0 | $0 | $0 | $0 | |
| Payroll Taxes | 0% | $0 | $0 | $0 | $0 | $0 | $0 | $0 | $0 | $0 | $0 | $0 | $0 |
| Other | $0 | $0 | $0 | $0 | $0 | $0 | $0 | $0 | $0 | $0 | $0 | $0 | |
| Total Operating Expenses | $0 | $0 | $0 | $459 | $531 | $615 | $714 | $830 | $967 | $1,128 | $1,318 | $1,542 | |
| Profit Before Interest and Taxes | $480 | $553 | $638 | $279 | $324 | $378 | $440 | $514 | $601 | $705 | $827 | $971 | |
| EBITDA | $480 | $553 | $638 | $279 | $324 | $378 | $440 | $514 | $601 | $705 | $827 | $971 | |
| Interest Expense | $0 | $0 | $0 | $0 | $0 | $0 | $0 | $0 | $0 | $0 | $0 | $0 | |
| Taxes Incurred | $144 | $138 | $160 | $70 | $81 | $94 | $110 | $129 | $150 | $176 | $207 | $243 | |
| Net Profit | $336 | $415 | $479 | $209 | $243 | $283 | $330 | $386 | $451 | $528 | $620 | $728 | |
| Net Profit/Sales | 56.00% | 60.11% | 60.22% | 22.82% | 22.93% | 23.04% | 23.14% | 23.24% | 23.34% | 23.43% | 23.52% | 23.61% | |
| Pro Forma Cash Flow | |||||||||||||
| Month 1 | Month 2 | Month 3 | Month 4 | Month 5 | Month 6 | Month 7 | Month 8 | Month 9 | Month 10 | Month 11 | Month 12 | ||
| Cash Received | |||||||||||||
| Cash from Operations | |||||||||||||
| Cash Sales | $0 | $0 | $0 | $0 | $0 | $0 | $0 | $0 | $0 | $0 | $0 | $0 | |
| Cash from Receivables | $0 | $20 | $603 | $694 | $799 | $922 | $1,067 | $1,236 | $1,435 | $1,669 | $1,944 | $2,268 | |
| Subtotal Cash from Operations | $0 | $20 | $603 | $694 | $799 | $922 | $1,067 | $1,236 | $1,435 | $1,669 | $1,944 | $2,268 | |
| Additional Cash Received | |||||||||||||
| Sales Tax, VAT, HST/GST Received | 0.00% | $0 | $0 | $0 | $0 | $0 | $0 | $0 | $0 | $0 | $0 | $0 | $0 |
| New Current Borrowing | $0 | $0 | $0 | $0 | $0 | $0 | $0 | $0 | $0 | $0 | $0 | $0 | |
| New Other Liabilities (interest-free) | $0 | $0 | $0 | $0 | $0 | $0 | $0 | $0 | $0 | $0 | $0 | $0 | |
| New Long-term Liabilities | $0 | $0 | $0 | $0 | $0 | $0 | $0 | $0 | $0 | $0 | $0 | $0 | |
| Sales of Other Current Assets | $0 | $0 | $0 | $0 | $0 | $0 | $0 | $0 | $0 | $0 | $0 | $0 | |
| Sales of Long-term Assets | $0 | $0 | $0 | $0 | $0 | $0 | $0 | $0 | $0 | $0 | $0 | $0 | |
| New Investment Received | $0 | $0 | $0 | $0 | $0 | $0 | $0 | $0 | $0 | $0 | $0 | $0 | |
| Subtotal Cash Received | $0 | $20 | $603 | $694 | $799 | $922 | $1,067 | $1,236 | $1,435 | $1,669 | $1,944 | $2,268 | |
| Expenditures | Month 1 | Month 2 | Month 3 | Month 4 | Month 5 | Month 6 | Month 7 | Month 8 | Month 9 | Month 10 | Month 11 | Month 12 | |
| Expenditures from Operations | |||||||||||||
| Cash Spending | $0 | $0 | $0 | $459 | $531 | $615 | $714 | $830 | $967 | $1,128 | $1,318 | $1,542 | |
| Bill Payments | $9 | $264 | $277 | $314 | $251 | $289 | $333 | $385 | $446 | $518 | $602 | $702 | |
| Subtotal Spent on Operations | $9 | $264 | $277 | $773 | $781 | $904 | $1,047 | $1,215 | $1,413 | $1,646 | $1,920 | $2,244 | |
| Additional Cash Spent | |||||||||||||
| Sales Tax, VAT, HST/GST Paid Out | $0 | $0 | $0 | $0 | $0 | $0 | $0 | $0 | $0 | $0 | $0 | $0 | |
| Principal Repayment of Current Borrowing | $0 | $0 | $0 | $0 | $0 | $0 | $0 | $0 | $0 | $0 | $0 | $0 | |
| Other Liabilities Principal Repayment | $0 | $0 | $0 | $0 | $0 | $0 | $0 | $0 | $0 | $0 | $0 | $0 | |
| Long-term Liabilities Principal Repayment | $0 | $0 | $0 | $0 | $0 | $0 | $0 | $0 | $0 | $0 | $0 | $0 | |
| Purchase Other Current Assets | $0 | $0 | $0 | $0 | $0 | $0 | $0 | $0 | $0 | $0 | $0 | $0 | |
| Purchase Long-term Assets | $0 | $0 | $0 | $0 | $0 | $0 | $0 | $0 | $0 | $0 | $0 | $0 | |
| Dividends | $0 | $0 | $0 | $0 | $0 | $0 | $0 | $0 | $0 | $0 | $0 | $0 | |
| Subtotal Cash Spent | $9 | $264 | $277 | $773 | $781 | $904 | $1,047 | $1,215 | $1,413 | $1,646 | $1,920 | $2,244 | |
| Net Cash Flow | ($9) | ($244) | $326 | ($79) | $18 | $19 | $20 | $21 | $22 | $23 | $23 | $24 | |
| Cash Balance | $271 | $27 | $353 | $274 | $292 | $310 | $330 | $352 | $374 | $396 | $420 | $444 | |
| Pro Forma Balance Sheet | |||||||||||||
| Month 1 | Month 2 | Month 3 | Month 4 | Month 5 | Month 6 | Month 7 | Month 8 | Month 9 | Month 10 | Month 11 | Month 12 | ||
| Assets | Starting Balances | ||||||||||||
| Current Assets | |||||||||||||
| Cash | $280 | $271 | $27 | $353 | $274 | $292 | $310 | $330 | $352 | $374 | $396 | $420 | $444 |
| Accounts Receivable | $0 | $600 | $1,270 | $1,462 | $1,686 | $1,948 | $2,256 | $2,616 | $3,039 | $3,537 | $4,124 | $4,816 | $5,633 |
| Other Current Assets | $0 | $0 | $0 | $0 | $0 | $0 | $0 | $0 | $0 | $0 | $0 | $0 | $0 |
| Total Current Assets | $280 | $871 | $1,297 | $1,815 | $1,960 | $2,240 | $2,566 | $2,946 | $3,391 | $3,911 | $4,520 | $5,236 | $6,076 |
| Long-term Assets | |||||||||||||
| Long-term Assets | $0 | $0 | $0 | $0 | $0 | $0 | $0 | $0 | $0 | $0 | $0 | $0 | $0 |
| Accumulated Depreciation | $0 | $0 | $0 | $0 | $0 | $0 | $0 | $0 | $0 | $0 | $0 | $0 | $0 |
| Total Long-term Assets | $0 | $0 | $0 | $0 | $0 | $0 | $0 | $0 | $0 | $0 | $0 | $0 | $0 |
| Total Assets | $280 | $871 | $1,297 | $1,815 | $1,960 | $2,240 | $2,566 | $2,946 | $3,391 | $3,911 | $4,520 | $5,236 | $6,076 |
| Liabilities and Capital | Month 1 | Month 2 | Month 3 | Month 4 | Month 5 | Month 6 | Month 7 | Month 8 | Month 9 | Month 10 | Month 11 | Month 12 | |
| Current Liabilities | |||||||||||||
| Accounts Payable | $0 | $255 | $266 | $306 | $241 | $278 | $321 | $371 | $429 | $498 | $579 | $675 | $787 |
| Current Borrowing | $0 | $0 | $0 | $0 | $0 | $0 | $0 | $0 | $0 | $0 | $0 | $0 | $0 |
| Other Current Liabilities | $0 | $0 | $0 | $0 | $0 | $0 | $0 | $0 | $0 | $0 | $0 | $0 | $0 |
| Subtotal Current Liabilities | $0 | $255 | $266 | $306 | $241 | $278 | $321 | $371 | $429 | $498 | $579 | $675 | $787 |
| Long-term Liabilities | $0 | $0 | $0 | $0 | $0 | $0 | $0 | $0 | $0 | $0 | $0 | $0 | $0 |
| Total Liabilities | $0 | $255 | $266 | $306 | $241 | $278 | $321 | $371 | $429 | $498 | $579 | $675 | $787 |
| Paid-in Capital | $1,000 | $1,000 | $1,000 | $1,000 | $1,000 | $1,000 | $1,000 | $1,000 | $1,000 | $1,000 | $1,000 | $1,000 | $1,000 |
| Retained Earnings | ($720) | ($720) | ($720) | ($720) | ($720) | ($720) | ($720) | ($720) | ($720) | ($720) | ($720) | ($720) | ($720) |
| Earnings | $0 | $336 | $751 | $1,229 | $1,439 | $1,682 | $1,966 | $2,296 | $2,681 | $3,133 | $3,661 | $4,281 | $5,009 |
| Total Capital | $280 | $616 | $1,031 | $1,509 | $1,719 | $1,962 | $2,246 | $2,576 | $2,961 | $3,413 | $3,941 | $4,561 | $5,289 |
| Total Liabilities and Capital | $280 | $871 | $1,297 | $1,815 | $1,960 | $2,240 | $2,566 | $2,946 | $3,391 | $3,911 | $4,520 | $5,236 | $6,076 |
| Net Worth | $280 | $616 | $1,031 | $1,509 | $1,719 | $1,962 | $2,246 | $2,576 | $2,961 | $3,413 | $3,941 | $4,561 | $5,289 |

