
Burly Skate Shop
Executive Summary
Burly Skate Shop is a new apparel, shoe and skateboarding shop that caters to the youth and young adults in the Salem/Suburb community. Our focus is to provide apparel, shoes, boards and accessories in an upper scale, industrial chic environment. Our store will exemplify the latest in cutting edge products and trends. We expect to be, and will strive to position ourselves as, the top retail store servicing this particular market.
We are the first and only skateboard shop in the city of Suburb. Our market research within Suburb has indicated that local skaters are frustrated with current retailers in the nearest cities. Our intentions are to obtain 80% market share and become a central hub of shopping activity for the local skateboarding population, as well as for others who would enjoy wearing the latest trends and fashions. Burly will be located at 1234 Skate Rd N, Suburb, Oregon. This location places us squarely in the center of the residential and social areas frequented by our target market. We believe that this location is critical to our initial success and long-term growth.
Burly will be owned and managed by Ollie and Nollie Casperflip. Nollie Casperflip, the merchandising manager, has been the Founder and Executive Director of Operations for a foster-care and family advocacy group for the past 18 years. Nollie holds two Masters Degrees and taught at a local college for 9 years. Ollie Casperflip, personnel and marketing manager, has been the Executive Director of Administrations for the same foundation for the past 11 years. Ollie Casperflip holds a Masters Degree in Administration, and has been an avid skateboarder since the age of 14. Both owners have extensive experience working with people in the age range of the customer base – 12-25. In addition to raising their own son (a former skateboarder), the Casperflips’ work in the foster-care agency brought them into daily contact with children or parents in that age range.
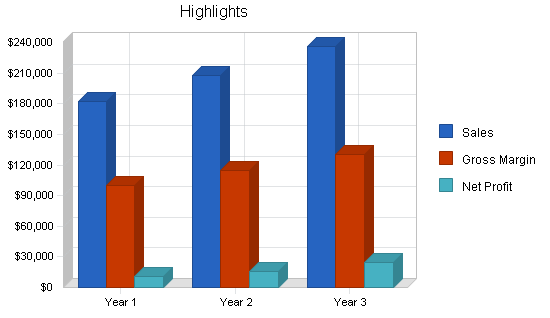
Our conservative sales forecasts, based on solid market research, will yield a net profit over $6,000 in the first year, increasing to almost $20,000 in year three. To support this plan and set it in motion, the owners are contributing $5,600 in cash, and another $1,200 in short-term assets. We are seeking an additional $50,000 in short-term loans, to be repaid over three years, to cover our start-up requirements.
1.1 Mission
Burly’s mission is to provide the highest quality, cutting edge, and newest merchandise in an industrial-chic atmosphere where they can meet, socialize, and learn from each other about the latest trends and moves. Our intention is to enhance the skateboard culture in our communities, by promoting drug-free and violence-free events in our communities.
1.2 Keys to Success
The primary keys to success for Burly are:
- SELL products that provide the latest styles of boards, clothing and equipment to our customers, and enable them to build a positive image identified with the skateboarding culture.
- PROVIDE custom services such as in-store grip application and tools to fix and apply newly purchased parts so that customers are retained to generate repeat purchases and send their friends.
- COMMUNICATE with our customer base through print magazine, newspaper advertising, and postcard mailings promoting skateboarder events, bringing in pro and semi pro skaters sponsored by manufacturing companies. Our website will be another avenue for marketing and sales.
- ESTABLISH a visible, accessible, friendly, and dynamic storefront and website to position us as the premier choice for our products and services within the marketplace and beyond.
- ENSURE through daily management practices the values of Burly’s mission are followed so that a successful and growth-oriented business is developed and maintained.
1.3 Objectives
Burly has established three firm objectives it wishes to achieve in the next five years:
- Four stores located in superb retail areas by the end of year five.
- Gross Margin of 45% or more.
- Net After-tax Profit above 15% of Sales.
Company Summary
Burly is organized as a partnership between Nollie and Ollie Casperflip.
We will be located at 1234 Skate Rd. N, Suburb, Oregon, with the Suburb Central Chariots bus stop on the corner, approximately three blocks from the Suburb skate park, in the highly trafficked School House Square Mall. Burly will be the only skate shop in Suburb, Oregon.
The hours of operation will be Monday – Thursday 11 a.m. – 8 p.m., Friday – Saturday 10 a.m. – 10 p.m., and Sunday 12 p.m. – 6 p.m.
All product purchases will be subject to the company’s mission of providing only high-quality, cutting-edge items.
2.1 Start-up Summary
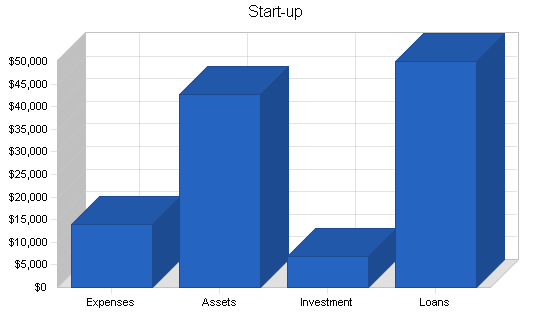
Burly’s costs are listed below. The company will start with three months’ inventory on hand for apparel and accessories, as this is the main revenue generator. The majority of the company’s assets will reside in inventory.
The purpose of this business plan is to secure a $50,000 small business loan. This supplemental financing is required to work on site preparation, inventory, and operational expenses.
The owners’ cash investment of $5,600 will be applied towards any required qualifications for small business loan and will be applied towards the start-up cost. The owners will also contribute current assets consisting of racks, hangers, shelves, etc. valued at approx. $1,200.
Successful operation and building a loyal customer base will allow Burly to be self sufficient and profitable at the end of one year.
| Start-up | |
| Requirements | |
| Start-up Expenses | |
| Legal | $250 |
| Stationery etc. | $300 |
| Remodeling | $3,000 |
| Web Site | $293 |
| Insurance | $1,100 |
| Rent | $3,750 |
| Research and Development | $1,000 |
| Expensed Equipment | $2,000 |
| Utilities/phone/POS system | $2,344 |
| Total Start-up Expenses | $14,037 |
| Start-up Assets | |
| Cash Required | $1,563 |
| Start-up Inventory | $40,000 |
| Other Current Assets | $1,200 |
| Long-term Assets | $0 |
| Total Assets | $42,763 |
| Total Requirements | $56,800 |
| Start-up Funding | |
| Start-up Expenses to Fund | $14,037 |
| Start-up Assets to Fund | $42,763 |
| Total Funding Required | $56,800 |
| Assets | |
| Non-cash Assets from Start-up | $41,200 |
| Cash Requirements from Start-up | $1,563 |
| Additional Cash Raised | $0 |
| Cash Balance on Starting Date | $1,563 |
| Total Assets | $42,763 |
| Liabilities and Capital | |
| Liabilities | |
| Current Borrowing | $50,000 |
| Long-term Liabilities | $0 |
| Accounts Payable (Outstanding Bills) | $0 |
| Other Current Liabilities (interest-free) | $0 |
| Total Liabilities | $50,000 |
| Capital | |
| Planned Investment | |
| Cathy Falgout | $2,800 |
| Claude Falgout | $2,800 |
| Current Assets | $1,200 |
| Additional Investment Requirement | $0 |
| Total Planned Investment | $6,800 |
| Loss at Start-up (Start-up Expenses) | ($14,037) |
| Total Capital | ($7,237) |
| Total Capital and Liabilities | $42,763 |
| Total Funding | $56,800 |
2.2 Company Ownership
Burly is organized as a partnership between Nollie Casperflip and Ollie Casperflip. Nollie Casperflip will handle all merchandising while Ollie Casperflip will handle all administrative duties. Both will share managerial duties.
Nollie Casperflip has been the Founder and Executive Director of Operations for a foster-care and family advocacy group, for the past 18 years. Nollie holds two Masters Degrees and was a Professor for 9 years.
Ollie Casperflip has been the Executive Director of Administrations for the same foundation for the past 11 years. Ollie Casperflip holds a Masters Degree in Administration, and has been an avid skateboarder since the age of 14.
Products
Burly will carry internationally-recognized brands. Our selections will cover skateboarding, snow boarding, and surfing. We will be purchasing through sales representatives and manufacturers in a variety of sizes, colors and style to fit our target market base. The greatest percentage of merchandise will be in shoes, followed by apparel, boards, and hardware.

Management will rely on customer feedback, suggestions, and sales reports to introduce or eliminate certain brands, styles and sizes.
Market Analysis Summary
The primary target customer of Burly will be the skateboarding, snow boarding, and surfing teen/young adult of Suburb and the greater Salem area. As we are situated in the epi-center of their residental community we believe they will make up the largest percentage of our customer base.
Another target customer of Burly will be, due to the popularity of the store, curiosity seekers. We expect to see an assortment of local residents from the community as well as seasonal purchasers during all boarding seasons.
4.1 Market Segmentation
Skateboarding, snow boarding, and surfing are popular pastimes for Northwest youth. We estimate a target population of 2,500 junior high and high school-aged students in Suburb, most of whom will visit Burly at least once, as the new cultural experience and the one and only skate shop in Suburb.
Our secondary target market consists of Salem youth, who represent a growing population of skateboarders, snow boarders, and surfers who will shop outside of the Salem area. The store is located in Suburb, a suburb of Salem, but accessible to Salem customers by car or bus.
The last area of potential customers is adults. There are hundreds of avid skateboarders who travel all the skate parks throughout the northwest, thus the importance of locating Burly just 3 blocks from the Suburb skate park. Other adults will bring their kids in to buy the most trendy school clothes, shoes, boards, accessories, and gifts, and may fund something for themselves while browsing. Our ambience and customer service will make them repeat customers.

| Market Analysis | |||||||
| Year 1 | Year 2 | Year 3 | Year 4 | Year 5 | |||
| Potential Customers | Growth | CAGR | |||||
| Keizer Youth | 15% | 2,500 | 2,875 | 3,306 | 3,802 | 4,372 | 15.00% |
| Salem Youth | 15% | 1,500 | 1,725 | 1,984 | 2,282 | 2,624 | 15.01% |
| Adults | 15% | 500 | 575 | 661 | 760 | 874 | 14.98% |
| Total | 15.00% | 4,500 | 5,175 | 5,951 | 6,844 | 7,870 | 15.00% |
4.2 Target Market Segment Strategy
Skateboarding, snow boarding and surfing have become new and fast growing industries in the Northwest today. Boarding is no longer a fad or a pastime but is here to stay. Movies, magazines, X-Games, Olympics, television, and video games all feature boarding sports. Burly is a part of this growing industry.
While our marketing efforts will differ slightly for Suburb and Salem youth, our sales strategies rely on a further differentiation in our target markets. Our younger customers can be generally classified as either trendsetters or trend followers:
- Trendsetters keep up with online chats about boards, manufacturers, new wheel technology, and new maneuvers. They are unafraid to pioneer the use of a new board style or clothing item if they feel it gives them an edge (aesthetically, socially, or in performance). They are willing to spend a great deal of money to be on the cutting edge, and in most circumstances, do this by ordering online or direct from the manufacturer to access items unavailable in the local area. Our challenge with these customers is to direct them to our custom-ordering capabilities, and to let them feel they have “discovered” a new trend on their own.
- Trend Followers, on the other hand, are anxious not to be seen as too far out of the mainstream, which means playing a constant game of “catch-up” with the trendsetters, requiring regular purchases of new equipment and clothing. They learn about new styles online and in magazines, but are more influenced by the local adoption of such styles by members of their cohort or by high-profile boarders they wish to emulate. When offered a choice, they are most likely to shop locally, so they can see, in the display of inventory, how their choice fits in relation to other products offered to their cohort. Our challenge with this group is to stay on top of local trends so as to keep in stock a good array of colors and accessories for the style-of-the-month.
Our older customers choose merchandise based on more personal needs – preferred styles and manufacturers generally outweigh “trendiness.” Although we do not have the expertise to serve older customers as a font of skateboarding experience, we hope that our convenient location will draw them in, and our selection and flexibility, with custom-ordering, will generate repeat business.
4.3 Industry Analysis
The skateboarding industry is expanding faster than ever. Although skateboarding merchandise is priced at a premium, people buy it because it provides them with fashionable yet durable products. In the last five years, skateboarding supplies from most manufacturers have become available online. With a click of the mouse, customers can see and compare prices on hundreds of items, from boards and accessories, to clothing and protective gear. This shift has served to stabilize prices, and to increase the accessibility of new skateboarding products in rural and outlying areas.
However, online shopping happens alone, in one’s home; it is not a social experience. Skateboarding is about seeing and being seen in the latest, coolest clothes, with a killer board, doing amazing, highly-skilled tricks, and sharing them with friends. Skateboarding is not a solitary sport, and solitary skateboard shopping goes against the grain for this sport.
The retail side of boarding (skateboarding and snow boarding) is highly fragmented, although the strength of the biggest manufacturers, in terms of advertising and sheer mass of product on the market, homogenizes the standard retailer’s inventory. Some smaller, home-grown operations both manufacturer and sell boards, doing especially well in urban areas on the West Coast.
Burly will combine the advantages of both models by offering a wide selection of boards, gear, and accessories from the major manufacturers, with custom-ordering capabilities for more unusual items. We will maintain an up-to-date catalogue of all the most recent products from smaller manufacturers on the West Coast, for customers to browse through while in the store.
4.3.1 Competition and Buying Patterns
Skateboarders are looking for two things: trendiness and high quality (often in that order). These customers are young, and easily influenced by peer pressure. They want to buy an item unique enough to express their individuality and sophistication about the technical sides of skateboarding, but not so avant-garde that it is difficult to use or confusing to their cohort.
Competitors
Burly is competing on two fronts – against local, custom manufacturers, and larger retail stores and chains. The following are two examples:
Competitor #1 is a custom board carver in Suburb who works exclusively with Baltic Birch. He has a strong online presence, and his unique styles are popular with trendsetters, since their custom design puts them outside the reach of customer buying only existing boards.
Competitor #2 is a retail skate and snowboarding shop in Salem. They also have stores in Mt. Hood and Portland. Competitor #2 has experienced, knowledgeable staff, and a great reputation among local skaters. We will be modeling much of our business on their success, while differentiating ourselves with custom-ordering capabilities and our suburban location.
Strategy and Implementation Summary
Burly’s goal is to provide specialty apparel, shoes, boards (skateboards, snow boards, etc.), hardware and miscellaneous specialty items (hats, wallets, bandanas, etc.) to the under-served market of the Suburb/Salem community.The major competitive retailers have left a hole in this market. There are two to four competitors in the general area. After surveying many potential customers, we have found that the general trend is people feel that they have no alternative but to go to one of these stores. Many indicate that they would welcome an alternative in their locality. This particular population of customers is growing.
Our intention is to gain 80% of this market share by focusing on our niche positioning, neighborhood location, popular brands, and special promotions.
5.1 Competitive Edge
Burly offers an enhanced shopping experience, while being competitively priced and keeping up with the latest trends of the world wide market. Our stellar customer service separates Burly from the rest.
- Sponsorship of up-and-coming talented skateboarders throughout the community. These sponsored youth will distribute 10% off business cards while they skate at local skate parks throughout Oregon. They will also demonstrate Burly apparel and equipment.
- Our location in the community will offer closer access to our target customer base.
- Special sales and package deals featuring complete beginner packages. Burly plans to provide beginning lessons at a future date.
5.2 Marketing Strategy
Our marketing strategy will focus heavily on sales promotion, niche positioning in the market and customer service with loyalty and retention in sales.
- The marketing budget will range from 15% to 20% of our gross annual sales.
- Our promotions will always stay in tune with our company objectives and mission statement.
Initial marketing will begin with flyers and leaflets in the skate park for two months before we open, to alert our potential customers to our new store. Our Grand Opening, in May, will include discount prices, and we will give away discount cards to the first 50 customers that day.
Future marketing programs include radio spots, ads in the local high school newspaper, and leafletting around other high schools and skate parks in the Salem suburbs.
5.3 Sales Strategy
- We will utilize the Retail POS software with every sales transaction. With each purchase, the software will record and maintain in its database the customer’s name, address and purchases. This information will be used with our direct mailing program to focus on the top 50% of our customers.
- We will offer a 14 day return/exchange policy to build trust with our customers and maintain retention and loyalty.
5.3.1 Sales Forecast
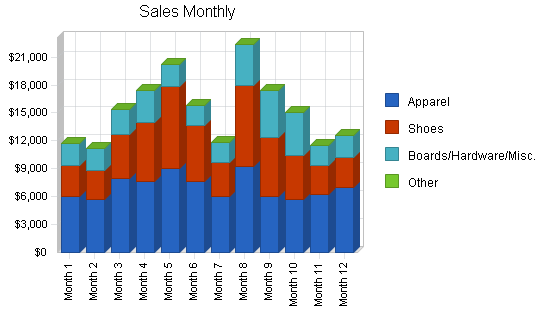
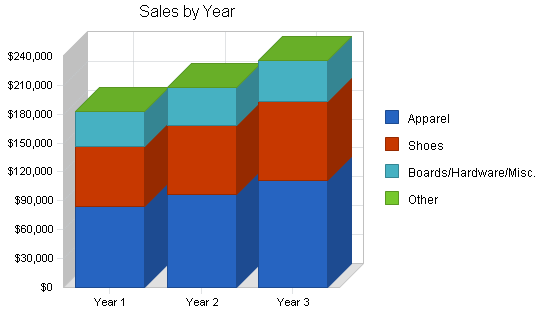
The following table and chart give a highlight of forecasted sales. We expect sales to start off slowly but increase extensively during the summer skateboard season. We also expect to see increased sales during the Christmas holiday shopping season and the winter snow boarding season. Burly has planned for a growth rate of 15% annually. As we build name recognition and status in the community, we expect to gain a larger percentage of the market share and increase our customer base, and consequently see an increase in revenue.
Based on research into other skateboard and snow board retailers, we expect COGS at 45% of retail prices for all categories.
| Sales Forecast | |||
| Year 1 | Year 2 | Year 3 | |
| Sales | |||
| Apparel | $84,000 | $96,600 | $111,090 |
| Shoes | $62,260 | $71,599 | $82,339 |
| Boards/Hardware/Misc. | $36,190 | $39,809 | $42,660 |
| Other | $0 | $0 | $0 |
| Total Sales | $182,450 | $208,008 | $236,089 |
| Direct Cost of Sales | Year 1 | Year 2 | Year 3 |
| Apparel/Shoes | $65,817 | $75,690 | $87,043 |
| Boards/Hardware/Misc. | $16,286 | $17,914 | $19,197 |
| Subtotal Direct Cost of Sales | $82,103 | $93,604 | $106,240 |
5.4 Milestones
The accompanying milestone chart highlights our plan with specific dates. This schedule reflects our strong committment to organization and detail.

| Milestones | |||||
| Milestone | Start Date | End Date | Budget | Manager | Department |
| Grand Opening | 5/1/2004 | 6/1/2004 | $400 | Ollie | All Depts. |
| Sponsorship | 5/1/2004 | 7/1/2004 | $800 | Ollie | Marketing |
| Summer Sale | 7/15/2004 | 8/15/2004 | $250 | Ollie | Skateboards |
| Website Completion | 5/1/2004 | 9/1/2004 | $293 | Sticks | Web |
| Online Shopping | 5/1/2004 | 10/15/2004 | $250 | Sticks | Web |
| Christmas Sale | 12/1/2004 | 12/25/2004 | $500 | Ollie | All Depts. |
| Winter Sale | 1/15/2005 | 2/15/2005 | $500 | Ollie | Snowboards |
| Special Promo | 3/15/2005 | 4/15/2005 | $250 | Ollie | All Depts. |
| Totals | $3,243 | ||||
Web Plan Summary
Burly plans to develop a Web presence in the first year. We will add e-commerce to the business model at the end of the first year. Burly’s website will be a secondary channel of business serving as advertisement for the company, as well as its online “home.”
The website will showcase the available products for purchase. Additional tips and inspirational ideas will focus on gifts and gift giving. To further show off our expertise, Burly’s website will provide a resource area, offering articles, research, product information and website links of interest to our customers.
Burly’s website will mirror the image and brands of products showcased in the store, while keeping up with the latest trends in user interface design. The key to the website strategy will be combining a well designed front-end, with a back-end capable of capturing “hits” and customer data for use in future marketing endeavors.
6.1 Website Marketing Strategy
Market strategy in an Internet retail business depends on recognition of expertise by the consumer. For Burly, it will start with our existing brick-and-mortar store customer base, informing them of our Internet presence and encouraging their word-of-mouth recommendations to others. Further awareness will be heightened by utilizing search engine marketing, banner advertising, and affiliates.
6.2 Development Requirements
Costs that Burly expects to incur with development of its website include:
Development Costs
- Site Design & Implementation – Free. Burly will utilize the programming services of Sticks Casperflip, our son. Sticks Casperflip has 4 years of experience in Web development, including Flash programming, site updating, and backend Shopping Cart design/updating. Burly is grateful for the significant cost savings and advice that this connection will provide.
Ongoing Costs
- Website name registration – $70 for 2 years.
- Site Hosting – $22.95 per month.
- Search Engine Registration – $200 per year.
- Site Design Changes – Free (provided by Sticks Casperflip).
Management Summary
Employees will be encouraged to work within their creative, physical, and intellectual boundaries. All duties will be divided and delegated according to strengths and weaknesses. At Burly we will expect a high degree of customer service skills and personality as this is essential to our success. The Casperflips will use their combined experience in administration to jointly manage the store and its employees. Nollie will generally have responsibility for inventory ordering and management, and accounting, while Ollie will be responsible for marketing and sales, and will directly manage the store’s employees.
Nollie and Ollie Casperflip will assess the productivity and perform informal evaluations of all employees every six months. These bi-annual evaluations are conducive to the continued growth of our small business.
7.1 Personnel Plan
The personnel plan is included in the following table below. In addition to the Casperflips, there will be one full-time employee and one part-time employee working 10-20 hours per week. The full-time employee will be paid at a rate of $10.00 per hour and the one part-time employee will be paid at a rate of $8.00 per hour. All employees will benefit from a one day paid holiday on their respective birthdays and one week of paid vacation after twelve months of employment. We anticipate a 5% pay increase annually based upon performance.
At this time medical benefits will not be offered to employees. As profits increase, medical benefits will be offered to all employees, probably by year three.
The Casperflips plan to draw only a minimal salary in the first few years.
| Personnel Plan | |||
| Year 1 | Year 2 | Year 3 | |
| The Casperflips (Owners) | $15,000 | $20,000 | $20,000 |
| Full-Time | $20,760 | $21,798 | $22,888 |
| Part-Time | $8,124 | $8,531 | $8,958 |
| Other | $0 | $0 | $0 |
| Total People | 0 | 0 | 0 |
| Total Payroll | $43,884 | $50,329 | $51,846 |
Financial Plan
Burly’s growth will be moderate and the cash balance will always be positive. As a retailer, we will not be selling on credit. We will accept cash, checks, and all major credit cards. TeleCheck Services will be used as the check guaranty system to help reduce the percentage of loss on bad checks. Marketing and advertising will range from 15% to 20% of sales. We will continue to reinvest residual profits into company expansion, and personnel.
8.1 Important Assumptions
Burly does not sell on credit; however, layaway is an option. We accept cash and checks, Visa, MasterCard, Discover and American Express. All sales paid via credit cards will be deposited in our business checking account within 48 hours. Our business checking account will be with a local bank. Our assumptions about loan and tax rates are listed below.
| General Assumptions | |||
| Year 1 | Year 2 | Year 3 | |
| Plan Month | 1 | 2 | 3 |
| Current Interest Rate | 10.00% | 10.00% | 10.00% |
| Long-term Interest Rate | 10.00% | 10.00% | 10.00% |
| Tax Rate | 30.00% | 30.00% | 30.00% |
| Other | 0 | 0 | 0 |
8.2 Break-even Analysis
Our break-even analysis is summarized by the following chart and table. With average monthly fixed costs for the first year of $7,284, we need to sell $13,243 of merchandise each month to break even. We will surpass this minimum amount in most months of the first year.

| Break-even Analysis | |
| Monthly Revenue Break-even | $12,245 |
| Assumptions: | |
| Average Percent Variable Cost | 45% |
| Estimated Monthly Fixed Cost | $6,735 |
8.3 Projected Profit and Loss
The following chart and table indicate our projected profit and loss. We expect to make a modest profit in the first year, as we build name recognition and a loyal local clientele, with higher profits thereafter, despite increasing the personnel payments for all employees and offering health insurance by year 3.


| Pro Forma Profit and Loss | |||
| Year 1 | Year 2 | Year 3 | |
| Sales | $182,450 | $208,008 | $236,089 |
| Direct Cost of Sales | $82,103 | $93,604 | $106,240 |
| Other | $0 | $0 | $0 |
| Total Cost of Sales | $82,103 | $93,604 | $106,240 |
| Gross Margin | $100,348 | $114,404 | $129,849 |
| Gross Margin % | 55.00% | 55.00% | 55.00% |
| Expenses | |||
| Payroll | $43,884 | $50,329 | $51,846 |
| Marketing/Promotion | $9,600 | $11,040 | $12,696 |
| Depreciation | $0 | $0 | $0 |
| Rent | $22,500 | $23,175 | $23,870 |
| Utilities | $2,700 | $2,781 | $2,865 |
| Insurance | $576 | $576 | $576 |
| Payroll Taxes | $0 | $0 | $0 |
| Telephone | $1,560 | $1,560 | $1,560 |
| Total Operating Expenses | $80,820 | $89,461 | $93,413 |
| Profit Before Interest and Taxes | $19,528 | $24,943 | $36,436 |
| EBITDA | $19,528 | $24,943 | $36,436 |
| Interest Expense | $4,098 | $2,501 | $834 |
| Taxes Incurred | $4,629 | $6,733 | $10,681 |
| Net Profit | $10,801 | $15,710 | $24,922 |
| Net Profit/Sales | 5.92% | 7.55% | 10.56% |
8.4 Projected Cash Flow
The following table shows projected cash flow. It includes repayment of the short-term loan principal, but does not list owners’ dividends – these are included as regular payments in the personnel table, for the purposes of this plan.

| Pro Forma Cash Flow | |||
| Year 1 | Year 2 | Year 3 | |
| Cash Received | |||
| Cash from Operations | |||
| Cash Sales | $182,450 | $208,008 | $236,089 |
| Subtotal Cash from Operations | $182,450 | $208,008 | $236,089 |
| Additional Cash Received | |||
| Sales Tax, VAT, HST/GST Received | $0 | $0 | $0 |
| New Current Borrowing | $0 | $0 | $0 |
| New Other Liabilities (interest-free) | $0 | $0 | $0 |
| New Long-term Liabilities | $0 | $0 | $0 |
| Sales of Other Current Assets | $0 | $0 | $0 |
| Sales of Long-term Assets | $0 | $0 | $0 |
| New Investment Received | $0 | $0 | $0 |
| Subtotal Cash Received | $182,450 | $208,008 | $236,089 |
| Expenditures | Year 1 | Year 2 | Year 3 |
| Expenditures from Operations | |||
| Cash Spending | $43,884 | $50,329 | $51,846 |
| Bill Payments | $84,775 | $140,330 | $158,848 |
| Subtotal Spent on Operations | $128,659 | $190,659 | $210,694 |
| Additional Cash Spent | |||
| Sales Tax, VAT, HST/GST Paid Out | $0 | $0 | $0 |
| Principal Repayment of Current Borrowing | $16,656 | $16,672 | $16,672 |
| Other Liabilities Principal Repayment | $0 | $0 | $0 |
| Long-term Liabilities Principal Repayment | $0 | $0 | $0 |
| Purchase Other Current Assets | $0 | $0 | $0 |
| Purchase Long-term Assets | $0 | $0 | $0 |
| Dividends | $0 | $0 | $0 |
| Subtotal Cash Spent | $145,315 | $207,331 | $227,366 |
| Net Cash Flow | $37,135 | $677 | $8,723 |
| Cash Balance | $38,698 | $39,375 | $48,098 |
8.5 Projected Balance Sheet
The following table shows the projected balance sheet. It shows a steadily increasing net worth, as we gain market share and pay off our loan.
| Pro Forma Balance Sheet | |||
| Year 1 | Year 2 | Year 3 | |
| Assets | |||
| Current Assets | |||
| Cash | $38,698 | $39,375 | $48,098 |
| Inventory | $6,237 | $7,111 | $8,071 |
| Other Current Assets | $1,200 | $1,200 | $1,200 |
| Total Current Assets | $46,135 | $47,686 | $57,369 |
| Long-term Assets | |||
| Long-term Assets | $0 | $0 | $0 |
| Accumulated Depreciation | $0 | $0 | $0 |
| Total Long-term Assets | $0 | $0 | $0 |
| Total Assets | $46,135 | $47,686 | $57,369 |
| Liabilities and Capital | Year 1 | Year 2 | Year 3 |
| Current Liabilities | |||
| Accounts Payable | $9,227 | $11,741 | $13,174 |
| Current Borrowing | $33,344 | $16,672 | $0 |
| Other Current Liabilities | $0 | $0 | $0 |
| Subtotal Current Liabilities | $42,571 | $28,413 | $13,174 |
| Long-term Liabilities | $0 | $0 | $0 |
| Total Liabilities | $42,571 | $28,413 | $13,174 |
| Paid-in Capital | $6,800 | $6,800 | $6,800 |
| Retained Earnings | ($14,037) | ($3,236) | $12,474 |
| Earnings | $10,801 | $15,710 | $24,922 |
| Total Capital | $3,564 | $19,274 | $44,195 |
| Total Liabilities and Capital | $46,135 | $47,686 | $57,369 |
| Net Worth | $3,564 | $19,274 | $44,195 |
8.6 Business Ratios
Business ratios for the years of this plan are shown below. Industry profile ratios, for comparison, are based on the Standard Industrial Classification (SIC) code 5941, Sporting Goods and Bicycle Shops.
| Ratio Analysis | ||||
| Year 1 | Year 2 | Year 3 | Industry Profile | |
| Sales Growth | 0.00% | 14.01% | 13.50% | 4.63% |
| Percent of Total Assets | ||||
| Inventory | 13.52% | 14.91% | 14.07% | 36.51% |
| Other Current Assets | 2.60% | 2.52% | 2.09% | 25.52% |
| Total Current Assets | 100.00% | 100.00% | 100.00% | 77.61% |
| Long-term Assets | 0.00% | 0.00% | 0.00% | 22.39% |
| Total Assets | 100.00% | 100.00% | 100.00% | 100.00% |
| Current Liabilities | 92.28% | 59.58% | 22.96% | 35.84% |
| Long-term Liabilities | 0.00% | 0.00% | 0.00% | 15.20% |
| Total Liabilities | 92.28% | 59.58% | 22.96% | 51.04% |
| Net Worth | 7.72% | 40.42% | 77.04% | 48.96% |
| Percent of Sales | ||||
| Sales | 100.00% | 100.00% | 100.00% | 100.00% |
| Gross Margin | 55.00% | 55.00% | 55.00% | 30.04% |
| Selling, General & Administrative Expenses | 47.89% | 44.52% | 41.65% | 19.81% |
| Advertising Expenses | 0.00% | 0.00% | 0.00% | 1.28% |
| Profit Before Interest and Taxes | 10.70% | 11.99% | 15.43% | 0.66% |
| Main Ratios | ||||
| Current | 1.08 | 1.68 | 4.35 | 1.90 |
| Quick | 0.94 | 1.43 | 3.74 | 0.74 |
| Total Debt to Total Assets | 92.28% | 59.58% | 22.96% | 56.14% |
| Pre-tax Return on Net Worth | 432.95% | 116.44% | 80.56% | 1.41% |
| Pre-tax Return on Assets | 33.44% | 47.06% | 62.06% | 3.22% |
| Additional Ratios | Year 1 | Year 2 | Year 3 | |
| Net Profit Margin | 5.92% | 7.55% | 10.56% | n.a |
| Return on Equity | 303.07% | 81.51% | 56.39% | n.a |
| Activity Ratios | ||||
| Inventory Turnover | 5.97 | 14.03 | 14.00 | n.a |
| Accounts Payable Turnover | 10.19 | 12.17 | 12.17 | n.a |
| Payment Days | 27 | 27 | 28 | n.a |
| Total Asset Turnover | 3.95 | 4.36 | 4.12 | n.a |
| Debt Ratios | ||||
| Debt to Net Worth | 11.95 | 1.47 | 0.30 | n.a |
| Current Liab. to Liab. | 1.00 | 1.00 | 1.00 | n.a |
| Liquidity Ratios | ||||
| Net Working Capital | $3,564 | $19,274 | $44,195 | n.a |
| Interest Coverage | 4.77 | 9.97 | 43.71 | n.a |
| Additional Ratios | ||||
| Assets to Sales | 0.25 | 0.23 | 0.24 | n.a |
| Current Debt/Total Assets | 92% | 60% | 23% | n.a |
| Acid Test | 0.94 | 1.43 | 3.74 | n.a |
| Sales/Net Worth | 51.19 | 10.79 | 5.34 | n.a |
| Dividend Payout | 0.00 | 0.00 | 0.00 | n.a |
Appendix
| Sales Forecast | |||||||||||||
| Month 1 | Month 2 | Month 3 | Month 4 | Month 5 | Month 6 | Month 7 | Month 8 | Month 9 | Month 10 | Month 11 | Month 12 | ||
| Sales | |||||||||||||
| Apparel | 0% | $6,000 | $5,700 | $8,000 | $7,600 | $9,000 | $7,600 | $6,000 | $9,200 | $6,000 | $5,700 | $6,200 | $7,000 |
| Shoes | 0% | $3,300 | $3,160 | $4,700 | $6,400 | $8,800 | $6,000 | $3,700 | $8,800 | $6,400 | $4,700 | $3,100 | $3,200 |
| Boards/Hardware/Misc. | 0% | $2,400 | $2,300 | $2,680 | $3,360 | $2,450 | $2,200 | $2,100 | $4,400 | $5,000 | $4,700 | $2,200 | $2,400 |
| Other | 0% | $0 | $0 | $0 | $0 | $0 | $0 | $0 | $0 | $0 | $0 | $0 | $0 |
| Total Sales | $11,700 | $11,160 | $15,380 | $17,360 | $20,250 | $15,800 | $11,800 | $22,400 | $17,400 | $15,100 | $11,500 | $12,600 | |
| Direct Cost of Sales | Month 1 | Month 2 | Month 3 | Month 4 | Month 5 | Month 6 | Month 7 | Month 8 | Month 9 | Month 10 | Month 11 | Month 12 | |
| Apparel/Shoes | $4,185 | $3,987 | $5,715 | $6,300 | $8,010 | $6,120 | $4,365 | $8,100 | $5,580 | $4,680 | $4,185 | $4,590 | |
| Boards/Hardware/Misc. | $1,080 | $1,035 | $1,206 | $1,512 | $1,103 | $990 | $945 | $1,980 | $2,250 | $2,115 | $990 | $1,080 | |
| Subtotal Direct Cost of Sales | $5,265 | $5,022 | $6,921 | $7,812 | $9,113 | $7,110 | $5,310 | $10,080 | $7,830 | $6,795 | $5,175 | $5,670 | |
| Personnel Plan | |||||||||||||
| Month 1 | Month 2 | Month 3 | Month 4 | Month 5 | Month 6 | Month 7 | Month 8 | Month 9 | Month 10 | Month 11 | Month 12 | ||
| The Casperflips (Owners) | 0% | $1,250 | $1,250 | $1,250 | $1,250 | $1,250 | $1,250 | $1,250 | $1,250 | $1,250 | $1,250 | $1,250 | $1,250 |
| Full-Time | 0% | $1,730 | $1,730 | $1,730 | $1,730 | $1,730 | $1,730 | $1,730 | $1,730 | $1,730 | $1,730 | $1,730 | $1,730 |
| Part-Time | 0% | $677 | $677 | $677 | $677 | $677 | $677 | $677 | $677 | $677 | $677 | $677 | $677 |
| Other | 0% | $0 | $0 | $0 | $0 | $0 | $0 | $0 | $0 | $0 | $0 | $0 | $0 |
| Total People | 0 | 0 | 0 | 0 | 0 | 0 | 0 | 0 | 0 | 0 | 0 | 0 | |
| Total Payroll | $3,657 | $3,657 | $3,657 | $3,657 | $3,657 | $3,657 | $3,657 | $3,657 | $3,657 | $3,657 | $3,657 | $3,657 | |
| General Assumptions | |||||||||||||
| Month 1 | Month 2 | Month 3 | Month 4 | Month 5 | Month 6 | Month 7 | Month 8 | Month 9 | Month 10 | Month 11 | Month 12 | ||
| Plan Month | 1 | 2 | 3 | 4 | 5 | 6 | 7 | 8 | 9 | 10 | 11 | 12 | |
| Current Interest Rate | 10.00% | 10.00% | 10.00% | 10.00% | 10.00% | 10.00% | 10.00% | 10.00% | 10.00% | 10.00% | 10.00% | 10.00% | |
| Long-term Interest Rate | 10.00% | 10.00% | 10.00% | 10.00% | 10.00% | 10.00% | 10.00% | 10.00% | 10.00% | 10.00% | 10.00% | 10.00% | |
| Tax Rate | 30.00% | 30.00% | 30.00% | 30.00% | 30.00% | 30.00% | 30.00% | 30.00% | 30.00% | 30.00% | 30.00% | 30.00% | |
| Other | 0 | 0 | 0 | 0 | 0 | 0 | 0 | 0 | 0 | 0 | 0 | 0 | |
| Pro Forma Profit and Loss | |||||||||||||
| Month 1 | Month 2 | Month 3 | Month 4 | Month 5 | Month 6 | Month 7 | Month 8 | Month 9 | Month 10 | Month 11 | Month 12 | ||
| Sales | $11,700 | $11,160 | $15,380 | $17,360 | $20,250 | $15,800 | $11,800 | $22,400 | $17,400 | $15,100 | $11,500 | $12,600 | |
| Direct Cost of Sales | $5,265 | $5,022 | $6,921 | $7,812 | $9,113 | $7,110 | $5,310 | $10,080 | $7,830 | $6,795 | $5,175 | $5,670 | |
| Other | $0 | $0 | $0 | $0 | $0 | $0 | $0 | $0 | $0 | $0 | $0 | $0 | |
| Total Cost of Sales | $5,265 | $5,022 | $6,921 | $7,812 | $9,113 | $7,110 | $5,310 | $10,080 | $7,830 | $6,795 | $5,175 | $5,670 | |
| Gross Margin | $6,435 | $6,138 | $8,459 | $9,548 | $11,138 | $8,690 | $6,490 | $12,320 | $9,570 | $8,305 | $6,325 | $6,930 | |
| Gross Margin % | 55.00% | 55.00% | 55.00% | 55.00% | 55.00% | 55.00% | 55.00% | 55.00% | 55.00% | 55.00% | 55.00% | 55.00% | |
| Expenses | |||||||||||||
| Payroll | $3,657 | $3,657 | $3,657 | $3,657 | $3,657 | $3,657 | $3,657 | $3,657 | $3,657 | $3,657 | $3,657 | $3,657 | |
| Marketing/Promotion | $800 | $800 | $800 | $800 | $800 | $800 | $800 | $800 | $800 | $800 | $800 | $800 | |
| Depreciation | $0 | $0 | $0 | $0 | $0 | $0 | $0 | $0 | $0 | $0 | $0 | $0 | |
| Rent | $1,875 | $1,875 | $1,875 | $1,875 | $1,875 | $1,875 | $1,875 | $1,875 | $1,875 | $1,875 | $1,875 | $1,875 | |
| Utilities | $225 | $225 | $225 | $225 | $225 | $225 | $225 | $225 | $225 | $225 | $225 | $225 | |
| Insurance | $48 | $48 | $48 | $48 | $48 | $48 | $48 | $48 | $48 | $48 | $48 | $48 | |
| Payroll Taxes | 15% | $0 | $0 | $0 | $0 | $0 | $0 | $0 | $0 | $0 | $0 | $0 | $0 |
| Telephone | $130 | $130 | $130 | $130 | $130 | $130 | $130 | $130 | $130 | $130 | $130 | $130 | |
| Total Operating Expenses | $6,735 | $6,735 | $6,735 | $6,735 | $6,735 | $6,735 | $6,735 | $6,735 | $6,735 | $6,735 | $6,735 | $6,735 | |
| Profit Before Interest and Taxes | ($300) | ($597) | $1,724 | $2,813 | $4,403 | $1,955 | ($245) | $5,585 | $2,835 | $1,570 | ($410) | $195 | |
| EBITDA | ($300) | ($597) | $1,724 | $2,813 | $4,403 | $1,955 | ($245) | $5,585 | $2,835 | $1,570 | ($410) | $195 | |
| Interest Expense | $405 | $394 | $382 | $370 | $359 | $347 | $336 | $324 | $313 | $301 | $289 | $278 | |
| Taxes Incurred | ($212) | ($297) | $403 | $733 | $1,213 | $482 | ($174) | $1,578 | $757 | $381 | ($210) | ($25) | |
| Net Profit | ($494) | ($693) | $939 | $1,710 | $2,831 | $1,125 | ($406) | $3,683 | $1,766 | $888 | ($490) | ($58) | |
| Net Profit/Sales | -4.22% | -6.21% | 6.11% | 9.85% | 13.98% | 7.12% | -3.44% | 16.44% | 10.15% | 5.88% | -4.26% | -0.46% | |
| Pro Forma Cash Flow | |||||||||||||
| Month 1 | Month 2 | Month 3 | Month 4 | Month 5 | Month 6 | Month 7 | Month 8 | Month 9 | Month 10 | Month 11 | Month 12 | ||
| Cash Received | |||||||||||||
| Cash from Operations | |||||||||||||
| Cash Sales | $11,700 | $11,160 | $15,380 | $17,360 | $20,250 | $15,800 | $11,800 | $22,400 | $17,400 | $15,100 | $11,500 | $12,600 | |
| Subtotal Cash from Operations | $11,700 | $11,160 | $15,380 | $17,360 | $20,250 | $15,800 | $11,800 | $22,400 | $17,400 | $15,100 | $11,500 | $12,600 | |
| Additional Cash Received | |||||||||||||
| Sales Tax, VAT, HST/GST Received | 0.00% | $0 | $0 | $0 | $0 | $0 | $0 | $0 | $0 | $0 | $0 | $0 | $0 |
| New Current Borrowing | $0 | $0 | $0 | $0 | $0 | $0 | $0 | $0 | $0 | $0 | $0 | $0 | |
| New Other Liabilities (interest-free) | $0 | $0 | $0 | $0 | $0 | $0 | $0 | $0 | $0 | $0 | $0 | $0 | |
| New Long-term Liabilities | $0 | $0 | $0 | $0 | $0 | $0 | $0 | $0 | $0 | $0 | $0 | $0 | |
| Sales of Other Current Assets | $0 | $0 | $0 | $0 | $0 | $0 | $0 | $0 | $0 | $0 | $0 | $0 | |
| Sales of Long-term Assets | $0 | $0 | $0 | $0 | $0 | $0 | $0 | $0 | $0 | $0 | $0 | $0 | |
| New Investment Received | $0 | $0 | $0 | $0 | $0 | $0 | $0 | $0 | $0 | $0 | $0 | $0 | |
| Subtotal Cash Received | $11,700 | $11,160 | $15,380 | $17,360 | $20,250 | $15,800 | $11,800 | $22,400 | $17,400 | $15,100 | $11,500 | $12,600 | |
| Expenditures | Month 1 | Month 2 | Month 3 | Month 4 | Month 5 | Month 6 | Month 7 | Month 8 | Month 9 | Month 10 | Month 11 | Month 12 | |
| Expenditures from Operations | |||||||||||||
| Cash Spending | $3,657 | $3,657 | $3,657 | $3,657 | $3,657 | $3,657 | $3,657 | $3,657 | $3,657 | $3,657 | $3,657 | $3,657 | |
| Bill Payments | $109 | $3,268 | $3,197 | $3,873 | $4,335 | $8,806 | $8,740 | $7,027 | $19,947 | $9,499 | $9,321 | $6,650 | |
| Subtotal Spent on Operations | $3,766 | $6,925 | $6,854 | $7,530 | $7,992 | $12,463 | $12,397 | $10,684 | $23,604 | $13,156 | $12,978 | $10,307 | |
| Additional Cash Spent | |||||||||||||
| Sales Tax, VAT, HST/GST Paid Out | $0 | $0 | $0 | $0 | $0 | $0 | $0 | $0 | $0 | $0 | $0 | $0 | |
| Principal Repayment of Current Borrowing | $1,388 | $1,388 | $1,388 | $1,388 | $1,388 | $1,388 | $1,388 | $1,388 | $1,388 | $1,388 | $1,388 | $1,388 | |
| Other Liabilities Principal Repayment | $0 | $0 | $0 | $0 | $0 | $0 | $0 | $0 | $0 | $0 | $0 | $0 | |
| Long-term Liabilities Principal Repayment | $0 | $0 | $0 | $0 | $0 | $0 | $0 | $0 | $0 | $0 | $0 | $0 | |
| Purchase Other Current Assets | $0 | $0 | $0 | $0 | $0 | $0 | $0 | $0 | $0 | $0 | $0 | $0 | |
| Purchase Long-term Assets | $0 | $0 | $0 | $0 | $0 | $0 | $0 | $0 | $0 | $0 | $0 | $0 | |
| Dividends | $0 | $0 | $0 | $0 | $0 | $0 | $0 | $0 | $0 | $0 | $0 | $0 | |
| Subtotal Cash Spent | $5,154 | $8,313 | $8,242 | $8,918 | $9,380 | $13,851 | $13,785 | $12,072 | $24,992 | $14,544 | $14,366 | $11,695 | |
| Net Cash Flow | $6,546 | $2,847 | $7,138 | $8,442 | $10,870 | $1,949 | ($1,985) | $10,328 | ($7,592) | $556 | ($2,866) | $905 | |
| Cash Balance | $8,109 | $10,956 | $18,093 | $26,535 | $37,405 | $39,353 | $37,368 | $47,696 | $40,104 | $40,659 | $37,794 | $38,698 | |
| Pro Forma Balance Sheet | |||||||||||||
| Month 1 | Month 2 | Month 3 | Month 4 | Month 5 | Month 6 | Month 7 | Month 8 | Month 9 | Month 10 | Month 11 | Month 12 | ||
| Assets | Starting Balances | ||||||||||||
| Current Assets | |||||||||||||
| Cash | $1,563 | $8,109 | $10,956 | $18,093 | $26,535 | $37,405 | $39,353 | $37,368 | $47,696 | $40,104 | $40,659 | $37,794 | $38,698 |
| Inventory | $40,000 | $34,735 | $29,713 | $22,792 | $14,980 | $10,024 | $7,821 | $5,841 | $11,088 | $8,613 | $7,475 | $5,693 | $6,237 |
| Other Current Assets | $1,200 | $1,200 | $1,200 | $1,200 | $1,200 | $1,200 | $1,200 | $1,200 | $1,200 | $1,200 | $1,200 | $1,200 | $1,200 |
| Total Current Assets | $42,763 | $44,044 | $41,869 | $42,085 | $42,715 | $48,629 | $48,374 | $44,409 | $59,984 | $49,917 | $49,334 | $44,686 | $46,135 |
| Long-term Assets | |||||||||||||
| Long-term Assets | $0 | $0 | $0 | $0 | $0 | $0 | $0 | $0 | $0 | $0 | $0 | $0 | $0 |
| Accumulated Depreciation | $0 | $0 | $0 | $0 | $0 | $0 | $0 | $0 | $0 | $0 | $0 | $0 | $0 |
| Total Long-term Assets | $0 | $0 | $0 | $0 | $0 | $0 | $0 | $0 | $0 | $0 | $0 | $0 | $0 |
| Total Assets | $42,763 | $44,044 | $41,869 | $42,085 | $42,715 | $48,629 | $48,374 | $44,409 | $59,984 | $49,917 | $49,334 | $44,686 | $46,135 |
| Liabilities and Capital | Month 1 | Month 2 | Month 3 | Month 4 | Month 5 | Month 6 | Month 7 | Month 8 | Month 9 | Month 10 | Month 11 | Month 12 | |
| Current Liabilities | |||||||||||||
| Accounts Payable | $0 | $3,163 | $3,069 | $3,734 | $4,042 | $8,513 | $8,521 | $6,351 | $19,630 | $9,186 | $9,102 | $6,332 | $9,227 |
| Current Borrowing | $50,000 | $48,612 | $47,224 | $45,836 | $44,448 | $43,060 | $41,672 | $40,284 | $38,896 | $37,508 | $36,120 | $34,732 | $33,344 |
| Other Current Liabilities | $0 | $0 | $0 | $0 | $0 | $0 | $0 | $0 | $0 | $0 | $0 | $0 | $0 |
| Subtotal Current Liabilities | $50,000 | $51,775 | $50,293 | $49,570 | $48,490 | $51,573 | $50,193 | $46,635 | $58,526 | $46,694 | $45,222 | $41,064 | $42,571 |
| Long-term Liabilities | $0 | $0 | $0 | $0 | $0 | $0 | $0 | $0 | $0 | $0 | $0 | $0 | $0 |
| Total Liabilities | $50,000 | $51,775 | $50,293 | $49,570 | $48,490 | $51,573 | $50,193 | $46,635 | $58,526 | $46,694 | $45,222 | $41,064 | $42,571 |
| Paid-in Capital | $6,800 | $6,800 | $6,800 | $6,800 | $6,800 | $6,800 | $6,800 | $6,800 | $6,800 | $6,800 | $6,800 | $6,800 | $6,800 |
| Retained Earnings | ($14,037) | ($14,037) | ($14,037) | ($14,037) | ($14,037) | ($14,037) | ($14,037) | ($14,037) | ($14,037) | ($14,037) | ($14,037) | ($14,037) | ($14,037) |
| Earnings | $0 | ($494) | ($1,187) | ($248) | $1,462 | $4,293 | $5,418 | $5,012 | $8,694 | $10,460 | $11,348 | $10,859 | $10,801 |
| Total Capital | ($7,237) | ($7,731) | ($8,424) | ($7,484) | ($5,775) | ($2,944) | ($1,819) | ($2,225) | $1,457 | $3,223 | $4,111 | $3,622 | $3,564 |
| Total Liabilities and Capital | $42,763 | $44,044 | $41,869 | $42,085 | $42,715 | $48,629 | $48,374 | $44,409 | $59,984 | $49,917 | $49,334 | $44,686 | $46,135 |
| Net Worth | ($7,237) | ($7,731) | ($8,424) | ($7,484) | ($5,775) | ($2,944) | ($1,819) | ($2,225) | $1,457 | $3,223 | $4,111 | $3,622 | $3,564 |

