
Skate Park NW
Executive Summary
Skate Park NW (SP) is a new skate skiing resort located in the Oregon Cascades offering miles of groomed trails. With little competition, incredible trails, and a solid management team, SP will be able to execute on its comprehensive business plan.
Skate skiing is a new form of nordic skiing. Originally created by Bill Koch, skate skiing is rapidly gaining popularity, it appeals to active people as a new, fun style of cross country skiing and serves as outstanding cross training for runners and cyclists. SP will develop the sport’s popularity by sponsoring races and clinics.
SP has three keys to success. The first is its competitive edge of convenience. SP offers incredible convenience for Willamette River Valley customers who would otherwise have to drive to Mt. Bachelor. The second key is to maintain a well groomed trail system. The last key is a concentration on customer service. Ensuring complete customer satisfaction will greatly assist attracting new customers and maintaining current customers.
SP has targeted two distinct segments of the market, beginners and experienced skiers. The beginner segment is made up of people that have never tried skate skiing but are eager to try it. The second group is experienced skaters who come from other sports and are looking for a winter sport that they can participate in, providing them enjoyment during the winter months and maintaining their fitness level.
SP will undertake a three pronged marketing strategy used to generate awareness for SP and skate skiing in general. The first is printed materials to be passed out in a number of retail locations including competitive races of different sports. The second will be advertisements that will be placed in the local outdoor/sport journals. Lastly, SP will sponsor races and clinics which will be used to generate interest in the sport, both from a participatory perspective as well as from a competitive perspective.
SP has conservatively forecasted profitability to occur during year one. The net profit will be 9.96% for year two, growing to 13.26% year three. SP will generate sales of $235,082 by year two and $276,221 by year three. SP is an exciting opportunity that combines an unmet market need, a well thought out business model and a seasoned management team.

1.1 Objectives
- Create the #1 skate ski park in the Cascades.
- Offer exciting skiing to a wider audience who have never previously tried it due to convenience issues.
- Become profitable within two years.
1.2 Mission
Skate Park NW’s mission is to create the premier skate skiing facility in the Cascades, appealing to professionals as well as beginners. It is our goal to make every customer as satisfied as possible.
1.3 Keys to Success
- Convenience: The facilities must be convenient in order to attract sufficient numbers of people.
- Quality: The trails must be groomed often to remain in the best condition.
- Benchmarked customer service: Customer service is the #1 priority.
Company Summary
SP was formed as a skate skiing park for residents of Eugene, Salem, Bend, and surrounding communities. It offers 25 miles of groomed skate ski trails, rentals, and a lodge. SP will address the need for skate skiing in the Willamette area of the Cascades since currently the only area to skate ski is Mt Bachelor. SP will appeal to both beginners who are trying skating for the first time and to seasoned professionals.
2.1 Company Ownership
SP is a privately-held Oregon Corporation. Sarah Sckeei is the principal stockholder.
2.2 Start-up Summary
SP will need the following equipment at startup:
- Enough office equipment for three desk areas;
- Ski rentals, 20 pairs of skis with bindings, 60 pairs of boots, 25 pairs of poles;
- Snowmobiles with grooming tractor pulls (2);
- Various construction materials to renovate the existing building into a lodge.
SP has secured an existing large cabin which it will renovate into a lodge and rental area. Through a licensing agreement with the National Forest Service, SP was able to negotiate the right to use Forest roads as skate trails. The Forest roads are perfect for skate trails, they are flat width-wise, the right width in feet and they go through the mountains. SP will use the lodge as the base of operations and will use the snowmobiles to groom the miles and miles of new skate trails.
In addition to this equipment needed for startup, Skate Park will require the following equipment for its snack bar and small gift/pro shop:
- Microwave;
- Commercial freezer and refrigerator;
- Assorted serving dishes and pots/utensils;
- Unit electric heating elements (2);
- Espresso machine (subsidized by the espresso bean vendor);
- Shelves, display racks, hanging units;
- Cash register.

| Start-up | |
| Requirements | |
| Start-up Expenses | |
| Legal | $4,000 |
| Stationery etc. | $100 |
| Brochures | $300 |
| Consultants | $4,000 |
| Insurance | $2,000 |
| Rent | $2,000 |
| Equipment | $26,000 |
| Building materials | $23,000 |
| Other | $5,656 |
| Total Start-up Expenses | $67,056 |
| Start-up Assets | |
| Cash Required | $52,944 |
| Other Current Assets | $0 |
| Long-term Assets | $70,000 |
| Total Assets | $122,944 |
| Total Requirements | $190,000 |
| Start-up Funding | |
| Start-up Expenses to Fund | $67,056 |
| Start-up Assets to Fund | $122,944 |
| Total Funding Required | $190,000 |
| Assets | |
| Non-cash Assets from Start-up | $70,000 |
| Cash Requirements from Start-up | $52,944 |
| Additional Cash Raised | $0 |
| Cash Balance on Starting Date | $52,944 |
| Total Assets | $122,944 |
| Liabilities and Capital | |
| Liabilities | |
| Current Borrowing | $0 |
| Long-term Liabilities | $0 |
| Accounts Payable (Outstanding Bills) | $0 |
| Other Current Liabilities (interest-free) | $0 |
| Total Liabilities | $0 |
| Capital | |
| Planned Investment | |
| Investor 1 | $100,000 |
| Investor 2 | $90,000 |
| Additional Investment Requirement | $0 |
| Total Planned Investment | $190,000 |
| Loss at Start-up (Start-up Expenses) | ($67,056) |
| Total Capital | $122,944 |
| Total Capital and Liabilities | $122,944 |
| Total Funding | $190,000 |
Services
SP offers skate skiing trails, lessons, and associated rentals. Skate skiing is a fairly new nordic skiing technique. Instead of using the classic technique where the two skis travel parallel to each other in tracks, skate skiing employs a trail where the trail is 10-15 feet wide and is groomed to have very little snow on top of a hard packed snow surface. The technique looks very similar to inline skating technique where the skater places weight on one leg and pushes off on that ski, transferring weight onto the other ski. This technique was created by American Bill Koch 20 years ago when we went onto to receive a medal in the olympics by using this at-the-time unique looking style. His unusual technique became a standard way of skiing and has become quite popular. This style of nordic skiing requires trails to be groomed differently than standard classic XC skiing. SP will have a lodge open which will be a source of rentals as well as a place where skiers can come in from the cold and rest.
Skate Park will have a limited selection snack bar. All of the food items will be prepared, the most that will be needed is the warming of the product. In addition to food products, warm drinks will be served. It will have an automatic espresso machine requiring very little in terms of human labor to operate. This machine was provided to Skate Park at almost no cost. It was subsidized by the vendor that Skate Park purchases its beans from. Skate Park will also offer hot chocolate and tea.
Market Analysis Summary
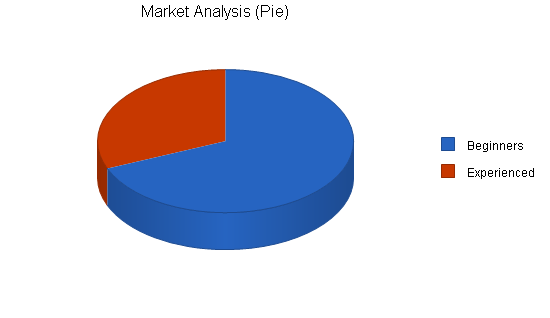
The market can be divided into two distinct segments, beginners and experienced users. The beginners are people that may have heard of the fun and aerobically challenging new form of skiing. Experienced users are people who are already experienced with this form of nordic skiing.
SP’s strategy will be to raise awareness regarding skate skiing and try to significantly increase the number of participants in this sport. In the operating area, the number of participants has been fairly low, primarily due to the fact that the only groomed trails in the area are near Bend, Oregon a +3 hour drive away.

4.1 Market Segmentation
The market that SP will target is segmented into two groups:
- Beginners: Cross country skiers who have never tried skate skiing, or people just starting to learn how to ski.
- Experienced users: Those that have skate skied before and are looking for groomed trails closer than Mt. Bachelor to enjoy skiing.
| Market Analysis | |||||||
| Year 1 | Year 2 | Year 3 | Year 4 | Year 5 | |||
| Potential Customers | Growth | CAGR | |||||
| Beginners | 23% | 76,554 | 94,161 | 115,818 | 142,456 | 175,221 | 23.00% |
| Experienced | 12% | 34,887 | 39,073 | 43,762 | 49,013 | 54,895 | 12.00% |
| Total | 19.87% | 111,441 | 133,234 | 159,580 | 191,469 | 230,116 | 19.87% |
4.2 Target Market Segment Strategy
SP is targeting these two groups because they are the largest group of participants of skate skiing.
- Beginners: This group has heard about skate skiing, how it is good cross training for running or cycling, but have yet to try it out. Typically this group participates in a number of different outdoor, human-powered sports and are looking for new things to push their bodies with.
- Experienced: As fun and challenging skate skiing is, the one disadvantage is that you can only ski where the trails are groomed specifically for skating. This is quite limiting for the Willamette River Valley as you must cross over into the high desert of Bend to find a place to skate. Skate Park NW offers outstanding facilities and trails at a location that is far more convenient than Bend. This will greatly appeal to the experienced skaters that come from the Willametter River Valley.
4.3 Service Business Analysis
Skate skiing is a relatively new sport. As mentioned previously, it was created by Bill Koch, an American Olympic XC skier who created his own style of skiing which turned out to be faster than the typical classic XC style. He went on to win a medal at the Winter Oympics and a new form of XC skiing was born. As popularity increases, more and more skate skiing areas can be found. In Oregon however, Mt Bachelor is the only area that offers groomed trails. As cyclists and runners are looking for endurance sports that provide excellent cross training to maintain fitness in the winter, skate skiing and snow shoeing have become the premier choices for a fun, challenging, endurance sport to maintain fitness.
4.3.1 Competition and Buying Patterns
In Oregon, there is only one other venue that offers groomed skating trails, Mt Bachelor in Bend. Since most users of Bend’s skate trails are from the Willamette River Valley in Oregon, having a skate park that is more accessible to the greatest concentration of population makes sense. Adoption rates, now that there are convenient venues, should grow significantly.
Strategy and Implementation Summary
SP’s business strategy is fairly simple, attract the experienced skiers and develop interest in beginners to try the sport at this new convenient location. To develop business for the beginner customers, SP must become a cheerleader for skate skiing, raising awareness about this new and exciting sport and encourage people to try it out. For the experienced market segment, SP must be successful in attracting people that would otherwise drive over to Bend to go skiing. Please see the following sections which provide more detail into SP’s strategy.
5.1 Competitive Edge
SP’s competitive edge is convenience. SP offers a very convenient skate skiing option to people of Salem, Eugene, Portland, and surrounding communities. Currently, in order to participate in this exciting activity, you must drive over the mountains to Bend. Providing skate facilities to a large population, and being the only one to do so is a true competitive edge.
5.2 Marketing Strategy
SP’s marketing strategy will be based on several different methods:
- Printed materials handed out at races: Information regarding SP and the services it offers will be distributed at various races (cycling, running, snowshoeing, etc.) This will be a useful exercise as many of the people that participate in these types of activities also have familiarity with skate skiing.
- Printed materials at outdoor retail outlets: These sources will be used because this is the place where people that participate in similar activities come to to purchase equipment, as well as collect information.
- Advertisements: SP will be advertising in several different local outdoor journals. These journals have a very targeted readership.
- Industry support: This will take the form of sponsoring races and clinics. These activities will be used to generate interest and increased participation of skate skiing.
5.3 Sales Strategy
SP’s sales strategy is quite simple, encourage new people to try skating, and get experienced skaters to come to SP instead of driving to Bend. By communicating with people of similar interests (people who enjoy other human-powered athletic activities) SP will be able to educate them on skate skiing and turn people into believers. SP will also be selling to an experienced user crowd. One way that SP will encourage experienced users is to have a race series during the winter to encourage competitive athletes to make several different trips up throughout the season to “test their meddle” against other competitors. The sales pitch will be a new and exciting sport that is fun and challenging, allowing athletes to maintain their fitness level through the winter months.
5.3.1 Sales Forecast
SP has forecasted sales to grow strongly and steadily for the first several years. This forecast is based on several assumptions. The first is that skate skiing is in its infancy as a sport. The sport was somewhat recently created, and just now are there venues being built, therefore the adoption/participation curve will be steep as more and more people become familiar with skate skiing. The second premise is that while the sport is in its infancy, there will not be a lot of competition from new venues opening up nearby. This is likely to be the case because it takes a special type of land to lend itself to a quality set of trails. If the trails are too hilly they become less appealing to skate skiers. Since SP has struck a special deal with the National Forest Service, they have secured the use of a special area of land that is perfect for skate skiing, recognizing that there are few other parcels of land nearby that lend themselves to as nice trails, or for that matter even decent trails. Obviously skiing is a seasonal sport and only occurs when there is snow. During the summer months the lodge will be used as a home base for day hikes through the mountains.


| Sales Forecast | |||
| Year 1 | Year 2 | Year 3 | |
| Sales | |||
| Food & Beverages | $14,437 | $17,775 | $23,225 |
| Beginners- ski related sales | $57,466 | $118,531 | $137,998 |
| Experienced- ski related sales | $53,814 | $98,776 | $114,998 |
| Total Sales | $125,717 | $235,082 | $276,221 |
| Direct Cost of Sales | Year 1 | Year 2 | Year 3 |
| Food | $6,497 | $7,999 | $10,451 |
| Beginners | $5,747 | $9,878 | $11,500 |
| Experienced | $5,381 | $23,508 | $27,622 |
| Subtotal Direct Cost of Sales | $17,625 | $41,385 | $49,573 |
5.4 Milestones
- Business plan completion;
- Secure building and lease for trails;
- Opening day;
- First race in series;
- Profitability.
| Milestones | |||||
| Milestone | Start Date | End Date | Budget | Manager | Department |
| B plan completion | 6/1/2002 | 1/15/2003 | $400 | Sarah | operations |
| Secure building lease | 1/1/2003 | 1/15/2003 | $500 | Sarah | operations |
| Opening day | 1/1/2003 | 1/15/2003 | $2,000 | Sarah | operations |
| First race | 1/1/2003 | 2/17/2003 | $3,000 | Sarah | marketing |
| Profitability | 1/1/2003 | 12/31/2003 | $0 | Sarah | operations |
| Totals | $5,900 | ||||
Web Plan Summary
A website will be used as a source of disbursement of information. Services offered, directions, special events, etc., will all be listed on the website.
6.1 Website Marketing Strategy
The website will be marketed by submitting the site to various search engines as well as inclusion of the URL within all of the printed material that is passed out.
6.2 Development Requirements
The University of Oregon computer science students will be tapped to provide a source of qualified, below-market programmers capable of quickly generating a professional website.
Management Summary
SP will be led by Sarah Sckeei, a veteran of the outdoor industry. After graduating from Panoma College, Sarah went to work for an adventure guide service that took clients on bicycle trips (road and mountain), backpacking trips, XC skiing, and snowshoe trips. Sarah spent seven years with this organization, four of the years leading the trips, and the final three years managing the organization. While working in the management capacity, Sarah increased sales by 37%. Following her seven years at (name omitted) Sarah went onto obtain her MBA from the University of Oregon. While Sarah believed that her previous seven years of work experience was invaluable, she though that an MBA would provide her with even more skills and analytical frameworks to make her more successful.
Following her MBA, Sarah moved to Bend and began working at Mt. Bachelor, responsible for their skate skiing and snow shoe programs. Sarah spent two years with Mt. Bachelor and this provided her with incredible experience and insight for this new and exciting market. After the second year Sarah decided that she wanted to be working for herself and began to look into writing a business plan for a new venture. Through contacts that she had, she found out that she could enter into a lease with the National Forest Service for the use of some of their access roads to be used as ski trails. As this deal began to solidify, Sarah began to actively seek out capital and quickly raised the requisite funds.
7.1 Personnel Plan
- President: Operations and business development, assorted activities.
- Groomer: Responsible for the maintenance of the trails.
- Rentals: Operates the rental facility.
- Lessons: Instructors are paid on an hourly basis. They will be working 20-30 hours a week. If there are not sufficient enough customers for lessons, then they will be helping out the other staff. The business will be fairly intimate based on its modest size, meaning that everyone helps out everyone else when possible. So regardless if you have a primary position in the company, you are expected to assist the others when your work load is low.
- Misc: This person will work in the snack shop and help out in the gift/pro shop when needed. They will be able to do a wide range of tasks since the offerings of the snack shop are fairly limited and do not require much labor to prepare.
| Personnel Plan | |||
| Year 1 | Year 2 | Year 3 | |
| Sarah | $24,000 | $30,000 | $35,000 |
| Groomer | $13,500 | $13,500 | $13,500 |
| Rental | $18,000 | $22,000 | $25,000 |
| Instructor | $15,000 | $18,000 | $22,000 |
| Misc. | $13,500 | $13,500 | $13,500 |
| Total People | 8 | 8 | 8 |
| Total Payroll | $84,000 | $97,000 | $109,000 |
Financial Plan
The following sections will outline important financial information.
8.1 Important Assumptions
The following table details Important Assumptions.
| General Assumptions | |||
| Year 1 | Year 2 | Year 3 | |
| Plan Month | 1 | 2 | 3 |
| Current Interest Rate | 10.00% | 10.00% | 10.00% |
| Long-term Interest Rate | 10.00% | 10.00% | 10.00% |
| Tax Rate | 30.00% | 30.00% | 30.00% |
| Other | 0 | 0 | 0 |
8.2 Break-even Analysis
The Break-even analysis indicates that approximately $13,500 will be needed in monthly revenue to reach the Break-even point.

| Break-even Analysis | |
| Monthly Revenue Break-even | $13,588 |
| Assumptions: | |
| Average Percent Variable Cost | 14% |
| Estimated Monthly Fixed Cost | $11,683 |
8.3 Projected Profit and Loss
The following table and charts will indicate Projected Profit and Loss.


| Pro Forma Profit and Loss | |||
| Year 1 | Year 2 | Year 3 | |
| Sales | $125,717 | $235,082 | $276,221 |
| Direct Cost of Sales | $17,625 | $41,385 | $49,573 |
| Other Costs of Sales | $0 | $0 | $0 |
| Total Cost of Sales | $17,625 | $41,385 | $49,573 |
| Gross Margin | $108,092 | $193,698 | $226,647 |
| Gross Margin % | 85.98% | 82.40% | 82.05% |
| Expenses | |||
| Payroll | $84,000 | $97,000 | $109,000 |
| Sales and Marketing and Other Expenses | $3,600 | $3,600 | $3,600 |
| Depreciation | $13,992 | $13,992 | $13,992 |
| Rent | $16,500 | $21,000 | $21,000 |
| Utilities | $4,700 | $5,300 | $5,600 |
| Insurance | $4,800 | $4,800 | $4,800 |
| Payroll Taxes | $12,600 | $14,550 | $16,350 |
| Other | $0 | $0 | $0 |
| Total Operating Expenses | $140,192 | $160,242 | $174,342 |
| Profit Before Interest and Taxes | ($32,100) | $33,456 | $52,305 |
| EBITDA | ($18,108) | $47,448 | $66,297 |
| Interest Expense | $0 | $0 | $0 |
| Taxes Incurred | $0 | $10,037 | $15,692 |
| Net Profit | ($32,100) | $23,419 | $36,614 |
| Net Profit/Sales | -25.53% | 9.96% | 13.26% |
8.4 Projected Cash Flow
The following table and chart will indicate Projected Cash Flow.

| Pro Forma Cash Flow | |||
| Year 1 | Year 2 | Year 3 | |
| Cash Received | |||
| Cash from Operations | |||
| Cash Sales | $125,717 | $235,082 | $276,221 |
| Subtotal Cash from Operations | $125,717 | $235,082 | $276,221 |
| Additional Cash Received | |||
| Sales Tax, VAT, HST/GST Received | $0 | $0 | $0 |
| New Current Borrowing | $0 | $0 | $0 |
| New Other Liabilities (interest-free) | $0 | $0 | $0 |
| New Long-term Liabilities | $0 | $0 | $0 |
| Sales of Other Current Assets | $0 | $0 | $0 |
| Sales of Long-term Assets | $0 | $0 | $0 |
| New Investment Received | $0 | $0 | $0 |
| Subtotal Cash Received | $125,717 | $235,082 | $276,221 |
| Expenditures | Year 1 | Year 2 | Year 3 |
| Expenditures from Operations | |||
| Cash Spending | $84,000 | $97,000 | $109,000 |
| Bill Payments | $51,788 | $100,434 | $115,304 |
| Subtotal Spent on Operations | $135,788 | $197,434 | $224,304 |
| Additional Cash Spent | |||
| Sales Tax, VAT, HST/GST Paid Out | $0 | $0 | $0 |
| Principal Repayment of Current Borrowing | $0 | $0 | $0 |
| Other Liabilities Principal Repayment | $0 | $0 | $0 |
| Long-term Liabilities Principal Repayment | $0 | $0 | $0 |
| Purchase Other Current Assets | $0 | $0 | $0 |
| Purchase Long-term Assets | $0 | $0 | $0 |
| Dividends | $0 | $0 | $0 |
| Subtotal Cash Spent | $135,788 | $197,434 | $224,304 |
| Net Cash Flow | ($10,071) | $37,648 | $51,916 |
| Cash Balance | $42,873 | $80,522 | $132,438 |
8.5 Projected Balance Sheet
The following table will indicate the Projected Balance Sheet.
| Pro Forma Balance Sheet | |||
| Year 1 | Year 2 | Year 3 | |
| Assets | |||
| Current Assets | |||
| Cash | $42,873 | $80,522 | $132,438 |
| Other Current Assets | $0 | $0 | $0 |
| Total Current Assets | $42,873 | $80,522 | $132,438 |
| Long-term Assets | |||
| Long-term Assets | $70,000 | $70,000 | $70,000 |
| Accumulated Depreciation | $13,992 | $27,984 | $41,976 |
| Total Long-term Assets | $56,008 | $42,016 | $28,024 |
| Total Assets | $98,881 | $122,538 | $160,462 |
| Liabilities and Capital | Year 1 | Year 2 | Year 3 |
| Current Liabilities | |||
| Accounts Payable | $8,037 | $8,274 | $9,585 |
| Current Borrowing | $0 | $0 | $0 |
| Other Current Liabilities | $0 | $0 | $0 |
| Subtotal Current Liabilities | $8,037 | $8,274 | $9,585 |
| Long-term Liabilities | $0 | $0 | $0 |
| Total Liabilities | $8,037 | $8,274 | $9,585 |
| Paid-in Capital | $190,000 | $190,000 | $190,000 |
| Retained Earnings | ($67,056) | ($99,156) | ($75,737) |
| Earnings | ($32,100) | $23,419 | $36,614 |
| Total Capital | $90,844 | $114,263 | $150,877 |
| Total Liabilities and Capital | $98,881 | $122,538 | $160,462 |
| Net Worth | $90,844 | $114,263 | $150,877 |
8.6 Business Ratios
The following table indicates the Business Ratios for this plan as well as the industry.
| Ratio Analysis | ||||
| Year 1 | Year 2 | Year 3 | Industry Profile | |
| Sales Growth | 0.00% | 86.99% | 17.50% | 3.50% |
| Percent of Total Assets | ||||
| Other Current Assets | 0.00% | 0.00% | 0.00% | 27.24% |
| Total Current Assets | 43.36% | 65.71% | 82.54% | 33.11% |
| Long-term Assets | 56.64% | 34.29% | 17.46% | 66.89% |
| Total Assets | 100.00% | 100.00% | 100.00% | 100.00% |
| Current Liabilities | 8.13% | 6.75% | 5.97% | 13.25% |
| Long-term Liabilities | 0.00% | 0.00% | 0.00% | 37.31% |
| Total Liabilities | 8.13% | 6.75% | 5.97% | 50.56% |
| Net Worth | 91.87% | 93.25% | 94.03% | 49.44% |
| Percent of Sales | ||||
| Sales | 100.00% | 100.00% | 100.00% | 100.00% |
| Gross Margin | 85.98% | 82.40% | 82.05% | 100.00% |
| Selling, General & Administrative Expenses | 111.51% | 72.43% | 68.80% | 75.44% |
| Advertising Expenses | 0.00% | 0.00% | 0.00% | 1.71% |
| Profit Before Interest and Taxes | -25.53% | 14.23% | 18.94% | 1.72% |
| Main Ratios | ||||
| Current | 5.33 | 9.73 | 13.82 | 1.31 |
| Quick | 5.33 | 9.73 | 13.82 | 0.97 |
| Total Debt to Total Assets | 8.13% | 6.75% | 5.97% | 57.21% |
| Pre-tax Return on Net Worth | -35.33% | 29.28% | 34.67% | 1.10% |
| Pre-tax Return on Assets | -32.46% | 27.30% | 32.60% | 2.56% |
| Additional Ratios | Year 1 | Year 2 | Year 3 | |
| Net Profit Margin | -25.53% | 9.96% | 13.26% | n.a |
| Return on Equity | -35.33% | 20.50% | 24.27% | n.a |
| Activity Ratios | ||||
| Accounts Payable Turnover | 7.44 | 12.17 | 12.17 | n.a |
| Payment Days | 27 | 30 | 28 | n.a |
| Total Asset Turnover | 1.27 | 1.92 | 1.72 | n.a |
| Debt Ratios | ||||
| Debt to Net Worth | 0.09 | 0.07 | 0.06 | n.a |
| Current Liab. to Liab. | 1.00 | 1.00 | 1.00 | n.a |
| Liquidity Ratios | ||||
| Net Working Capital | $34,836 | $72,247 | $122,853 | n.a |
| Interest Coverage | 0.00 | 0.00 | 0.00 | n.a |
| Additional Ratios | ||||
| Assets to Sales | 0.79 | 0.52 | 0.58 | n.a |
| Current Debt/Total Assets | 8% | 7% | 6% | n.a |
| Acid Test | 5.33 | 9.73 | 13.82 | n.a |
| Sales/Net Worth | 1.38 | 2.06 | 1.83 | n.a |
| Dividend Payout | 0.00 | 0.00 | 0.00 | n.a |
Appendix
| Sales Forecast | |||||||||||||
| Month 1 | Month 2 | Month 3 | Month 4 | Month 5 | Month 6 | Month 7 | Month 8 | Month 9 | Month 10 | Month 11 | Month 12 | ||
| Sales | |||||||||||||
| Food & Beverages | 0% | $1,450 | $1,550 | $1,650 | $1,750 | $1,200 | $725 | $700 | $575 | $650 | $1,200 | $1,275 | $1,712 |
| Beginners- ski related sales | 0% | $1,719 | $2,009 | $3,217 | $3,285 | $684 | $684 | $684 | $4,000 | $7,600 | $10,398 | $10,266 | $12,920 |
| Experienced- ski related sales | 0% | $2,262 | $2,643 | $4,233 | $4,323 | $900 | $900 | $900 | $3,333 | $6,333 | $8,665 | $8,555 | $10,767 |
| Total Sales | $5,431 | $6,202 | $9,100 | $9,358 | $2,784 | $2,309 | $2,284 | $7,908 | $14,583 | $20,263 | $20,096 | $25,399 | |
| Direct Cost of Sales | Month 1 | Month 2 | Month 3 | Month 4 | Month 5 | Month 6 | Month 7 | Month 8 | Month 9 | Month 10 | Month 11 | Month 12 | |
| Food | $653 | $698 | $743 | $788 | $540 | $326 | $315 | $259 | $293 | $540 | $574 | $770 | |
| Beginners | $172 | $201 | $322 | $329 | $68 | $68 | $68 | $400 | $760 | $1,040 | $1,027 | $1,292 | |
| Experienced | $226 | $264 | $423 | $432 | $90 | $90 | $90 | $333 | $633 | $867 | $856 | $1,077 | |
| Subtotal Direct Cost of Sales | $1,051 | $1,163 | $1,488 | $1,548 | $698 | $485 | $473 | $992 | $1,686 | $2,446 | $2,456 | $3,139 | |
| Personnel Plan | |||||||||||||
| Month 1 | Month 2 | Month 3 | Month 4 | Month 5 | Month 6 | Month 7 | Month 8 | Month 9 | Month 10 | Month 11 | Month 12 | ||
| Sarah | 0% | $2,000 | $2,000 | $2,000 | $2,000 | $2,000 | $2,000 | $2,000 | $2,000 | $2,000 | $2,000 | $2,000 | $2,000 |
| Groomer | 0% | $1,500 | $1,500 | $1,500 | $1,500 | $0 | $0 | $0 | $1,500 | $1,500 | $1,500 | $1,500 | $1,500 |
| Rental | 0% | $1,500 | $1,500 | $1,500 | $1,500 | $0 | $0 | $0 | $1,500 | $1,500 | $1,500 | $3,000 | $4,500 |
| Instructor | 0% | $1,500 | $1,500 | $1,500 | $1,500 | $0 | $0 | $0 | $1,500 | $1,500 | $1,500 | $1,500 | $3,000 |
| Misc. | 0% | $1,500 | $1,500 | $1,500 | $1,500 | $0 | $0 | $0 | $1,500 | $1,500 | $1,500 | $1,500 | $1,500 |
| Total People | 5 | 5 | 5 | 5 | 1 | 1 | 1 | 5 | 5 | 5 | 6 | 8 | |
| Total Payroll | $8,000 | $8,000 | $8,000 | $8,000 | $2,000 | $2,000 | $2,000 | $8,000 | $8,000 | $8,000 | $9,500 | $12,500 | |
| General Assumptions | |||||||||||||
| Month 1 | Month 2 | Month 3 | Month 4 | Month 5 | Month 6 | Month 7 | Month 8 | Month 9 | Month 10 | Month 11 | Month 12 | ||
| Plan Month | 1 | 2 | 3 | 4 | 5 | 6 | 7 | 8 | 9 | 10 | 11 | 12 | |
| Current Interest Rate | 10.00% | 10.00% | 10.00% | 10.00% | 10.00% | 10.00% | 10.00% | 10.00% | 10.00% | 10.00% | 10.00% | 10.00% | |
| Long-term Interest Rate | 10.00% | 10.00% | 10.00% | 10.00% | 10.00% | 10.00% | 10.00% | 10.00% | 10.00% | 10.00% | 10.00% | 10.00% | |
| Tax Rate | 30.00% | 30.00% | 30.00% | 30.00% | 30.00% | 30.00% | 30.00% | 30.00% | 30.00% | 30.00% | 30.00% | 30.00% | |
| Other | 0 | 0 | 0 | 0 | 0 | 0 | 0 | 0 | 0 | 0 | 0 | 0 | |
| Pro Forma Profit and Loss | |||||||||||||
| Month 1 | Month 2 | Month 3 | Month 4 | Month 5 | Month 6 | Month 7 | Month 8 | Month 9 | Month 10 | Month 11 | Month 12 | ||
| Sales | $5,431 | $6,202 | $9,100 | $9,358 | $2,784 | $2,309 | $2,284 | $7,908 | $14,583 | $20,263 | $20,096 | $25,399 | |
| Direct Cost of Sales | $1,051 | $1,163 | $1,488 | $1,548 | $698 | $485 | $473 | $992 | $1,686 | $2,446 | $2,456 | $3,139 | |
| Other Costs of Sales | $0 | $0 | $0 | $0 | $0 | $0 | $0 | $0 | $0 | $0 | $0 | $0 | |
| Total Cost of Sales | $1,051 | $1,163 | $1,488 | $1,548 | $698 | $485 | $473 | $992 | $1,686 | $2,446 | $2,456 | $3,139 | |
| Gross Margin | $4,381 | $5,039 | $7,613 | $7,810 | $2,086 | $1,824 | $1,811 | $6,916 | $12,897 | $17,817 | $17,640 | $22,260 | |
| Gross Margin % | 80.66% | 81.25% | 83.65% | 83.46% | 74.91% | 79.01% | 79.27% | 87.45% | 88.44% | 87.93% | 87.78% | 87.64% | |
| Expenses | |||||||||||||
| Payroll | $8,000 | $8,000 | $8,000 | $8,000 | $2,000 | $2,000 | $2,000 | $8,000 | $8,000 | $8,000 | $9,500 | $12,500 | |
| Sales and Marketing and Other Expenses | $300 | $300 | $300 | $300 | $300 | $300 | $300 | $300 | $300 | $300 | $300 | $300 | |
| Depreciation | $1,166 | $1,166 | $1,166 | $1,166 | $1,166 | $1,166 | $1,166 | $1,166 | $1,166 | $1,166 | $1,166 | $1,166 | |
| Rent | $2,000 | $2,000 | $2,000 | $2,000 | $500 | $500 | $500 | $500 | $500 | $2,000 | $2,000 | $2,000 | |
| Utilities | $600 | $600 | $600 | $600 | $100 | $100 | $100 | $100 | $100 | $600 | $600 | $600 | |
| Insurance | $400 | $400 | $400 | $400 | $400 | $400 | $400 | $400 | $400 | $400 | $400 | $400 | |
| Payroll Taxes | 15% | $1,200 | $1,200 | $1,200 | $1,200 | $300 | $300 | $300 | $1,200 | $1,200 | $1,200 | $1,425 | $1,875 |
| Other | $0 | $0 | $0 | $0 | $0 | $0 | $0 | $0 | $0 | $0 | $0 | $0 | |
| Total Operating Expenses | $13,666 | $13,666 | $13,666 | $13,666 | $4,766 | $4,766 | $4,766 | $11,666 | $11,666 | $13,666 | $15,391 | $18,841 | |
| Profit Before Interest and Taxes | ($9,285) | ($8,627) | ($6,053) | ($5,856) | ($2,680) | ($2,942) | ($2,955) | ($4,750) | $1,231 | $4,151 | $2,249 | $3,419 | |
| EBITDA | ($8,119) | ($7,461) | ($4,887) | ($4,690) | ($1,514) | ($1,776) | ($1,789) | ($3,584) | $2,397 | $5,317 | $3,415 | $4,585 | |
| Interest Expense | $0 | $0 | $0 | $0 | $0 | $0 | $0 | $0 | $0 | $0 | $0 | $0 | |
| Taxes Incurred | $0 | $0 | $0 | $0 | $0 | $0 | $0 | $0 | $0 | $0 | $0 | $0 | |
| Net Profit | ($9,285) | ($8,627) | ($6,053) | ($5,856) | ($2,680) | ($2,942) | ($2,955) | ($4,750) | $1,231 | $4,151 | $2,249 | $3,419 | |
| Net Profit/Sales | -170.97% | -139.11% | -66.52% | -62.57% | -96.28% | -127.40% | -129.40% | -60.07% | 8.44% | 20.48% | 11.19% | 13.46% | |
| Pro Forma Cash Flow | |||||||||||||
| Month 1 | Month 2 | Month 3 | Month 4 | Month 5 | Month 6 | Month 7 | Month 8 | Month 9 | Month 10 | Month 11 | Month 12 | ||
| Cash Received | |||||||||||||
| Cash from Operations | |||||||||||||
| Cash Sales | $5,431 | $6,202 | $9,100 | $9,358 | $2,784 | $2,309 | $2,284 | $7,908 | $14,583 | $20,263 | $20,096 | $25,399 | |
| Subtotal Cash from Operations | $5,431 | $6,202 | $9,100 | $9,358 | $2,784 | $2,309 | $2,284 | $7,908 | $14,583 | $20,263 | $20,096 | $25,399 | |
| Additional Cash Received | |||||||||||||
| Sales Tax, VAT, HST/GST Received | 0.00% | $0 | $0 | $0 | $0 | $0 | $0 | $0 | $0 | $0 | $0 | $0 | $0 |
| New Current Borrowing | $0 | $0 | $0 | $0 | $0 | $0 | $0 | $0 | $0 | $0 | $0 | $0 | |
| New Other Liabilities (interest-free) | $0 | $0 | $0 | $0 | $0 | $0 | $0 | $0 | $0 | $0 | $0 | $0 | |
| New Long-term Liabilities | $0 | $0 | $0 | $0 | $0 | $0 | $0 | $0 | $0 | $0 | $0 | $0 | |
| Sales of Other Current Assets | $0 | $0 | $0 | $0 | $0 | $0 | $0 | $0 | $0 | $0 | $0 | $0 | |
| Sales of Long-term Assets | $0 | $0 | $0 | $0 | $0 | $0 | $0 | $0 | $0 | $0 | $0 | $0 | |
| New Investment Received | $0 | $0 | $0 | $0 | $0 | $0 | $0 | $0 | $0 | $0 | $0 | $0 | |
| Subtotal Cash Received | $5,431 | $6,202 | $9,100 | $9,358 | $2,784 | $2,309 | $2,284 | $7,908 | $14,583 | $20,263 | $20,096 | $25,399 | |
| Expenditures | Month 1 | Month 2 | Month 3 | Month 4 | Month 5 | Month 6 | Month 7 | Month 8 | Month 9 | Month 10 | Month 11 | Month 12 | |
| Expenditures from Operations | |||||||||||||
| Cash Spending | $8,000 | $8,000 | $8,000 | $8,000 | $2,000 | $2,000 | $2,000 | $8,000 | $8,000 | $8,000 | $9,500 | $12,500 | |
| Bill Payments | $185 | $5,554 | $5,673 | $5,990 | $5,923 | $2,291 | $2,084 | $2,121 | $3,515 | $4,278 | $6,954 | $7,219 | |
| Subtotal Spent on Operations | $8,185 | $13,554 | $13,673 | $13,990 | $7,923 | $4,291 | $4,084 | $10,121 | $11,515 | $12,278 | $16,454 | $19,719 | |
| Additional Cash Spent | |||||||||||||
| Sales Tax, VAT, HST/GST Paid Out | $0 | $0 | $0 | $0 | $0 | $0 | $0 | $0 | $0 | $0 | $0 | $0 | |
| Principal Repayment of Current Borrowing | $0 | $0 | $0 | $0 | $0 | $0 | $0 | $0 | $0 | $0 | $0 | $0 | |
| Other Liabilities Principal Repayment | $0 | $0 | $0 | $0 | $0 | $0 | $0 | $0 | $0 | $0 | $0 | $0 | |
| Long-term Liabilities Principal Repayment | $0 | $0 | $0 | $0 | $0 | $0 | $0 | $0 | $0 | $0 | $0 | $0 | |
| Purchase Other Current Assets | $0 | $0 | $0 | $0 | $0 | $0 | $0 | $0 | $0 | $0 | $0 | $0 | |
| Purchase Long-term Assets | $0 | $0 | $0 | $0 | $0 | $0 | $0 | $0 | $0 | $0 | $0 | $0 | |
| Dividends | $0 | $0 | $0 | $0 | $0 | $0 | $0 | $0 | $0 | $0 | $0 | $0 | |
| Subtotal Cash Spent | $8,185 | $13,554 | $13,673 | $13,990 | $7,923 | $4,291 | $4,084 | $10,121 | $11,515 | $12,278 | $16,454 | $19,719 | |
| Net Cash Flow | ($2,754) | ($7,353) | ($4,573) | ($4,631) | ($5,139) | ($1,982) | ($1,800) | ($2,213) | $3,067 | $7,985 | $3,642 | $5,681 | |
| Cash Balance | $50,190 | $42,837 | $38,264 | $33,633 | $28,494 | $26,511 | $24,711 | $22,498 | $25,565 | $33,551 | $37,193 | $42,873 | |
| Pro Forma Balance Sheet | |||||||||||||
| Month 1 | Month 2 | Month 3 | Month 4 | Month 5 | Month 6 | Month 7 | Month 8 | Month 9 | Month 10 | Month 11 | Month 12 | ||
| Assets | Starting Balances | ||||||||||||
| Current Assets | |||||||||||||
| Cash | $52,944 | $50,190 | $42,837 | $38,264 | $33,633 | $28,494 | $26,511 | $24,711 | $22,498 | $25,565 | $33,551 | $37,193 | $42,873 |
| Other Current Assets | $0 | $0 | $0 | $0 | $0 | $0 | $0 | $0 | $0 | $0 | $0 | $0 | $0 |
| Total Current Assets | $52,944 | $50,190 | $42,837 | $38,264 | $33,633 | $28,494 | $26,511 | $24,711 | $22,498 | $25,565 | $33,551 | $37,193 | $42,873 |
| Long-term Assets | |||||||||||||
| Long-term Assets | $70,000 | $70,000 | $70,000 | $70,000 | $70,000 | $70,000 | $70,000 | $70,000 | $70,000 | $70,000 | $70,000 | $70,000 | $70,000 |
| Accumulated Depreciation | $0 | $1,166 | $2,332 | $3,498 | $4,664 | $5,830 | $6,996 | $8,162 | $9,328 | $10,494 | $11,660 | $12,826 | $13,992 |
| Total Long-term Assets | $70,000 | $68,834 | $67,668 | $66,502 | $65,336 | $64,170 | $63,004 | $61,838 | $60,672 | $59,506 | $58,340 | $57,174 | $56,008 |
| Total Assets | $122,944 | $119,024 | $110,505 | $104,766 | $98,969 | $92,664 | $89,515 | $86,549 | $83,170 | $85,071 | $91,891 | $94,367 | $98,881 |
| Liabilities and Capital | Month 1 | Month 2 | Month 3 | Month 4 | Month 5 | Month 6 | Month 7 | Month 8 | Month 9 | Month 10 | Month 11 | Month 12 | |
| Current Liabilities | |||||||||||||
| Accounts Payable | $0 | $5,366 | $5,474 | $5,788 | $5,847 | $2,222 | $2,015 | $2,004 | $3,376 | $4,046 | $6,715 | $6,941 | $8,037 |
| Current Borrowing | $0 | $0 | $0 | $0 | $0 | $0 | $0 | $0 | $0 | $0 | $0 | $0 | $0 |
| Other Current Liabilities | $0 | $0 | $0 | $0 | $0 | $0 | $0 | $0 | $0 | $0 | $0 | $0 | $0 |
| Subtotal Current Liabilities | $0 | $5,366 | $5,474 | $5,788 | $5,847 | $2,222 | $2,015 | $2,004 | $3,376 | $4,046 | $6,715 | $6,941 | $8,037 |
| Long-term Liabilities | $0 | $0 | $0 | $0 | $0 | $0 | $0 | $0 | $0 | $0 | $0 | $0 | $0 |
| Total Liabilities | $0 | $5,366 | $5,474 | $5,788 | $5,847 | $2,222 | $2,015 | $2,004 | $3,376 | $4,046 | $6,715 | $6,941 | $8,037 |
| Paid-in Capital | $190,000 | $190,000 | $190,000 | $190,000 | $190,000 | $190,000 | $190,000 | $190,000 | $190,000 | $190,000 | $190,000 | $190,000 | $190,000 |
| Retained Earnings | ($67,056) | ($67,056) | ($67,056) | ($67,056) | ($67,056) | ($67,056) | ($67,056) | ($67,056) | ($67,056) | ($67,056) | ($67,056) | ($67,056) | ($67,056) |
| Earnings | $0 | ($9,285) | ($17,912) | ($23,966) | ($29,822) | ($32,502) | ($35,444) | ($38,399) | ($43,150) | ($41,919) | ($37,768) | ($35,519) | ($32,100) |
| Total Capital | $122,944 | $113,659 | $105,032 | $98,978 | $93,122 | $90,442 | $87,500 | $84,545 | $79,794 | $81,025 | $85,176 | $87,425 | $90,844 |
| Total Liabilities and Capital | $122,944 | $119,024 | $110,505 | $104,766 | $98,969 | $92,664 | $89,515 | $86,549 | $83,170 | $85,071 | $91,891 | $94,367 | $98,881 |
| Net Worth | $122,944 | $113,659 | $105,032 | $98,978 | $93,122 | $90,442 | $87,500 | $84,545 | $79,794 | $81,025 | $85,176 | $87,425 | $90,844 |

