
Colloquy Grog Shop
Executive Summary
Colloquy Grog Shop is a unique local bar/coffee/tapas house that provides a friendly, effective place singles can meet. Colloquy Grog Shop is not your typical bar where people go to meet other singles, it has a unique service called the structured conversation system that is quite effective for allowing singles to meet each other and provide them with valuable insight into the other person through reflective conversation.
The structured system provide an atmosphere that lowers inhibitions and breeds confidence, allowing singles to meet other singles and gain insight into their personality by way of thoughtful discourse. Meeting people is one of the biggest hurdles for 25-45 year old singles. Colloquy Grog Shop provides this group with an effective solution to this problem. Colloquy Grog Shop will reach profitability by year two and will have earned comfortable profits of by the end of year three.
1.1 Objectives
The objectives for the first three years of operation include:
- To create a local tavern/coffee shop whose primary goal is to exceed customer’s expectations.
- To increase the number of clients by 20% per year.
- To develop a sustainable start-up business surviving off of its own cash flow.
1.2 Mission
Colloquy Grog Shop’s mission is to provide a neighborhood bar/coffee shop where single people can meet. We exist to attract and maintain customers. When we adhere to this maxim, everything else will fall into place. Our services will exceed the expectations of our customers.
1.3 Keys to Success
The keys to success will be to constantly address our customer’s needs.

Company Summary
Colloquy Grog Shop is a bar/coffee shop designed to bring together singles and create an environment that allows people to comfortably meet each other. This is done through a structured conversation system that eliminates uncertainty regarding the social dynamic by creating structure through the use of conversation topics assigned to each table. This structure allows people to be feel more comfortable in meeting new people at the bar/coffee shop because the uncertainty of how to act is eliminated, the structure guides the interaction with the people at the table.
The Colloquy Grog Shop will be set up in the hip, upcoming industrial area of NW Portland. This area is a rapidly emerging night stop for the targeted demographic. Because the rented space will be an old warehouse the lease costs are quite reasonable. The tradeoff for the very reasonable lease is slightly higher tenant improvements required at start up.
2.1 Company Ownership
Colloquy Grog Shop is an Oregon corporation solely owned by Karen Kibbutz.
2.2 Start-up Summary
Colloquy Grog Shop will incur the following start-up costs:
- Commercial espresso machine.
- Commercial coffee machine, grinder.
- Refrigerator and freezer.
- Dishwasher.
- Bar counter and bar stools.
- Eight tap beer system (including refrigerator unit) and pint glasses.
- Point of sale terminal with cash register.
- Computer system with CD-RW, printer, Microsoft Office, QuickBooks Pro and an Internet connection.
- 15 four-top tables and 60 chairs.
- Installation of sinks in the bar area.
- Commercial oven and range.
- Large counter.
- Assorted cook ware and utensils.
- Three telephones, fax machine and copier.
- Renovations.
Please note that the following items which are considered assets to be used for more than a year will be labeled long-term assets and will be depreciated using G.A.A.P. approved straight-line depreciation method.
| Start-up Funding | |
| Start-up Expenses to Fund | $1,150 |
| Start-up Assets to Fund | $118,850 |
| Total Funding Required | $120,000 |
| Assets | |
| Non-cash Assets from Start-up | $50,000 |
| Cash Requirements from Start-up | $68,850 |
| Additional Cash Raised | $0 |
| Cash Balance on Starting Date | $68,850 |
| Total Assets | $118,850 |
| Liabilities and Capital | |
| Liabilities | |
| Current Borrowing | $0 |
| Long-term Liabilities | $0 |
| Accounts Payable (Outstanding Bills) | $0 |
| Other Current Liabilities (interest-free) | $0 |
| Total Liabilities | $0 |
| Capital | |
| Planned Investment | |
| Karen | $40,000 |
| Family and friends | $80,000 |
| Other | $0 |
| Additional Investment Requirement | $0 |
| Total Planned Investment | $120,000 |
| Loss at Start-up (Start-up Expenses) | ($1,150) |
| Total Capital | $118,850 |
| Total Capital and Liabilities | $118,850 |
| Total Funding | $120,000 |
| Start-up | |
| Requirements | |
| Start-up Expenses | |
| Legal | $1,000 |
| Stationery etc. | $150 |
| Other | $0 |
| Total Start-up Expenses | $1,150 |
| Start-up Assets | |
| Cash Required | $68,850 |
| Other Current Assets | $0 |
| Long-term Assets | $50,000 |
| Total Assets | $118,850 |
| Total Requirements | $120,000 |
Products
Colloquy Grog Shop sells the following:
- Eight microbrew beers on draft and in bottles: beer is served for two reasons. One, alcohol reduces inhibition, making it easier for people to meet and interact. Two, draft beer generates wonderful profits. Microbeers are chosen because they are of higher quality than large production beers and our target segment prefers them.
- Espresso, cappuccino, coffee, and other coffee/espresso drinks: coffee and coffee-related drinks are hugely popular, particularly in the Pacific Northwest. Northwesterners expect good coffee/espresso at most food/drink establishments and it is often associated with good conversation.
- An assortment of different tapas: tapas are chosen because they can be relatively easy to make, the offerings can be changed frequently, and tapas are more community oriented, meaning they are designed for a table/multiple people to share. This reinforces Colloquy Grog Shop mission of bringing new people together.
The service offerings are based on a system for singles to meet new people. This is accomplished through a structured conversation system. The Grog Shop is divided into two sections: a smaller section of tables for general customers, and another larger section for singles to come and meet new people.
The singles section is composed of 4-top tables (tables for seating for four). Each table will be marked with a topic of conversation in the center. Throughout the evening as there is turnover of the table or the conversation is exhausted, the server will introduce a new topic. The topics are far reaching, some are recent news or sports, while others are intelectual, and some are philosophical. The bulk of the topics will be of the latter varieties as people that are interested in meeting people through the conduit of conversation will typically prefer heavier stuff to provide more insight into that person.
If you ask a majority of single 25-45 year olds, most will say they have difficulty meeting new people. Regular bars are not an ideal place to meet people because beyond their visual image, it is quite difficult to learn anything material about the person to determine if there are commonalities. The typical bar has loud music and is not geared up for serious conversation.
Colloquy Grog Shop creates a setting in a bar/coffee shop that encourages thoughtful conversation, allowing patrons to gain insight into the other singles. The key to the conversation system is structure. The rules are clearly established. Singles sit down at specific tables and discuss the assigned topic of conversation. The conversation is used to elicit insight into the other person, their values and perspectives as well as implicit, and sometimes explicit, insight to their background and past.
The structured conversation system is successful because it is reduces ambiguity or uncertainty in the singles social scene allowing people to feel more comfortable in the setting and open up more to the new people. Additionally, for intellectually-minded people, it allows them to find people with similar interests, whether the similarity is based in the topic of conversation of more generally in conversation itself.
Market Analysis Summary
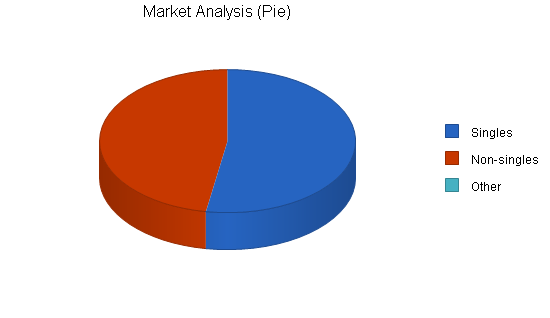
Colloquy Grog Shop’s market can be broken down into two different groups, singles and non-singles. Both groups are well educated and are middle to upper-middle class.

Colloquy Grog Shop competes within the bar/coffee shop industry with a market niche focusing on singles activities. By concentrating on these single activities, Colloquy Grog Shop also faces competition from other singles groups.
4.1 Market Segmentation
Colloquy Grog Shop’s customers can be broken down into two groups: singles, and non-singles. The non-singles group is smaller by virtue of the fact that if you are meeting someone whom you already know, the two of you can come up with the topic of conversation yourself, therefore, Grog Shop offers this group less value. The demographics for the non-singles is similar to the singles, to be listed below. The demographics of the singles are:
- Single: self evident.
- Professional: this characteristic is intuitive since the the underlying element of Colloquy Grog Shop is thoughtful conversation, and most, if not all professionals are intelligent and appreciate thought-provoking conversation.
- Income over $40,000: this to a large degree correlates to the fact that they are professional. The one exception are teachers who are underpaid relative to their contribution to society.
- Age 25-45: the largest group of singles looking for companions.
| Market Analysis | |||||||
| Year 1 | Year 2 | Year 3 | Year 4 | Year 5 | |||
| Potential Customers | Growth | CAGR | |||||
| Singles | 9% | 335,412 | 365,599 | 398,503 | 434,368 | 473,461 | 9.00% |
| Non-singles | 7% | 301,215 | 322,300 | 344,861 | 369,001 | 394,831 | 7.00% |
| Other | 0% | 0 | 0 | 0 | 0 | 0 | 0.00% |
| Total | 8.07% | 636,627 | 687,899 | 743,364 | 803,369 | 868,292 | 8.07% |
4.2 Target Market Segment Strategy
Colloquy Grog Shop strategy will be based on communicating Grog Shop’s value to the targeted segments. This will be done through a variety of methods. The first method will be strategically placed advertisements. One place that will be used for advertisements is the Willamette Weekly, the liberal arts magazine that details all of the entertainment in Portland. This will be the main source of advertisements because the demographics of their readership are fairly similar to Colloquy Grog Shop’s demographics.
Another source of marketing will be done with strategic relationships with companies that have similar customer demographics. One prime example is the Multnomah Athletic Club. While the clubs patrons are not necessarily overwhelmingly single, the rest of the demographics match. The MAC is a fairly exclusive downtown athletic club that by virtue of the memberships costs, attracts professionals. The strategic relationship with be mutually beneficial where both organizations will develop visibility for each other.
The other form of advertising will be using “grassroots” methods where customers will be given coupons for their friends to try Colloquy Grog Shop for the first time. The coupon will be an economic incentive for the newcomer to try Colloquy Grog Shop. The coupon also has the added force of a referral from a friend.
4.3 Industry Analysis
Colloquy Grog Shop competes within the general bar/coffee shop industry.
The bar industry is a very broad industry. Participants in the industry do not seriously focus on specific niches. Sure there is a flavor to specific bars, but it is not an overwhelming trait. An example of this might be a sports bar that will typically have multiple TVs with sports on. Beyond this “decoration,” there is not a significantly prevailing theme other than the place that serves alcohol. The value that bars offer is a place where someone can go to get alcohol in a social setting. A secondary benefit is an opportunity to meet people. Please see the Product and Services section for commentary on the effectiveness of a bar’s ability for people to meet people. To conclude, most bars have some sort of theme, but overriding theme is a place to socially consume alcohol.
The coffee shop industry is made up of diverse coffee shops that typically serve coffee and assorted coffee drinks as well as various food offerings. Coffee shops are places where people will go to enjoy their favorite coffee beverage, to read a newspaper and relax, or to meet people and engage in conversation. This last purpose of a coffee shop is an unstructured, unstated purpose. It takes place at the hands of the patrons as opposed to a concerted effort by the establishment.
4.3.1 Competition and Buying Patterns
The competition comes from several different sources.
- Bars: there are many different types of bars or taverns. Some are better than others for meeting people, however, none have the business mission to bring together singles.
- Coffee shops: coffee shops are typically an easy-going social setting that does lend itself for people to meet others. Conversations occur in part because of the historical underpinning of coffee houses, in part by virtue of the fact that the background music is not blaring. Coffees shops rarely have any type of organized activities to bring singles together.
- Other events activities aimed at bringing together singles: one phenomenon that has started in New York City and moved to a few other larger cities (not including Portland) is an activity that has a long rectangular table that always has one seat opposing the other. People will sit down and with females on one side and males on the other (this seating arrangement is for heterosexual gatherings, the homosexual gatherings will obviously have the same sex on both sides) and will have a limited number of minutes (usually 10) to chat. Typically, conversations can be be about anything, however you are not to reveal the job/profession that you are involved in, beyond that, anything is fair game. The table rotates and you end up speaking with a lot of different people. You then create a list of the top five that you would like to speak with again and if the matching person also has you on their list, phone numbers are released to the two people. Another activity might be some sort of outdoor activity like hiking or rafting and it is organized as a singles event. There are also other type of singles events, too numerous to mention. Lastly, there are resources like personal sections in local papers where people can post or respond to personal advertisements.
Every person has their own method of meeting people, some more useful than others. Colloquy Grog Shop predicts singles will abandon or at least supplement their current method of meeting people with the Grog Shop’s activities as they are thoughtfully designed to achieve the goal of introducing like minded individuals.
Strategy and Implementation Summary
5.1 Competitive Edge
Colloquy Grog Shop’s competitive edge is based on their unique approach to getting singles together using the structured conversation system. This system was detailed in the Product and Services section, please refer to that section for more information.
This system is a competitive edge because most bars/taverns to not have a niche that they are truly concentrating on. While every bar or coffee shop has a certain “flavor” and that is why someone will choose one bar or another, the flavor is only surface deep. The business model of the establishment is to sell alcohol and provide a social setting. Beyond these two values, there is little other genuine value that the establishments try to provide.
Colloquy Grog Shop is distinguished by the fact that their business model concentrates on developing value for customers beyond serving drinks. The Grog Shop develops an effective, albeit inherently structured or artificial, social setting that encourages meeting like-minded individuals. Providing the drinks is the source of income, an ancillary part of the business model. Generating value for the customers is the main focus, if the customers are happy then the revenue will follow (assuming of course that proper marketing and financial controls are employed). Concentrating on the client’s needs beyond serving alcohol is the distinguishing characteristic that will allow Colloquy Grog Shop to rapidly gain market share.
5.2 Sales Strategy
Stated in an earlier section, the competitive advantage of the structured conversation system is what will drive people to Colloquy Grog Shop and will develop long-lasting customer relationships. What will drive the bottom line beyond creating loyal customers, is revenue generated from sales of drinks and food.
Providing a rotating selection of premium micro beers will be one sales strategy. Micro beers, particularly on tap, have great profit margins. The servers will be well trained in the different beer offerings to provide the customers with in-depth information. Offering a rotating selection will encourage people to visit often and try new beers.
Offering an ever changing selection of tapas encourages repeat visits. Additionally, the choice of tapas encourages people to order several, increasing the per person bill because 1) the tapas offer a reasonable portion of one thing that in itself is not filling for a meal by itself, and 2) tapas are a community food where the table can order many tapas and everyone gets to try some.
Acknowledging that the food and drink are the revenue drivers, the servers will be well trained in the products as well as upselling.
5.2.1 Sales Forecast
The first two months will be used to set up the physical location, hiring personnel, as well as establishing vendor relationships getting an alcohol license. The third month will be the grand opening. Business during the second month will be understandably slow as a steady customer base takes time to build. By month four it is forecasted that sales will steadily grow. Profitability will be reached by year two with sales exceeding $450K.
| Sales Forecast | |||
| Year 1 | Year 2 | Year 3 | |
| Sales | |||
| Drinks | $105,921 | $271,254 | $296,874 |
| Food | $69,908 | $179,028 | $195,937 |
| Total Sales | $175,829 | $450,282 | $492,811 |
| Direct Cost of Sales | Year 1 | Year 2 | Year 3 |
| Drinks | $26,480 | $67,814 | $74,219 |
| Food | $29,361 | $75,192 | $82,293 |
| Subtotal Direct Cost of Sales | $55,842 | $143,005 | $156,512 |
5.3 Milestones
Colloquy Grog Shop will have several milestones early on:
- Business plan completion. This will be done as a road map for the organization. This will be an indispensable tool for the ongoing performance and improvement of the company.
- Set up the physical location and vendor relationships.
- The Grog Shop’s first month of profitability.
- The first marriage based on a Grog Shop introduction.
| Milestones | |||||
| Milestone | Start Date | End Date | Budget | Manager | Department |
| Business plan completion | 1/1/2001 | 2/1/2001 | $0 | ABC | Marketing |
| Set up the physical location and vendor relationships | 1/1/2001 | 3/1/2001 | $0 | ABC | Department |
| The Grog Shop’s first month of profitability | 1/1/2001 | 3/1/2002 | $0 | ABC | Department |
| The first marriage based on a Grog Shop introduction | 1/1/2001 | 12/31/2001 | $0 | ABC | Department |
| Totals | $0 | ||||
Management Summary
Karen Kibbutz received her undergraduate degree in political science at the University of Portland. Through out her four years, Karen worked at various fine restaurants at night because the earning potential was far greater at nicer restaurants than other part-time jobs.
Upon graduation, Karen was unsure of what type of regular job she wanted to pursue so she continued to work full time at the restaurant, and within nine months after graduation, Karen was promoted to manager. Karen found the manager position particularly rewarding because it provided her with real world business experience. The best part was that she was getting paid to learn how to run a business.
As restaurant manager Karen began to notice a trend in chatting with a lot of the clientele, that it was difficult for singles to meet each other. After noticing the trend, Karen began to do some informal polling with many of her customers, gathering information about people meeting people.
After two and a half years of management experience, and five months of informal market research into the business idea of a place to bring singles together for possible meaningful relationships, Karen decided to leverage her newly learned business experience as a revenue stream from the sale of drinks and food, but whose value added service is for meeting people. This lead to the writing of the business plan for Colloquy Grog Shop.
6.1 Personnel Plan
Karen will be the first employee and will wear many different hats. She will be the manager, server, hostess; she will do what ever needs to get done. In addition to Karen, Colloquy Grog Shop will have a chef who is responsible for the creation of the menu as well as food inventory, food preparation, and kitchen line work. The chef will also have the assistance of a line cook. There will be three servers, one of which will also double as an Oregon Liquor Control Commission (OLCC) bar tender. There will also be a full time OLCC bar tender and a dishwasher. The scheduling of these people will be manipulated to meet demand.
| Personnel Plan | |||
| Year 1 | Year 2 | Year 3 | |
| Karen | $36,000 | $40,000 | $45,000 |
| Chef | $38,500 | $38,500 | $38,500 |
| Line cook | $14,400 | $17,280 | $17,280 |
| Server | $11,200 | $13,440 | $13,440 |
| Server | $11,200 | $13,440 | $13,440 |
| Server/bartender | $11,200 | $13,440 | $13,440 |
| Bartender | $11,200 | $13,440 | $13,440 |
| Dishwasher | $11,200 | $13,440 | $13,440 |
| Total People | 8 | 8 | 8 |
| Total Payroll | $144,900 | $162,980 | $167,980 |
Financial Plan
7.1 Important Assumptions
The following table details important financial assumptions.
| General Assumptions | |||
| Year 1 | Year 2 | Year 3 | |
| Plan Month | 1 | 2 | 3 |
| Current Interest Rate | 10.00% | 10.00% | 10.00% |
| Long-term Interest Rate | 10.00% | 10.00% | 10.00% |
| Tax Rate | 30.00% | 30.00% | 30.00% |
| Other | 0 | 0 | 0 |
7.2 Break-even Analysis
The Break-even Analysis indicates that approximately $25,000 will be needed in monthly revenue to reach the break-even point.

| Break-even Analysis | |
| Monthly Revenue Break-even | $24,867 |
| Assumptions: | |
| Average Percent Variable Cost | 32% |
| Estimated Monthly Fixed Cost | $16,969 |
7.3 Projected Profit and Loss
The following table will indicate projected profit and loss.
| Pro Forma Profit and Loss | |||
| Year 1 | Year 2 | Year 3 | |
| Sales | $175,829 | $450,282 | $492,811 |
| Direct Cost of Sales | $55,842 | $143,005 | $156,512 |
| Other Production Expenses | $0 | $0 | $0 |
| Total Cost of Sales | $55,842 | $143,005 | $156,512 |
| Gross Margin | $119,987 | $307,277 | $336,299 |
| Gross Margin % | 68.24% | 68.24% | 68.24% |
| Expenses | |||
| Payroll | $144,900 | $162,980 | $167,980 |
| Sales and Marketing and Other Expenses | $2,400 | $2,400 | $2,400 |
| Depreciation | $9,996 | $9,996 | $9,996 |
| Permits | $1,200 | $1,200 | $1,200 |
| Utilities | $2,400 | $2,400 | $2,400 |
| Insurance | $3,000 | $3,000 | $3,000 |
| Rent | $18,000 | $18,000 | $18,000 |
| Payroll Taxes | $21,735 | $24,447 | $25,197 |
| Other | $0 | $0 | $0 |
| Total Operating Expenses | $203,631 | $224,423 | $230,173 |
| Profit Before Interest and Taxes | ($83,644) | $82,854 | $106,126 |
| EBITDA | ($73,648) | $92,850 | $116,122 |
| Interest Expense | $0 | $0 | $0 |
| Taxes Incurred | $0 | $24,856 | $31,838 |
| Net Profit | ($83,644) | $57,997 | $74,288 |
| Net Profit/Sales | -47.57% | 12.88% | 15.07% |
7.4 Projected Cash Flow
The following chart and table will indicate projected cash flow.
| Pro Forma Cash Flow | |||
| Year 1 | Year 2 | Year 3 | |
| Cash Received | |||
| Cash from Operations | |||
| Cash Sales | $175,829 | $450,282 | $492,811 |
| Subtotal Cash from Operations | $175,829 | $450,282 | $492,811 |
| Additional Cash Received | |||
| Sales Tax, VAT, HST/GST Received | $0 | $0 | $0 |
| New Current Borrowing | $0 | $0 | $0 |
| New Other Liabilities (interest-free) | $0 | $0 | $0 |
| New Long-term Liabilities | $0 | $0 | $0 |
| Sales of Other Current Assets | $0 | $0 | $0 |
| Sales of Long-term Assets | $0 | $0 | $0 |
| New Investment Received | $0 | $0 | $0 |
| Subtotal Cash Received | $175,829 | $450,282 | $492,811 |
| Expenditures | Year 1 | Year 2 | Year 3 |
| Expenditures from Operations | |||
| Cash Spending | $144,900 | $162,980 | $167,980 |
| Bill Payments | $92,562 | $213,297 | $238,801 |
| Subtotal Spent on Operations | $237,462 | $376,277 | $406,781 |
| Additional Cash Spent | |||
| Sales Tax, VAT, HST/GST Paid Out | $0 | $0 | $0 |
| Principal Repayment of Current Borrowing | $0 | $0 | $0 |
| Other Liabilities Principal Repayment | $0 | $0 | $0 |
| Long-term Liabilities Principal Repayment | $0 | $0 | $0 |
| Purchase Other Current Assets | $0 | $0 | $0 |
| Purchase Long-term Assets | $0 | $0 | $0 |
| Dividends | $0 | $0 | $0 |
| Subtotal Cash Spent | $237,462 | $376,277 | $406,781 |
| Net Cash Flow | ($61,633) | $74,004 | $86,030 |
| Cash Balance | $7,217 | $81,221 | $167,251 |
7.5 Projected Balance Sheet
The following chart and table will indicate projected cash flow.
| Pro Forma Balance Sheet | |||
| Year 1 | Year 2 | Year 3 | |
| Assets | |||
| Current Assets | |||
| Cash | $7,217 | $81,221 | $167,251 |
| Other Current Assets | $0 | $0 | $0 |
| Total Current Assets | $7,217 | $81,221 | $167,251 |
| Long-term Assets | |||
| Long-term Assets | $50,000 | $50,000 | $50,000 |
| Accumulated Depreciation | $9,996 | $19,992 | $29,988 |
| Total Long-term Assets | $40,004 | $30,008 | $20,012 |
| Total Assets | $47,221 | $111,229 | $187,263 |
| Liabilities and Capital | Year 1 | Year 2 | Year 3 |
| Current Liabilities | |||
| Accounts Payable | $12,015 | $18,025 | $19,771 |
| Current Borrowing | $0 | $0 | $0 |
| Other Current Liabilities | $0 | $0 | $0 |
| Subtotal Current Liabilities | $12,015 | $18,025 | $19,771 |
| Long-term Liabilities | $0 | $0 | $0 |
| Total Liabilities | $12,015 | $18,025 | $19,771 |
| Paid-in Capital | $120,000 | $120,000 | $120,000 |
| Retained Earnings | ($1,150) | ($84,794) | ($26,796) |
| Earnings | ($83,644) | $57,997 | $74,288 |
| Total Capital | $35,206 | $93,204 | $167,492 |
| Total Liabilities and Capital | $47,221 | $111,229 | $187,263 |
| Net Worth | $35,206 | $93,204 | $167,492 |
7.6 Business Ratios
| Ratio Analysis | ||||
| Year 1 | Year 2 | Year 3 | Industry Profile | |
| Sales Growth | 0.00% | 156.09% | 9.45% | 7.60% |
| Percent of Total Assets | ||||
| Other Current Assets | 0.00% | 0.00% | 0.00% | 35.60% |
| Total Current Assets | 15.28% | 73.02% | 89.31% | 43.70% |
| Long-term Assets | 84.72% | 26.98% | 10.69% | 56.30% |
| Total Assets | 100.00% | 100.00% | 100.00% | 100.00% |
| Current Liabilities | 25.44% | 16.21% | 10.56% | 32.70% |
| Long-term Liabilities | 0.00% | 0.00% | 0.00% | 28.50% |
| Total Liabilities | 25.44% | 16.21% | 10.56% | 61.20% |
| Net Worth | 74.56% | 83.79% | 89.44% | 38.80% |
| Percent of Sales | ||||
| Sales | 100.00% | 100.00% | 100.00% | 100.00% |
| Gross Margin | 68.24% | 68.24% | 68.24% | 60.50% |
| Selling, General & Administrative Expenses | 115.81% | 55.36% | 53.17% | 39.80% |
| Advertising Expenses | 0.68% | 0.27% | 0.24% | 3.20% |
| Profit Before Interest and Taxes | -47.57% | 18.40% | 21.53% | 0.70% |
| Main Ratios | ||||
| Current | 0.60 | 4.51 | 8.46 | 0.98 |
| Quick | 0.60 | 4.51 | 8.46 | 0.65 |
| Total Debt to Total Assets | 25.44% | 16.21% | 10.56% | 61.20% |
| Pre-tax Return on Net Worth | -237.58% | 88.90% | 63.36% | 1.70% |
| Pre-tax Return on Assets | -177.13% | 74.49% | 56.67% | 4.30% |
| Additional Ratios | Year 1 | Year 2 | Year 3 | |
| Net Profit Margin | -47.57% | 12.88% | 15.07% | n.a |
| Return on Equity | -237.58% | 62.23% | 44.35% | n.a |
| Activity Ratios | ||||
| Accounts Payable Turnover | 8.70 | 12.17 | 12.17 | n.a |
| Payment Days | 27 | 25 | 29 | n.a |
| Total Asset Turnover | 3.72 | 4.05 | 2.63 | n.a |
| Debt Ratios | ||||
| Debt to Net Worth | 0.34 | 0.19 | 0.12 | n.a |
| Current Liab. to Liab. | 1.00 | 1.00 | 1.00 | n.a |
| Liquidity Ratios | ||||
| Net Working Capital | ($4,798) | $63,196 | $147,480 | n.a |
| Interest Coverage | 0.00 | 0.00 | 0.00 | n.a |
| Additional Ratios | ||||
| Assets to Sales | 0.27 | 0.25 | 0.38 | n.a |
| Current Debt/Total Assets | 25% | 16% | 11% | n.a |
| Acid Test | 0.60 | 4.51 | 8.46 | n.a |
| Sales/Net Worth | 4.99 | 4.83 | 2.94 | n.a |
| Dividend Payout | 0.00 | 0.00 | 0.00 | n.a |
Appendix
| Sales Forecast | |||||||||||||
| Month 1 | Month 2 | Month 3 | Month 4 | Month 5 | Month 6 | Month 7 | Month 8 | Month 9 | Month 10 | Month 11 | Month 12 | ||
| Sales | |||||||||||||
| Drinks | 0% | $0 | $0 | $5,012 | $7,445 | $7,887 | $8,214 | $8,998 | $11,454 | $13,128 | $13,874 | $14,454 | $15,455 |
| Food | 0% | $0 | $0 | $3,308 | $4,914 | $5,205 | $5,421 | $5,939 | $7,560 | $8,664 | $9,157 | $9,540 | $10,200 |
| Total Sales | $0 | $0 | $8,320 | $12,359 | $13,092 | $13,635 | $14,937 | $19,014 | $21,792 | $23,031 | $23,994 | $25,655 | |
| Direct Cost of Sales | Month 1 | Month 2 | Month 3 | Month 4 | Month 5 | Month 6 | Month 7 | Month 8 | Month 9 | Month 10 | Month 11 | Month 12 | |
| Drinks | $0 | $0 | $1,253 | $1,861 | $1,972 | $2,054 | $2,250 | $2,864 | $3,282 | $3,469 | $3,614 | $3,864 | |
| Food | $0 | $0 | $1,389 | $2,064 | $2,186 | $2,277 | $2,494 | $3,175 | $3,639 | $3,846 | $4,007 | $4,284 | |
| Subtotal Direct Cost of Sales | $0 | $0 | $2,642 | $3,925 | $4,158 | $4,330 | $4,744 | $6,039 | $6,921 | $7,314 | $7,620 | $8,148 | |
| Personnel Plan | |||||||||||||
| Month 1 | Month 2 | Month 3 | Month 4 | Month 5 | Month 6 | Month 7 | Month 8 | Month 9 | Month 10 | Month 11 | Month 12 | ||
| Karen | 0% | $3,000 | $3,000 | $3,000 | $3,000 | $3,000 | $3,000 | $3,000 | $3,000 | $3,000 | $3,000 | $3,000 | $3,000 |
| Chef | 0% | $0 | $3,500 | $3,500 | $3,500 | $3,500 | $3,500 | $3,500 | $3,500 | $3,500 | $3,500 | $3,500 | $3,500 |
| Line cook | 0% | $0 | $0 | $1,440 | $1,440 | $1,440 | $1,440 | $1,440 | $1,440 | $1,440 | $1,440 | $1,440 | $1,440 |
| Server | 0% | $0 | $0 | $1,120 | $1,120 | $1,120 | $1,120 | $1,120 | $1,120 | $1,120 | $1,120 | $1,120 | $1,120 |
| Server | 0% | $0 | $0 | $1,120 | $1,120 | $1,120 | $1,120 | $1,120 | $1,120 | $1,120 | $1,120 | $1,120 | $1,120 |
| Server/bartender | 0% | $0 | $0 | $1,120 | $1,120 | $1,120 | $1,120 | $1,120 | $1,120 | $1,120 | $1,120 | $1,120 | $1,120 |
| Bartender | 0% | $0 | $0 | $1,120 | $1,120 | $1,120 | $1,120 | $1,120 | $1,120 | $1,120 | $1,120 | $1,120 | $1,120 |
| Dishwasher | 0% | $0 | $0 | $1,120 | $1,120 | $1,120 | $1,120 | $1,120 | $1,120 | $1,120 | $1,120 | $1,120 | $1,120 |
| Total People | 1 | 2 | 8 | 8 | 8 | 8 | 8 | 8 | 8 | 8 | 8 | 8 | |
| Total Payroll | $3,000 | $6,500 | $13,540 | $13,540 | $13,540 | $13,540 | $13,540 | $13,540 | $13,540 | $13,540 | $13,540 | $13,540 | |
| General Assumptions | |||||||||||||
| Month 1 | Month 2 | Month 3 | Month 4 | Month 5 | Month 6 | Month 7 | Month 8 | Month 9 | Month 10 | Month 11 | Month 12 | ||
| Plan Month | 1 | 2 | 3 | 4 | 5 | 6 | 7 | 8 | 9 | 10 | 11 | 12 | |
| Current Interest Rate | 10.00% | 10.00% | 10.00% | 10.00% | 10.00% | 10.00% | 10.00% | 10.00% | 10.00% | 10.00% | 10.00% | 10.00% | |
| Long-term Interest Rate | 10.00% | 10.00% | 10.00% | 10.00% | 10.00% | 10.00% | 10.00% | 10.00% | 10.00% | 10.00% | 10.00% | 10.00% | |
| Tax Rate | 30.00% | 30.00% | 30.00% | 30.00% | 30.00% | 30.00% | 30.00% | 30.00% | 30.00% | 30.00% | 30.00% | 30.00% | |
| Other | 0 | 0 | 0 | 0 | 0 | 0 | 0 | 0 | 0 | 0 | 0 | 0 | |
| Pro Forma Profit and Loss | |||||||||||||
| Month 1 | Month 2 | Month 3 | Month 4 | Month 5 | Month 6 | Month 7 | Month 8 | Month 9 | Month 10 | Month 11 | Month 12 | ||
| Sales | $0 | $0 | $8,320 | $12,359 | $13,092 | $13,635 | $14,937 | $19,014 | $21,792 | $23,031 | $23,994 | $25,655 | |
| Direct Cost of Sales | $0 | $0 | $2,642 | $3,925 | $4,158 | $4,330 | $4,744 | $6,039 | $6,921 | $7,314 | $7,620 | $8,148 | |
| Other Production Expenses | $0 | $0 | $0 | $0 | $0 | $0 | $0 | $0 | $0 | $0 | $0 | $0 | |
| Total Cost of Sales | $0 | $0 | $2,642 | $3,925 | $4,158 | $4,330 | $4,744 | $6,039 | $6,921 | $7,314 | $7,620 | $8,148 | |
| Gross Margin | $0 | $0 | $5,678 | $8,434 | $8,934 | $9,305 | $10,193 | $12,975 | $14,871 | $15,716 | $16,373 | $17,507 | |
| Gross Margin % | 0.00% | 0.00% | 68.24% | 68.24% | 68.24% | 68.24% | 68.24% | 68.24% | 68.24% | 68.24% | 68.24% | 68.24% | |
| Expenses | |||||||||||||
| Payroll | $3,000 | $6,500 | $13,540 | $13,540 | $13,540 | $13,540 | $13,540 | $13,540 | $13,540 | $13,540 | $13,540 | $13,540 | |
| Sales and Marketing and Other Expenses | $200 | $200 | $200 | $200 | $200 | $200 | $200 | $200 | $200 | $200 | $200 | $200 | |
| Depreciation | $833 | $833 | $833 | $833 | $833 | $833 | $833 | $833 | $833 | $833 | $833 | $833 | |
| Permits | $100 | $100 | $100 | $100 | $100 | $100 | $100 | $100 | $100 | $100 | $100 | $100 | |
| Utilities | $200 | $200 | $200 | $200 | $200 | $200 | $200 | $200 | $200 | $200 | $200 | $200 | |
| Insurance | $250 | $250 | $250 | $250 | $250 | $250 | $250 | $250 | $250 | $250 | $250 | $250 | |
| Rent | $1,500 | $1,500 | $1,500 | $1,500 | $1,500 | $1,500 | $1,500 | $1,500 | $1,500 | $1,500 | $1,500 | $1,500 | |
| Payroll Taxes | 15% | $450 | $975 | $2,031 | $2,031 | $2,031 | $2,031 | $2,031 | $2,031 | $2,031 | $2,031 | $2,031 | $2,031 |
| Other | $0 | $0 | $0 | $0 | $0 | $0 | $0 | $0 | $0 | $0 | $0 | $0 | |
| Total Operating Expenses | $6,533 | $10,558 | $18,654 | $18,654 | $18,654 | $18,654 | $18,654 | $18,654 | $18,654 | $18,654 | $18,654 | $18,654 | |
| Profit Before Interest and Taxes | ($6,533) | ($10,558) | ($12,976) | ($10,220) | ($9,720) | ($9,349) | ($8,461) | ($5,679) | ($3,783) | ($2,938) | ($2,281) | ($1,147) | |
| EBITDA | ($5,700) | ($9,725) | ($12,143) | ($9,387) | ($8,887) | ($8,516) | ($7,628) | ($4,846) | ($2,950) | ($2,105) | ($1,448) | ($314) | |
| Interest Expense | $0 | $0 | $0 | $0 | $0 | $0 | $0 | $0 | $0 | $0 | $0 | $0 | |
| Taxes Incurred | $0 | $0 | $0 | $0 | $0 | $0 | $0 | $0 | $0 | $0 | $0 | $0 | |
| Net Profit | ($6,533) | ($10,558) | ($12,976) | ($10,220) | ($9,720) | ($9,349) | ($8,461) | ($5,679) | ($3,783) | ($2,938) | ($2,281) | ($1,147) | |
| Net Profit/Sales | 0.00% | 0.00% | -155.97% | -82.70% | -74.24% | -68.57% | -56.65% | -29.87% | -17.36% | -12.75% | -9.50% | -4.47% | |
| Pro Forma Cash Flow | |||||||||||||
| Month 1 | Month 2 | Month 3 | Month 4 | Month 5 | Month 6 | Month 7 | Month 8 | Month 9 | Month 10 | Month 11 | Month 12 | ||
| Cash Received | |||||||||||||
| Cash from Operations | |||||||||||||
| Cash Sales | $0 | $0 | $8,320 | $12,359 | $13,092 | $13,635 | $14,937 | $19,014 | $21,792 | $23,031 | $23,994 | $25,655 | |
| Subtotal Cash from Operations | $0 | $0 | $8,320 | $12,359 | $13,092 | $13,635 | $14,937 | $19,014 | $21,792 | $23,031 | $23,994 | $25,655 | |
| Additional Cash Received | |||||||||||||
| Sales Tax, VAT, HST/GST Received | 0.00% | $0 | $0 | $0 | $0 | $0 | $0 | $0 | $0 | $0 | $0 | $0 | $0 |
| New Current Borrowing | $0 | $0 | $0 | $0 | $0 | $0 | $0 | $0 | $0 | $0 | $0 | $0 | |
| New Other Liabilities (interest-free) | $0 | $0 | $0 | $0 | $0 | $0 | $0 | $0 | $0 | $0 | $0 | $0 | |
| New Long-term Liabilities | $0 | $0 | $0 | $0 | $0 | $0 | $0 | $0 | $0 | $0 | $0 | $0 | |
| Sales of Other Current Assets | $0 | $0 | $0 | $0 | $0 | $0 | $0 | $0 | $0 | $0 | $0 | $0 | |
| Sales of Long-term Assets | $0 | $0 | $0 | $0 | $0 | $0 | $0 | $0 | $0 | $0 | $0 | $0 | |
| New Investment Received | $0 | $0 | $0 | $0 | $0 | $0 | $0 | $0 | $0 | $0 | $0 | $0 | |
| Subtotal Cash Received | $0 | $0 | $8,320 | $12,359 | $13,092 | $13,635 | $14,937 | $19,014 | $21,792 | $23,031 | $23,994 | $25,655 | |
| Expenditures | Month 1 | Month 2 | Month 3 | Month 4 | Month 5 | Month 6 | Month 7 | Month 8 | Month 9 | Month 10 | Month 11 | Month 12 | |
| Expenditures from Operations | |||||||||||||
| Cash Spending | $3,000 | $6,500 | $13,540 | $13,540 | $13,540 | $13,540 | $13,540 | $13,540 | $13,540 | $13,540 | $13,540 | $13,540 | |
| Bill Payments | $90 | $2,718 | $3,348 | $6,966 | $8,214 | $8,445 | $8,625 | $9,068 | $10,349 | $11,215 | $11,606 | $11,919 | |
| Subtotal Spent on Operations | $3,090 | $9,218 | $16,888 | $20,506 | $21,754 | $21,985 | $22,165 | $22,608 | $23,889 | $24,755 | $25,146 | $25,459 | |
| Additional Cash Spent | |||||||||||||
| Sales Tax, VAT, HST/GST Paid Out | $0 | $0 | $0 | $0 | $0 | $0 | $0 | $0 | $0 | $0 | $0 | $0 | |
| Principal Repayment of Current Borrowing | $0 | $0 | $0 | $0 | $0 | $0 | $0 | $0 | $0 | $0 | $0 | $0 | |
| Other Liabilities Principal Repayment | $0 | $0 | $0 | $0 | $0 | $0 | $0 | $0 | $0 | $0 | $0 | $0 | |
| Long-term Liabilities Principal Repayment | $0 | $0 | $0 | $0 | $0 | $0 | $0 | $0 | $0 | $0 | $0 | $0 | |
| Purchase Other Current Assets | $0 | $0 | $0 | $0 | $0 | $0 | $0 | $0 | $0 | $0 | $0 | $0 | |
| Purchase Long-term Assets | $0 | $0 | $0 | $0 | $0 | $0 | $0 | $0 | $0 | $0 | $0 | $0 | |
| Dividends | $0 | $0 | $0 | $0 | $0 | $0 | $0 | $0 | $0 | $0 | $0 | $0 | |
| Subtotal Cash Spent | $3,090 | $9,218 | $16,888 | $20,506 | $21,754 | $21,985 | $22,165 | $22,608 | $23,889 | $24,755 | $25,146 | $25,459 | |
| Net Cash Flow | ($3,090) | ($9,218) | ($8,568) | ($8,147) | ($8,661) | ($8,350) | ($7,229) | ($3,594) | ($2,096) | ($1,724) | ($1,152) | $197 | |
| Cash Balance | $65,760 | $56,543 | $47,974 | $39,827 | $31,165 | $22,816 | $15,587 | $11,993 | $9,897 | $8,172 | $7,020 | $7,217 | |
| Pro Forma Balance Sheet | |||||||||||||
| Month 1 | Month 2 | Month 3 | Month 4 | Month 5 | Month 6 | Month 7 | Month 8 | Month 9 | Month 10 | Month 11 | Month 12 | ||
| Assets | Starting Balances | ||||||||||||
| Current Assets | |||||||||||||
| Cash | $68,850 | $65,760 | $56,543 | $47,974 | $39,827 | $31,165 | $22,816 | $15,587 | $11,993 | $9,897 | $8,172 | $7,020 | $7,217 |
| Other Current Assets | $0 | $0 | $0 | $0 | $0 | $0 | $0 | $0 | $0 | $0 | $0 | $0 | $0 |
| Total Current Assets | $68,850 | $65,760 | $56,543 | $47,974 | $39,827 | $31,165 | $22,816 | $15,587 | $11,993 | $9,897 | $8,172 | $7,020 | $7,217 |
| Long-term Assets | |||||||||||||
| Long-term Assets | $50,000 | $50,000 | $50,000 | $50,000 | $50,000 | $50,000 | $50,000 | $50,000 | $50,000 | $50,000 | $50,000 | $50,000 | $50,000 |
| Accumulated Depreciation | $0 | $833 | $1,666 | $2,499 | $3,332 | $4,165 | $4,998 | $5,831 | $6,664 | $7,497 | $8,330 | $9,163 | $9,996 |
| Total Long-term Assets | $50,000 | $49,167 | $48,334 | $47,501 | $46,668 | $45,835 | $45,002 | $44,169 | $43,336 | $42,503 | $41,670 | $40,837 | $40,004 |
| Total Assets | $118,850 | $114,927 | $104,877 | $95,475 | $86,495 | $77,000 | $67,818 | $59,756 | $55,329 | $52,400 | $49,842 | $47,857 | $47,221 |
| Liabilities and Capital | Month 1 | Month 2 | Month 3 | Month 4 | Month 5 | Month 6 | Month 7 | Month 8 | Month 9 | Month 10 | Month 11 | Month 12 | |
| Current Liabilities | |||||||||||||
| Accounts Payable | $0 | $2,610 | $3,118 | $6,693 | $7,932 | $8,158 | $8,324 | $8,724 | $9,976 | $10,829 | $11,209 | $11,504 | $12,015 |
| Current Borrowing | $0 | $0 | $0 | $0 | $0 | $0 | $0 | $0 | $0 | $0 | $0 | $0 | $0 |
| Other Current Liabilities | $0 | $0 | $0 | $0 | $0 | $0 | $0 | $0 | $0 | $0 | $0 | $0 | $0 |
| Subtotal Current Liabilities | $0 | $2,610 | $3,118 | $6,693 | $7,932 | $8,158 | $8,324 | $8,724 | $9,976 | $10,829 | $11,209 | $11,504 | $12,015 |
| Long-term Liabilities | $0 | $0 | $0 | $0 | $0 | $0 | $0 | $0 | $0 | $0 | $0 | $0 | $0 |
| Total Liabilities | $0 | $2,610 | $3,118 | $6,693 | $7,932 | $8,158 | $8,324 | $8,724 | $9,976 | $10,829 | $11,209 | $11,504 | $12,015 |
| Paid-in Capital | $120,000 | $120,000 | $120,000 | $120,000 | $120,000 | $120,000 | $120,000 | $120,000 | $120,000 | $120,000 | $120,000 | $120,000 | $120,000 |
| Retained Earnings | ($1,150) | ($1,150) | ($1,150) | ($1,150) | ($1,150) | ($1,150) | ($1,150) | ($1,150) | ($1,150) | ($1,150) | ($1,150) | ($1,150) | ($1,150) |
| Earnings | $0 | ($6,533) | ($17,091) | ($30,067) | ($40,288) | ($50,007) | ($59,356) | ($67,818) | ($73,496) | ($77,279) | ($80,217) | ($82,497) | ($83,644) |
| Total Capital | $118,850 | $112,317 | $101,759 | $88,783 | $78,562 | $68,843 | $59,494 | $51,032 | $45,354 | $41,571 | $38,633 | $36,353 | $35,206 |
| Total Liabilities and Capital | $118,850 | $114,927 | $104,877 | $95,475 | $86,495 | $77,000 | $67,818 | $59,756 | $55,329 | $52,400 | $49,842 | $47,857 | $47,221 |
| Net Worth | $118,850 | $112,317 | $101,759 | $88,783 | $78,562 | $68,843 | $59,494 | $51,032 | $45,354 | $41,571 | $38,633 | $36,353 | $35,206 |

