
Double Decker Tours of Washington
Executive Summary
The Company
Double Decker Tours of Washington, LLC (DDTOW), located in the city of Washington, DC is a new sightseeing company in its formative stages. It is being organized to take advantage of a specific gap in the local sightseeing tour market. The gap exists in high quality, reasonably priced sightseeing tours in the nation’s capital away from the city center, indicating that a new entrant tour company could be expected to capture a significant portion of the current sightseeing tour market.
The Company’s Mission
Double Decker Tours of Washington’s mission is to provide safe, reliable and fun sightseeing tours to the visitors of Washington, DC using London-style double-decker buses. Nine of the buses will be open top for sunny warm and beautiful days and three will be closed for cold and inclement weather.
Product and Services
DDTOW will provide daily sightseeing tours and charter services in Washington, DC. We will survey the White House, Capitol Building, Supreme Court, Senate Office Buildings, House Office Buildings, Museums, Library of Congress, etc., as well as Adams Morgan, the U Street Corridor, Catholic University and many other sites that make up the city.
Marketing and Sales Strategy
DDTOW will develop a message that touring with us is fun and we will project that message over the airwaves and in print. We will kick off our message using Comcast Cable System in the Washington area as well as hosting parties for certain tour association decision makers and the media. We plan a pre-opening marketing budget of $80,000. As we profit, we will spend about 1% of gross revenues on advertisement and marketing. We will also distribute survey cards to assess what we are doing right and identify what we are doing wrong.
The Competition
Our main competitors in the Washington sightseeing market are:
- Tourmobile: Tourmobile is based at East Potomac Park and is authorized by the National Park Service to conduct sightseeing tours along the National Mall and in Arlington National Cemetary. Tourmobile uses a shuttle service employing 85-passenger trams along the Mall and 120-passenger trams in Arlington. They have been in business for over 25 years. Tourmobile was started in 1969 as a subsidiary of Universal Studios to provide interpretive services along the National Mall. In 1981 Tom Mack bought the company making Tourmobile, Inc. a locally owned Washington DC company. Tourmobile has over 42 vehicles and serves upwards of 2 million riders annually.
- Historic Tours of America: HTA operates in Washington as the Old Town Trolley and DC Ducks. HTA is a national company with outlets across the country. HTA, like Tourmobile, uses a shuttle system for its passengers and they use 35- to 60-passenger trolleys.
- Grayline: Grayline International is a global company with offices and tours around the world. Grayline contracts out its services to local bus lines and runs multiple tours. Grayline runs the Lil Red Trolley as its service in Washington.
- Zohery Tours: Zohery Tours is a local company that runs 15-passenger vans and 45-passenger coach buses. Zohery tours are about 3 hours in length.
Target Market
In recent Washington Convention and Tourism Corporation figures, it showed that 17.6 million people came to visit Washington, DC, spending over $10 billion dollars; $4 billion of that on sightseeing and tourism related activities. Although overnight leisure travel increased significantly while day-trip volume was down, the good news was that average trip expenditures increased to levels of $480 per day per trip. Many of the trips that were made to the city centered around visiting historical places and museums (36%) and shopping (24%). In leisure travel, 36% of visitors were solo travelers as compared to 80% of business travelers and 23% of leisure travelers came with children as compared to 6% of business travelers. Also many of our visitors to the city have income of over $75K, were married, had no children, were in the 35-54 age group, and had an advanced degree. Visits from foreign tourists fell three years ago by 19% and by 14% two years ago, but over 1 million foreign tourists came to Washington, making it 8th in US destinations by foreign visitors.
Management
Michael Frank Coleman* will serve as member manager. He has extensive experience in the Washington sightseeing industry, working for Tourmobile and conducting walking tours around town. Mr. Coleman has a knack for recognizing opportunities and developing staff members to take advantage of those situations. Mr. Coleman will assemble a staff of experienced tour professionals to oversee operations and market our services.
Paul F. Williams* has over 30 years of entrepreneurial experience in international and private sector business development and will act as DDTOW’s business development manager.
*Confidential and proprietary resume data has been omitted from this sample plan.
Operations
Tickets sales and boarding of the buses will take place at the MCI Center at 601 F Street in Northwest Washington. This site gives us great foot traffic in the heart of the entertainment district as well as ample parking and public transportation access. The buses will be stored and serviced by Peter Pan Bus Service in Tuxedo, Maryland thereby reducing staff cost and insuring top notch services for our customers. A small office located on Third Street in Northeast Washington will serve as administrative offices.
Financial
Our research and projections indicate that the demand for sightseeing tours in and around Washington is sufficient to provide Double Decker Tours of Washington, LLC with revenues of over $14 million dollars in its first full year of operations, utilizing 15 used London-style double-decker tour buses and selected routes throughout the city. These sales figures are based on capturing 453,000 customers out of a potential customer base of 22 million people. Second year revenues are expected to exceed $17 million serving over 500,000 customers with additional advertising and expanded tours. The DDTOW plan has the potential for a more rapid growth due in part to new memorial and other venues that are opening in Washington in the near future. In short, the demands for tours in DDTOW’s target market during the coming year will be more than enough to support DDTOW’s anticipated market share. These sales levels will produce net profits of $13 million dollars in the first operational year and $15 million in year two. Net profits in year one will be over 60% of sales and will maintain that level in year two. The company’s long term plan is part of the due diligence package. The first few months of formative operation will burn cash (see the Start-up table later in this document) until revenue can commence. This is due to the organizational and regulatory obligations of a new tour operator but aggressive marketing and promotion will readily make up for the slow start.
Long-Term Development & Exit Plan
Goals
Our tours, along with the use of double-decker buses, that target new routes in the city, and aggressive media exposure will allow us to grow over the next five years into a major player in the region. Our goal is to create a reputation of quality, fun and safety that will make us the leader in the Washington area sightseeing/tour market.

Milestones
After our service starts, we will keep a close eye on sales and profit. If we are on target at the end of year two, we will look to expand into a new market.
Risk Evaluation
With any new venture, there is risk involved. The success of our project hinges on the strength of acceptance of our new tours and buses. After year one, we expect a lot of competition in the form of the established tour operators banding together against us.
Exit Plan
Ideally, DDTOW would like to expand into the Baltimore, Richmond, Atlanta and Miami markets over the next ten years. At that time, we will entertain the possibility of a buy-out by a larger Sightseeing/Tour operator or seek to sell to a new owner.
Funds Sought and Utilization
DDTOW is seeking financing of $800,000, in the form of a five-year loan. Most of the planned start-up costs are apportioned to the following areas in approximately declining value:
- Purchasing twelve 70-passenger London-style double-decker sightseeing buses, nine of which are open top for beautiful days and nights and three closed top for cold or inclement weather.
- Provisions of a sufficient cash reserve to assure timely payment of operating costs of the buses for the first three months.
- Costs associated with recruiting, training, and paying operational crews.
- Marketing, advertising, and public relations costs, including the cost of setting up a website capable of offering tour information and making online sales and reservations, and related Internet marketing, as well as conventional print and broadcast advertising, and public relations activities.
- Administrative and legal costs incurred in setting up the business and the tour operations.
- A reserve to cover overall operating costs, aside from bus operating costs, over at least the first three months of operations.
The following chart illustrates the highlights of our business plan over the first three years.

1.1 Objectives
Double Decker Tours of Washington will have as it primary objectives the following elements:
- To establish and operate a new tour company aiming specifically at touring the monuments, memorials, museums, and government buildings of the capital city as well as touring the historic neighborhoods away from the city center.
- To implement an organizational and marketing strategy that will, beginning in the first months of operation, achieve an average load per bus of 65-85 percent depending on season and increasing thereafter to 75-100 percent, thereby maximizing revenues and return on investment while reducing risk.
- To achieve revenues of about $14 million by our first full year of tour operations, exceeding $20 million by our third year. Also to expand into newer markets in the Baltimore-Washington corridor.
- To achieve net operating profits of 60-70 percent within the first 12 months of tour operations and steady growth enabling rational expansion of the company thereafter.
- To achieve the following results starting with twelve 70-passenger London-style doubledecker buses obtained through purchase to serve the touring public in Washington and incrementally expanding the fleet as demand grows.
- To gear operations, and present a professional, serious, growth-oriented image from the outset, that will set the stage for a reasoned, planned expansion, mirroring growth rates projected for the first years of operations.
- As an element critical to achieving DDTOW’s other key objectives, to identify and develop strategic alliances through the DC Chamber of Commerce, the Greater Washington Board of Trade, the Washington Convention and Tourism Corporation and other Washington associations and tourism groups.
1.2 Keys to Success
In descending order of importance, the five critical keys to success for Double Decker Tours of Washington are:
- Employing an experienced, highly professional management team that combines vision; realism; financial ability; solid knowledge of the Washington tour/sightseeing market; familiarity with, and belief in, the utilization and benefits of the latest computer informational technologies; realization of the crucial importance of an organization personnel to its success; and a total commitment to the overall mission and goals of Double Decker Tours of Washington.
- Intelligent, progressive, and aggressive marketing that identifies the company as a different kind of player, one that is sharper and smarter, with a higher level of professionalism and operational standard than is the norm in the Washington region. Concentration on safety, with highly trained, dedicated, and professional personnel, caring for the customer and the customer’s needs and straightforward, understandable fare pricing will form key pillars of the marketing strategy.
- Identification, through careful market research, of unserved or under-served routes in the city that may be of interest to our customers and enable high load factors and profitable operations.
- Use of a fleet of London-style doubledecker buses that offer an unobstructed view of the city from the top deck and offers a high level of comfort, safety, and fuel and operational efficiency.
- Use of information technology to reduce staffing and other operational cost; expand the potential market base; readily capture sales opportunities; and enhance customer convenience and satisfaction.
1.3 Mission
Double Decker Tours of Washington, LLC has a mission to provide safe, professional, reasonably priced sightseeing services to our customers. We intend to fill a niche in the Washington sightseeing market that is unmet at this time, to sites in the city that are not currently shown, as well as highlight the sites that are known to millions of visitors. We will operate and maintain the best fleet of buses available and we will never skimp on safety or customer service. We will always have and promote fun tours so that when the customer leaves us, they will remember the good time they had and recommend us to a friend or relative. We will provide friendly and courteous service from the time we meet to the time they leave.
With a combination of clean buses, friendly and informative and helpful driver guides along with outstanding customer service, DDTOW intends to lead the other companies and make our standards their ambition.
Company Summary
Double Decker Tours of Washington is a new company that will provide daily sightseeing tours in Washington DC. Its sales and boarding point will be located at the MCI Center in Northwest Washington, and administrative offices on Third Street in Northeast Washington. The operation will focus on:
- Providing regular sightseeing tours of the nation’s capital to include monuments, memorials and other sites of interest.
- Provide charter service for special groups.
- Provide tours of other historical and interesting venues away from the city center.
2.1 Company Ownership
Double Decker Tours of Washington will be created as a closely held private District of Columbia Limited Liability Company based in Washington, DC. It will be owned by its founder and principle investors.
2.2 Company Locations and Facilities
Double Decker Tours of Washington will use the facilities of the MCI Center for its boarding and return point in the city. The MCI Center affords DDTOW a safe secure place with plenty of parking and public transportation access. We have agreed to use the ticketing outlets available at MCI to reduce our staffing cost, also it will give us a worldwide ticketing presence by using Ticketmaster. The other facility that we plan to use will be the Peter Pan bus maintenance yard in Tuxedo, Maryland, as this will also reduce staffing and present us with a fixed cost on maintenance that has been covered in our operating budget. A small office on Third Street in Northeast Washington will be used for administrative and order processing purposes.
2.2.1 Hours of Operation
DDTOW will be open seven days a week. Tour service will begin at 8:30 am during the spring and summer months and 9:00 am during the winter. Our evening tour service will begin at 6:30 pm during the winter months and 7:30 pm during spring and summer. We will be closed on Thanksgiving and Christmas.
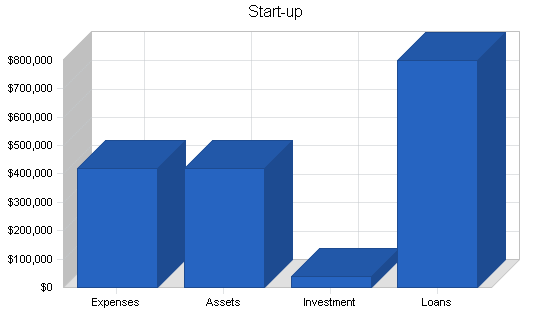
2.3 Start-up Summary
Most of the planned start-up costs are apportioned to the following areas:
- Purchasing twelve 70-passenger London-style double-decker sightseeing buses, nine of which are open top for beautiful days and nights and three closed top for cold or inclement weather. We budgeted $225,000 for the buses, and it will cost us an additional $100,000 for the paint job.
- In addition to the twelve buses, our other long-term assets will include the audio-visual system that will be installed on the buses, for which we budget $80,450.
- Provisions of a sufficient cash reserve to assure timely payment of operating cost of the buses for the first three months.
- Costs associated with recruiting, training and paying operational crews.
- Marketing, advertising, and public relations costs, including the cost of setting up a website capable of offering tour information and making online sales and reservations, and related Internet marketing, as well as conventional print and broadcast advertising, and public relations activities.
- Administrative and legal costs incurred in setting up the business and the tour operations.
- A reserve to cover overall operating costs, aside from bus operating costs, over at least the first three months of operations.
Start-up capital will be financed through investment and long-term loans. Start-up details are located in the table listed below.
| Start-up | |
| Requirements | |
| Start-up Expenses | |
| Legal | $10,000 |
| Stationery etc. | $2,500 |
| Professional Services | $11,500 |
| Brochures | $5,000 |
| Pre-opening Promotion & Advertisement | $80,000 |
| Rent (pre-opening) | $25,000 |
| Salaries (pre-opening) | $75,000 |
| Bookkeeping & financial setup | $6,000 |
| Computers & Web page setup & Photo processing | $35,000 |
| Phones | $3,500 |
| License/Fees | $10,000 |
| Uniforms | $40,000 |
| Paint Job for Buses | $100,000 |
| Membership Fee for Board of Trade | $1,000 |
| Membership Fee for Chamber of Commerce | $350 |
| Membership in Washington Convention & Tourism Corporation | $700 |
| Business travel | $15,000 |
| Total Start-up Expenses | $420,550 |
| Start-up Assets | |
| Cash Required | $114,000 |
| Other Current Assets | $0 |
| Long-term Assets | $305,450 |
| Total Assets | $419,450 |
| Total Requirements | $840,000 |
| Start-up Funding | |
| Start-up Expenses to Fund | $420,550 |
| Start-up Assets to Fund | $419,450 |
| Total Funding Required | $840,000 |
| Assets | |
| Non-cash Assets from Start-up | $305,450 |
| Cash Requirements from Start-up | $114,000 |
| Additional Cash Raised | $0 |
| Cash Balance on Starting Date | $114,000 |
| Total Assets | $419,450 |
| Liabilities and Capital | |
| Liabilities | |
| Current Borrowing | $0 |
| Long-term Liabilities | $800,000 |
| Accounts Payable (Outstanding Bills) | $0 |
| Other Current Liabilities (interest-free) | $0 |
| Total Liabilities | $800,000 |
| Capital | |
| Planned Investment | |
| Michael Coleman | $25,000 |
| Frank Williams | $15,000 |
| Other | $0 |
| Additional Investment Requirement | $0 |
| Total Planned Investment | $40,000 |
| Loss at Start-up (Start-up Expenses) | ($420,550) |
| Total Capital | ($380,550) |
| Total Capital and Liabilities | $419,450 |
| Total Funding | $840,000 |
Services
Double Decker Tours of Washington will provide double-decker bus sightseeing tours throughout Washington and close-in memorials. We will survey the national monuments, White House, US Capitol, and the many government buildings along the way during a 2-1/2 to 3 hour tour. DDTOW will run 12 converted London-style double-decker buses, giving our tour customers an unobstructed photo opportunity of the many beautiful sites in Washington.
To make us different from the rest of the companies that operate here, we will aggressively advertise our services and stress and strive for the best service, tours and customer service in the industry. To accomplish this, we will present surveys to our customers after every tour and we will evaluate our services at our weekly meetings to expand what we are doing right and correct what we are doing wrong. Each night, our buses will be cleaned and serviced to prevent breakdowns and each day, before tours begin, we will inspect ourselves to make sure that we are presentable to our customers. To expand our services to the widest amount of people, in the future, we will install a multilingual audiovisual system aboard each bus that will explain the tour in Spanish, French, Japanese and German, as our driver guide narrates in English.
3.1 Service Description
Double Decker Tours will be a full service tour and sightseeing company which will also provide charters for special occasions. DDTOW’s knowledge of the nation’s capital, it’s rich history, and it’s local entertainment and cultural areas will ensure we provide our customers with a well narrated tour. Our competitive rates and our focus on customer satisfaction will position DDTOW as a tour company that will be able to weather the economic climate that is facing Washington today and help garner repeat business.
Our tours will consist of surveying the White House, Capitol, Senate Office Buildings, House Office Buildings, Library of Congress, Supreme Court, Botanical Garden, National Gallery of Art, Smithsonian Museums, Washington Monument, Holocaust Museum, Hains Point, Jefferson Memorial, Roosevelt Memorial, Lincoln Memorial, Kennedy Center, Georgetown, Iwo Jima Memorial, Embassy Row, National Cathedral, Ford’s Theatre, FBI Headquarters, Union Station, Japanese-American Memorial and many other sites throughout the city.
3.2 Competitive Comparison
The Washington DC tourism and convention market before September 11, 2001 was robust and hosted more than 18 million visitors annually. Since that time, the industry has seen a reduction in the number of visitors because many of the sites that were open now have been closed or access restricted. Although this may present a deterrent to many people, Washington has many visitors that still come for business and pleasure, so that while depressed, the market is growing and will climb back to previous levels in the future. In the Washington metro area, over 4 million people make this their home so Double Decker Tours will have many customers to choose from. DDTOW will tailor its tours to take advantage of areas that are still open.
3.3 Sales Literature
Brochures to feature our tours and services will be produced locally and distributed to hotels, information service kiosks and the Washington Visitor Center. Direct mail, advertisements and sales promotion literature will be utilized as needed.
3.4 Special Interest Tours
Double Decker Tours of Washington will concentrate on the local sightseeing and tour services, but we will also develop special interest tours for Black History Month, Veteran’s Day, Cherry Blossom Festival and others to showcase the diverse cultural aspect of the city. We will employ multilingual narrators to cater to our foreign visitors.
In the future, DDTOW will add buses to our fleet so that we may offer a shuttle service narrative tour in the same way that Tourmobile does today. We intend to expand into the Annapolis and Baltimore markets.
Market Analysis Summary
The travel and tour industry is the third largest retail business in the United States, which generated over $100 billion dollars in revenue. The Washington area tour industry generated over $10 billion dollars, including $4 billion in sightseeing and tour related activities, according the latest figures from the Washington Convention and Tourism Corporation. An estimated 18 million people come to Washington each year on top of the over 4 million that live in the Metro area and the more than 2 million people that enter the city every day for work or pleasure. With the completion of the new Washington Convention Center, WCTC estimates that an additional 3 million people will be attracted to the city thereby bringing additional customers. Researching the future conventions and meetings booked by the Convention Center, preliminary estimates for the coming years show that 415,850 people will be attending meetings or conventions spending approximately $182 million dollars in 2003 and 497,800 people spending $274 million in 2004.
In recent 2002 WCTC figures, overnight leisure travel increased significantly, while day-trip volume was down, but the good thing was that average trip expenditures increased to 2000 levels of $480 per day per trip. Many of trips that were made to the city centered around visiting historical places and museums (36%) and shopping (24%). In leisure travel, 36% of visitors were solo travelers as compared to 80% of business travelers and 23% of leisure travelers came with children as compared to 6% of business travelers. Also many of our visitors to the city have income of over $75 thousand, were married, had no children and were in the 35-54 age group.
Our potential customers are people who want a unique tour experience at a reasonable price. These will include people who come to the city for the day, leisure travelers, honeymooners, budget-conscious travelers, business travelers, families, students and seniors.
4.1 Market Segmentation
- Sightseeing, R&R, Honeymoon, Special Interest: Our most important customers will be the people who visit Washington for sightseeing, rest and relaxation, on their honeymoon or are here for a convention or other special interest. We will develop special pricing to encourage honeymooners to spend some time with us and we will highlight their recent marriage during the tour. Because we support our service people, we will offer discounts to active duty and retired military personnel during Memorial Day and Veteran’s Day holidays.
- High-income: For these travelers price is not an option, so by pricing ourselves in the middle of the market, we will be able to attract these customers.
- Budget conscious travelers, families, students and seniors: This group of travelers will find our prices competitive and the tour unsurpassed by the existing tour companies.
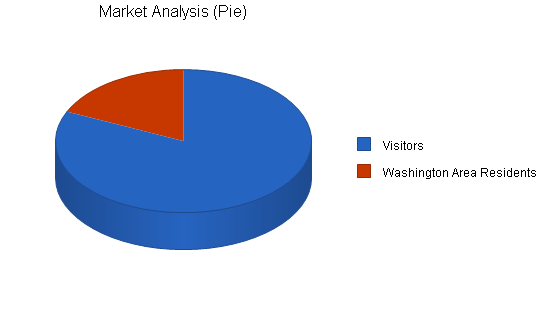
Overall, we split our potential market into the DC visitors and Washington area residents. The table below summarizes our market analysis projections.
| Market Analysis | |||||||
| Year 1 | Year 2 | Year 3 | Year 4 | Year 5 | |||
| Potential Customers | Growth | CAGR | |||||
| Visitors | 10% | 18,000,000 | 19,000,000 | 20,000,000 | 21,000,000 | 22,000,000 | 5.14% |
| Washington Area Residents | 10% | 4,000,000 | 4,100,000 | 4,150,000 | 4,200,000 | 4,250,000 | 1.53% |
| Total | 4.51% | 22,000,000 | 23,100,000 | 24,150,000 | 25,200,000 | 26,250,000 | 4.51% |
4.2 Target Market Segment Strategy
Double Decker Tours is located in Washington, DC, our nation’s capital. The monuments, memorials, theatres, museums and other points of interest make this one of the most visitor intense cities in the country. Each year over 18 million visitors come here and with the opening of the new convention center, an additional 3-4 million are expected. Also in the next year, many new sites will be opened such as the World War II Memorial Museum, City Museum, US Capitol Visitor Center, Martin Luther King Memorial and American Indian Museum bringing many new visitors and potential customers to the city.
All who come for a day trip or who are here for business or pleasure and stay overnight will be in our target market. We will develop our marketing message to attract these customers and our company policy and aim will be to develop repeat business through word-of-mouth advertising and paid advertisement in the local media. Our proposed location at the MCI Center will also help in attracting customers since it will be in the heart of the entertainment district with plenty of parking and access to Metro.
4.2.1 Market Opportunities
In addition to 4 million residents, the Washington area also welcomes around 18 million visitors annually. As indicated above, both of these groups represent DDTOW’s potential customers. Market research shows that our potential customers spend over 45 weeks per year in a work setting and when they come to Washington, they have between 3 to 7 days to experience our fair city. Many take sightseeing tours to get an informative layout of the monuments and other points of interest. This allows them to familiarize themselves with the historic monuments of the nation’s capital in a relaxing and informative way.
4.3 Service Business Analysis
The US travel and tourism industry is the third largest retail industry generating revenues of over $100 billion dollars a year. The industry is separated into two main categories, business and leisure travel. Each constitutes about 45% to total revenues. The remainder of revenues are generated from combined business/leisure travel. The market is further divided into domestic and international travel. Domestic travel accounts for more than 70% of generated revenues. Business travel can be divided into two categories, the medium and large corporate account and the small independent businessman. Leisure travel is classified according to the types of trips they take, age, and income.
The four primary leisure travel groups are:
- Adventure, Special interest, R&R, Honeymoon and Sightseeing
- High-income Travelers
- Budget-conscious Travelers
- Families, Students and Seniors
4.3.1 Competition and Buying Patterns
There are many companies in Washington providing sightseeing, tours and charter services. Most of them have one or two things in common, they use coach buses (45 passengers), Trolleys (35-40 passengers) or Tram (85-120 passengers) and the two largest, Tourmobile and Old Town Trolley, use a shuttle system where they stop at certain points in the city so the passenger can get off and explore the site. Double Decker Tours may do this in the future, but our focus at this time will be to provide clean buses and informative tours from a single pick-up and drop-off point. During the warm spring, summer, and fall nights we will conduct a three-hour tour where we will make three stops so that our customers can explore the Jefferson, Lincoln, and Roosevelt memorials.
4.3.2 Main Competitors
Our main competitors in the Washington sightseeing industry are:
- Tourmobile: Tourmobile is based at East Potomac Park and is authorized by the National Park Service to conduct sightseeing tours along the National Mall and in Arlington National Cemetary. Tourmobile uses a shuttle service employing 85-passenger trams along the Mall and 120-passenger trams in Arlington. They have been in business for over 25 years. Tourmobile was started in 1969 as a subsidiary of Universal Studios to provide interpretive services along the National Mall. In 1981 Tom Mack bought the company making Tourmobile, Inc. a locally-owned, Washington, DC company. Tourmobile has over 42 vehicles and serves upwards of 2 million riders annually.
- Historic Tours of America: HTA operates in Washington as the Old Town Trolley and DC Ducks. HTA is a national company with outlets across the country. HTA, like Tourmobile, uses a shuttle system for its passengers and they use 35- to 60-passenger trolleys.
- Grayline: Grayline International is a global company with offices and tours around the world. Grayline contracts out its services to local bus lines and runs multiple tours. Grayline runs the Lil Red Trolley as its service in Washington.
- Zohery Tours: Zohery Tours is a local company that runs 15-passenger vans and 45-passenger coach buses. Zohery tours are about 3 hours in length.
Strategy and Implementation Summary
DDTOW will focus it’s efforts, initially, on tours in and around the city of Washington. Being the nation’s capital, its rich history attracts visitors from across the country and around the world. Estimates from the Washington Convention and Tourism Corporation concludes that over 18 million visitors come to the city spending over $10 billion dollars. Most of the money is spent on lodging and food but a considerable portion is spent for touring and sightseeing. By tapping into 2% of the potential market or 453,000 customers, Double Decker Tours is posed to make over $14 million dollars in sales during it’s first full year of operations. We intend to advertise heavily in the region to attract customers and hold unique events to help boost sales.
Another method we will utilize to capture sales will be a Welcome Aboard photograph. How this works is that as our customers are boarding the bus for a tour, we will take a photograph of them and when they return, we will have a digital photo board with their picture on it. If they would like their photo, we will print it and frame it with one of our DDTOW frames, and we will let them e-mail their photo to anyone in the world from our e-mail server.
5.1 Competitive Edge
DDTOW’s competitive edge is recognizing a niche market that is unfulfilled at the moment. That market consists of introducing to the Washington sightseeing public the other city away from the monuments and memorials of the Federal City. Groups such as CulturalTourismDC, HeritageDC, DowntownDC and the mayor’s office are spending millions of dollars to entice visitors to the scenic and entertainment sections of Washington. DDTOW can take advantage of this promotion by introducing a fleet of London-style double-decker buses and specialized tours in the areas that are being highlighted. Tourmobile, because of their charter with the National Park Service, cannot operate off the National Mall and Old Town Trolley, being a national service, has established their routes and at this time are not interested in exploring areas that may not be profitable to them. We, on the other hand, with aggressive marketing and promotion in conjunction with the above groups can capitalize on that new and emerging market as well as provide regular tour around the monument and memorial that most tourist want to see.
5.2 Marketing Strategy
Double Decker Tours adheres to the theory that the goal of business is to create and keep customers happy. Our marketing strategy will reflect this goal as we build our reputation in the Washington sightseeing/tour market. Many of DDTOW’s potential customers spend over 55 weeks per year in a work setting and when they come to Washington, they have between 3 to 7 days to experience our fair city. Many take sightseeing tours to get an informative layout of the monuments and other points of interest.
DDTOW will promote the capital city of monuments, memorial and historical sites plus we will provide them with a view of the other city. Our tours will take them to the neighborhoods that they might have seen in the movies, our entertainment districts, and other prominent sites that will pique their interest. At the end of the tour, our goal is have each and every customer leave the bus with an ear-to-ear grin. That way when the customer goes home, they will tell their friends about our service and the beauty of Washington. We will also follow up our tours with survey forms so that we can get feedback from our customers so that we may improve.
5.2.1 Pricing Scheme
Much of Double Decker Tours’ pricing is determined by our competition. The price of sightseeing in Washington ranges from $15 to $40. By setting our price at the level of $30, we will appeal to the budget conscious traveler as well as those that price is not an option. With a potential market of over 22 million people per year, we are basing our first year figures on servicing 453,000 or 2% of the potential visitors.
5.2.2 Promotion Scheme
The overall concept and design of Double Decker Tours of Washington sets the stage for its promotion. Marketing and promotion will stress the unique buses, the fun you can have with us and quality of tours that will set it apart from the rest. Strong public relations combined with well-placed, well-designed, distinctive advertising appealing directly to people who are our prospective customers will help get the word out.
5.2.3 Marketing Scheme
Customers will be reached through traditional marketing communication methods. Research suggests that our target market customers, and travelers in general, are Internet savvy, so before traveling to Washington, many will access the Web for sightseeing information and may make reservations or purchases via that medium. Besides, the Internet will serve as an effective means of communication and distribution of information about our services. DDTOW will target our customers initially at our kiosks and bus stops as we board our passengers, giving them brochures and other literature that they may share with their family and friends, but we will also look at cable television, radio and other inexpensive media to get our message out.
5.2.3.1 Marketing Effort
The marketing effort will employ a mix of vehicles to convey our message and presence.
- Print media — local newspapers, free weeklies
- Broadcast media — local programming and special interest shows
- Hotel guides — concierge relations, Chamber of Commerce, Board of Trade, Washington Convention and Tourism Corporation brochures
- Misc. — Yellow Pages, charity events
The marketing effort will be split into three phases using the media vehicle described above:
1) Opening — An advanced notice (press packet) sent out to all media and printed announcement ads in key places, rack brochures, direct mail/giveaways. Budget – $80,000
2) Ongoing — A flexible campaign (using above media), assessed regularly for effectiveness. Budget – $12,000 per month in the first year
3) Point of sale — A well trained staff can enhance the customer’s overall experience. Word-of-mouth referral is very important in building a customer base.
5.2.4 Futuristic Plans and Strategic Opportunities
DDTOW, upon successful operation of two years, will begin to develop strategies and plans geared towards opening new offices and sightseeing services in Baltimore, Annapolis, Miami and eventually Atlanta, expanding as the need and resources allow.
5.3 Sales Strategy
Double Decker Tours will aggressively sell the benefits of touring with us by implementing the following action items:
In our first months of operations we will:
- Begin a major advertisement campaign to let the Washington area sightseeing public know that there is a new tour in town.
- We will host a party for the concierges of all the major hotels in Washington and present them with an incentives offer for referrals to DDTOW.
- We will join the DC Chamber of Commerce, Washington Convention and Tourism Corporation and Washington Board of Trade and cohost a meet and greet party for the local business, media and government officials and invite decision makers from the area.
- We will buy inexpensive media time throughout the year on local radio, in the print media, on television and cable television outlets to promote our tours and the fun that you can have traveling with Double Decker Tours.
In the future we will:
- During the school year we will offer discount tours to area schools and during the summer we will offer discount tours to area colleges and universities for their incoming freshmen and their families.
- Develop special tours such as ‘Lovers Only’ tours at Valentine Day.
- Host Fraternity and Sorority night tours.
- Develop ‘Movie Scene’ tours.
- Host Family Reunion special tours.
- Develop Veterans tour specials.
- Host a once a year Stone Cold Family Picnic tour.
- Add to our product line a picture-taking ability so that before customers go on one of our tours, we will take pictures of the group and have a framed portrait waiting for their return, as well as the ability to send the picture via e-mail to anywhere in the world.
Our commitment is to maximize the pleasure of our customers so that their time with us will be one of the most memorable parts of their trip to Washington. As we grow and profit, Double Decker Tours intends to spend from 5% to 10% of gross revenues on advertising thereby raising DDTOW’s image in the regional tour and sightseeing market.
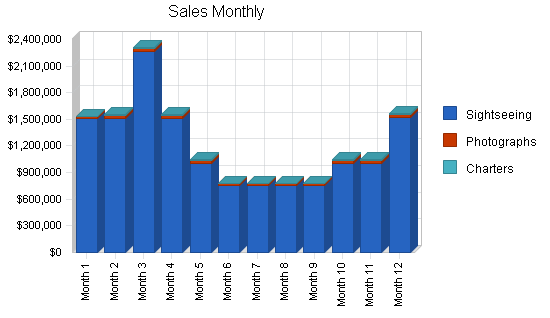
5.3.1 Sales Forecast
The sales forecast is based on DDTOW capturing a 2% share of the over 18 million visitors that visit Washington along with the approximately 4 million people that live in the metro area. That means that DDTOW would have to service 453,000 customers during the 2004-2005 year, 543,600 during the 2005-2006 year and 652,300 during the 2006-2007 year. These figures are based on running an average of 24 tours per day divided between 12 buses during the summer and 8 to 18 tour per day during the winter months. During the summer months in Washington, with the amount of advertising and aggressive marketing that we plan to do, DDTOW will be able to meet the goals that we have set for ourselves.
Another service that DDTOW will offer our customers will be a digital photograph of their group. As the groups prepare to board our buses, we will take photographs of them. After they finish the tour and return to the MCI Center, we will have a framed photo of them already mounted along with a digital copy that they can e-mail through our Internet station to anyone in the world. We will charge only $10 dollars for this and we forecast only about 1 in 15 will take advantage of this option. This is an option that none of our competitors are using at the moment.
The table below summarizes our sales forecast. We have chosen to treat only fuel and photo processing and Internet connections as our direct costs of sales, while some of our other projected expenses related to the service delivery, such as drivers’ salaries, are reflected in our Profit & Loss projections later in this document.

| Sales Forecast | |||
| Year 1 | Year 2 | Year 3 | |
| Sales | |||
| Sightseeing | $14,368,000 | $17,241,600 | $20,689,920 |
| Photographs | $322,366 | $354,603 | $390,063 |
| Charters | $75,500 | $83,050 | $91,355 |
| Total Sales | $14,765,866 | $17,679,253 | $21,171,338 |
| Direct Cost of Sales | Year 1 | Year 2 | Year 3 |
| Photo processing & Internet connection | $46,631 | $48,962 | $51,410 |
| Fuel | $96,000 | $115,000 | $140,000 |
| Subtotal Direct Cost of Sales | $142,631 | $163,962 | $191,410 |
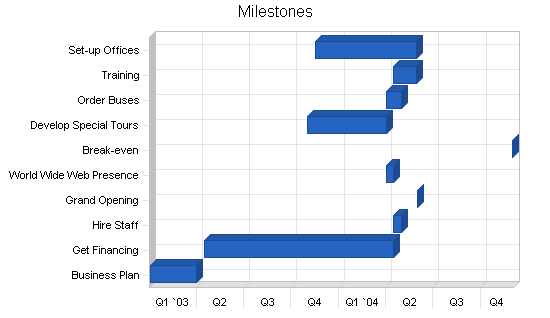
5.4 Milestones
Double Decker Tours of Washington’s important milestones are detailed in the following table. DDTOW believes that it is important for a company to set goals because this helps determine the company’s strategy and tactics, and maintain company focus. The milestones are seen as progress points and will be used to measure DDTOW’s success in reaching it’s goals.
What the table doesn’t show is the commitment behind it. Our business plan includes complete provisions for plan-vs.-actual analysis, and we will hold monthly follow-up meetings to discuss the variance and course corrections.
| Milestones | |||||
| Milestone | Start Date | End Date | Budget | Manager | Department |
| Business Plan | 1/1/2003 | 4/1/2003 | $5,000 | Coleman | Admin |
| Get Financing | 4/16/2003 | 4/15/2004 | $15,000 | Coleman-Williams | Admin |
| Hire Staff | 4/16/2004 | 4/30/2004 | $5,000 | Coleman | Admin |
| Grand Opening | 6/1/2004 | 6/1/2004 | $80,000 | Coleman | Admin |
| World Wide Web Presence | 4/1/2004 | 4/15/2004 | $3,000 | Coleman | Admin |
| Break-even | 12/1/2004 | 12/1/2004 | $0 | Coleman | Admin |
| Develop Special Tours | 11/1/2003 | 4/1/2004 | $8,000 | Staff | Operations |
| Order Buses | 4/1/2004 | 4/30/2004 | $225,000 | Coleman | Operations |
| Training | 4/15/2004 | 5/30/2004 | $20,000 | Coleman | Operations |
| Set-up Offices | 11/16/2003 | 5/30/2004 | $10,000 | Coleman | Admin |
| Totals | $371,000 | ||||
Web Plan Summary
DDTOW will establish a presence on the World Wide Web, linking it to the Washington Visitor Center Web site, to promote our tours, accept electronic mail to answer queries and take reservations.
Management Summary
Mike Coleman and Paul Williams will serve as member managers, however, DDTOW is a small company and its administrative staff will share in management duties and decision making. This will make it important for each member of the team to be capable in all aspects of the business. Prerequisites for all administrative employees will be cash handling, personnel management, computer skills and sightseeing/tour experience.
We will train our staff to become competent in these areas and we will embark on a continuous training program for all employees. Our operations staff will consist of experienced driver/guides, many of whom have already worked in the local market and we will contract out to certain narrators for special projects. DDTOW will contract the maintenance of the buses to Peter Pan in Tuxedo, Maryland, which services Old Town Trolley and Grayline’s Lil Red Trolley, so that the fleet will be well maintained at all times.
7.1 Personnel Plan
DDTOW will begin operating with 22 full time positions. The positions are as follows:
- Member Manager – Michael F. Coleman
- Member Business Development – Paul F. Williams
- Marketing / Sales Associates (4)
- Courtesy Captains (4)
- Driver/guides (12)
Member Manager and owner, Michael F. Coleman, age 50, has knowledge of the local sightseeing and touring industry in the Washington area. Mike has gained his sightseeing and tour experience from working for Tourmobile and conducting walking tours in the city over the past two year. From that experience, he has gain an unique perspective of what it would take to start and run a successful tour and sightseeing company. Mike has also been involved in scheduling, guiding and many administrative functions needed for running a business.
Before starting Double Decker Tours of Washington, LLC, Mike sold health care products under the Equinox label until the company went out of business in November 1999. From that experience, Mike learned how to motivate a sales force, help design new sales strategies and develop creative ways to market the products.
Before that, Mike was a software and database consultant to different companies throughout the Washington area working for such firms as Computer Sciences Corporation, Computer and Applied Sciences, Inc., General Services, Inc., the General Services Administration and PATA USA. In this capacity, Mike was responsible for scheduling, customer service, writing numerous reports and billing of services.
Mike also worked as a member of the board for the H Street Northeast Merchants and Professional Association. Working on the board with numerous business people gave Mike an insight into the day-to-day operations of small businesses and gave him a chance to meet other business people through the associations membership in the Greater Washington Board of Trade. Mike, as a member of the board, also worked on the H Street Festival Committee in 1999, which re-introduced the H Street Festival back to Washington after a long hiatus.
Mike also wrote and independently published a book called the Fitness Diary, which allowed fitness enthusiasts to document their workouts. The Fitness Diary was well received by bodybuilders and those that just wanted to look good.
Member Business Development, Paul F. Williams, has over 30 years of entrepreneurial experience in computer and information technology, export promotion, international business development, private sector development, technology transfer and management and technical assistance domestically and in Africa. Mr. Williams is founder and president of THE INFORMATION PROCESSING COMPANY, INC. (TIPCO, INC.), an international trade and business development firm. His company consults with governmental and private sector organizations, businesses and individuals on issues involving domestic and international trade and business development.
Mr. Williams was the counselor and instructor in International Business Development/Export-Import; past Counselor/Director of Cities In Schools Youth Entrepreneurial Empowerment Project; creator and coordinator of the Volunteer Consultant Corp at Howard University Small Business Development Center; Chairperson, International Trade Committee of the Black Presidents’ Roundtable Association (BPRA); Chairperson, International Trade Committee of the D.C. Chamber of Commerce and many other accomplishments. Mr. Williams will develop strategies for increasing business for DDTOW.
Marketing/Sales Associates: The individuals selected for these positions will have extensive experience in the local tourism and sightseeing industry. They will have a proven track record in generating sales. Their responsibilities in this position will be to develop marketing and sales materials and campaigns as well as supervising sales personnel as we grow.
Courtesy Captains: The individuals selected for these positions will have customer service experience as they will be our face to the public. They will hand out literature about the company and our tours, help customers board the buses and answer questions or complaint that come up. The Captains will also take photographs of our customers as they board the buses for later sales.
Driver/Guides: The individuals selected will be required to have a Commercial Drivers License and Tour Guide License. Drivers will have local knowledge of the city and they will be responsible for the safety of the buses and passengers and will present informative, humorous tours to our customers.
| Personnel Plan | |||
| Year 1 | Year 2 | Year 3 | |
| Member Manager | $72,000 | $84,000 | $96,000 |
| Member Business Development | $50,000 | $60,000 | $72,000 |
| Driver/Guides | $432,000 | $450,000 | $500,000 |
| Marketing/Sales Associates | $100,000 | $125,000 | $156,000 |
| Courtesy Captains | $96,000 | $120,000 | $172,000 |
| Total People | 22 | 24 | 29 |
| Total Payroll | $750,000 | $839,000 | $996,000 |
7.2 Compensation and Incentive Plan
Compensation and incentives for employees and managers of Double Decker Tours of Washington, LLC is as follows:
| Position | Salary | Bonus |
| Member-Manager | $72,000 | 10% of profit after taxes |
| Member-Business Development | $50,000 | 5% of profit after taxes |
| Marketing/Sales Associate | $25,000 | 5% of gross monthly sales |
| Courtesy Captain | $20,000 | Tips and Monthly Customer Service Awards |
| Driver/Guide | $30,000 | Tips and Monthly Customer Service Awards |
Courtesy Captains and Driver/Guides will receive overtime pay (currently estimated at 20%) in addition to their regular salary. Also all employees will be covered under a health, dental, and vision plan after three months of employment. Plans for a profit sharing or 401(k) plan will be available for employees.
At Double Decker Tours of Washington, we believe in an incentive based entrepreneurial approach to management. To have the employee want to work and make money, we will institute programs that will benefit the employee as well as the company. For example, when we sell photographs of our passengers, the Courtesy Captains will make a commission on the photos sold during their shift. How this will benefit them is that a receipt will be processed with the CC name on it so that when a purchase has been transacted, that CC is credited with the sale, thus the commission. At this point, we will assess what commission will be paid. For the drivers, we will allow them to compete for tips as well as overtime pay. But we will also keep tabs on their attendance and appearance. At the end of the month, those drivers that have the best attendance record and appearance will be allowed to compete for the monthly bonus.
7.3 Advisory Committee
Mr. Coleman is in the process of assembling a group of established businessman as his board of advisors so that he may learn from them the lessons they have learned before encountering them himself.
7.4 Professional Support
-
Stitcher, Mosley & Company, PA of Lanham-Seabrook Maryland has been tapped to be our accountants.
-
DH Lloyd and Associates have been contacted about our insurance needs.
Financial Plan
Double Decker Tours of Washington’s financial plan is detailed in the following sections. Preliminary estimates suggest a substantial profit after our first two quarters of operations. Income estimates are based on garnering 2% of the tourist/sightseeing business in Washington with a growth rate of 20% for the next three years and a growth of 10% after that.
All our financial projections present a conservative but realistic depiction of DDTOW’s financial position based on loans and financing of $800,000.
8.1 Important Assumptions
DDTOW, LLC assumes the following:
- Market growth projections for sightseeing will be down because of war fears that permeate the city but with over 4 million residents in the area and over 20 million visitors per year, DDTOW, LLC will be able to experience a 20% growth rate over the next three years.
- Local economic conditions will remain viable and favorable to the tourism industry for the next five years.
- International conditions will change from a war footing to peace thus increasing tourism to the city.
| General Assumptions | |||
| Year 1 | Year 2 | Year 3 | |
| Plan Month | 1 | 2 | 3 |
| Current Interest Rate | 5.00% | 5.00% | 5.00% |
| Long-term Interest Rate | 10.00% | 10.00% | 10.00% |
| Tax Rate | 24.00% | 24.00% | 24.00% |
| Other | 0 | 0 | 0 |
8.2 Break-even Analysis
The break-even analysis is based on an average monthly fixed cost of approximately $121,200. By placing our ticket price between Tourmobile’s price and Old town Trolley’s, we needed only4,000 riders per month to break even. On a thirty-day basis that comes to about 134 riders per day or 12 riders per bus per day. During the fall, spring and summer months, we will more than surpass that number of riders.

| Break-even Analysis | |
| Monthly Revenue Break-even | $111,821 |
| Assumptions: | |
| Average Percent Variable Cost | 1% |
| Estimated Monthly Fixed Cost | $110,741 |
8.3 Projected Profit and Loss
Our projected profit and loss is shown on the following table, with sales increasing from more than $14 million the first year to more than $21 million the third, and profits varying substantially for the start-up phase of this business. We show a profit in the first year on 2% of 22 million visitors to the city or 453,000 customers which equals 1,286 customers per day or making two tours per day for 12 buses.
As with the break-even analysis, we are projecting very conservatively regarding cost of sales and gross margin. Our cost of sales should be much lower, and gross margin higher, than in this projection. We prefer to project conservatively so that we make sure we have enough cash.
The detailed monthly projections are included in the appendices.


| Pro Forma Profit and Loss | |||
| Year 1 | Year 2 | Year 3 | |
| Sales | $14,765,866 | $17,679,253 | $21,171,338 |
| Direct Cost of Sales | $142,631 | $163,962 | $191,410 |
| Other Cost of Sales | $0 | $0 | $0 |
| Total Cost of Sales | $142,631 | $163,962 | $191,410 |
| Gross Margin | $14,623,235 | $17,515,291 | $20,979,928 |
| Gross Margin % | 99.03% | 99.07% | 99.10% |
| Expenses | |||
| Payroll | $750,000 | $839,000 | $996,000 |
| Sales and Marketing and Other Expenses | $144,000 | $180,000 | $220,000 |
| Depreciation | $61,090 | $81,090 | $101,090 |
| Rent | $84,000 | $92,400 | $101,640 |
| Utilities | $9,600 | $11,520 | $13,824 |
| Insurance | $18,000 | $21,600 | $25,920 |
| Payroll Taxes | $0 | $0 | $0 |
| Local Taxes | $24,000 | $28,800 | $34,560 |
| Bus Maintenance | $120,000 | $144,000 | $172,800 |
| Bookkeeping/Payroll | $18,000 | $21,600 | $25,920 |
| Professional Asst. | $6,000 | $7,200 | $8,640 |
| Telephones and Nextels | $7,200 | $8,640 | $10,368 |
| Office Supplies | $3,000 | $3,600 | $4,320 |
| Brochures | $4,200 | $5,040 | $6,048 |
| Licenses/Permits | $1,800 | $2,160 | $2,592 |
| Website Maintenance | $18,000 | $18,000 | $18,000 |
| Miscellaneous | $48,000 | $57,600 | $69,120 |
| Uniforms | $12,000 | $28,800 | $34,560 |
| Total Operating Expenses | $1,328,890 | $1,551,050 | $1,845,402 |
| Profit Before Interest and Taxes | $12,565,035 | $15,903,677 | $19,088,979 |
| EBITDA | $12,626,125 | $15,984,767 | $19,190,069 |
| Interest Expense | $73,075 | $59,848 | $44,757 |
| Taxes Incurred | $2,998,070 | $3,802,519 | $4,570,613 |
| Other Income | |||
| Interest Income | $0 | $0 | $0 |
| Other Income Account Name | $0 | $0 | $0 |
| Total Other Income | $0 | $0 | $0 |
| Other Expense | |||
| Interest Expense | $74,157 | $60,564 | $45,547 |
| Profit tax | $737,335 | $927,140 | $1,107,878 |
| Total Other Expense | $729,310 | $60,564 | $45,547 |
| Net Other Income | ($729,310) | ($60,564) | ($45,547) |
| Net Profit | $9,493,889 | $12,041,310 | $14,473,609 |
| Net Profit/Sales | 64.30% | 68.11% | 68.36% |
8.4 Projected Cash Flow
Cash flow projections are critical to our success. Our analysis shows strong cash generation over the projected period. Some of our assumptions for the cash flow table below are as follows:
- We start repaying on the $800,000 five-year long-term loan at the very beginning of our operations. The first few months will be critical to our survival as we need to make sure that our cash balance remains strong.
- We do not plan any additional long-term asset purchases, except for those summarized in the start-up table earlier in this document, for the first year. During the second and third year we budget $100,000 for each year for additional long-term asset, which may include some additional or replacement buses.
- We assume collecting the District of Columbia’s sales tax (5.75%) off the ticket sales. These sales taxes will be paid out quarterly. For all additional purchases (i.e., operational expenses and capital assets) we assume prices inclusive of applicable sales taxes.
The monthly cash is shown in the illustration below, with one bar representing the cash flow per month, and the other the monthly cash balance. The annual cash flow figures are included here and the more important detailed monthly numbers are included in the appendices.

| Pro Forma Cash Flow | |||
| Year 1 | Year 2 | Year 3 | |
| Cash Received | |||
| Cash from Operations | |||
| Cash Sales | $14,765,866 | $17,679,253 | $21,171,338 |
| Subtotal Cash from Operations | $14,765,866 | $17,679,253 | $21,171,338 |
| Additional Cash Received | |||
| Non Operating (Other) Income | $0 | $0 | $0 |
| Sales Tax, VAT, HST/GST Received | $0 | $0 | $0 |
| New Current Borrowing | $0 | $0 | $0 |
| New Other Liabilities (interest-free) | $0 | $0 | $0 |
| New Long-term Liabilities | $0 | $0 | $0 |
| Sales of Other Current Assets | $0 | $0 | $0 |
| Sales of Long-term Assets | $0 | $0 | $0 |
| New Investment Received | $0 | $0 | $0 |
| Subtotal Cash Received | $14,765,866 | $17,679,253 | $21,171,338 |
| Expenditures | Year 1 | Year 2 | Year 3 |
| Expenditures from Operations | |||
| Cash Spending | $750,000 | $839,000 | $996,000 |
| Bill Payments | $3,359,554 | $4,646,520 | $5,481,300 |
| Subtotal Spent on Operations | $4,109,554 | $5,485,520 | $6,477,300 |
| Additional Cash Spent | |||
| Non Operating (Other) Expense | $729,310 | $60,564 | $45,547 |
| Sales Tax, VAT, HST/GST Paid Out | $0 | $0 | $0 |
| Principal Repayment of Current Borrowing | $0 | $0 | $0 |
| Other Liabilities Principal Repayment | $0 | $0 | $0 |
| Long-term Liabilities Principal Repayment | $129,814 | $143,408 | $158,425 |
| Purchase Other Current Assets | $0 | $0 | $0 |
| Purchase Long-term Assets | $0 | $100,000 | $100,000 |
| Dividends | $0 | $0 | $0 |
| Subtotal Cash Spent | $4,968,679 | $5,789,492 | $6,781,272 |
| Net Cash Flow | $9,797,187 | $11,889,761 | $14,390,066 |
| Cash Balance | $9,911,187 | $21,800,947 | $36,191,013 |
8.5 Projected Balance Sheet
The balance sheet in the following table shows managed but sufficient growth of net worth, and a sufficiently healthy financial position. The monthly estimates are included in the appendices.
| Pro Forma Balance Sheet | |||
| Year 1 | Year 2 | Year 3 | |
| Assets | |||
| Current Assets | |||
| Cash | $9,911,187 | $21,800,947 | $36,191,013 |
| Other Current Assets | $0 | $0 | $0 |
| Total Current Assets | $9,911,187 | $21,800,947 | $36,191,013 |
| Long-term Assets | |||
| Long-term Assets | $305,450 | $405,450 | $505,450 |
| Accumulated Depreciation | $61,090 | $142,180 | $243,270 |
| Total Long-term Assets | $244,360 | $263,270 | $262,180 |
| Total Assets | $10,155,547 | $22,064,217 | $36,453,193 |
| Liabilities and Capital | Year 1 | Year 2 | Year 3 |
| Current Liabilities | |||
| Accounts Payable | $372,022 | $382,791 | $456,583 |
| Current Borrowing | $0 | $0 | $0 |
| Other Current Liabilities | $0 | $0 | $0 |
| Subtotal Current Liabilities | $372,022 | $382,791 | $456,583 |
| Long-term Liabilities | $670,186 | $526,778 | $368,353 |
| Total Liabilities | $1,042,207 | $909,568 | $824,935 |
| Paid-in Capital | $40,000 | $40,000 | $40,000 |
| Retained Earnings | ($420,550) | $9,073,339 | $21,114,648 |
| Earnings | $9,493,889 | $12,041,310 | $14,473,609 |
| Total Capital | $9,113,339 | $21,154,648 | $35,628,257 |
| Total Liabilities and Capital | $10,155,546 | $22,064,217 | $36,453,193 |
| Net Worth | $9,113,339 | $21,154,649 | $35,628,258 |
8.6 Business Ratios
We expect to maintain healthy ratios for profitability, risk, and return. The following table outlines some of the more important ratios from the Sightseeing tour company industry. The final column, Industry Profile, details specific ratios based on the industry as it is classified by the Standard Industry Classification (SIC) code, 4725.9902.
| Ratio Analysis | ||||
| Year 1 | Year 2 | Year 3 | Industry Profile | |
| Sales Growth | 0.00% | 19.73% | 19.75% | 5.03% |
| Percent of Total Assets | ||||
| Other Current Assets | 0.00% | 0.00% | 0.00% | 38.77% |
| Total Current Assets | 97.59% | 98.81% | 99.28% | 63.07% |
| Long-term Assets | 2.41% | 1.19% | 0.72% | 36.93% |
| Total Assets | 100.00% | 100.00% | 100.00% | 100.00% |
| Current Liabilities | 3.66% | 1.73% | 1.25% | 31.32% |
| Long-term Liabilities | 6.60% | 2.39% | 1.01% | 17.81% |
| Total Liabilities | 10.26% | 4.12% | 2.26% | 49.13% |
| Net Worth | 89.74% | 95.88% | 97.74% | 50.87% |
| Percent of Sales | ||||
| Sales | 100.00% | 100.00% | 100.00% | 100.00% |
| Gross Margin | 99.03% | 99.07% | 99.10% | 39.36% |
| Selling, General & Administrative Expenses | 9.89% | 9.64% | 9.43% | 28.53% |
| Advertising Expenses | 0.00% | 0.00% | 0.00% | 1.21% |
| Profit Before Interest and Taxes | 85.10% | 89.96% | 90.16% | 1.07% |
| Main Ratios | ||||
| Current | 26.64 | 56.95 | 79.26 | 1.51 |
| Quick | 26.64 | 56.95 | 79.26 | 1.17 |
| Total Debt to Total Assets | 10.26% | 4.12% | 2.26% | 2.79% |
| Pre-tax Return on Net Worth | 137.07% | 74.90% | 53.45% | 55.37% |
| Pre-tax Return on Assets | 123.01% | 71.81% | 52.24% | 6.25% |
| Additional Ratios | Year 1 | Year 2 | Year 3 | |
| Net Profit Margin | 64.30% | 68.11% | 68.36% | n.a |
| Return on Equity | 104.18% | 56.92% | 40.62% | n.a |
| Activity Ratios | ||||
| Accounts Payable Turnover | 10.03 | 12.17 | 12.17 | n.a |
| Payment Days | 27 | 30 | 28 | n.a |
| Total Asset Turnover | 1.45 | 0.80 | 0.58 | n.a |
| Debt Ratios | ||||
| Debt to Net Worth | 0.11 | 0.04 | 0.02 | n.a |
| Current Liab. to Liab. | 0.36 | 0.42 | 0.55 | n.a |
| Liquidity Ratios | ||||
| Net Working Capital | $9,539,165 | $21,418,156 | $35,734,430 | n.a |
| Interest Coverage | 171.95 | 265.73 | 426.51 | n.a |
| Additional Ratios | ||||
| Assets to Sales | 0.69 | 1.25 | 1.72 | n.a |
| Current Debt/Total Assets | 4% | 2% | 1% | n.a |
| Acid Test | 26.64 | 56.95 | 79.26 | n.a |
| Sales/Net Worth | 1.62 | 0.84 | 0.59 | n.a |
| Dividend Payout | 0.00 | 0.00 | 0.00 | n.a |
Appendix
| Sales Forecast | |||||||||||||
| Month 1 | Month 2 | Month 3 | Month 4 | Month 5 | Month 6 | Month 7 | Month 8 | Month 9 | Month 10 | Month 11 | Month 12 | ||
| Sales | |||||||||||||
| Sightseeing | 0% | $1,512,000 | $1,512,000 | $2,268,000 | $1,512,000 | $1,008,000 | $756,000 | $756,000 | $756,000 | $756,000 | $1,008,000 | $1,008,000 | $1,516,000 |
| Photographs | 0% | $16,967 | $33,933 | $33,933 | $33,933 | $33,933 | $16,967 | $16,967 | $16,967 | $16,967 | $33,933 | $33,933 | $33,933 |
| Charters | 0% | $5,000 | $5,000 | $7,000 | $7,000 | $7,000 | $4,000 | $3,500 | $3,500 | $5,000 | $7,500 | $9,000 | $12,000 |
| Total Sales | $1,533,967 | $1,550,933 | $2,308,933 | $1,552,933 | $1,048,933 | $776,967 | $776,467 | $776,467 | $777,967 | $1,049,433 | $1,050,933 | $1,561,933 | |
| Direct Cost of Sales | Month 1 | Month 2 | Month 3 | Month 4 | Month 5 | Month 6 | Month 7 | Month 8 | Month 9 | Month 10 | Month 11 | Month 12 | |
| Photo processing & Internet connection | $3,000 | $4,500 | $4,500 | $4,500 | $4,150 | $3,800 | $3,606 | $3,574 | $3,000 | $3,500 | $4,000 | $4,500 | |
| Fuel | $8,000 | $8,000 | $8,000 | $8,000 | $8,000 | $8,000 | $8,000 | $8,000 | $8,000 | $8,000 | $8,000 | $8,000 | |
| Subtotal Direct Cost of Sales | $11,000 | $12,500 | $12,500 | $12,500 | $12,150 | $11,800 | $11,606 | $11,574 | $11,000 | $11,500 | $12,000 | $12,500 | |
| Personnel Plan | |||||||||||||
| Month 1 | Month 2 | Month 3 | Month 4 | Month 5 | Month 6 | Month 7 | Month 8 | Month 9 | Month 10 | Month 11 | Month 12 | ||
| Member Manager | $6,000 | $6,000 | $6,000 | $6,000 | $6,000 | $6,000 | $6,000 | $6,000 | $6,000 | $6,000 | $6,000 | $6,000 | |
| Member Business Development | $4,167 | $4,167 | $4,167 | $4,167 | $4,167 | $4,167 | $4,167 | $4,167 | $4,167 | $4,167 | $4,167 | $4,167 | |
| Driver/Guides | $36,000 | $36,000 | $36,000 | $36,000 | $36,000 | $36,000 | $36,000 | $36,000 | $36,000 | $36,000 | $36,000 | $36,000 | |
| Marketing/Sales Associates | $8,333 | $8,333 | $8,333 | $8,333 | $8,333 | $8,333 | $8,333 | $8,333 | $8,333 | $8,333 | $8,333 | $8,333 | |
| Courtesy Captains | $8,000 | $8,000 | $8,000 | $8,000 | $8,000 | $8,000 | $8,000 | $8,000 | $8,000 | $8,000 | $8,000 | $8,000 | |
| Total People | 22 | 22 | 22 | 22 | 22 | 22 | 22 | 22 | 22 | 22 | 22 | 22 | |
| Total Payroll | $62,500 | $62,500 | $62,500 | $62,500 | $62,500 | $62,500 | $62,500 | $62,500 | $62,500 | $62,500 | $62,500 | $62,500 | |
| General Assumptions | |||||||||||||
| Month 1 | Month 2 | Month 3 | Month 4 | Month 5 | Month 6 | Month 7 | Month 8 | Month 9 | Month 10 | Month 11 | Month 12 | ||
| Plan Month | 1 | 2 | 3 | 4 | 5 | 6 | 7 | 8 | 9 | 10 | 11 | 12 | |
| Current Interest Rate | 5.00% | 5.00% | 5.00% | 5.00% | 5.00% | 5.00% | 5.00% | 5.00% | 5.00% | 5.00% | 5.00% | 5.00% | |
| Long-term Interest Rate | 10.00% | 10.00% | 10.00% | 10.00% | 10.00% | 10.00% | 10.00% | 10.00% | 10.00% | 10.00% | 10.00% | 10.00% | |
| Tax Rate | 24.00% | 24.00% | 24.00% | 24.00% | 24.00% | 24.00% | 24.00% | 24.00% | 24.00% | 24.00% | 24.00% | 24.00% | |
| Other | 0 | 0 | 0 | 0 | 0 | 0 | 0 | 0 | 0 | 0 | 0 | 0 | |
| Pro Forma Profit and Loss | |||||||||||||
| Month 1 | Month 2 | Month 3 | Month 4 | Month 5 | Month 6 | Month 7 | Month 8 | Month 9 | Month 10 | Month 11 | Month 12 | ||
| Sales | $1,533,967 | $1,550,933 | $2,308,933 | $1,552,933 | $1,048,933 | $776,967 | $776,467 | $776,467 | $777,967 | $1,049,433 | $1,050,933 | $1,561,933 | |
| Direct Cost of Sales | $11,000 | $12,500 | $12,500 | $12,500 | $12,150 | $11,800 | $11,606 | $11,574 | $11,000 | $11,500 | $12,000 | $12,500 | |
| Other Cost of Sales | $0 | $0 | $0 | $0 | $0 | $0 | $0 | $0 | $0 | $0 | $0 | $0 | |
| Total Cost of Sales | $11,000 | $12,500 | $12,500 | $12,500 | $12,150 | $11,800 | $11,606 | $11,574 | $11,000 | $11,500 | $12,000 | $12,500 | |
| Gross Margin | $1,522,967 | $1,538,433 | $2,296,433 | $1,540,433 | $1,036,783 | $765,167 | $764,861 | $764,893 | $766,967 | $1,037,933 | $1,038,933 | $1,549,433 | |
| Gross Margin % | 99.28% | 99.19% | 99.46% | 99.20% | 98.84% | 98.48% | 98.51% | 98.51% | 98.59% | 98.90% | 98.86% | 99.20% | |
| Expenses | |||||||||||||
| Payroll | $62,500 | $62,500 | $62,500 | $62,500 | $62,500 | $62,500 | $62,500 | $62,500 | $62,500 | $62,500 | $62,500 | $62,500 | |
| Sales and Marketing and Other Expenses | $12,000 | $12,000 | $12,000 | $12,000 | $12,000 | $12,000 | $12,000 | $12,000 | $12,000 | $12,000 | $12,000 | $12,000 | |
| Depreciation | $5,091 | $5,091 | $5,091 | $5,091 | $5,091 | $5,091 | $5,091 | $5,091 | $5,091 | $5,091 | $5,091 | $5,091 | |
| Rent | $7,000 | $7,000 | $7,000 | $7,000 | $7,000 | $7,000 | $7,000 | $7,000 | $7,000 | $7,000 | $7,000 | $7,000 | |
| Utilities | $800 | $800 | $800 | $800 | $800 | $800 | $800 | $800 | $800 | $800 | $800 | $800 | |
| Insurance | $1,500 | $1,500 | $1,500 | $1,500 | $1,500 | $1,500 | $1,500 | $1,500 | $1,500 | $1,500 | $1,500 | $1,500 | |
| Payroll Taxes | 15% | $0 | $0 | $0 | $0 | $0 | $0 | $0 | $0 | $0 | $0 | $0 | $0 |
| Local Taxes | $2,000 | $2,000 | $2,000 | $2,000 | $2,000 | $2,000 | $2,000 | $2,000 | $2,000 | $2,000 | $2,000 | $2,000 | |
| Bus Maintenance | $10,000 | $10,000 | $10,000 | $10,000 | $10,000 | $10,000 | $10,000 | $10,000 | $10,000 | $10,000 | $10,000 | $10,000 | |
| Bookkeeping/Payroll | $1,500 | $1,500 | $1,500 | $1,500 | $1,500 | $1,500 | $1,500 | $1,500 | $1,500 | $1,500 | $1,500 | $1,500 | |
| Professional Asst. | $500 | $500 | $500 | $500 | $500 | $500 | $500 | $500 | $500 | $500 | $500 | $500 | |
| Telephones and Nextels | $600 | $600 | $600 | $600 | $600 | $600 | $600 | $600 | $600 | $600 | $600 | $600 | |
| Office Supplies | $250 | $250 | $250 | $250 | $250 | $250 | $250 | $250 | $250 | $250 | $250 | $250 | |
| Brochures | $350 | $350 | $350 | $350 | $350 | $350 | $350 | $350 | $350 | $350 | $350 | $350 | |
| Licenses/Permits | $150 | $150 | $150 | $150 | $150 | $150 | $150 | $150 | $150 | $150 | $150 | $150 | |
| Website Maintenance | $1,500 | $1,500 | $1,500 | $1,500 | $1,500 | $1,500 | $1,500 | $1,500 | $1,500 | $1,500 | $1,500 | $1,500 | |
| Miscellaneous | 15% | $4,000 | $4,000 | $4,000 | $4,000 | $4,000 | $4,000 | $4,000 | $4,000 | $4,000 | $4,000 | $4,000 | $4,000 |
| Uniforms | $1,000 | $1,000 | $1,000 | $1,000 | $1,000 | $1,000 | $1,000 | $1,000 | $1,000 | $1,000 | $1,000 | $1,000 | |
| Total Operating Expenses | $110,741 | $110,741 | $110,741 | $110,741 | $110,741 | $110,741 | $110,741 | $110,741 | $110,741 | $110,741 | $110,741 | $110,741 | |
| Profit Before Interest and Taxes | $1,405,559 | $1,342,574 | $2,059,388 | $1,344,660 | $868,539 | $611,815 | $611,626 | $611,757 | $613,821 | $870,132 | $871,181 | $1,353,982 | |
| EBITDA | $1,410,650 | $1,347,665 | $2,064,479 | $1,349,751 | $873,630 | $616,906 | $616,717 | $616,848 | $618,911 | $875,223 | $876,272 | $1,359,073 | |
| Interest Expense | $6,581 | $6,494 | $6,406 | $6,318 | $6,229 | $6,139 | $6,049 | $5,958 | $5,866 | $5,773 | $5,679 | $5,585 | |
| Taxes Incurred | $335,755 | $320,659 | $492,716 | $321,202 | $206,954 | $145,362 | $145,339 | $145,392 | $145,909 | $207,446 | $207,720 | $323,615 | |
| Other Income | |||||||||||||
| Interest Income | $0 | $0 | $0 | $0 | $0 | $0 | $0 | $0 | $0 | $0 | $0 | $0 | |
| Other Income Account Name | $0 | $0 | $0 | $0 | $0 | $0 | $0 | $0 | $0 | $0 | $0 | $0 | |
| Total Other Income | $0 | $0 | $0 | $0 | $0 | $0 | $0 | $0 | $0 | $0 | $0 | $0 | |
| Other Expense | |||||||||||||
| Interest Expense | $6,667 | $6,581 | $6,494 | $6,406 | $6,318 | $6,229 | $6,139 | $6,049 | $5,958 | $5,866 | $5,773 | $5,679 | |
| Profit tax | $0 | $82,181 | $78,538 | $119,810 | $78,626 | $51,185 | $36,382 | $36,355 | $36,346 | $36,448 | $51,195 | $51,238 | $79,031 |
| Total Other Expense | $6,667 | $85,118 | $126,304 | $85,032 | $57,503 | $42,611 | $42,494 | $42,395 | $42,406 | $57,060 | $57,011 | $84,710 | |
| Net Other Income | ($6,667) | ($85,118) | ($126,304) | ($85,032) | ($57,503) | ($42,611) | ($42,494) | ($42,395) | ($42,406) | ($57,060) | ($57,011) | ($84,710) | |
| Net Profit | $1,063,224 | $1,015,421 | $1,560,266 | $1,017,140 | $655,355 | $460,314 | $460,239 | $460,408 | $462,046 | $656,913 | $657,781 | $1,024,782 | |
| Net Profit/Sales | 69.31% | 65.47% | 67.58% | 65.50% | 62.48% | 59.24% | 59.27% | 59.30% | 59.39% | 62.60% | 62.59% | 65.61% | |
| Pro Forma Cash Flow | |||||||||||||
| Month 1 | Month 2 | Month 3 | Month 4 | Month 5 | Month 6 | Month 7 | Month 8 | Month 9 | Month 10 | Month 11 | Month 12 | ||
| Cash Received | |||||||||||||
| Cash from Operations | |||||||||||||
| Cash Sales | $1,533,967 | $1,550,933 | $2,308,933 | $1,552,933 | $1,048,933 | $776,967 | $776,467 | $776,467 | $777,967 | $1,049,433 | $1,050,933 | $1,561,933 | |
| Subtotal Cash from Operations | $1,533,967 | $1,550,933 | $2,308,933 | $1,552,933 | $1,048,933 | $776,967 | $776,467 | $776,467 | $777,967 | $1,049,433 | $1,050,933 | $1,561,933 | |
| Additional Cash Received | |||||||||||||
| Non Operating (Other) Income | $0 | $0 | $0 | $0 | $0 | $0 | $0 | $0 | $0 | $0 | $0 | $0 | |
| Sales Tax, VAT, HST/GST Received | 0.00% | $0 | $0 | $0 | $0 | $0 | $0 | $0 | $0 | $0 | $0 | $0 | $0 |
| New Current Borrowing | $0 | $0 | $0 | $0 | $0 | $0 | $0 | $0 | $0 | $0 | $0 | $0 | |
| New Other Liabilities (interest-free) | $0 | $0 | $0 | $0 | $0 | $0 | $0 | $0 | $0 | $0 | $0 | $0 | |
| New Long-term Liabilities | $0 | $0 | $0 | $0 | $0 | $0 | $0 | $0 | $0 | $0 | $0 | $0 | |
| Sales of Other Current Assets | $0 | $0 | $0 | $0 | $0 | $0 | $0 | $0 | $0 | $0 | $0 | $0 | |
| Sales of Long-term Assets | $0 | $0 | $0 | $0 | $0 | $0 | $0 | $0 | $0 | $0 | $0 | $0 | |
| New Investment Received | $0 | $0 | $0 | $0 | $0 | $0 | $0 | $0 | $0 | $0 | $0 | $0 | |
| Subtotal Cash Received | $1,533,967 | $1,550,933 | $2,308,933 | $1,552,933 | $1,048,933 | $776,967 | $776,467 | $776,467 | $777,967 | $1,049,433 | $1,050,933 | $1,561,933 | |
| Expenditures | Month 1 | Month 2 | Month 3 | Month 4 | Month 5 | Month 6 | Month 7 | Month 8 | Month 9 | Month 10 | Month 11 | Month 12 | |
| Expenditures from Operations | |||||||||||||
| Cash Spending | $62,500 | $62,500 | $62,500 | $62,500 | $62,500 | $62,500 | $62,500 | $62,500 | $62,500 | $62,500 | $62,500 | $62,500 | |
| Bill Payments | $13,216 | $396,029 | $388,535 | $549,052 | $379,347 | $266,416 | $206,441 | $206,141 | $206,069 | $207,990 | $267,892 | $272,426 | |
| Subtotal Spent on Operations | $75,716 | $458,529 | $451,035 | $611,552 | $441,847 | $328,916 | $268,941 | $268,641 | $268,569 | $270,490 | $330,392 | $334,926 | |
| Additional Cash Spent | |||||||||||||
| Non Operating (Other) Expense | $6,667 | $85,118 | $126,304 | $85,032 | $57,503 | $42,611 | $42,494 | $42,395 | $42,406 | $57,060 | $57,011 | $84,710 | |
| Sales Tax, VAT, HST/GST Paid Out | $0 | $0 | $0 | $0 | $0 | $0 | $0 | $0 | $0 | $0 | $0 | $0 | |
| Principal Repayment of Current Borrowing | $0 | $0 | $0 | $0 | $0 | $0 | $0 | $0 | $0 | $0 | $0 | $0 | |
| Other Liabilities Principal Repayment | $0 | $0 | $0 | $0 | $0 | $0 | $0 | $0 | $0 | $0 | $0 | $0 | |
| Long-term Liabilities Principal Repayment | $10,331 | $10,417 | $10,504 | $10,591 | $10,680 | $10,769 | $10,858 | $10,949 | $11,040 | $11,132 | $11,225 | $11,318 | |
| Purchase Other Current Assets | $0 | $0 | $0 | $0 | $0 | $0 | $0 | $0 | $0 | $0 | $0 | $0 | |
| Purchase Long-term Assets | $0 | $0 | $0 | $0 | $0 | $0 | $0 | $0 | $0 | $0 | $0 | $0 | |
| Dividends | $0 | $0 | $0 | $0 | $0 | $0 | $0 | $0 | $0 | $0 | $0 | $0 | |
| Subtotal Cash Spent | $92,714 | $554,065 | $587,843 | $707,175 | $510,030 | $382,295 | $322,294 | $321,985 | $322,015 | $338,682 | $398,628 | $430,955 | |
| Net Cash Flow | $1,441,253 | $996,868 | $1,721,090 | $845,758 | $538,903 | $394,672 | $454,173 | $454,482 | $455,952 | $710,751 | $652,305 | $1,130,978 | |
| Cash Balance | $1,555,253 | $2,552,122 | $4,273,211 | $5,118,969 | $5,657,872 | $6,052,544 | $6,506,717 | $6,961,199 | $7,417,152 | $8,127,903 | $8,780,208 | $9,911,187 | |
| Pro Forma Balance Sheet | |||||||||||||
| Month 1 | Month 2 | Month 3 | Month 4 | Month 5 | Month 6 | Month 7 | Month 8 | Month 9 | Month 10 | Month 11 | Month 12 | ||
| Assets | Starting Balances | ||||||||||||
| Current Assets | |||||||||||||
| Cash | $114,000 | $1,555,253 | $2,552,122 | $4,273,211 | $5,118,969 | $5,657,872 | $6,052,544 | $6,506,717 | $6,961,199 | $7,417,152 | $8,127,903 | $8,780,208 | $9,911,187 |
| Other Current Assets | $0 | $0 | $0 | $0 | $0 | $0 | $0 | $0 | $0 | $0 | $0 | $0 | $0 |
| Total Current Assets | $114,000 | $1,555,253 | $2,552,122 | $4,273,211 | $5,118,969 | $5,657,872 | $6,052,544 | $6,506,717 | $6,961,199 | $7,417,152 | $8,127,903 | $8,780,208 | $9,911,187 |
| Long-term Assets | |||||||||||||
| Long-term Assets | $305,450 | $305,450 | $305,450 | $305,450 | $305,450 | $305,450 | $305,450 | $305,450 | $305,450 | $305,450 | $305,450 | $305,450 | $305,450 |
| Accumulated Depreciation | $0 | $5,091 | $10,182 | $15,273 | $20,363 | $25,454 | $30,545 | $35,636 | $40,727 | $45,818 | $50,908 | $55,999 | $61,090 |
| Total Long-term Assets | $305,450 | $300,359 | $295,268 | $290,178 | $285,087 | $279,996 | $274,905 | $269,814 | $264,723 | $259,633 | $254,542 | $249,451 | $244,360 |
| Total Assets | $419,450 | $1,855,612 | $2,847,390 | $4,563,389 | $5,404,056 | $5,937,868 | $6,327,449 | $6,776,531 | $7,225,923 | $7,676,784 | $8,382,445 | $9,029,659 | $10,155,547 |
| Liabilities and Capital | Month 1 | Month 2 | Month 3 | Month 4 | Month 5 | Month 6 | Month 7 | Month 8 | Month 9 | Month 10 | Month 11 | Month 12 | |
| Current Liabilities | |||||||||||||
| Accounts Payable | $0 | $383,269 | $370,043 | $536,279 | $370,398 | $259,534 | $199,570 | $199,272 | $199,205 | $199,061 | $258,940 | $259,598 | $372,022 |
| Current Borrowing | $0 | $0 | $0 | $0 | $0 | $0 | $0 | $0 | $0 | $0 | $0 | $0 | $0 |
| Other Current Liabilities | $0 | $0 | $0 | $0 | $0 | $0 | $0 | $0 | $0 | $0 | $0 | $0 | $0 |
| Subtotal Current Liabilities | $0 | $383,269 | $370,043 | $536,279 | $370,398 | $259,534 | $199,570 | $199,272 | $199,205 | $199,061 | $258,940 | $259,598 | $372,022 |
| Long-term Liabilities | $800,000 | $789,669 | $779,252 | $768,748 | $758,157 | $747,477 | $736,708 | $725,850 | $714,901 | $703,861 | $692,729 | $681,504 | $670,186 |
| Total Liabilities | $800,000 | $1,172,938 | $1,149,295 | $1,305,028 | $1,128,554 | $1,007,011 | $936,278 | $925,122 | $914,106 | $902,922 | $951,669 | $941,102 | $1,042,207 |
| Paid-in Capital | $40,000 | $40,000 | $40,000 | $40,000 | $40,000 | $40,000 | $40,000 | $40,000 | $40,000 | $40,000 | $40,000 | $40,000 | $40,000 |
| Retained Earnings | ($420,550) | ($420,550) | ($420,550) | ($420,550) | ($420,550) | ($420,550) | ($420,550) | ($420,550) | ($420,550) | ($420,550) | ($420,550) | ($420,550) | ($420,550) |
| Earnings | $0 | $1,063,224 | $2,078,645 | $3,638,911 | $4,656,051 | $5,311,406 | $5,771,720 | $6,231,959 | $6,692,367 | $7,154,412 | $7,811,325 | $8,469,107 | $9,493,889 |
| Total Capital | ($380,550) | $682,674 | $1,698,095 | $3,258,361 | $4,275,501 | $4,930,856 | $5,391,170 | $5,851,409 | $6,311,817 | $6,773,862 | $7,430,775 | $8,088,557 | $9,113,339 |
| Total Liabilities and Capital | $419,450 | $1,855,612 | $2,847,390 | $4,563,389 | $5,404,055 | $5,937,867 | $6,327,448 | $6,776,531 | $7,225,922 | $7,676,784 | $8,382,444 | $9,029,659 | $10,155,546 |
| Net Worth | ($380,550) | $682,674 | $1,698,095 | $3,258,361 | $4,275,501 | $4,930,857 | $5,391,170 | $5,851,409 | $6,311,817 | $6,773,863 | $7,430,776 | $8,088,557 | $9,113,339 |


