
NaviTag Technologies, LLC
Executive Summary
NaviTag Technologies, LLC [NaviTag Technologies], headquartered in Massachusetts, is a start-up company founded for the purpose of creating the first location and security monitoring solution for maritime container cargo shipments.
Our solution focuses on meeting the needs of two types of customers – companies engaged in shipping cargo worldwide and the government agencies that monitor such movements.
For the first time ever, these users will be able to securely capture and act on shipment data without relying on equipment owners and/or shipping partner integrations. This is accomplished by utilizing a removable tracking device that is affixed to the exterior of a container. Throughout the containers journey, the device will report its status and positional information to an Internet accessible central database before ultimately being removed by the recipient and returned to the owner.
Such a monitoring service is not yet available anywhere in the transportation industry, and we intend to dominate this segment.
[Confidential and proprietary information has, in some text and tables, been omitted or disguised in this sample plan.]
The Concept
The mission of NaviTag Technologies is to provide shippers or government agencies a portable, reusable device that will track cargo shipments with greater accuracy than the event-based historical systems available today.
This electronic tag will track the cargo, not the container, providing the owner with the ability to choose what cargoes are monitored. It can be introduced anywhere within the supply chain to provide the security information that government agencies are seeking to protect U.S. ports from importation of dangerous cargoes.
NaviTag Technologies core revenues will be generated from the sale of these electronic tags – a NaviTag™ – as well as access charges to retrieve the information. The number of NaviTags purchased by an individual group is dependent upon the volume of shipments requiring monitoring.
Access charges are assessed to the NaviTag owner and are established on the basis on the volume of units in operation. This fee allows access to the NaviTag network and the central database containing the positional and security alert information transmitted from the NaviTag.
The Market
We have targeted the container shipping market for several reasons. As a $120 billion industry, it offers significant growth potential. The annual unit growth of the number of containers shipped averaged 8% in the 1990’s and is forecast to increase by almost 100% by the year 2010.
In the next decade, container terminals around the world are set to experience rapid growth, with global container handling throughput expected to reach in excess of 300 million TEUs1 in 2005 and over 400 million TEUs in 2010.
Despite the growth in the container shipping industry, it still remains a very fragmented market. There are over 500 companies operating in excess of 2,500 vessels today and within the U.S. alone there are over 50,000 importing and exporting companies on record. On a worldwide basis, the number of companies engaged in international container shipments is in the hundreds of thousands.
[1] TEU – (Twenty foot equivalent unit) – an industry measurement of volume for container shipments. Containers typically are offered in twenty and forty foot dimensions. One twenty-foot container is equal to 1 TEU and one forty foot container is equal to 2 TEUs.
Management
Jim Galley
Mr. Galley is a seasoned technology professional with over 15 years of experience in management, operations, and application and product development in technology environments. As CTO and founding member of GoCargo.com, Mr. Galley brought the company from a business plan concept to processing transactions online in six weeks. Mr. Galley also has Fortune 50 financial experience as a technical officer, and has run a data center operation.
Bob Magown
Mr. Magown has spent twenty years serving in senior management positions with transportation-related companies. Mr. Magown was an original member of the Internet start-up GoCargo.com and held the position of vice president of sales. For 17 years prior to joining GoCargo.com he had built a successful career with the ocean carrier CAST (CP Ships), where he fulfilled a variety of senior sales and marketing positions including regional director east coast. Mr. Magown holds a BS degree in business management from Bryant College.
Key Financials
Market research and business model development have been completed. NaviTag Technologies is seeking to raise substantial funds by way of private equity placement in order to execute its business plan, focusing on creating the electronic tag, central database, and establishing the customer base.
NaviTag Technologies offers exceptional growth opportunities. The demand within this rapidly growing market for a unique solution in the form of a portable, cost-effective cargo tracking tool is currently untapped. Our approach of empowering the shipper with control of the positional information and the development of a selective cargo alert tool for government agencies is the solution to a clearly defined need. We have the opportunity to seize this market and we intend to move quickly to establish a market leader position. NaviTag Technologies presents an attractive opportunity that is based on solid market research and industry experience. It offers current industry players a valuable service unavailable elsewhere, resulting in immediate benefits.

1.1 Mission
The goal of NaviTag Technologies is to provide accurate, timely information regarding the location and status of container cargo within the supply chain. Our purpose is to empower the NaviTag owner with control of the in-transit cargo visibility and security information, eliminating their reliance on third party equipment tracking systems.
Company Summary
NaviTag Technologies is incorporated as a limited liability company in the state of Delaware and is headquartered in Boston, Massachusetts. The Company shareholders are founders, president – CTO Jim Galley and president worldwide operations Robert Magown.
2.1 Start-up Summary
Our start-up costs are mostly stationery, legal costs, and expenses associated with opening our offices. The start-up costs are to be financed by direct owner investment. The assumptions are shown in the following tables and chart.

| Start-up Funding | |
| Start-up Expenses to Fund | $33,000 |
| Start-up Assets to Fund | $2,977,000 |
| Total Funding Required | $3,010,000 |
| Assets | |
| Non-cash Assets from Start-up | $0 |
| Cash Requirements from Start-up | $2,977,000 |
| Additional Cash Raised | $0 |
| Cash Balance on Starting Date | $2,977,000 |
| Total Assets | $2,977,000 |
| Liabilities and Capital | |
| Liabilities | |
| Current Borrowing | $0 |
| Long-term Liabilities | $0 |
| Accounts Payable (Outstanding Bills) | $0 |
| Other Current Liabilities (interest-free) | $0 |
| Total Liabilities | $0 |
| Capital | |
| Planned Investment | |
| Bob Magown | $5,000 |
| Jim Galley | $5,000 |
| Venture | $3,000,000 |
| Additional Investment Requirement | $0 |
| Total Planned Investment | $3,010,000 |
| Loss at Start-up (Start-up Expenses) | ($33,000) |
| Total Capital | $2,977,000 |
| Total Capital and Liabilities | $2,977,000 |
| Total Funding | $3,010,000 |
| Start-up | |
| Requirements | |
| Start-up Expenses | |
| Legal | $5,000 |
| Stationery etc. | $1,000 |
| Brochures | $15,000 |
| Consultants | $2,000 |
| Insurance | $5,000 |
| Accounting | $5,000 |
| Research and Development | $0 |
| Expensed Equipment | $0 |
| Other | $0 |
| Total Start-up Expenses | $33,000 |
| Start-up Assets | |
| Cash Required | $2,977,000 |
| Other Current Assets | $0 |
| Long-term Assets | $0 |
| Total Assets | $2,977,000 |
| Total Requirements | $3,010,000 |
2.2 Company Locations and Facilities
NaviTag Technologies currently operates from two facilities. The corporate headquarters is located at 123 Main St., Boston, Massachusetts, and is the sales and finance center for the company. Development and production are managed from our office in New York.
Products and Services
NaviTag Technologies provides a service that allows government or commercial entities to securely track their cargo movements worldwide. This is accomplished by utilizing a patent pending electronic tag – called NaviTag – to capture location and event information in conjunction with an Internet accessible central database.
The NaviTag can easily be attached to any container, monitor the transport route and destination, and be removed at destination to be reused on another shipment. If the container is entered, the NaviTag will alert the central database of the event and provide data regarding the intrusion. The central database acts as a clearinghouse that allows government and commercial organizations to utilize this information to streamline internal processes.

The NaviTag will provide shippers with accurate, timely information regarding the location of their shipment via modem transmissions to the central database. The shipper can access the location information at anytime through a secure Internet connection and be empowered with the information necessary to make decisions, and take required actions to support their supply chain.
NaviTag Technologies will support government agencies desire to improve security within the U.S. ports and borders. A NaviTag attached to a container on foreign soil would provide full route and location visibility to destination as well as notification of any breach in security. The authorities could then investigate the security breach and take the necessary action. For the Department of Defense, NaviTag can provide end-to-end visibility and security for all their sensitive cargo, ensuring the safety of the military personnel at the destination.
NaviTag is light, compact, and reusable making it a cost-effective method of tracking cargo and ensuring security. It is a rechargeable, self-powered device that can be easily packaged and returned to the owner providing unlimited use.
3.1 Product and Service Description
NaviTag Technologies provides a service that allows government or commercial entities to securely track their cargo movements worldwide. Our cargo tracking solution comprises of three elements, the datacentre, the activation unit and the NaviTag itself.
The NaviTag unit utilizes a low power modem that allows it to communicate from anywhere in the world. This modem, in conjunction with positional and door sensors, provides the capability to transmit positional and door open conditions on a regulated basis throughout the cargo’s journey to its destination.
The NaviTag provides this functionality in a self-contained unit at a size and price point not previously available. The NaviTag unit is about the size of a paperback novel and light in weight to facilitate return shipment.
It attaches to the exterior of the container door by means of fixed mounting arms and an adjustable securing bar that is locked in place for the duration of the voyage. It is detached at destination by entering the unlock code into the electronic keypad and following instructions in the status display window.
Once the NaviTag has been activated, it records its location and transmits positional information at an average of every four hours. The frequency of these transmissions increases as the cargo approaches its destination, and any door open conditions or tampering conditions get transmitted immediately.
These transmissions are relayed via secure means to our Datacentre where they are validated and inserted into a common data structure. Upon validation, the Datacentre will perform any global and voyage specific messaging as defined by the NaviTag owner.
3.2 Fulfillment
While the NaviTag is an important part of the cargo monitoring solution, the information and actions generated from NaviTag data are equally important.
Our solution includes a normalized database from which NaviTag owners and authorized third parties can access and integrate NaviTag data into their own business processes. Access rights to data will be closely held, and authorization routines will be implemented at the site, database and device level. Each NaviTag is centrally registered to its owner, and usage is limited to authorized parties.
Market Analysis Summary
Our target markets are those shippers seeking to improve control of the cargo movement within their supply chain and government agencies striving to enhance the security of cargo in transit.
The information today is supplied independently by the multiple service providers involved and is not coordinated through a single source. To achieve end-to-end visibility, a shipper must undertake a massive data integration project with each service provider, or outsource the entire effort to a supply chain visibility company. Even then the information is historical and reliant on third party data entry that is subject to human error.
Of the total projected market of over 300 million TEUs in 2005, our efforts will be focused on those shippers with high value, time sensitive, or hazardous cargo.
We estimate that approximately 30% of the total world market would fall within this criterion, equating to over 90 million TEUs. Our security focus will be directed to those government agencies seeking to improve security of the U.S. ports involved in processing the 600,000 containers entering weekly.
With only 2% of the imports being inspected today, the concern of dangerous cargoes compromising the port operations has created opportunities for a cargo tracking/security alert device such as ours.
4.1 Service Business Analysis
We have identified three distinct opportunities within this market as having a proven need and an expressed desire to improve the visibility of cargo shipments.
- Shippers – this group has identified a need for a cargo-tracking tool that will allow their shipments to be monitored from origin-to-destination providing accurate and timely location information.
- Government Agencies – since 9/11/01, heightened awareness throughout the U.S. has led to security concerns regarding cargo entering U.S. ports. Government agencies/offices such as D.O.T., Transcom, Customs, Department of Defense (DOD), and Homelands Security have expressed interest in technology services capable of being introduced anywhere within the supply chain that provide protection against a terrorist threat from dangerous container cargoes.
- Carriers – the equipment owners are seeking an automated process of inspecting temperature-controlled containers, providing them with positional data and immediate notification of refrigeration failures allowing them to take the necessary action to avoid cargo spoilage.
4.1.1 Industry Participants
Shippers
With container volume projections exceeding 300 million TEUs by 2005 and over 400 million TEUs by 2010, the market potential for this segment is significant.
Any shipper with high value, time sensitive, or hazardous cargo is a targeted customer. The container cargo that falls within this criterion would be approximately 30% of the total market equating to over 90 million TEUs per annum in 2005.
These shippers are demanding a visibility tool that will provide them with timely, reliable data regarding the location of their shipments within their supply chain. That information will allow them to manage inventory, avoid additional transportation cost (demurrage or storage charges), anticipate customer stock shortages, and reroute cargo when necessary. They require confidence in the quality of the data and the timeliness of the report to ensure correct actions are being taken.
Today’s systems do not instill this confidence because the shipper is reliant on third party, historical data. Providing historical information about where the cargo has been, based on events designated by the service provider, does not meet their requirements. The shipper is not empowered with control of the information, which limits the value of the content.
Government Agencies
The world has been forever changed since the attack on the World Trade Center and Pentagon on 9/11/01, and the sense of security that Americans enjoyed was shattered. Security at airports, commercial facilities and government buildings has been enhanced dramatically, utilizing a variety of equipment designed to identify and restrict dangerous contraband.
U.S. ports have been specifically identified as vulnerable and potential terrorist targets and are in need of greater security measures.
U.S. government agencies and offices have allocated funds for improvement in port security, container-tracking technology, and electronic seals that detect intrusion and tampering attempts. DOD is pursuing technology that will provide accurate and timely location information as well as intrusion notification for the containers carrying munitions or supplies to military installations.
U.S. Customs is deploying agents in foreign ports to inspect containers prior to their being loaded onto vessels destined for U.S. ports and is seeking electronic seals that will confirm security integrity has not been breached after inspection.
The Maritime Administration (MARAD) is allocating funds for technology that will assist in their effort to avoid the importation of weapons of mass destruction in containers through a U.S. port.
All of these agencies and offices have been targeted as potential markets for an automated cargo tracking and intrusion alert electronic seal. Preliminary conversations with these organizations, as well as MassPort Security and the U.S. Coast Guard, have been encouraging and have resulted in request for prototypes to perform field testing.
Ocean Carriers
Ocean carriers are typically the owner/lessee of the containers and chassis that are loaded by shippers for their international shipments.
Many carriers include temperature-controlled equipment in their container fleet for perishable goods such as meats, produce, chemicals and other products that require stable temperature environments. The equipment owner is responsible to ensure the unit is maintaining the required temperature and will be held responsible by the shipper for any failures that lead to cargo damage.
The carriers perform inspections of the equipment at predetermined intervals throughout the transport route; physically monitoring the operation of the refrigeration unit to confirm the required temperature has been maintained.
The physical inspections are labor intensive, expensive, subject to human error, and may experience extensive time lapses between intervals. Should there be an equipment failure between inspections, the temperature may fluctuate enough to spoil the cargo and generate a claim.
The equipment owners are seeking an effective method to automate this inspection process and provide immediate notification of equipment failure, allowing them to take the appropriate action to avoid cargo spoilage.
Our research has found the carrier market already has several companies offering solutions to meet this need, and we have decided not to focus our efforts in this area at this time.
Comprehensive research of competition within this market identifies the existing segmentation of the services available today. In each case, NaviTag Technologies offers a unique solution to address the needs that are not fulfilled by our competitors.
We differentiate ourselves by providing the cargo owners and government agencies with a tool that monitors cargo and security without reliance on third party equipment owner’s historical and inaccurate data.
4.1.2 Competition and Buying Patterns
The need to track and secure cargo is not new, and vast arrays of solutions exist from companies large and small to deal with the unique needs of each party. Merging and acting on partner messaging is typically found in supply chain management solutions while event notification and positional information of a physical device is categorized as asset management. Cargo security devices span the gamut from breakable plastic seals to hardened iron bars. The following is a breakdown of each category’s offerings:
Supply chain management – Supply chain solutions strive to manage every step of a product’s life cycle, from raw material procurement to customer delivery. After each step is automated, data exchange procedures with each business partner (supplier, carrier, trucking company, etc.) integrates the disparate information flows into a single efficient process. Examples of such solutions are X, Y and Z.
If a company already has a supply chain solution in place, an alternative is to outsource all the data exchange processes to a supply chain messaging aggregator. Only one integration is required – between the customer and the aggregator – and the burden of conversion and data quality is outsourced. An example of such a service is W company.
In both situations, integration with shipping partners aids in increasing the flow of information to the company, but partners can only provide data that is – for the most part – historical. “Where the container is” isn’t captured, “when a container passed a checkpoint” is.
Asset management – Apart from asset recovery solutions such as LoJack, asset management solutions permanently attach a wireless transceiver to a device to gain visibility and control over its usage. The transceivers range and type of data it provides is highly dependant on the application.
Container ports need to maximize the flow of containers though their facility by precisely tracking their location. Systems such as AAA & BBB address this need by creating a localized sensor network and attaching transceiver beacons on their yard equipment.
Container owners – typically the carriers – need to maximize the utilization of the thousands of containers that are scattered throughout the world. Refrigerated containers are particularly needy; an individual outage translates to spoiled cargo and lost revenue. Solutions like those from CCC, DDD, EEE & FFF utilize nationwide coverage networks with status reporting and – with CCC – remote control/restart capabilities.
In all cases, the capital investment – and benefits gained – is borne by the equipment owner. While this might not be that difficult for a Port to justify a system to track 35 pieces of yard equipment, carriers need to manage anywhere from thousands, to hundreds of thousands of containers.
Security – While the introduction of containers into the shipping industry provided far greater protection than break-bulk shipping, total losses due to theft are an estimated $54 billion annually. There are two types of security devices available in the market today that provide limited protection, a physical lock and an electronic seal.
The physical lock is straightforward – close both doors and place locks on each door handle. Variations to this model include bars, cables, and housings. Unfortunately, these approaches have the following problems.
- Key distribution to recipient/loss of the key to open the lock.
- Customs requirements to inspect the container’s contents.
- Forced access to the container though a means other than the door handle (removal of the door, cutting an access pin, etc.).
The second is an electronic seal that records a variety of activities that can be interrogated by a data collection device – typically a hand-held device. It can document actions – like a door being opened – but lacks the ability to transmit the information independently. More elaborate data capture solutions exist that can interrogate and save data on the seal – but an extensive network of these proximity activators needs to be placed throughout the entire intermodal journey.
While each of these categories offers a valuable and needed service to their customers, they lack the integration and coordination capabilities that our target market requires. Specifically:
- Supply chain solutions rely on aggregation of historical data which can be anywhere from hours to days old. The manual process from which the data is captured and the methods used to share data among partners is inherently insecure. The possibility exists that incorrect or forged data can enter the system.
- Asset management solutions track the equipment – not the cargo – and represent a significant capital cost if deployed en mass. Given the competitive nature of the shipping industry, and the costs associated with outfitting every container with a tracking device, the probability of carriers installing these devices any time soon is slim. It is also unlikely that shippers would be willing to forgo competitive pricing to select only carriers who make the investment, and government agencies (Customs, for example) cannot be limited in this matter.
Security products may deter and/or document entry into the container, but do not provide the opportunity to react to them quickly. Today’s situation demands a more proactive stance regarding security breaches, not just from a security threat standpoint, but from an inventory management perspective as well. The recipient cannot utilize compromised cargo, and alternatives need to be set in motion as soon as possible to mitigate damage.
Differentiation
NaviTag Technologies’ approach to the market is fundamentally different from other electronic tracking/sealing companies in a variety of ways.
Tracking/Tracing Visibility – The NaviTag monitors the cargo, not the container. This empowers the government agency or shipper with control of the data and eliminates reliance on third party sources. In this model the NaviTag owner receives timely location information, accurate data, and the ability to choose the cargoes they want to monitor regardless of the service providers involved. This allows them to change partners whenever they wish and still receive data in a consistent format and assured quality.
Security – The NaviTag provides immediate information regarding security breaches that allows the government agency or shipper to investigate and take the necessary corrective action. This system allows authorized parties (Customs) access to the cargo and notifies the NaviTag owner whenever the container has been entered. Should an unauthorized party enter the container by disconnecting the sensor seal or activating the light sensor, the NaviTag owner is notified immediately of the security breach and the shipper or government agency has the opportunity to inspect the cargo to establish if an action is necessary.
4.2 Market Segmentation
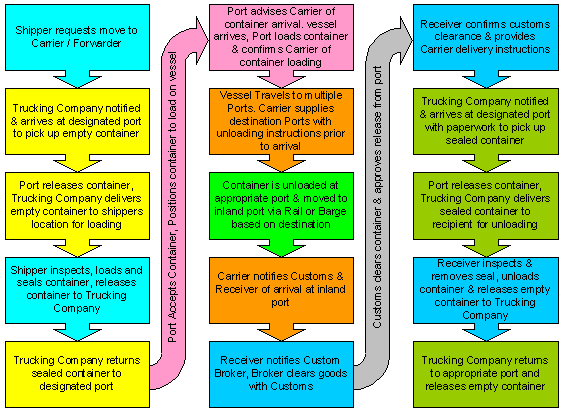
While the advent of containerization provided a simplified method of shipping goods internationally, the complexity of multimodal transport still requires a coordinated process of communication between the various service providers involved. Containerization allows goods to be transported from origin to destination in a single medium but requires the participation of as many as 10 different service providers to complete this task as outlined below.

| Market Analysis | |||||||
| Year 1 | Year 2 | Year 3 | Year 4 | Year 5 | |||
| Potential Customers | Growth | CAGR | |||||
| Shippers | 45% | 400,000 | 580,000 | 841,000 | 1,219,450 | 1,768,203 | 45.00% |
| Government Agencies | 50% | 40 | 60 | 90 | 135 | 203 | 50.09% |
| Other | 0% | 0 | 0 | 0 | 0 | 0 | 0.00% |
| Total | 45.00% | 400,040 | 580,060 | 841,090 | 1,219,585 | 1,768,406 | 45.00% |
4.2.1 The Container Shipping Market
In 1950, shipping goods via container was introduced as an alternative to general loose cargo handling (referred to as break-bulk shipping). Since then, container shipping has become the preferred way to ship merchandise internationally, displacing break-bulk shipping in all but the largest of cargo2.
- It allows the cargo to move from in-land point of origin in one continent to in-land point of destination in another continent, without the need to handle the cargo itself – the sealed container seamlessly moves between multiple modes of transportation (“intermodal” shipment), from the back of a truck’s chassis, onto a specially built container ship, and back again on top of a truck, rail, or barge, as the case may be.
- Container shipping utilizes standard size containers. This standardization of capacity carrying units has introduced efficiencies into the management of shipping, warehousing and general distribution.
- Container shipping provided greater security from theft of cargoes and improved protection from breakage by avoiding the manual handling that took place during break-bulk shipments.
Today, almost all finished and semi-finished goods are shipped internationally within containers, including: chemicals, food products, wood/paper products, metals, minerals, plastics, machinery and various manufactured products, textile, vehicles, medical equipment, etc.
We estimate the size of the container shipping market at $120 billion ($80 billion in port-to-port revenues alone3).
The annual unit growth of the number of containers shipped averaged 8% in the 1990’s with 10% in 1999, 12.5% in 2000, 4.3% in 2001, and is forecast to increase by 5.6% in 2002. In the next decade, container terminals around the world are set to experience rapid growth, with global container handling throughput expected to reach between 300 million and 342 million TEUs in 2005 and between 407 million and 525 million TEUs in 2010.
Ocean carriers are currently taking delivery of new vessel orders that were placed during the strong growth years prior to 2001, increasing the container vessel fleet by 12.3% in 2001 and 14.5% in 2002. This additional capacity is creating pressure on rate levels and a significant reduction in revenues is expected to continue through 2002. On the positive side, this increase in capacity is positioning the ocean carriers to be prepared for the increase in volumes that have been forecast.
The dramatic growth in the container shipping industry is attributed to the improved efficiencies and lower cost of transport; opening borders and allowing manufacturers around the world to be competitive in foreign markets.
The container shipping industry grew from a single company in the 1950’s to a very fragmented industry of over 500 companies operating in excess of 2,500 vessels today. As the number of carriers increased, the frequency of sailings and speed of the vessels improved, providing manufacturers with the ability to offer their products around the world with shorter delivery times and lower transportation cost. This changed the nature of the market from dealing with a competitor around the corner to having to compete with a manufacturer on another continent.
In the U.S. alone, there are over 25,000 individual companies exporting container loads of cargo and over 32,000 importers based on the 2000 Journal of Commerce Piers report. This information is compiled from the export declaration forms submitted by exporters and from the import duty data collected by U.S. Customs and only takes into account cargo importing/exporting from U.S. ports.
The substantial volume of U.S. cargo transiting through Canadian ports is not included in these figures. There are no reports available to identify the total numbers of global shippers today but the number of individual companies around the world engaged in international container shipping has grown to the hundreds of thousands. The market is forecast to increase approximately 100% over the next 10 years due to increased global demand. The projected number of shippers will increase proportionally.
[2] Source: Mercer Management Consulting study submitted on behalf of the carriers to the House Judiciary Committee 3/22/00.
[3] Sources: L H. Clarkson & Company Ltd., Drewry Shipping Consultants Ltd.
4.3 Target Market Segment Strategy
Our choice of target markets is based on comprehensive experience within the transportation industry coupled with an in-depth understanding of the customer’s needs.
We have taken a unique approach to providing the visibility and security information that cargo owners and government agencies are seeking, but have yet to find an acceptable solution.
By capitalizing on newly developed technology and the requirements for security improvements, we have structured the timing of this venture to address the heightened demand.
Cargo Visibility
As shippers strive to improve their customer service and maintain correct inventory level, they demand greater “visibility” into the status and location of their shipments. Unfortunately, the benefits gained by container shipping unearthed a different problem – lack of information standardization.
Informational “silos” existed – each party would know how to talk and exchange information with a few of the members, but not to all ten service providers. Additionally, shippers typically selected different service providers depending on terms of the shipment, further complicating matters.
To get to this information, the shipper must undertake a massive data integration project with each service provider, or outsource the entire effort to a supply chain visibility company. Each party’s messaging standard must be converted to a common format before the shipper can utilize this data.
Once completed, the next problem arises. All the data generated from each of the service providers is, by it nature, historical. Where a container is located is not part of the data. The information provided today is based on the last event deemed worthy of notation by the service provider.
The quality of this information can vary widely based on the sophistication and integration of the systems utilized by the service providers as well as the quality and dedication of the individuals entering the data. All but a few service providers rely on some sort of manual data entry/validation by field personnel, and are susceptible to human error. The market is seeking a single source solution to provide accurate and timely information regarding the location of their shipments.
Cargo Security
While cargo location information is improving, cargo security data is practically non-existent. The shipper places a plastic or soft metal seal on a container and records the number on their documentation. Upon receipt, the receiver confirms that the seal is still intact and the container has not been opened.
Typically the first notice of a security breach is upon delivery, at which point it may be too late to take necessary actions to avoid inventory issues or establish where the invasion occurred. Containerization has significantly reduced incidents of theft over break-bulk shipping but with the increase in volume of international trade, this is still a common occurrence.
The U.S. Government is also seeking improvements in the security of cargo imported through U.S. ports. With only 2% of the 600,000 containers entering the U.S. weekly being inspected, there is a substantial threat that dangerous materials or weapons of mass destruction could be imported via a container, potentially bringing commerce to a standstill.
There are numerous U.S. Government agencies are becoming involved in the security initiatives and funds have been allocated to invest in new technologies.
4.3.1 Market Needs
The market has expressed the need to have more control in the transportation of their cargo through better information. This has manifested itself in the form of greater visibility and timely event notice so the appropriate corrective or scheduled actions can be implemented, to ensure an efficient supply chain. The areas that have been identified as lacking are:
- The need for accurate and timely visibility information instead of the existing event-based historical data.
- The requirement for improvement in the quality of data received through the current manual entry system.
- Confidence in the source of the information.
- The ability to apply a single visibility solution across all service providers involved in the end-to-end transport without expensive integration or outsourcing.
- The ability to receive visibility data in a consistent format across multiple service providers.
- Timely notification of a security breach to allow immediate inspection and the necessary corrective action.
Strategy and Implementation Summary
We have clearly defined the target market and have differentiated ourselves by offering a unique solution to our customers information needs. Our sales and marketing strategy will be a combination of targeted mass marketing techniques as well as a focused direct sales team approach. Reasonable sales targets have been established with an implementation plan designed to ensure the goals set forth below are achieved.
5.1 Marketing Strategy
NaviTag Technologies will pursue an aggressive sales and marketing plan to achieve market penetration and meet the profitability goals outlined in the key financials section. The marketing plan execution is market specific.
- Shippers – we will engage in a mass marketing and advertising campaign to develop market penetration and brand recognition. A combination of direct mail and targeted media advertising will be utilized to reach the broadest market possible. Search engine optimization techniques will be initiated to increase our visibility on the Internet and drive traffic to us. Direct sales will be reserved for the largest U.S. shippers based on an extensive network of contacts.
- Government Agencies – the agencies seeking improved security tools will be solicited through direct contacts and personal meetings. Contacts have been established within the D.O.T., U.S. Customs, and the U.S.C.G.
Shippers
Due to the large volume and geographic scope of the shipper market, we will engage in a mass marketing and advertising campaign to develop brand recognition and market penetration.
This product and service can be communicated effectively in direct mail and print ads to reach the broadest market possible.
Since there is familiarity with the technology and concept, direct mailings utilizing a targeted industry database from X will be a cost effective means of introducing NaviTag to the market. X is a direct marketer databases listing 50,000 U.S. importing and exporting companies including detail on their industry sector and annual container volumes. Such databases provide for a more focused marketing campaign as well as promotions to targeted customer groups.
Print media advertising will be employed sparingly in industry publications like Xxx, Yyy & Zzz for the U.S. market and 1 & 2 for the European market to reach those not listed in Xxx.
Press releases targeted to specific sectors of the industry will be utilized to announce recent developments in technology and customer acquisition as a cost effective means of exposure to the target market.
Direct sales will be used for the largest U.S. shippers through a personal network of contacts developed by Mr. Magown over a twenty-year career in shipping.
Our marketing campaign will include utilizing search engine optimization techniques to increase our visibility on the Internet and drive traffic to us. Our current website is a promotional description of our services and will encourage potential customers to contact us directly or through the site email.
Industry trade shows draw large numbers of qualified customers that are seeking the latest technological advances to improve their supply chain or reduce transportation cost. We will target six to eight trade shows annually to increase brand awareness and solicit direct sales.
Government Agencies
The government agencies will be solicited directly by the sales staff and personal meetings will be scheduled. Onsite presentations and demonstrations will be performed, and in turn will help establish personal relationships.
These relationships will allow NaviTag Technologies to network contacts throughout the U.S. Government to capitalize on the individual needs of the numerous agencies that have security concerns. Our contacts to date have been met with enthusiasm for this type of solution and resulted in requests for prototypes to perform field testing.
5.2 Sales Strategy
We will be offering a unique solution that will be introduced to the market through targeted advertising, direct mail, website optimization and direct sales.
The direct sales force will consist of three industry-seasoned sales people lead by Mr. Magown. Traffic from mass marketing will be serviced by the sales admin located in Boston.
Mr. Magown will manage the government agency and large shipper markets through personal sales calls. This market is a long term, repetitive business where relationships are a key component to success.
Sales will be targeted to U.S. companies in the early stages as this market alone exceeds 500,000 shippers. Plans to expand into the European and Asia markets are scheduled for 2004 and beyond.
5.2.1 Sales Forecast
The table below outlines the sales forecast and cost of goods sold. The forecast is based on reasonable sales projections within this very large market.
The exponential growth of the access charge revenues is based on the cumulative volume of the NaviTag units sold. For every unit sold, NaviTag Technologies charges a monthly fee to access the data that remains in effect for as long as the unit is in service.


| Sales Forecast | |||||
| Year 1 | Year 2 | Year 3 | Year 4 | Year 5 | |
| Unit Sales | |||||
| NaviTag Units | 1,000 | 5,800 | 10,500 | 12,000 | 12,000 |
| Access Charges | 2,600 | 44,800 | 145,500 | 285,600 | 429,600 |
| Total Unit Sales | 3,600 | 50,600 | 156,000 | 297,600 | 441,600 |
| Unit Prices | Year 1 | Year 2 | Year 3 | Year 4 | Year 5 |
| NaviTag Units | $395.00 | $395.00 | $395.00 | $395.00 | $395.00 |
| Access Charges | $39.99 | $39.99 | $39.99 | $39.99 | $39.99 |
| Sales | |||||
| NaviTag Units | $395,000 | $2,291,000 | $4,147,500 | $4,740,000 | $4,740,000 |
| Access Charges | $103,974 | $1,791,552 | $5,818,545 | $11,421,144 | $17,179,704 |
| Total Sales | $498,974 | $4,082,552 | $9,966,045 | $16,161,144 | $21,919,704 |
| Direct Unit Costs | Year 1 | Year 2 | Year 3 | Year 4 | Year 5 |
| NaviTag Units | $296.25 | $296.25 | $296.25 | $296.25 | $296.25 |
| Access Charges | $22.20 | $22.20 | $22.20 | $22.20 | $22.20 |
| Direct Cost of Sales | |||||
| NaviTag Units | $296,250 | $1,718,250 | $3,110,625 | $3,555,000 | $3,555,000 |
| Access Charges | $57,720 | $994,560 | $3,230,100 | $6,340,320 | $9,537,120 |
| Subtotal Direct Cost of Sales | $353,970 | $2,712,810 | $6,340,725 | $9,895,320 | $13,092,120 |
5.3 Milestones
The following table lists important program milestones, with dates and managers in charge, and budgets for each. The milestone schedule indicates our emphasis on planning for implementation.

| Milestones | |||||
| Milestone | Start Date | End Date | Budget | Manager | Department |
| Establish Boston Office | 6/30/2002 | 7/30/2002 | $24,000 | Magown | Sales/Marketing |
| Establish New York Office | 6/30/2002 | 7/30/2002 | $28,000 | Galley | Production |
| Purchase/Install Workstations | 7/30/2002 | 8/30/2002 | $28,000 | Galley | Production |
| Contract Outsourced Dev Group | 7/15/2002 | 7/30/2002 | $397,000 | Galley | Production |
| Establish Production Facility | 7/30/2002 | 8/30/2002 | $97,000 | Galley | Production |
| Established Outsourced Services | 6/30/2002 | 7/30/2002 | $25,000 | Magown | Sales/Marketing |
| Hire New York Staff (2 dev) | 7/30/2002 | 8/30/2002 | $35,000 | Galley | Production |
| Contract Manufacturing Facility | 7/30/2002 | 8/30/2002 | $0 | Magown | Sales/Marketing |
| Develop Sales Collateral | 7/30/2002 | 8/30/2002 | $15,000 | Magown | Sales/Marketing |
| Hire Sales Admin | 8/30/2002 | 9/15/2002 | $0 | Magown | Sales/Marketing |
| Hire Production Admin | 9/15/2002 | 9/30/2002 | $0 | Galley | Production |
| Establish Pilot Programs | 9/30/2002 | 12/30/2002 | $0 | Magown | Sales/Marketing |
| Hire VP Sales | 11/1/2002 | 11/15/2002 | $0 | Magown | Sales/Marketing |
| Trade Show | 11/1/2002 | 11/15/2002 | $10,000 | Magown | Sales/Marketing |
| Direct Mail Campaign Begins | 11/1/2002 | 11/15/2002 | $25,000 | Magown | Sales/Marketing |
| Start Advertising Campaign | 12/1/2002 | 12/15/2002 | $25,000 | Magown | Sales/Marketing |
| Sell First 100 Units | 1/1/2003 | 1/31/2003 | $0 | Magown | Sales |
| Hire Finance and Distribution | 1/1/2003 | 1/15/2003 | $0 | Magown | Sales/Marketing |
| Hire Customer Service | 1/1/2003 | 1/15/2003 | $0 | Galley | Production |
| Sign First Security Contract | 1/1/2003 | 1/5/2003 | $0 | Magown | Sales |
| Sales of 300 Units/Mo | 5/1/2003 | 5/30/2003 | $0 | Magown | Sales |
| Meet Revenue Target | 5/30/2003 | 5/30/2003 | $0 | Magown | Sales |
| Totals | $709,000 | ||||
Management Summary
NaviTag Technologies management is comprised of experienced entrepreneurs and business professionals from the transportation and technology management industries. Our management team possesses a breadth of functional experience in container shipping, product development, the marketing of emerging products/technologies, strategic partnering, professional services and corporate finance.
Mr. Magown and Mr. Galley will share the senior management responsibilities with Mr. Magown directing the sales/marketing, finance, and distribution efforts and Mr. Galley directing the development, operations, and production. The organizational structure and personnel plan reflect our intentions to maintain an organization that is customer oriented and technologically proficient, while efficiently managing cost controls and productivity.
6.1 Organizational Structure
The organization is structured into two groups with sales/marketing, finance, and distribution being located in the Boston office and development, operation, and production being located in the New York office.
6.2 Management Team
Jim Galley
Mr. Galley is a seasoned technology professional with over 15 years of experience in management, operations, application and product development in technology environments.
As CTO and founding member of GoCargo.com, Mr. Galley brought the company from a business plan concept to processing transactions online in six weeks.
As executive director at PC Magazine Labs, Mr. Galley created the industry standard reference for benchmarking personal computer technology, successfully branding the results and generating mass acceptance from major marketing and technical communities – IBM, Intel, Dell, HP to name a few.
Mr. Galley also has Fortune 50 financial experience as a technical officer, and has run a data center operation.
Bob Magown
Mr. Magown has spent twenty years serving in senior management positions with transportation-related companies focusing on sales, strategic growth and operational support.
Mr. Magown was an original member of the Internet start-up GoCargo.com and held the position of vice president of sales. Mr. Magown initiated and negotiated the sale of the GoCargo.com software and IP to BridgePoint, a division of CSX Transportation and provided consulting services.
For 17 years prior to joining GoCargo.com he built a successful career with the ocean carrier CAST (CP Ships), where he fulfilled a variety of senior sales and marketing positions including regional director east coast. At CAST, he held positions at the World Headquarters in Bermuda, North American Headquarters in Montreal, as well as regional offices in New Jersey and Boston.
From 1978 to 1982, Mr. Magown was director of regional sales of Atlantic Richfield Company (ARCO). Mr. Magown holds a BS degree in business management from Bryant College.
6.3 Personnel Plan
The Personnel Plan reflects the staffing levels required to create the electronic tag, central database, and establish the customer base needed to achieve the revenues projected and reach profitability.
We have projected a staff of XX employees by January 2003 and recognize the need to increase the sales/marketing department in 2005. The new sales/marketing positions have not been included in this plan.
| Personnel Plan | |||||
| Year 1 | Year 2 | Year 3 | Year 4 | Year 5 | |
| Bob Magown – President | $120,000 | $120,000 | $120,000 | $126,000 | $132,300 |
| Jim Galley – CTO | $120,000 | $120,000 | $120,000 | $126,000 | $132,300 |
| VP Sales | $54,000 | $75,600 | $79,380 | $83,349 | $87,516 |
| Division 1 | $116,000 | $148,800 | $156,240 | $164,052 | $172,255 |
| Division 2 | $69,665 | $131,600 | $137,490 | $144,364 | $151,583 |
| Total People | 10 | 10 | 10 | 10 | 10 |
| Total Payroll | $479,665 | $596,000 | $613,110 | $643,765 | $675,954 |
Financial Plan
Our financial plan is based on raising substantial seed capital by way of private equity to create the electronic tag, develop the central database, and establish the customer base.
We will achieve profitability in just over two years and due to the nature of the exponential growth of access charges, we will realize a respectable net profit on sales by year three.
[Confidential and proprietary information has, in some text and tables, been omitted or disguised in this sample plan.]
7.1 Important Assumptions
The table below presents the assumptions used in the financial calculations of this business plan.
| General Assumptions | |||||
| Year 1 | Year 2 | Year 3 | Year 4 | Year 5 | |
| Plan Month | 1 | 2 | 3 | 4 | 5 |
| Current Interest Rate | 7.00% | 7.00% | 7.00% | 7.00% | 7.00% |
| Long-term Interest Rate | 8.00% | 8.00% | 8.00% | 8.00% | 8.00% |
| Tax Rate | 0.00% | 0.00% | 0.00% | 0.00% | 0.00% |
| Other | 0 | 0 | 0 | 0 | 0 |
7.2 Break-even Analysis
NaviTag Technologies revenues are generated from NaviTag unit sales (a one time expense) and access charges (a monthly recurring fee). Given this, the break-even formula must be adjusted to reflect both one time and recurring revenue activities. Using the sales forecast as a guide, and based on estimates made for fixed cost, average revenue per NaviTag unit and access charges, variable cost for unit manufacturing and service fees, the break-even volume was established to be 700 units per month with a subscription base of 6,800. We anticipate achieving break even at month 24 as detailed in the graph below.

Table: Break-even Analysis
|
Break-even Analysis: |
|
| Monthly NaviTag Units Break-even |
700 |
| Monthly Access Charges Break-even |
6,800 |
| Monthly Sales Break-even |
$480,432 |
| Assumptions: |
|
| Average Per NaviTag Unit Revenue |
$395.00 |
| Average Per NaviTag Unit Cost |
$296.25 |
| Average Per Access Charge Revenue |
$29.99 |
| Average Per Access Charge Cost |
$12.20 |
| Estimated Monthly Fixed Cost |
$150,000.00 |
7.3 Projected Profit and Loss
Based on the realistic sales projections and efficient cost control measures in place, NaviTag Technologies will achieve profitability in just over two years. Company profits in subsequent years will increase to the first million in 2005, and a five-fold increase in 2007 due largely to the exponential growth of the access charges. Gross margins reveal dramatic growth, again because of the growth in revenues from access charges.
[Confidential and proprietary information has, in some text and tables, been omitted or disguised in this sample plan.]


| Pro Forma Profit and Loss | |||||
| Year 1 | Year 2 | Year 3 | Year 4 | Year 5 | |
| Sales | $498,974 | $4,082,552 | $9,966,045 | $16,161,144 | $21,919,704 |
| Direct Cost of Sales | $353,970 | $2,712,810 | $6,340,725 | $9,895,320 | $13,092,120 |
| Other Production Expenses | $0 | $0 | $0 | $0 | $0 |
| Total Cost of Sales | $353,970 | $2,712,810 | $6,340,725 | $9,895,320 | $13,092,120 |
| Gross Margin | $145,004 | $1,369,742 | $3,625,320 | $6,265,824 | $8,827,584 |
| Gross Margin % | 29.06% | 33.55% | 36.38% | 38.77% | 40.27% |
| Expenses | |||||
| Payroll | $479,665 | $596,000 | $613,110 | $643,765 | $675,954 |
| Sales Collateral | $45,000 | $30,000 | $30,000 | $30,000 | $30,000 |
| Depreciation | $0 | $0 | $0 | $0 | $0 |
| Payroll Taxes | $0 | $0 | $0 | $0 | $0 |
| Direct Mail | $60,000 | $30,000 | $30,000 | $30,000 | $30,000 |
| Stationery | $1,000 | $2,000 | $2,000 | $2,000 | $2,000 |
| Travel | $60,000 | $60,000 | $60,000 | $60,000 | $60,000 |
| Trade Shows | $30,000 | $30,000 | $30,000 | $30,000 | $30,000 |
| Advertising | $80,000 | $70,000 | $70,000 | $80,000 | $80,000 |
| New York – Rent | $48,750 | $45,000 | $45,000 | $45,000 | $45,000 |
| New York – Telephone System | $5,500 | $1,000 | $1,000 | $1,000 | $1,000 |
| New York – Telephone Charges | $3,550 | $4,800 | $4,800 | $4,800 | $4,800 |
| New York – Utilities | $2,000 | $2,000 | $2,000 | $2,000 | $2,000 |
| New York – Furniture | $7,500 | $1,000 | $1,000 | $1,000 | $1,000 |
| New York – Office Equipment/Networking | $13,000 | $1,000 | $1,000 | $1,000 | $1,000 |
| New York – Internet Access | $2,000 | $2,000 | $2,000 | $2,000 | $2,000 |
| New York – Misc./Office Supplies | $2,000 | $2,000 | $2,000 | $2,000 | $2,000 |
| Outsourced Development – Discovery | $85,000 | $0 | $0 | $0 | $0 |
| Outsourced Development – Inception | $53,000 | $0 | $0 | $0 | $0 |
| Outsourced Development – Elaboration | $69,000 | $0 | $0 | $0 | $0 |
| Outsourced Development – Construction | $370,000 | $0 | $0 | $0 | $0 |
| Outsourced Development – Production | $43,000 | $0 | $0 | $0 | $0 |
| Outsourced Services – Accounting | $25,000 | $25,000 | $25,000 | $25,000 | $25,000 |
| Outsourced Services – Legal | $35,000 | $30,000 | $30,000 | $30,000 | $30,000 |
| Laptop Computers | $13,000 | $5,000 | $5,000 | $15,000 | $5,000 |
| Desktop Computers | $7,000 | $2,000 | $2,000 | $10,000 | $2,000 |
| Development/Staging | $30,000 | $4,000 | $4,000 | $8,000 | $4,000 |
| Software Licenses/Tools | $10,000 | $1,000 | $1,000 | $2,000 | $2,000 |
| Production Hosting | $68,500 | $84,000 | $84,000 | $108,000 | $108,000 |
| Maintenance/Support | $15,000 | $15,000 | $15,000 | $15,000 | $15,000 |
| Monitoring Services | $6,750 | $10,000 | $10,000 | $10,000 | $10,000 |
| Boston – Rent | $27,080 | $25,000 | $25,000 | $25,000 | $25,000 |
| Boston – Telephone System | $4,000 | $500 | $500 | $500 | $500 |
| Boston – Telephone Charges | $3,000 | $3,000 | $3,000 | $3,000 | $3,000 |
| Boston – Utilities | $2,000 | $2,000 | $2,000 | $2,000 | $2,000 |
| Boston – Furniture | $5,000 | $1,000 | $1,000 | $1,000 | $1,000 |
| Boston – Office Equipment/Networking | $6,000 | $1,000 | $1,000 | $1,000 | $1,000 |
| Boston – Internet Access | $1,000 | $1,000 | $1,000 | $1,000 | $1,000 |
| Boston – Misc./Office Supplies | $2,000 | $2,000 | $2,000 | $2,000 | $2,000 |
| Other | $0 | $0 | $0 | $0 | $0 |
| Total Operating Expenses | $1,720,295 | $1,088,300 | $1,105,410 | $1,193,065 | $1,203,254 |
| Profit Before Interest and Taxes | ($1,575,291) | $281,442 | $2,519,910 | $5,072,759 | $7,624,330 |
| EBITDA | ($1,575,291) | $281,442 | $2,519,910 | $5,072,759 | $7,624,330 |
| Interest Expense | $0 | $0 | $0 | $0 | $0 |
| Taxes Incurred | $0 | $0 | $0 | $0 | $0 |
| Net Profit | ($1,575,291) | $281,442 | $2,519,910 | $5,072,759 | $7,624,330 |
| Net Profit/Sales | -315.71% | 6.89% | 25.28% | 31.39% | 34.78% |
7.4 Projected Cash Flow
Cash flow is projected to decline for the first two years of operation based on the reasonable assumption of 45-day credit collections. NaviTag Technologies has calculated its financial plan so that it will have enough cash from investors and debt to survive until a positive cash flow is realized in 2005.

| Pro Forma Cash Flow | |||
| Year 1 | Year 2 | Year 3 | |
| Cash Received | |||
| Cash from Operations | |||
| Cash Sales | $0 | $0 | $0 |
| Subtotal Cash from Operations | $290,554 | $2,585,701 | $7,508,526 |
| Additional Cash Received | |||
| Sales Tax, VAT, HST/GST Received | $0 | $0 | $0 |
| New Current Borrowing | $0 | $0 | $0 |
| New Other Liabilities (interest-free) | $0 | $0 | $0 |
| New Long-term Liabilities | $0 | $0 | $0 |
| Sales of Other Current Assets | $0 | $0 | $0 |
| Sales of Long-term Assets | $0 | $0 | $0 |
| New Investment Received | $0 | $0 | $0 |
| Subtotal Cash Received | $290,554 | $2,585,701 | $7,508,526 |
| Expenditures | Year 1 | Year 2 | Year 3 |
| Expenditures from Operations | |||
| Cash Spending | $479,665 | $596,000 | $613,110 |
| Bill Payments | $1,386,014 | $3,018,545 | $6,385,748 |
| Subtotal Spent on Operations | $1,865,679 | $3,614,545 | $6,998,858 |
| Additional Cash Spent | |||
| Sales Tax, VAT, HST/GST Paid Out | $0 | $0 | $0 |
| Principal Repayment of Current Borrowing | $0 | $0 | $0 |
| Other Liabilities Principal Repayment | $0 | $0 | $0 |
| Long-term Liabilities Principal Repayment | $0 | $0 | $0 |
| Purchase Other Current Assets | $0 | $0 | $0 |
| Purchase Long-term Assets | $0 | $0 | $0 |
| Dividends | $0 | $0 | $0 |
| Subtotal Cash Spent | $1,865,679 | $3,614,545 | $6,998,858 |
| Net Cash Flow | ($1,575,126) | ($1,028,844) | $509,668 |
| Cash Balance | $1,401,874 | $373,031 | $882,699 |
7.5 Projected Balance Sheet
The table below presents the balance sheet for NaviTag Technologies. This table reflects a positive cash position throughout the period of this financial plan and dramatic growth in net worth in 2007.
| Pro Forma Balance Sheet | |||||
| Year 1 | Year 2 | Year 3 | Year 4 | Year 5 | |
| Assets | |||||
| Current Assets | |||||
| Cash | $1,401,874 | $373,031 | $882,699 | $3,813,048 | $9,423,457 |
| Accounts Receivable | $208,420 | $1,705,271 | $4,162,790 | $6,750,465 | $9,155,800 |
| Other Current Assets | $0 | $0 | $0 | $0 | $0 |
| Total Current Assets | $1,610,295 | $2,078,302 | $5,045,489 | $10,563,513 | $18,579,257 |
| Long-term Assets | |||||
| Long-term Assets | $0 | $0 | $0 | $0 | $0 |
| Accumulated Depreciation | $0 | $0 | $0 | $0 | $0 |
| Total Long-term Assets | $0 | $0 | $0 | $0 | $0 |
| Total Assets | $1,610,295 | $2,078,302 | $5,045,489 | $10,563,513 | $18,579,257 |
| Liabilities and Capital | Year 1 | Year 2 | Year 3 | Year 4 | Year 5 |
| Current Liabilities | |||||
| Accounts Payable | $208,586 | $395,151 | $842,428 | $1,287,693 | $1,679,107 |
| Current Borrowing | $0 | $0 | $0 | $0 | $0 |
| Other Current Liabilities | $0 | $0 | $0 | $0 | $0 |
| Subtotal Current Liabilities | $208,586 | $395,151 | $842,428 | $1,287,693 | $1,679,107 |
| Long-term Liabilities | $0 | $0 | $0 | $0 | $0 |
| Total Liabilities | $208,586 | $395,151 | $842,428 | $1,287,693 | $1,679,107 |
| Paid-in Capital | $3,010,000 | $3,010,000 | $3,010,000 | $3,010,000 | $3,010,000 |
| Retained Earnings | ($33,000) | ($1,608,291) | ($1,326,849) | $1,193,061 | $6,265,820 |
| Earnings | ($1,575,291) | $281,442 | $2,519,910 | $5,072,759 | $7,624,330 |
| Total Capital | $1,401,709 | $1,683,151 | $4,203,061 | $9,275,820 | $16,900,150 |
| Total Liabilities and Capital | $1,610,295 | $2,078,302 | $5,045,489 | $10,563,513 | $18,579,257 |
| Net Worth | $1,401,709 | $1,683,151 | $4,203,061 | $9,275,820 | $16,900,150 |
7.6 Business Ratios
The table below presents common business ratios as a reference. Since the business of “cargo tracking” does not fall underneath any predefined Industry dataset, for Industry Profile comparisons in this table we chose, NAICS 488390 Other Support Activities for Water Transportation (SIC 3731), as the closest option.
| Ratio Analysis | ||||||
| Year 1 | Year 2 | Year 3 | Year 4 | Year 5 | Industry Profile | |
| Sales Growth | 0.00% | 718.19% | 144.11% | 62.16% | 35.63% | 9.27% |
| Percent of Total Assets | ||||||
| Accounts Receivable | 12.94% | 82.05% | 82.51% | 63.90% | 49.28% | 18.72% |
| Other Current Assets | 0.00% | 0.00% | 0.00% | 0.00% | 0.00% | 36.72% |
| Total Current Assets | 100.00% | 100.00% | 100.00% | 100.00% | 100.00% | 92.30% |
| Long-term Assets | 0.00% | 0.00% | 0.00% | 0.00% | 0.00% | 7.70% |
| Total Assets | 100.00% | 100.00% | 100.00% | 100.00% | 100.00% | 100.00% |
| Current Liabilities | 12.95% | 19.01% | 16.70% | 12.19% | 9.04% | 42.56% |
| Long-term Liabilities | 0.00% | 0.00% | 0.00% | 0.00% | 0.00% | 17.03% |
| Total Liabilities | 12.95% | 19.01% | 16.70% | 12.19% | 9.04% | 59.59% |
| Net Worth | 87.05% | 80.99% | 83.30% | 87.81% | 90.96% | 40.41% |
| Percent of Sales | ||||||
| Sales | 100.00% | 100.00% | 100.00% | 100.00% | 100.00% | 100.00% |
| Gross Margin | 29.06% | 33.55% | 36.38% | 38.77% | 40.27% | 18.16% |
| Selling, General & Administrative Expenses | 383.83% | 32.27% | 13.48% | 16.39% | 15.08% | 4.91% |
| Advertising Expenses | 9.02% | 0.73% | 0.30% | 0.19% | 0.14% | 0.41% |
| Profit Before Interest and Taxes | -315.71% | 6.89% | 25.28% | 31.39% | 34.78% | 3.42% |
| Main Ratios | ||||||
| Current | 7.72 | 5.26 | 5.99 | 8.20 | 11.06 | 1.71 |
| Quick | 7.72 | 5.26 | 5.99 | 8.20 | 11.06 | 0.68 |
| Total Debt to Total Assets | 12.95% | 19.01% | 16.70% | 12.19% | 9.04% | 67.28% |
| Pre-tax Return on Net Worth | -112.38% | 16.72% | 59.95% | 54.69% | 45.11% | 6.22% |
| Pre-tax Return on Assets | -97.83% | 13.54% | 49.94% | 48.02% | 41.04% | 19.01% |
| Additional Ratios | Year 1 | Year 2 | Year 3 | Year 4 | Year 5 | |
| Net Profit Margin | -315.71% | 6.89% | 25.28% | 31.39% | 34.78% | n.a |
| Return on Equity | -112.38% | 16.72% | 59.95% | 54.69% | 45.11% | n.a |
| Activity Ratios | ||||||
| Accounts Receivable Turnover | 2.39 | 2.39 | 2.39 | 2.39 | 2.39 | n.a |
| Collection Days | 40 | 86 | 107 | 123 | 132 | n.a |
| Accounts Payable Turnover | 7.64 | 8.11 | 8.11 | 8.11 | 8.11 | n.a |
| Payment Days | 40 | 34 | 33 | 37 | 40 | n.a |
| Total Asset Turnover | 0.31 | 1.96 | 1.98 | 1.53 | 1.18 | n.a |
| Debt Ratios | ||||||
| Debt to Net Worth | 0.15 | 0.23 | 0.20 | 0.14 | 0.10 | n.a |
| Current Liab. to Liab. | 1.00 | 1.00 | 1.00 | 1.00 | 1.00 | n.a |
| Liquidity Ratios | ||||||
| Net Working Capital | $1,401,709 | $1,683,151 | $4,203,061 | $9,275,820 | $16,900,150 | n.a |
| Interest Coverage | 0.00 | 0.00 | 0.00 | 0.00 | 0.00 | n.a |
| Additional Ratios | ||||||
| Assets to Sales | 3.23 | 0.51 | 0.51 | 0.65 | 0.85 | n.a |
| Current Debt/Total Assets | 13% | 19% | 17% | 12% | 9% | n.a |
| Acid Test | 6.72 | 0.94 | 1.05 | 2.96 | 5.61 | n.a |
| Sales/Net Worth | 0.36 | 2.43 | 2.37 | 1.74 | 1.30 | n.a |
| Dividend Payout | 0.00 | 0.00 | 0.00 | 0.00 | 0.00 | n.a |
7.7 Long-term Plan
We anticipate that the percentage of ocean cargo deemed time sensitive, of high value, or of a hazardous nature will continue to increase faster than the average increase in cargo in general. Further, we believe that the concerns over ship, port, and national security risks will balloon. With only 2% of the imports being inspected today, the concern of dangerous cargoes compromising the port operations has created opportunities for a cargo tracking/security alert device such as ours.
Our cargo tracking efforts will be focused on those shippers with high value, time sensitive, or hazardous cargo. Our security focus will be directed to those government agencies seeking to improve security of the U.S. ports involved in processing the 600,000 containers entering weekly.
We will achieve profitability in just over two years and due to the nature of the exponential growth of access charges, we will realize a respectable net profit on sales by year three. The success of our implementation and sales efforts will have a strong affect on our year three through year five operations and fiscal position. If slower than planned, we risk a negative cash balance, even though we might have already reached profitability. Additional rounds of investment may be needed, or acquiring long-term business loans.
Ironically, a faster than planned industry acceptance of NaviTag could push us into a period of risky increased expansion, which would also drain our operating capital reserve, again requiring us to seek another round of investment or loans.
Alternatively, early-on proof-of-concept and feasibility analyses, could spark high demand from governmental agencies and/or the military establishment could lead to substantial financial and operational grants, subsidies, contracts, etc.
Appendix
| Sales Forecast | |||||||||||||
| Month 1 | Month 2 | Month 3 | Month 4 | Month 5 | Month 6 | Month 7 | Month 8 | Month 9 | Month 10 | Month 11 | Month 12 | ||
| Unit Sales | |||||||||||||
| NaviTag Units | 0% | 0 | 0 | 0 | 0 | 0 | 0 | 0 | 100 | 200 | 200 | 200 | 300 |
| Access Charges | 0% | 0 | 0 | 0 | 0 | 0 | 0 | 0 | 100 | 300 | 500 | 700 | 1,000 |
| Total Unit Sales | 0 | 0 | 0 | 0 | 0 | 0 | 0 | 200 | 500 | 700 | 900 | 1,300 | |
| Unit Prices | Month 1 | Month 2 | Month 3 | Month 4 | Month 5 | Month 6 | Month 7 | Month 8 | Month 9 | Month 10 | Month 11 | Month 12 | |
| NaviTag Units | $0.00 | $0.00 | $0.00 | $0.00 | $0.00 | $0.00 | $0.00 | $395.00 | $395.00 | $395.00 | $395.00 | $395.00 | |
| Access Charges | $0.00 | $0.00 | $0.00 | $0.00 | $0.00 | $0.00 | $0.00 | $39.99 | $39.99 | $39.99 | $39.99 | $39.99 | |
| Sales | |||||||||||||
| NaviTag Units | $0 | $0 | $0 | $0 | $0 | $0 | $0 | $39,500 | $79,000 | $79,000 | $79,000 | $118,500 | |
| Access Charges | $0 | $0 | $0 | $0 | $0 | $0 | $0 | $3,999 | $11,997 | $19,995 | $27,993 | $39,990 | |
| Total Sales | $0 | $0 | $0 | $0 | $0 | $0 | $0 | $43,499 | $90,997 | $98,995 | $106,993 | $158,490 | |
| Direct Unit Costs | Month 1 | Month 2 | Month 3 | Month 4 | Month 5 | Month 6 | Month 7 | Month 8 | Month 9 | Month 10 | Month 11 | Month 12 | |
| NaviTag Units | 0.00% | $0.00 | $0.00 | $0.00 | $0.00 | $0.00 | $0.00 | $0.00 | $296.25 | $296.25 | $296.25 | $296.25 | $296.25 |
| Access Charges | 0.00% | $0.00 | $0.00 | $0.00 | $0.00 | $0.00 | $0.00 | $0.00 | $22.20 | $22.20 | $22.20 | $22.20 | $22.20 |
| Direct Cost of Sales | |||||||||||||
| NaviTag Units | $0 | $0 | $0 | $0 | $0 | $0 | $0 | $29,625 | $59,250 | $59,250 | $59,250 | $88,875 | |
| Access Charges | $0 | $0 | $0 | $0 | $0 | $0 | $0 | $2,220 | $6,660 | $11,100 | $15,540 | $22,200 | |
| Subtotal Direct Cost of Sales | $0 | $0 | $0 | $0 | $0 | $0 | $0 | $31,845 | $65,910 | $70,350 | $74,790 | $111,075 | |
| General Assumptions | |||||||||||||
| Month 1 | Month 2 | Month 3 | Month 4 | Month 5 | Month 6 | Month 7 | Month 8 | Month 9 | Month 10 | Month 11 | Month 12 | ||
| Plan Month | 1 | 2 | 3 | 4 | 5 | 6 | 7 | 8 | 9 | 10 | 11 | 12 | |
| Current Interest Rate | 7.00% | 7.00% | 7.00% | 7.00% | 7.00% | 7.00% | 7.00% | 7.00% | 7.00% | 7.00% | 7.00% | 7.00% | |
| Long-term Interest Rate | 8.00% | 8.00% | 8.00% | 8.00% | 8.00% | 8.00% | 8.00% | 8.00% | 8.00% | 8.00% | 8.00% | 8.00% | |
| Tax Rate | 0.00% | 0.00% | 0.00% | 0.00% | 0.00% | 0.00% | 0.00% | 0.00% | 0.00% | 0.00% | 0.00% | 0.00% | |
| Other | 0 | 0 | 0 | 0 | 0 | 0 | 0 | 0 | 0 | 0 | 0 | 0 | |
| Pro Forma Profit and Loss | |||||||||||||
| Month 1 | Month 2 | Month 3 | Month 4 | Month 5 | Month 6 | Month 7 | Month 8 | Month 9 | Month 10 | Month 11 | Month 12 | ||
| Sales | $0 | $0 | $0 | $0 | $0 | $0 | $0 | $43,499 | $90,997 | $98,995 | $106,993 | $158,490 | |
| Direct Cost of Sales | $0 | $0 | $0 | $0 | $0 | $0 | $0 | $31,845 | $65,910 | $70,350 | $74,790 | $111,075 | |
| Other Production Expenses | $0 | $0 | $0 | $0 | $0 | $0 | $0 | $0 | $0 | $0 | $0 | $0 | |
| Total Cost of Sales | $0 | $0 | $0 | $0 | $0 | $0 | $0 | $31,845 | $65,910 | $70,350 | $74,790 | $111,075 | |
| Gross Margin | $0 | $0 | $0 | $0 | $0 | $0 | $0 | $11,654 | $25,087 | $28,645 | $32,203 | $47,415 | |
| Gross Margin % | 0.00% | 0.00% | 0.00% | 0.00% | 0.00% | 0.00% | 0.00% | 26.79% | 27.57% | 28.94% | 30.10% | 29.92% | |
| Expenses | |||||||||||||
| Payroll | $25,000 | $25,000 | $25,000 | $31,000 | $44,000 | $44,000 | $44,000 | $48,333 | $48,333 | $48,333 | $48,333 | $48,333 | |
| Sales Collateral | $5,000 | $5,000 | $5,000 | $5,000 | $5,000 | $5,000 | $0 | $5,000 | $0 | $5,000 | $0 | $5,000 | |
| Depreciation | $0 | $0 | $0 | $0 | $0 | $0 | $0 | $0 | $0 | $0 | $0 | $0 | |
| Payroll Taxes | 25% | $0 | $0 | $0 | $0 | $0 | $0 | $0 | $0 | $0 | $0 | $0 | $0 |
| Direct Mail | $0 | $0 | $0 | $0 | $0 | $15,000 | $0 | $15,000 | $15,000 | $0 | $15,000 | $0 | |
| Stationery | $1,000 | $0 | $0 | $0 | $0 | $0 | $0 | $0 | $0 | $0 | $0 | $0 | |
| Travel | $5,000 | $5,000 | $5,000 | $5,000 | $5,000 | $5,000 | $5,000 | $5,000 | $5,000 | $5,000 | $5,000 | $5,000 | |
| Trade Shows | $0 | $0 | $0 | $0 | $0 | $20,000 | $0 | $0 | $0 | $10,000 | $0 | $0 | |
| Advertising | $0 | $0 | $0 | $0 | $10,000 | $10,000 | $10,000 | $10,000 | $10,000 | $10,000 | $10,000 | $10,000 | |
| New York – Rent | $7,500 | $3,750 | $3,750 | $3,750 | $3,750 | $3,750 | $3,750 | $3,750 | $3,750 | $3,750 | $3,750 | $3,750 | |
| New York – Telephone System | $5,500 | $0 | $0 | $0 | $0 | $0 | $0 | $0 | $0 | $0 | $0 | $0 | |
| New York – Telephone Charges | $300 | $200 | $150 | $150 | $200 | $400 | $150 | $400 | $400 | $400 | $400 | $400 | |
| New York – Utilities | $167 | $167 | $167 | $167 | $167 | $167 | $167 | $167 | $167 | $167 | $167 | $163 | |
| New York – Furniture | $7,500 | $0 | $0 | $0 | $0 | $0 | $0 | $0 | $0 | $0 | $0 | $0 | |
| New York – Office Equipment/Networking | $13,000 | $0 | $0 | $0 | $0 | $0 | $0 | $0 | $0 | $0 | $0 | $0 | |
| New York – Internet Access | $350 | $150 | $150 | $150 | $150 | $150 | $150 | $150 | $150 | $150 | $150 | $150 | |
| New York – Misc./Office Supplies | $167 | $167 | $167 | $167 | $167 | $167 | $167 | $167 | $167 | $167 | $167 | $163 | |
| Outsourced Development – Discovery | $55,000 | $30,000 | $0 | $0 | $0 | $0 | $0 | $0 | $0 | $0 | $0 | $0 | |
| Outsourced Development – Inception | $0 | $35,000 | $18,000 | $0 | $0 | $0 | $0 | $0 | $0 | $0 | $0 | $0 | |
| Outsourced Development – Elaboration | $0 | $0 | $46,000 | $23,000 | $0 | $0 | $0 | $0 | $0 | $0 | $0 | $0 | |
| Outsourced Development – Construction | $0 | $0 | $0 | $170,000 | $170,000 | $30,000 | $0 | $0 | $0 | $0 | $0 | $0 | |
| Outsourced Development – Production | $0 | $0 | $0 | $0 | $0 | $43,000 | $0 | $0 | $0 | $0 | $0 | $0 | |
| Outsourced Services – Accounting | $2,083 | $2,083 | $2,083 | $2,083 | $2,083 | $2,083 | $2,083 | $2,083 | $2,083 | $2,083 | $2,083 | $2,087 | |
| Outsourced Services – Legal | $10,000 | $5,000 | $3,000 | $3,000 | $3,000 | $3,000 | $3,000 | $1,000 | $1,000 | $1,000 | $1,000 | $1,000 | |
| Laptop Computers | $13,000 | $0 | $0 | $0 | $0 | $0 | $0 | $0 | $0 | $0 | $0 | $0 | |
| Desktop Computers | $0 | $0 | $0 | $0 | $7,000 | $0 | $0 | $0 | $0 | $0 | $0 | $0 | |
| Development/Staging | $30,000 | $0 | $0 | $0 | $0 | $0 | $0 | $0 | $0 | $0 | $0 | $0 | |
| Software Licenses/Tools | $10,000 | $0 | $0 | $0 | $0 | $0 | $0 | $0 | $0 | $0 | $0 | $0 | |
| Production Hosting | $0 | $0 | $0 | $12,500 | $7,000 | $7,000 | $7,000 | $7,000 | $7,000 | $7,000 | $7,000 | $7,000 | |
| Maintenance/Support | $1,250 | $1,250 | $1,250 | $1,250 | $1,250 | $1,250 | $1,250 | $1,250 | $1,250 | $1,250 | $1,250 | $1,250 | |
| Monitoring Services | $0 | $0 | $0 | $750 | $750 | $750 | $750 | $750 | $750 | $750 | $750 | $750 | |
| Boston – Rent | $4,167 | $2,083 | $2,083 | $2,083 | $2,083 | $2,083 | $2,083 | $2,083 | $2,083 | $2,083 | $2,083 | $2,083 | |
| Boston – Telephone System | $4,000 | $0 | $0 | $0 | $0 | $0 | $0 | $0 | $0 | $0 | $0 | $0 | |
| Boston – Telephone Charges | $150 | $150 | $150 | $300 | $300 | $300 | $150 | $300 | $300 | $300 | $300 | $300 | |
| Boston – Utilities | $167 | $167 | $167 | $167 | $167 | $167 | $167 | $167 | $167 | $167 | $167 | $163 | |
| Boston – Furniture | $5,000 | $0 | $0 | $0 | $0 | $0 | $0 | $0 | $0 | $0 | $0 | $0 | |
| Boston – Office Equipment/Networking | $6,000 | $0 | $0 | $0 | $0 | $0 | $0 | $0 | $0 | $0 | $0 | $0 | |
| Boston – Internet Access | $120 | $80 | $80 | $80 | $80 | $80 | $80 | $80 | $80 | $80 | $80 | $80 | |
| Boston – Misc./Office Supplies | 15% | $167 | $167 | $167 | $167 | $167 | $167 | $167 | $167 | $167 | $167 | $167 | $163 |
| Other | $0 | $0 | $0 | $0 | $0 | $0 | $0 | $0 | $0 | $0 | $0 | $0 | |
| Total Operating Expenses | $211,588 | $115,414 | $112,364 | $260,764 | $262,314 | $193,514 | $80,114 | $102,847 | $97,847 | $97,847 | $97,847 | $87,835 | |
| Profit Before Interest and Taxes | ($211,588) | ($115,414) | ($112,364) | ($260,764) | ($262,314) | ($193,514) | ($80,114) | ($91,193) | ($72,760) | ($69,202) | ($65,644) | ($40,420) | |
| EBITDA | ($211,588) | ($115,414) | ($112,364) | ($260,764) | ($262,314) | ($193,514) | ($80,114) | ($91,193) | ($72,760) | ($69,202) | ($65,644) | ($40,420) | |
| Interest Expense | $0 | $0 | $0 | $0 | $0 | $0 | $0 | $0 | $0 | $0 | $0 | $0 | |
| Taxes Incurred | $0 | $0 | $0 | $0 | $0 | $0 | $0 | $0 | $0 | $0 | $0 | $0 | |
| Net Profit | ($211,588) | ($115,414) | ($112,364) | ($260,764) | ($262,314) | ($193,514) | ($80,114) | ($91,193) | ($72,760) | ($69,202) | ($65,644) | ($40,420) | |
| Net Profit/Sales | 0.00% | 0.00% | 0.00% | 0.00% | 0.00% | 0.00% | 0.00% | -209.64% | -79.96% | -69.90% | -61.35% | -25.50% | |
| Pro Forma Balance Sheet | |||||||||||||
| Month 1 | Month 2 | Month 3 | Month 4 | Month 5 | Month 6 | Month 7 | Month 8 | Month 9 | Month 10 | Month 11 | Month 12 | ||
| Assets | Starting Balances | ||||||||||||
| Current Assets | |||||||||||||
| Cash | $2,977,000 | $2,952,000 | $2,827,486 | $2,667,191 | $2,547,404 | $2,340,093 | $2,072,436 | $1,846,815 | $1,709,448 | $1,621,403 | $1,540,041 | $1,469,179 | $1,401,874 |
| Accounts Receivable | $0 | $0 | $0 | $0 | $0 | $0 | $0 | $0 | $43,499 | $111,297 | $141,460 | $153,191 | $208,420 |
| Other Current Assets | $0 | $0 | $0 | $0 | $0 | $0 | $0 | $0 | $0 | $0 | $0 | $0 | $0 |
| Total Current Assets | $2,977,000 | $2,952,000 | $2,827,486 | $2,667,191 | $2,547,404 | $2,340,093 | $2,072,436 | $1,846,815 | $1,752,947 | $1,732,700 | $1,681,502 | $1,622,370 | $1,610,295 |
| Long-term Assets | |||||||||||||
| Long-term Assets | $0 | $0 | $0 | $0 | $0 | $0 | $0 | $0 | $0 | $0 | $0 | $0 | $0 |
| Accumulated Depreciation | $0 | $0 | $0 | $0 | $0 | $0 | $0 | $0 | $0 | $0 | $0 | $0 | $0 |
| Total Long-term Assets | $0 | $0 | $0 | $0 | $0 | $0 | $0 | $0 | $0 | $0 | $0 | $0 | $0 |
| Total Assets | $2,977,000 | $2,952,000 | $2,827,486 | $2,667,191 | $2,547,404 | $2,340,093 | $2,072,436 | $1,846,815 | $1,752,947 | $1,732,700 | $1,681,502 | $1,622,370 | $1,610,295 |
| Liabilities and Capital | Month 1 | Month 2 | Month 3 | Month 4 | Month 5 | Month 6 | Month 7 | Month 8 | Month 9 | Month 10 | Month 11 | Month 12 | |
| Current Liabilities | |||||||||||||
| Accounts Payable | $0 | $186,588 | $177,488 | $129,557 | $270,534 | $325,537 | $251,394 | $105,887 | $103,212 | $155,725 | $173,729 | $180,241 | $208,586 |
| Current Borrowing | $0 | $0 | $0 | $0 | $0 | $0 | $0 | $0 | $0 | $0 | $0 | $0 | $0 |
| Other Current Liabilities | $0 | $0 | $0 | $0 | $0 | $0 | $0 | $0 | $0 | $0 | $0 | $0 | $0 |
| Subtotal Current Liabilities | $0 | $186,588 | $177,488 | $129,557 | $270,534 | $325,537 | $251,394 | $105,887 | $103,212 | $155,725 | $173,729 | $180,241 | $208,586 |
| Long-term Liabilities | $0 | $0 | $0 | $0 | $0 | $0 | $0 | $0 | $0 | $0 | $0 | $0 | $0 |
| Total Liabilities | $0 | $186,588 | $177,488 | $129,557 | $270,534 | $325,537 | $251,394 | $105,887 | $103,212 | $155,725 | $173,729 | $180,241 | $208,586 |
| Paid-in Capital | $3,010,000 | $3,010,000 | $3,010,000 | $3,010,000 | $3,010,000 | $3,010,000 | $3,010,000 | $3,010,000 | $3,010,000 | $3,010,000 | $3,010,000 | $3,010,000 | $3,010,000 |
| Retained Earnings | ($33,000) | ($33,000) | ($33,000) | ($33,000) | ($33,000) | ($33,000) | ($33,000) | ($33,000) | ($33,000) | ($33,000) | ($33,000) | ($33,000) | ($33,000) |
| Earnings | $0 | ($211,588) | ($327,002) | ($439,366) | ($700,130) | ($962,444) | ($1,155,958) | ($1,236,072) | ($1,327,265) | ($1,400,025) | ($1,469,227) | ($1,534,871) | ($1,575,291) |
| Total Capital | $2,977,000 | $2,765,412 | $2,649,998 | $2,537,634 | $2,276,870 | $2,014,556 | $1,821,042 | $1,740,928 | $1,649,735 | $1,576,975 | $1,507,773 | $1,442,129 | $1,401,709 |
| Total Liabilities and Capital | $2,977,000 | $2,952,000 | $2,827,486 | $2,667,191 | $2,547,404 | $2,340,093 | $2,072,436 | $1,846,815 | $1,752,947 | $1,732,700 | $1,681,502 | $1,622,370 | $1,610,295 |
| Net Worth | $2,977,000 | $2,765,412 | $2,649,998 | $2,537,634 | $2,276,870 | $2,014,556 | $1,821,042 | $1,740,928 | $1,649,735 | $1,576,975 | $1,507,773 | $1,442,129 | $1,401,709 |
| Personnel Plan | |||||||||||||
| Month 1 | Month 2 | Month 3 | Month 4 | Month 5 | Month 6 | Month 7 | Month 8 | Month 9 | Month 10 | Month 11 | Month 12 | ||
| Bob Magown – President | 0% | $10,000 | $10,000 | $10,000 | $10,000 | $10,000 | $10,000 | $10,000 | $10,000 | $10,000 | $10,000 | $10,000 | $10,000 |
| Jim Galley – CTO | 0% | $10,000 | $10,000 | $10,000 | $10,000 | $10,000 | $10,000 | $10,000 | $10,000 | $10,000 | $10,000 | $10,000 | $10,000 |
| VP Sales | 0% | $0 | $0 | $0 | $6,000 | $6,000 | $6,000 | $6,000 | $6,000 | $6,000 | $6,000 | $6,000 | $6,000 |
| Division 1 | 0% | $5,000 | $5,000 | $5,000 | $5,000 | $12,000 | $12,000 | $12,000 | $12,000 | $12,000 | $12,000 | $12,000 | $12,000 |
| Division 2 | 0% | $0 | $0 | $0 | $0 | $6,000 | $6,000 | $6,000 | $10,333 | $10,333 | $10,333 | $10,333 | $10,333 |
| Total People | 4 | 4 | 4 | 5 | 9 | 9 | 9 | 10 | 10 | 10 | 10 | 10 | |
| Total Payroll | $25,000 | $25,000 | $25,000 | $31,000 | $44,000 | $44,000 | $44,000 | $48,333 | $48,333 | $48,333 | $48,333 | $48,333 | |
| Pro Forma Cash Flow | |||||||||||||
| Month 1 | Month 2 | Month 3 | Month 4 | Month 5 | Month 6 | Month 7 | Month 8 | Month 9 | Month 10 | Month 11 | Month 12 | ||
| Cash Received | |||||||||||||
| Cash from Operations | |||||||||||||
| Cash Sales | $0 | $0 | $0 | $0 | $0 | $0 | $0 | $0 | $0 | $0 | $0 | $0 | |
| Subtotal Cash from Operations | $0 | $0 | $0 | $0 | $0 | $0 | $0 | $0 | $23,199 | $68,831 | $95,263 | $103,261 | |
| Additional Cash Received | |||||||||||||
| Sales Tax, VAT, HST/GST Received | 0.00% | $0 | $0 | $0 | $0 | $0 | $0 | $0 | $0 | $0 | $0 | $0 | $0 |
| New Current Borrowing | $0 | $0 | $0 | $0 | $0 | $0 | $0 | $0 | $0 | $0 | $0 | $0 | |
| New Other Liabilities (interest-free) | $0 | $0 | $0 | $0 | $0 | $0 | $0 | $0 | $0 | $0 | $0 | $0 | |
| New Long-term Liabilities | $0 | $0 | $0 | $0 | $0 | $0 | $0 | $0 | $0 | $0 | $0 | $0 | |
| Sales of Other Current Assets | $0 | $0 | $0 | $0 | $0 | $0 | $0 | $0 | $0 | $0 | $0 | $0 | |
| Sales of Long-term Assets | $0 | $0 | $0 | $0 | $0 | $0 | $0 | $0 | $0 | $0 | $0 | $0 | |
| New Investment Received | $0 | $0 | $0 | $0 | $0 | $0 | $0 | $0 | $0 | $0 | $0 | $0 | |
| Subtotal Cash Received | $0 | $0 | $0 | $0 | $0 | $0 | $0 | $0 | $23,199 | $68,831 | $95,263 | $103,261 | |
| Expenditures | Month 1 | Month 2 | Month 3 | Month 4 | Month 5 | Month 6 | Month 7 | Month 8 | Month 9 | Month 10 | Month 11 | Month 12 | |
| Expenditures from Operations | |||||||||||||
| Cash Spending | $25,000 | $25,000 | $25,000 | $31,000 | $44,000 | $44,000 | $44,000 | $48,333 | $48,333 | $48,333 | $48,333 | $48,333 | |
| Bill Payments | $0 | $99,514 | $135,295 | $88,787 | $163,311 | $223,657 | $181,621 | $89,034 | $62,911 | $101,860 | $117,792 | $122,232 | |
| Subtotal Spent on Operations | $25,000 | $124,514 | $160,295 | $119,787 | $207,311 | $267,657 | $225,621 | $137,367 | $111,244 | $150,193 | $166,125 | $170,565 | |
| Additional Cash Spent | |||||||||||||
| Sales Tax, VAT, HST/GST Paid Out | $0 | $0 | $0 | $0 | $0 | $0 | $0 | $0 | $0 | $0 | $0 | $0 | |
| Principal Repayment of Current Borrowing | $0 | $0 | $0 | $0 | $0 | $0 | $0 | $0 | $0 | $0 | $0 | $0 | |
| Other Liabilities Principal Repayment | $0 | $0 | $0 | $0 | $0 | $0 | $0 | $0 | $0 | $0 | $0 | $0 | |
| Long-term Liabilities Principal Repayment | $0 | $0 | $0 | $0 | $0 | $0 | $0 | $0 | $0 | $0 | $0 | $0 | |
| Purchase Other Current Assets | $0 | $0 | $0 | $0 | $0 | $0 | $0 | $0 | $0 | $0 | $0 | $0 | |
| Purchase Long-term Assets | $0 | $0 | $0 | $0 | $0 | $0 | $0 | $0 | $0 | $0 | $0 | $0 | |
| Dividends | $0 | $0 | $0 | $0 | $0 | $0 | $0 | $0 | $0 | $0 | $0 | $0 | |
| Subtotal Cash Spent | $25,000 | $124,514 | $160,295 | $119,787 | $207,311 | $267,657 | $225,621 | $137,367 | $111,244 | $150,193 | $166,125 | $170,565 | |
| Net Cash Flow | ($25,000) | ($124,514) | ($160,295) | ($119,787) | ($207,311) | ($267,657) | ($225,621) | ($137,367) | ($88,045) | ($81,362) | ($70,862) | ($67,304) | |
| Cash Balance | $2,952,000 | $2,827,486 | $2,667,191 | $2,547,404 | $2,340,093 | $2,072,436 | $1,846,815 | $1,709,448 | $1,621,403 | $1,540,041 | $1,469,179 | $1,401,874 | |


